DOCUMENT REFERENCE: SQ316-001-EN - SamKnowswhitepapers/SQ316-001-EN-Sam...SQ316-001-EN SamKnows...
9
SAMKNOWS QUALITY CONTROLLED DOCUMENT. SQ REV LANG STATUS OWNER DATED 316 001 EN FINAL KR 20140326 REVISION HISTORY DATED REV AUTHOR COMMENTS 20140326 001 KR Original. DOCUMENT REFERENCE: SQ316-001-EN SAMKNOWS REAL-TIME REPORTING PLATFORM SamKnows Analytics White Paper March 2014
-
Upload
truongdien -
Category
Documents
-
view
226 -
download
7
Transcript of DOCUMENT REFERENCE: SQ316-001-EN - SamKnowswhitepapers/SQ316-001-EN-Sam...SQ316-001-EN SamKnows...
SAMKNOWS QUALITY CONTROLLED DOCUMENT.
SQ REV LANG STATUS OWNER DATED
316 001 EN FINAL KR 20140326
REVISION HISTORY
DATED REV AUTHOR COMMENTS
20140326 001 KR Original.
DOCUMENT REFERENCE: SQ316-001-EN
SAMKNOWS REAL-TIME REPORTING PLATFORM SamKnows Analytics White Paper
March 2014
Copyright © SamKnows Limited 26 MARCH 2014
SQ316-001-EN SamKnows Analytics Whitepaper.docx SamKnows | 2 of 9
Contents
1 IMPORTANT NOTICE 3
2 OVERVIEW OF SAMKNOWS ANALYTICS 4
3 SAMKNOWS ANALYTICS KEY FEATURES 5 3.1 Data Processing 5 3.2 Access to SamKnows Analytics 5 3.3 Using SamKnows Analytics 5 3.4 ISP Metadata Integration 8 3.5 SamKnows Analytics for Consumers 8
Copyright © SamKnows Limited 26 MARCH 2014
SQ316-001-EN SamKnows Analytics Whitepaper.docx SamKnows | 3 of 9
1 Important Notice
IMPORTANT NOTICE
Limitation of Liability The information contained in this document is provided for general information purposes only. While care has been taken in compiling the information herein, SamKnows does not warrant or represent that this information is free from errors or omissions. To the maximum extent permitted by law, SamKnows accepts no responsibility in respect of this document and any loss or damage suffered or incurred by a person for any reason relying on the any of the information provided in this document and for acting, or failing to act, on any information contained on or referred to in this document.
Copyright The material in this document is protected by Copyright. No part of the materials in this document may be reproduced for any purpose whatsoever without the written permission of SamKnows.
Copyright © SamKnows Limited 26 MARCH 2014
SQ316-001-EN SamKnows Analytics Whitepaper.docx SamKnows | 4 of 9
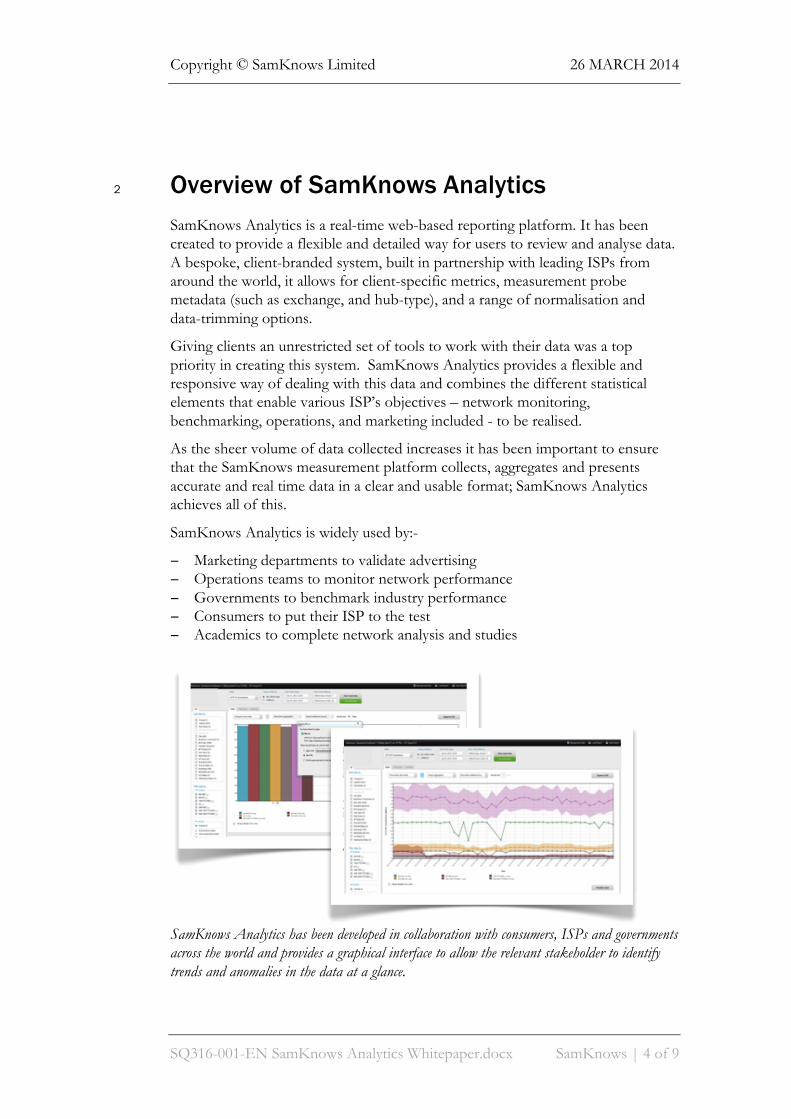
2 Overview of SamKnows Analytics SamKnows Analytics is a real-time web-based reporting platform. It has been created to provide a flexible and detailed way for users to review and analyse data. A bespoke, client-branded system, built in partnership with leading ISPs from around the world, it allows for client-specific metrics, measurement probe metadata (such as exchange, and hub-type), and a range of normalisation and data-trimming options.
Giving clients an unrestricted set of tools to work with their data was a top priority in creating this system. SamKnows Analytics provides a flexible and responsive way of dealing with this data and combines the different statistical elements that enable various ISP’s objectives – network monitoring, benchmarking, operations, and marketing included - to be realised.
As the sheer volume of data collected increases it has been important to ensure that the SamKnows measurement platform collects, aggregates and presents accurate and real time data in a clear and usable format; SamKnows Analytics achieves all of this.
SamKnows Analytics is widely used by:-
− Marketing departments to validate advertising − Operations teams to monitor network performance − Governments to benchmark industry performance − Consumers to put their ISP to the test − Academics to complete network analysis and studies
SamKnows Analytics has been developed in collaboration with consumers, ISPs and governments across the world and provides a graphical interface to allow the relevant stakeholder to identify trends and anomalies in the data at a glance.
Copyright © SamKnows Limited 26 MARCH 2014
SQ316-001-EN SamKnows Analytics Whitepaper.docx SamKnows | 5 of 9
3 SamKnows Analytics Key Features SamKnows Analytics is designed to allow you to analyse and interpret your data, in an easy to use, web interface. Our highly configurable reporting system is tailored to individual client specific requirements.
3.1 Data Processing
The raw data collected from each measurement probe is processed every 10 minutes so that results are persisted as hourly aggregations, split by metric, test node, and trimming rules. Thus, for downstream throughput tests, the results from each test client are calculated for each hour, and stored separately for each test server and for trimmed/untrimmed rules.
This intensive pre-processing allows SamKnows Analytics to respond as quickly as possible to requests for report data, and most of the charts available in SamKnows Analytics are populated from these pre-calculated hourly results. It is also possible to view a scattergraph of the underlying raw data for any period.
The available metrics directly reflect the tests being performed on your panel’s measurement probes. However, more complex/statistical derived metrics can also be developed according to your requirements, e.g. a throughput metric that incorporates latency or packet loss results. More involved short and long-term reliability metrics can also be provided, in consultation with your own statisticians.
3.2 Access to SamKnows Analytics
You will be provided with a custom URL and credentials that will allow you to log into the SamKnows Analytics web app, which is a responsive application whose layout will adapt to a wide range of devices and screen sizes.
3.3 Using SamKnows Analytics
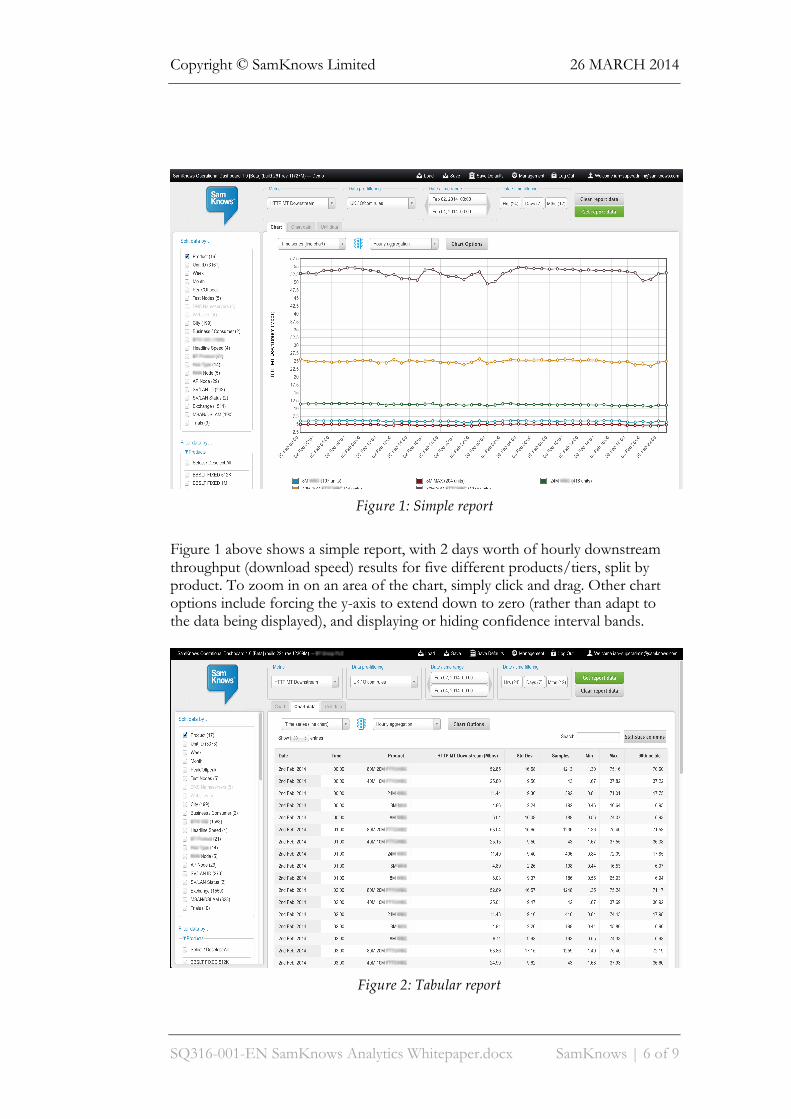
To load a set of results, three selections must be made: a chart type, date range, and metric (e.g. Downstream throughput, or UDP latency). Once these are selected, the report data can be loaded:
Copyright © SamKnows Limited 26 MARCH 2014
SQ316-001-EN SamKnows Analytics Whitepaper.docx SamKnows | 6 of 9
Figure 1: Simple report
Figure 1 above shows a simple report, with 2 days worth of hourly downstream throughput (download speed) results for five different products/tiers, split by product. To zoom in on an area of the chart, simply click and drag. Other chart options include forcing the y-axis to extend down to zero (rather than adapt to the data being displayed), and displaying or hiding confidence interval bands.
Figure 2: Tabular report
Copyright © SamKnows Limited 26 MARCH 2014
SQ316-001-EN SamKnows Analytics Whitepaper.docx SamKnows | 7 of 9
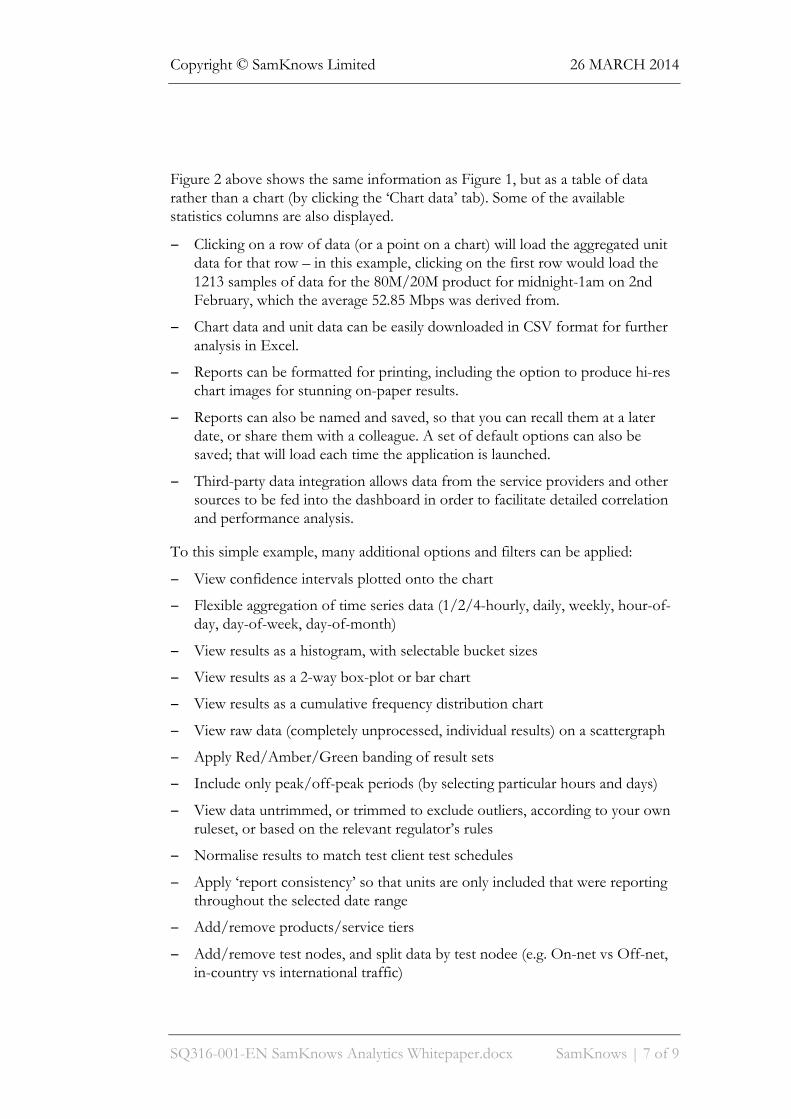
Figure 2 above shows the same information as Figure 1, but as a table of data rather than a chart (by clicking the ‘Chart data’ tab). Some of the available statistics columns are also displayed.
− Clicking on a row of data (or a point on a chart) will load the aggregated unit data for that row – in this example, clicking on the first row would load the 1213 samples of data for the 80M/20M product for midnight-1am on 2nd February, which the average 52.85 Mbps was derived from.
− Chart data and unit data can be easily downloaded in CSV format for further analysis in Excel.
− Reports can be formatted for printing, including the option to produce hi-res chart images for stunning on-paper results.
− Reports can also be named and saved, so that you can recall them at a later date, or share them with a colleague. A set of default options can also be saved; that will load each time the application is launched.
− Third-party data integration allows data from the service providers and other sources to be fed into the dashboard in order to facilitate detailed correlation and performance analysis.
To this simple example, many additional options and filters can be applied:
− View confidence intervals plotted onto the chart
− Flexible aggregation of time series data (1/2/4-hourly, daily, weekly, hour-of-day, day-of-week, day-of-month)
− View results as a histogram, with selectable bucket sizes
− View results as a 2-way box-plot or bar chart
− View results as a cumulative frequency distribution chart
− View raw data (completely unprocessed, individual results) on a scattergraph
− Apply Red/Amber/Green banding of result sets
− Include only peak/off-peak periods (by selecting particular hours and days)
− View data untrimmed, or trimmed to exclude outliers, according to your own ruleset, or based on the relevant regulator’s rules
− Normalise results to match test client test schedules
− Apply ‘report consistency’ so that units are only included that were reporting throughout the selected date range
− Add/remove products/service tiers
− Add/remove test nodes, and split data by test nodee (e.g. On-net vs Off-net, in-country vs international traffic)
Copyright © SamKnows Limited 26 MARCH 2014
SQ316-001-EN SamKnows Analytics Whitepaper.docx SamKnows | 8 of 9
− Include or exclude units according to various criteria – location, CPE type, exchange, or even measurement probe IDs; and/or split results by these same criteria
− Weight ADSL results by distance from exchange, or split results by line length
3.4 ISP Metadata Integration
One of the features of SamKnows Analytics is the ability to import in an automated metadata feed from the ISP. The information contained in the metadata feed will vary from ISP to ISP but can include anything from Region, Service Tier information, DOCSIS version to CPE type. As long as the corresponding data can be provided for each measurement probe then we can present this information in SamKnows Analytics.
Using a customised metadata feed, ISPs can keep allocations of measurement probes to service tiers right up-to-date. Furthermore, it allows ISPs to split or filter data by any desired data point based on information that SamKnows would not normally collect.
The process for metadata integation is simple as it involves sharing of data using CSV file format through secure FTP.
3.5 SamKnows Analytics for Consumers
Consumers who particpate in SamKnows studies are able to monitor their own individual performance data [in real-time] by logging in securely to a simplified version of SamKnows Analytics.
This version of SamKnows Analytics is optimised for viewing data from a single measurement probe. A set of common metrics and time periods are available for selection, with the added option of splitting results by test nodes (if appropriate).
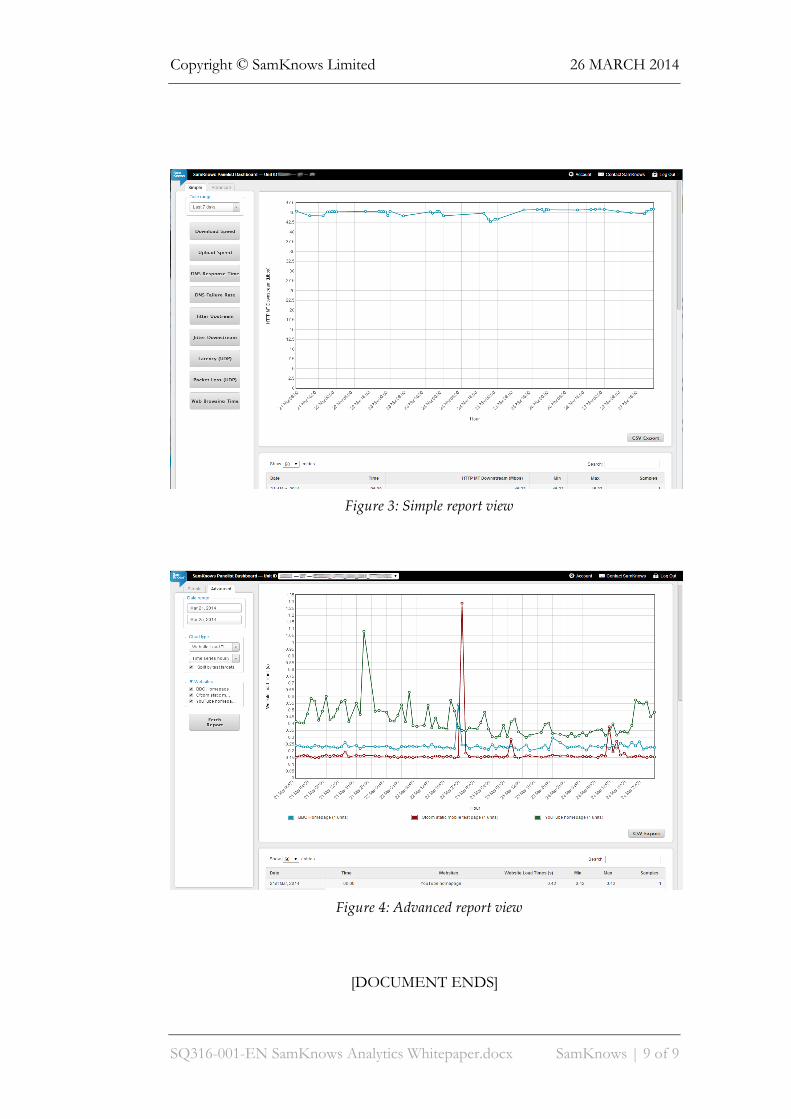
Figure 3 below shows the simple report view from SamKnows Analytics for Consumers. In this view the end-user can simply choose pre-set date ranges (i.e last 2 hours, last 7 days etc.) and then select the relevant metric that they would like to see data from (i.e download speed, web browsing etc) to generate a time-series chart.
There is also an advanced report view (Figure 4) which provides additional options for generating reports. In this view the end-user can choose custom date ranges, select different chart types and data agggeration points and also split performance by test targets.
Copyright © SamKnows Limited 26 MARCH 2014
SQ316-001-EN SamKnows Analytics Whitepaper.docx SamKnows | 9 of 9
Figure 3: Simple report view
Figure 4: Advanced report view
[DOCUMENT ENDS]