Magnets. Magnetic poles Magnets have two poles with opposite polarity (north and south poles).

Document 2 Asset Category – Wood Poles, Narrow Based Steel Towers and Conductors SPN
Asset Stewardship Report 2014
Robert Lafferty

Asset Stewardship Report 2014 Working draft v0.1 SPN Wood Poles and Conductors Version 2 All of the cost numbers displayed in this document are before the application of on-going efficiencies and real price effects.
UK Power Networks (Operations) Limited. Registered in England and Wales. Registered No. 3870728. Registered Office: Newington House, 237 Southwark Bridge Road, London, SE1 6NP 2
Approved By Richard Wakelen / Barry Hatton
Approved Date 04/03/2014
Document History
Version Date Details Originator Revision Class
Section Update
1.0 19/02/2014 Original Submission
N/A N/A N/A
1.1 19/02/2014 NAMP cost updates to Table 1, 2 and associated paragraphs.
Tables Updated
Appendix 5 updated
Robert Lafferty
Minor Section 1 and 2, Appendix 5
1.2 21/02/2014 Added Appendix 7 - Named Schemes
Added Appendix 9 – Benchmarking
Added Appendix 10 - Changes
Robert Lafferty
Minor Appendix 7, 9,10
1.3 21/02/2014 Updated Expenditure and Volume Charts
Robert Lafferty
Minor Section 7
1.4 22/02/2014 Updated HI profiles and HI/CI Tables
Robert Lafferty
Minor Section 4.7, Section 8 and Appendix 2
1.5 24/02/2014 Updated Appendix 5, HV Conductor Volumes, Expenditure, LV Pole Expenditure, 33kv Conductor Expenditure
Robert Lafferty
Minor Appendix 5
1.6 24/02/2014 Updated Appendix 10 to explain CV5 movements
Robert Lafferty
Minor Appendix 10
1.7 25/02/2014 Prepared to Gold Standard
Robert Lafferty
Minor Document Checked against Gold checklist,

Asset Stewardship Report 2014 Working draft v0.1 SPN Wood Poles and Conductors Version 2 All of the cost numbers displayed in this document are before the application of on-going efficiencies and real price effects.
UK Power Networks (Operations) Limited. Registered in England and Wales. Registered No. 3870728. Registered Office: Newington House, 237 Southwark Bridge Road, London, SE1 6NP 3
Version Date Details Originator Revision Class
Section Update
Appendices re-ordered and updated.
1.8 25/02/2014 Appendix 8 added and aligned to the document.
Robert Lafferty
Minor Appendix 8.
1.9 25/02/2014 Removed Risk Tables and risk reference Exec Summary
Robert Lafferty
Minor Section 8 and Exec Summary
1.10 25/02/14 Added RIGS and NAMP References to be in alignment and Year for document
Preface added
MEAV, populations updated to 240214
Robert Lafferty
Minor References added to all sections
Preface added
Exec Summary
1.11 26/02/14 Updated as per Gold Check List v10, Table and Figure numbers checked and added to Appendices
Robert Lafferty
Minor Appendix 8 header,
1.12 03/03/14 Appendix 11 moved to section 3 and commentary added. Appendix 12 removed, duplication of table 11.
Added paragraph to bottom of section 1.3
Robert Lafferty
Minor Appendix 11, 12 removed.
Added to section 1.3
2.0 05/03/14 Approved by Barry Hatton
Robert Lafferty
Minor Page 14 and Page 55

Asset Stewardship Report 2014 Working draft v0.1 SPN Wood Poles and Conductors Version 2 All of the cost numbers displayed in this document are before the application of on-going efficiencies and real price effects.
UK Power Networks (Operations) Limited. Registered in England and Wales. Registered No. 3870728. Registered Office: Newington House, 237 Southwark Bridge Road, London, SE1 6NP 4
Preface
UK Power Networks uses Asset Stewardship Reports (‘ASR’) to describe the optimum asset
management strategy and proposals for different groups of assets. This optimised asset
management strategy and plan details the levels of investment required and the targeted
interventions and outputs needed. Separate ASRs define the most efficient maintenance and
inspection regimes needed and all documents detail the new forms of innovation which are
required to maximise value, service and safety for all customers and staff throughout the
ED1 regulatory period. Outline proposals for the ED2 period are also included.
Each DNO has a suite of approximately 20 ASR’s. Although asset policy and strategy is
similar for the same assets in each DNO the detailed plans and investment proposals are
different for each DNO. There are also local issues which must be taken into account.
Accordingly each DNO has its own complete set of ASR documents.
A complete list of titles of the ASR’s, a summary of capex and opex investment is included in
‘Document 20: Asset Stewardship Report: Capex/Opex Overview’. This document also
defines how costs and outputs in the various ASR’s build up UK Power Networks ‘NAMP’
(Network Asset Management Plan) and how the NAMP aligns with Ofgem’s ED1 RIGs
tables and row numbers.
Where ‘HI’ or asset ‘Health Index’ information is included please note predicted ED1 profiles
are before any benefits from ‘Load driven investment.’
This ASR has also been updated to reflect the feedback from Ofgem on our July 2013 ED1
business plan submission. Accordingly to aid the reader three additional appendices have
been added. They are;
1. Appendix 8 - Output NAMP/ED1 Business Plan Data Table
reconciliation: This section explains the ‘line of sight’ between the
UKPN Network Asset Management Plan (NAMP) and the replacement
volumes contained in the Ofgem RIGS tables. The NAMP is the UKPN ten
year rolling asset management investment plan. It is used as the
overarching plan to drive both direct and indirect Capex and Opex
interventions volumes and costs. The volume and cost data used in this
ASR to explain our investment plan is taken from the UK Power Networks
NAMP. Appendix 8 explains how the NAMP outputs are translated into the
Ofgem RIGS tables. The translation of costs from the NAMP to the ED1
RIGS tables is more complex and it is not possible to explain this in a
simple table. This is because the costs of a project in the ‘NAMP’ are
allocated to a wide variety of tables and rows in the RIGS. For example
the costs of a typical switchgear replacement project will be allocated to a
range of different Ofgem ED1 RIGs tables and rows such as CV3
(Replacement), CV5 (Refurbishment) CV6 (Civil works) and CV105
(Operational IT Technology and Telecoms). However guidance notes of
the destination RIGs tables for NAMP expenditure are included in the
table in the Section 1.1 of the Executive Summary of each ASR.

Asset Stewardship Report 2014 Working draft v0.1 SPN Wood Poles and Conductors Version 2 All of the cost numbers displayed in this document are before the application of on-going efficiencies and real price effects.
UK Power Networks (Operations) Limited. Registered in England and Wales. Registered No. 3870728. Registered Office: Newington House, 237 Southwark Bridge Road, London, SE1 6NP 5
2. Appendix 9 – Efficiency benchmarking with other DNO’s: This helps
to inform readers how UK Power Networks is positioned from a
benchmarking position with other DNO’s. It aims to show why we believe
our investment plans in terms of both volume and money is the right
answer when compared to the industry, and why we believe our asset
inspection and intervention proposals are efficient and effective and in the
best interest for our customers.
3. Appendix 10 – Material changes since the July 2013 ED1
submission: This section shows the differences between the ASR
submitted in July 2013 and the ASR submitted for the re-submission in
March 2014. It aims to inform the reader the changes made to volumes
and costs as a result of reviewing the plans submitted in July 2013.
Generally the number of changes made is very small, as we believe the
original plan submitted in July 2013 meets the requirements of a well
justified plan. However there are areas where we have identified further
efficiencies and improvements or recent events have driven us to amend
our plans to protect customer safety and service.
We have sought to avoid duplication in other ED1 documents, such as ‘Scheme Justification
Papers’, by referring the reader to key issues of asset policy and asset engineering which
are included in the appropriate ASR documents.

Asset Stewardship Report 2014 Working draft v0.1 SPN Wood Poles and Conductors Version 2 All of the cost numbers displayed in this document are before the application of on-going efficiencies and real price effects.
UK Power Networks (Operations) Limited. Registered in England and Wales. Registered No. 3870728. Registered Office: Newington House, 237 Southwark Bridge Road, London, SE1 6NP 6
Contents
1.0 Executive Summary SPN Wood Poles and Conductors ............................................. 8
1.1 Scope ..................................................................................................................... 8
1.2 ED1 Proposals ...................................................................................................... 10
1.3 Innovation ............................................................................................................. 11
1.4 Risks and Opportunities ........................................................................................ 12
2.0 Description of Wood Poles and Conductors ............................................................. 13
2.1 132kV Wood Poles and Conductors ..................................................................... 13
2.2 33kV Wood Poles and Conductors ....................................................................... 13
2.3 LV Wood Poles and Conductors ........................................................................... 15
3.0 Investment Drivers ................................................................................................... 17
3.1 Overview ............................................................................................................... 17
3.2 Condition and Defects ........................................................................................... 17
3.3 Condition Measurements ...................................................................................... 30
4.0 Asset Assessment .................................................................................................... 33
4.1 Asset Health ......................................................................................................... 33
4.2 Asset Criticality & Network Risk ............................................................................ 33
4.3 Data Validation ..................................................................................................... 34
4.4 Data Verification ................................................................................................... 34
4.5 Data Completeness .............................................................................................. 34
4.6 DPCR5 HI Profiles – With and Without Investment ............................................... 35
5.0 Intervention Policies ................................................................................................. 37
5.1 Interventions: Description of Intervention Options ................................................. 37
5.2 Proposed expenditure by interventions ................................................................. 40
5.3 Policies: Selecting Preferred Interventions ............................................................ 42
6.0 Innovation ................................................................................................................. 43
6.1 Boron Rods ........................................................................................................... 43
6.2 Micro-Bore Pressure Sensing Drill (Resistograph) ................................................ 43
6.3 Pole Saver ............................................................................................................ 44
6.4 Pole Brace ............................................................................................................ 45
6.5 Composite Poles ................................................................................................... 46
6.6 Woodpecker Mitigation ......................................................................................... 47
7.0 ED1 Expenditure Requirements for Wood Poles and Conductors ........................... 49
7.1 Method .................................................................................................................. 49
Asset Stewardship Report 2014 Working draft v0.1 SPN Wood Poles and Conductors Version 2 All of the cost numbers displayed in this document are before the application of on-going efficiencies and real price effects.
UK Power Networks (Operations) Limited. Registered in England and Wales. Registered No. 3870728. Registered Office: Newington House, 237 Southwark Bridge Road, London, SE1 6NP 7
7.2 Constructing the Plan ............................................................................................ 49
7.4 Asset Volumes and Expenditure [RIGs References] ............................................. 51
7.5 Commentary ......................................................................................................... 64
7.6 Sensitivity Analysis And Plan Validation ................................................................ 66
7.7 Model Testing ....................................................................................................... 70
7.8 Network Risk ......................................................................................................... 71
8.0 Deliverability ............................................................................................................. 74
Appendix 1 – Age Profiles ............................................................................................... 75
Appendix 2 – HI and Criticality Profiles ............................................................................ 80
Appendix 3 – Fault Data .................................................................................................. 83
Appendix 4 – WLC and other Case Studies ..................................................................... 85
Appendix 5 – NLRE Expenditure Plan ............................................................................. 86
Appendix 6 – Sensitivity Analysis .................................................................................... 91
Appendix 7 – Named Schemes ....................................................................................... 97
Appendix 8 – Output NAMP/ED1 Business Plan Data Table reconciliation ...................... 98
Appendix 9 – Efficiency benchmarking with other DNO’s................................................. 99
Appendix 10 – Material changes since the July 2013 ED1 submission ......................... 100

Asset Stewardship Report 2014 Working draft v0.1 SPN Wood Poles and Conductors Version 2 All of the cost numbers displayed in this document are before the application of on-going efficiencies and real price effects.
UK Power Networks (Operations) Limited. Registered in England and Wales. Registered No. 3870728. Registered Office: Newington House, 237 Southwark Bridge Road, London, SE1 6NP 8
1.0 Executive Summary SPN Wood Poles and Conductors
1.1 Scope This document details UK Power Networks’ non-load replacement
expenditure (NLRE) replacement and refurbishment proposals for wood poles
and conductors at all voltages for the ED1 period. Indicative proposals for the
ED2 period are also included.
There are 107 poles on the 132kV network with an estimated Modern
Equivalent Asset Value (MEAV) of £0.3m, and 10km of conductor with an
estimated MEAV of £0.6m.
There are 11,751 poles on the 33kV network with an estimated MEAV of
£28.4m, and 1,146km of conductor with an estimated MEAV of £37m. The
proposed investment is £7m for the ED1 period, which equates to 10.7% of
the MEAV for this asset category.
There are 68,022 poles on the HV network with an estimated MEAV of
£118.1m and 5,553km of conductor with an estimated MEAV of £140.3m. The
proposed investment is £40.5m for the ED1 period, which equates to 15.6%
of the MEAV for this asset category.
There are 126,175 poles on the LV network with an estimated MEAV of
£179.1, and 4,543km of conductor with an estimated MEAV of £61.6m. The
proposed investment is £23.4m for the ED1 period, which equates to 10.1%
of the MEAV for this asset category.
Table 1 shows there is no investment for 132kV wood poles planned in ED1
due to the age and condition of the circuit.

Asset Stewardship Report 2014 Working draft v0.1 SPN Wood Poles and Conductors Version 2 All of the cost numbers displayed in this document are before the application of on-going efficiencies and real price effects.
UK Power Networks (Operations) Limited. Registered in England and Wales. Registered No. 3870728. Registered Office: Newington House, 237 Southwark Bridge Road, London, SE1 6NP 9
INVESTMENT TYPE ED1
COSTS NAMP LINE
RIGS REFERENCE
(TABLE CV3)
Wood pole replacement
LV wood pole replacement
£12.6m 1.44.01
Additions
CV3 Row 8 – LV poles
Removals
CV3 Row 136 – LV poles
HV wood pole replacement
£7.6m 1.19.12
Additions
CV3 Row 27 – HV
(6.6/11kV) poles
Removals
CV3 Row 155 – HV
(6.6/11kV) poles
33kV wood pole replacement
£2.1m 1.09.04
Additions CV3 Row 53 – 33kV Pole Removals CV3 Row 181– 33kV Pole
Conductor replacement
LV overhead line Renewal
£10.8m 1.41.03
Additions
CV3 Row 6 – LV main
(OHL) conductor
Removals
CV3 Row 134 – LV main
(OHL) conductor
HV conductor replacement
£32.9m 1.32.19 1.32.13
Additions
CV3 Row 23, 24 – HV
OHL conductor
Removals
CV3 Row 151 - HV
OHL conductor
33kV overhead Renewal
£4.5m 1.09.01
Additions
CV3 Row 53 – 33kV pole
CV3 Row 52 – 33kV OHL
conductor
Removals
CV3 Row 181 – 33kV
pole
CV3 Row 180 – 33kV
OHL conductor
33kV Overhead Refurbishment
£0.4m 1.09.05 CV5 Row 28 – Refurbishment

Asset Stewardship Report 2014 Working draft v0.1 SPN Wood Poles and Conductors Version 2 All of the cost numbers displayed in this document are before the application of on-going efficiencies and real price effects.
UK Power Networks (Operations) Limited. Registered in England and Wales. Registered No. 3870728. Registered Office: Newington House, 237 Southwark Bridge Road, London, SE1 6NP 10
33kv Pole
Table 1 – Investment Summary (Source: 21st February 2014 ED1 RIGs)Investment Strategy
The investment strategy for wood poles at all voltages is that the number of
HI4 and HI5 assets will be the same at the end of ED1 as it was at the start.
Any new pole installed on the network should have a ‘pole saver’ fitted that
will extend the life of a wooden pole strategy. This is referred to in section 6.3.
Further intervention, such as boron rods, that can delay or defer a
replacement on suitable poles will be installed throughout ED1. This strategy
is referred to in section 6.1.
The investment plan has been developed in accordance with this strategy and
by making use of the Asset Risk and Prioritisation (ARP) model to assess all
asset data available in order to determine asset health, criticality and
consequence of failure. This has enabled the construction of a well-justified
plan based on detailed knowledge of individual assets rather than age or
statistical modelling approaches.
1.2 ED1 Proposals The proposed investment level for the replacement of LV, HV and 33kV wood
poles and conductors in SPN is £71m, and the annual expenditure profile is
broken down in Table 2. The trend shows an increase in the replacement
volumes between DPCR5 and ED1 period for 33kV and LV poles as detailed
in the section 7.4. This increase is driven from the output of the ARP model
and is based on the condition.

Asset Stewardship Report 2014 Working draft v0.1 SPN Wood Poles and Conductors Version 2 All of the cost numbers displayed in this document are before the application of on-going efficiencies and real price effects.
UK Power Networks (Operations) Limited. Registered in England and Wales. Registered No. 3870728. Registered Office: Newington House, 237 Southwark Bridge Road, London, SE1 6NP 11
SP
N
Wo
od
po
le
Sub-category
NAMP line(s)
NAMP description
2015/ 2016/ 2017/ 2018/ 2019/ 2020/ 2021/ 2022/
2016 2017 2018 2019 2020 2021 2022 2023
LV wood pole
1.44.01
Replace LV wood poles
(‘D’ condition)
1,577 1,577 1,577 1,577 1,577 1,577 1,577 1,577
1.41.03
LV overhead line
refurbishment (including
ABC)
1,356 1,356 1,356 1,356 1,356 1,356 1,356 1,356
HV wood pole
1.19.12 Replace HV wood poles
946 946 946 946 946 946 946 946
1.32.17 HV OHL Renewal
1201 1201 1201 1201 1201 1201 1201 1201
HV OHL conduct
or 1.32.19
Replace 0.025 11KV conductor
2,915 2,915 2,915 2,915 2,915 2,915 2,915 2,915
33kV wood pole
1.09.04 Replace 33kV wood poles
230 230 230 230 230 230 230 230
1.09.01 33kV wood pole OHL Renewal
760 1692 154 360 291 466 817 193
1.09.05
33kV Wood Pole
Refurbishment
54 54 54 54 54 54 54 54
Total (£k) 9,039 9,971 8,433 8,639 8,570 8,745 9,096 8,472
Table 2 – ED1 Investment Proposals (Source – 19
th February 2014 NAMP Table J Less Indirect)
Appendix 9 benchmarks our ED1 proposals with reference to other DNOs
July 2013 submissions. It shows that for Wood Poles and Conductors we are
proposing to replace 7% of our assets while other DNOs were seeking
funding to replace 11% of these assets on average. This demonstrates the
effectiveness of our asset risk management systems and the value for money
of our proposals.
1.3 Innovation Innovative ideas planned for introduction are:
Pole saver – A moisture barrier wrap installed at ground level on new
poles.
Micro-bore pressure sensing drill (resistograph) – A technique that can
accurately record the internal condition of a wood pole, with the ability to
undertake a below-ground condition assessment of the wood without the
need to excavate.
Pole support system – Installed adjacent to a pole where minor rot or
damage has been found to a certain part of the pole at base level.
Asset Stewardship Report 2014 Working draft v0.1 SPN Wood Poles and Conductors Version 2 All of the cost numbers displayed in this document are before the application of on-going efficiencies and real price effects.
UK Power Networks (Operations) Limited. Registered in England and Wales. Registered No. 3870728. Registered Office: Newington House, 237 Southwark Bridge Road, London, SE1 6NP 12
Boron rods – Solid rods of high-strength boron 173 that protect wooden
poles that are constantly or occasionally damp.
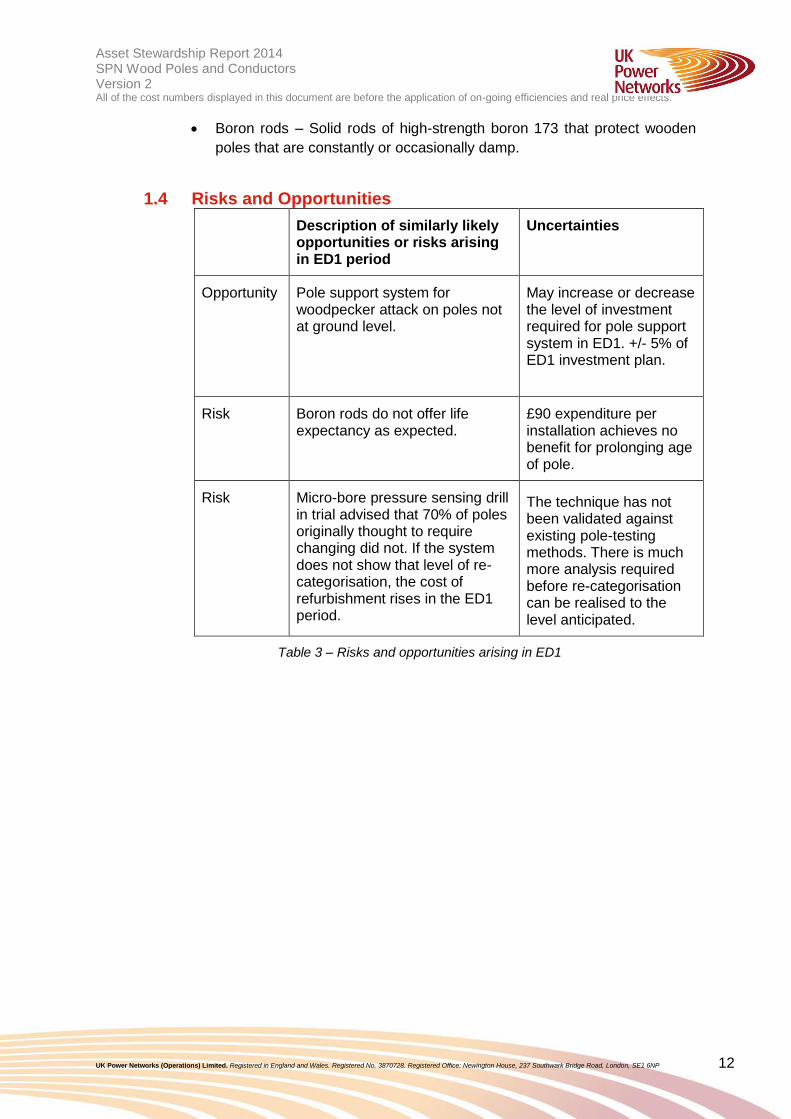
1.4 Risks and Opportunities
Description of similarly likely opportunities or risks arising in ED1 period
Uncertainties
Opportunity Pole support system for woodpecker attack on poles not at ground level.
May increase or decrease the level of investment required for pole support system in ED1. +/- 5% of ED1 investment plan.
Risk Boron rods do not offer life expectancy as expected.
£90 expenditure per installation achieves no benefit for prolonging age of pole.
Risk Micro-bore pressure sensing drill in trial advised that 70% of poles originally thought to require changing did not. If the system does not show that level of re-categorisation, the cost of refurbishment rises in the ED1 period.
The technique has not been validated against existing pole-testing methods. There is much more analysis required before re-categorisation can be realised to the level anticipated.
Table 3 – Risks and opportunities arising in ED1
Asset Stewardship Report 2014 Working draft v0.1 SPN Wood Poles and Conductors Version 2 All of the cost numbers displayed in this document are before the application of on-going efficiencies and real price effects.
UK Power Networks (Operations) Limited. Registered in England and Wales. Registered No. 3870728. Registered Office: Newington House, 237 Southwark Bridge Road, London, SE1 6NP 13
2.0 Description of Wood Poles and Conductors
2.1 132kV Wood Poles and Conductors There are 107 poles on the 132kV network and approximately 10km of
conductor. The OHL conductor on this circuit is 175mm² Aluminium
Conductor Steel Reinforced (ACSR).
There is one 132kV circuit, which was constructed in 1984 (SPN Hub 2
Sussex Coast). The conductor age is the same as the poles.
There are no plans to refurbish or replace this OHL, because the circuit is in
good condition. Any defects found at inspection will be dealt with as part of
the defect management project.
Ref RIGs code: Asset additions and disposal volumes are included in CV3
table, rows 88, 89 and 215, 216.
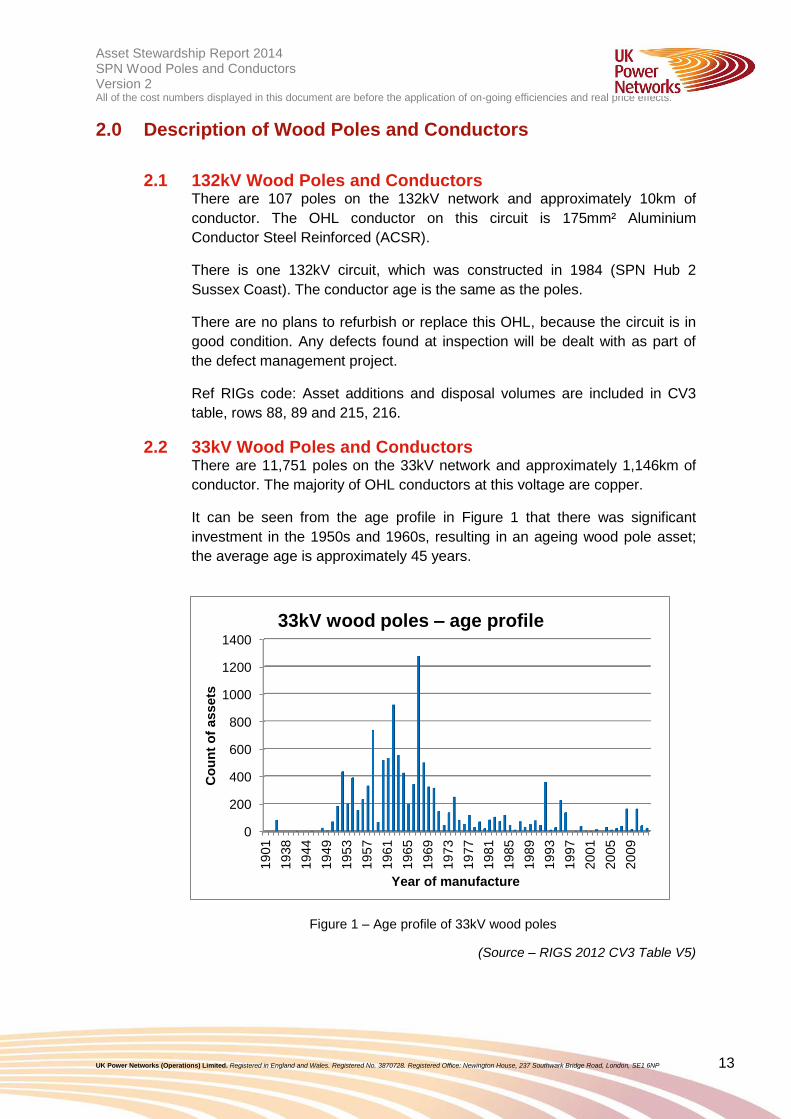
2.2 33kV Wood Poles and Conductors There are 11,751 poles on the 33kV network and approximately 1,146km of
conductor. The majority of OHL conductors at this voltage are copper.
It can be seen from the age profile in Figure 1 that there was significant
investment in the 1950s and 1960s, resulting in an ageing wood pole asset;
the average age is approximately 45 years.
Figure 1 – Age profile of 33kV wood poles
(Source – RIGS 2012 CV3 Table V5)
0
200
400
600
800
1000
1200
1400
19
01
19
38
19
44
19
49
19
53
19
57
19
61
19
65
19
69
19
73
19
77
19
81
19
85
19
89
19
93
19
97
20
01
20
05
20
09
Co
un
t o
f assets
Year of manufacture
33kV wood poles – age profile

Asset Stewardship Report 2014 Working draft v0.1 SPN Wood Poles and Conductors Version 2 All of the cost numbers displayed in this document are before the application of on-going efficiencies and real price effects.
UK Power Networks (Operations) Limited. Registered in England and Wales. Registered No. 3870728. Registered Office: Newington House, 237 Southwark Bridge Road, London, SE1 6NP 14
Figure 2 – Age profile of 33kV conductors
(Source – RIGS 2012 CV3 Table V5)
Ref NAMP Line: 1.09.01, 1.09.04 and 1.09.05
Ref RIGs code: Asset additions and disposal volumes are included in CV3
table, rows 52, 53, 166,167 and CV5 table, row 28.HV Wood Poles and
Conductors
There are 68,022 poles on the HV network and approximately 5,553km of
conductor. The majority of OHL conductors at this voltage are copper.
It can be seen from the age profile in Figure 3 that there was significant
investment in the 1950s and 1960s and then again in the late 1970s, resulting
in an ageing wood pole asset; the average age is approximately 42 years.
Figure 3 – Age profile for HV wood poles
0
200
400
600
800
1000
1200
1400
19
01
19
38
19
44
19
49
19
53
19
57
19
61
19
65
19
69
19
73
19
77
19
81
19
85
19
89
19
93
19
97
20
01
20
05
20
09
Co
un
t o
f assets
Year of manufacture
33kV conductor – age profile
0500
100015002000250030003500400045005000
19
00
19
12
19
23
19
31
19
35
19
39
19
43
19
47
19
51
19
55
19
59
19
63
19
67
19
71
19
75
19
79
19
83
19
87
19
91
19
95
19
99
20
03
20
07
20
11
Co
un
t o
f assets
Year of manufacture
HV wood poles – age profile

Asset Stewardship Report 2014 Working draft v0.1 SPN Wood Poles and Conductors Version 2 All of the cost numbers displayed in this document are before the application of on-going efficiencies and real price effects.
UK Power Networks (Operations) Limited. Registered in England and Wales. Registered No. 3870728. Registered Office: Newington House, 237 Southwark Bridge Road, London, SE1 6NP 15
(Source – RIGS 2012 CV3 Table V5)
Figure 4 – Age profile for HV conductors
(Source – RIGS 2012 CV3 Table V5)
Ref NAMP Lines: 1.19.12, 1.32.13 and 1.32.19
Ref RIGs code: Asset additions and disposal volumes are included in CV3
table, rows 23, 24, 27 and 151, 155
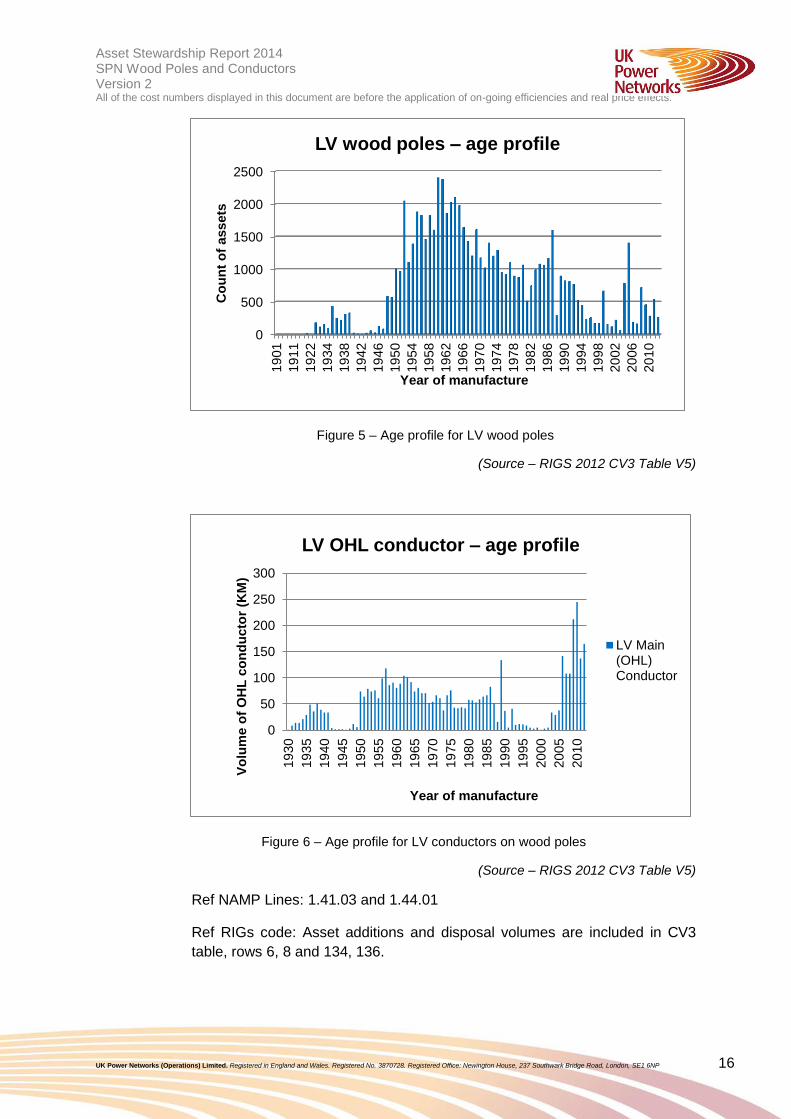
2.3 LV Wood Poles and Conductors There are 126,175 poles on the LV network and approximately 4,543km of
conductor.
It can be seen from the age profile in Figure 5 that there was significant
investment in the 1950s and 1960s, resulting in an ageing wood pole asset;
the average age is approximately 42 years.
0
100
200
300
400
500
600
19
32
19
37
19
42
19
47
19
52
19
57
19
62
19
67
19
72
19
77
19
82
19
87
19
92
19
97
20
02
20
07
20
12
Vo
lum
es o
f O
HL
co
nd
ucto
r (K
M)
Year
HV conductors – age profile
BLX or SimilarConductor
ConventionalConductor
Asset Stewardship Report 2014 Working draft v0.1 SPN Wood Poles and Conductors Version 2 All of the cost numbers displayed in this document are before the application of on-going efficiencies and real price effects.
UK Power Networks (Operations) Limited. Registered in England and Wales. Registered No. 3870728. Registered Office: Newington House, 237 Southwark Bridge Road, London, SE1 6NP 16
Figure 5 – Age profile for LV wood poles
(Source – RIGS 2012 CV3 Table V5)
Figure 6 – Age profile for LV conductors on wood poles
(Source – RIGS 2012 CV3 Table V5)
Ref NAMP Lines: 1.41.03 and 1.44.01
Ref RIGs code: Asset additions and disposal volumes are included in CV3
table, rows 6, 8 and 134, 136.
0
500
1000
1500
2000
2500
19
01
19
11
19
22
19
34
19
38
19
42
19
46
19
50
19
54
19
58
19
62
19
66
19
70
19
74
19
78
19
82
19
86
19
90
19
94
19
98
20
02
20
06
20
10
Co
un
t o
f assets
Year of manufacture
LV wood poles – age profile
0
50
100
150
200
250
300
19
30
19
35
19
40
19
45
19
50
19
55
19
60
19
65
19
70
19
75
19
80
19
85
19
90
19
95
20
00
20
05
20
10
Vo
lum
e o
f O
HL
co
nd
ucto
r (K
M)
Year of manufacture
LV OHL conductor – age profile
LV Main(OHL)Conductor

Asset Stewardship Report 2014 Working draft v0.1 SPN Wood Poles and Conductors Version 2 All of the cost numbers displayed in this document are before the application of on-going efficiencies and real price effects.
UK Power Networks (Operations) Limited. Registered in England and Wales. Registered No. 3870728. Registered Office: Newington House, 237 Southwark Bridge Road, London, SE1 6NP 17
3.0 Investment Drivers
3.1 Overview The main investment drivers that influence the actions and decisions involved
in the management of overhead lines on wood poles and narrow-based
supports and associated assets are primarily:
Public and operator safety
Asset and network performance
Major defects in some asset types
Compliance with statutory regulations, including Electricity Safety,
Quality and Continuity (ESQC) risks.
These drivers will be supported by:
Asset condition reports
Condition-based reliability studies
Asset and network performance
Analysis of current and future work costs
Electricity Safety, Quality and Continuity Regulations risk assessments
Historic, current and emerging equipment and diagnostic technologies
Stakeholder options
Customer requests
Faults.
Specific information is also obtained from defect reports by other users of the
same type of overhead line assets through the National Equipment Defect
Reporting Scheme (NEDeRS).
·
3.2 Condition and Defects
3.2.1 Condition and defects used as replacement drivers
The assessment of a wood pole overhead line’s condition is based on a
number of condition-assessment measures and defects, collected during
routine inspections. ESQCR compliance condition / defects , information is
also collected during routine inspections. In order to ensure good quality data
is captured and recorded in the asset register in a timely manner, handheld
devices (HHD) are used on site at the point of inspection and the information
is uploaded into the Asset Management Data Base (ELLIPSE) .
Condition assessment on all wood pole overhead line assets (including the
conductor and the structure) are visual, except for hammer tests, PURL tests,
auger tests and the resistograph, which are used to determine the residual
strength of a pole.

Asset Stewardship Report 2014 Working draft v0.1 SPN Wood Poles and Conductors Version 2 All of the cost numbers displayed in this document are before the application of on-going efficiencies and real price effects.
UK Power Networks (Operations) Limited. Registered in England and Wales. Registered No. 3870728. Registered Office: Newington House, 237 Southwark Bridge Road, London, SE1 6NP 18
Key condition points collected during inspections or as part of tests are
summarised in Table 4.
Grouping Condition measure/ Defect/ESQC rating
Conductor Conductor out of regulation
Damaged insulated conductor
Conductor damage
Conductor integrity
Jumpers
Pole of narrow-based tower
Badly leaning pole
Pole condition
Condition of steel structure
Pole top Insulator/fittings condition
Condition of cross arm
ESQC location risk ESQC location risk
Other ESQC drivers Danger of death sign defective; stay defective; inadequate ground clearance; climbable tree; condition of anti-climbing device
Table 4 – Condition measures and defects
Condition Ratings (CR) are stored in Ellipse on a scale of 1 to 4, as shown in
Table 5, and defects are assessed either as a CR1 or CR4.
Condition value Description
1 Generally in ‘as new’ or very good condition
2 Acceptable or satisfactory condition
3 Indication that either minor work is required or the condition indicates that future repair or replacement is required
4 This category indicates that significantly /urgent repair or replacement is required
Table 5 – Condition value descriptions

Asset Stewardship Report 2014 Working draft v0.1 SPN Wood Poles and Conductors Version 2 All of the cost numbers displayed in this document are before the application of on-going efficiencies and real price effects.
UK Power Networks (Operations) Limited. Registered in England and Wales. Registered No. 3870728. Registered Office: Newington House, 237 Southwark Bridge Road, London, SE1 6NP 19
Condition assessment measures shown in Table 5 are used as inputs to the
Asset Risk and Prioritisation model and are defined in EMS-10-0001,
Maintenance and Inspection Overview. The Asset Risk and Prioritisation
model will be used to prioritise the replacement of these assets.
The risk rating of a wood pole or steel structure and their associated spans
are assessed as per UKPN Engineering operating policy (EOP)09-0061,
(Assessing the Risk to the Public from Overhead and Substation Assets).
This applies to:
Overhead line structures and spans with high-risk and very-high-risk
ESQC ratings
Overhead line structures and spans with key risks.
Examples of overhead line key risks
Code Title Description
K1 NONE No additional hazards to overhead line
K3 CLIMBING AID Any device or vegetation that by its position would enable a person to gain accesses to pole or tower e.g hedges ,ivy, walls ,fence, pallet stack, unauthorised private signs.
K4 KITE/AEROPLANE FLYING
Where there is risk of contact with the overhead line by the flying of kites or aeroplanes
K9 VEHICLE / MACHINERY CONTACT
Vehicle or machinery that by its location infringes ,or by its position allows access to infringe within the safety clearance of the line (this key risk shall only be recorded if there is an evidence of electrical infringement or if there is evidence of frequent movement of vehicles or machinery under the line which could infringe safety clearance ).

Asset Stewardship Report 2014 Working draft v0.1 SPN Wood Poles and Conductors Version 2 All of the cost numbers displayed in this document are before the application of on-going efficiencies and real price effects.
UK Power Networks (Operations) Limited. Registered in England and Wales. Registered No. 3870728. Registered Office: Newington House, 237 Southwark Bridge Road, London, SE1 6NP 20
3.2.2 Examples of condition and defects
Figure 7 – Woodpecker damage Figure 8 – Pole top rotting
Figure 9 – Pole base rotting Figure 10 – Conductor damage
Woodpecker damage – The damage caused by woodpeckers on wooden
poles affects the maximum loading of the pole at the point of woodpecker
attack. By considering the geometry of the entry hole and nesting hole, it is
possible to establish the minimum height from ground level where the holes
have no effect on the ultimate strength of the pole.
Each separate hole needs to be assessed and, if possible, filled with Hydrofil
(a resin-based material) and finished to the profile of the pole. As an example,
if a light pole has a nesting cavity greater than 110mm diameter, the pole
shall be changed; for a medium pole, it’s 130mm; and for a stout pole it’s
150mm. So there could be many holes in a pole that will not affect the overall

Asset Stewardship Report 2014 Working draft v0.1 SPN Wood Poles and Conductors Version 2 All of the cost numbers displayed in this document are before the application of on-going efficiencies and real price effects.
UK Power Networks (Operations) Limited. Registered in England and Wales. Registered No. 3870728. Registered Office: Newington House, 237 Southwark Bridge Road, London, SE1 6NP 21
strength. However, nesting holes have an inner cavity that can go deep into
the pole and there is no acceptable method of infill mitigation.
Pole top rotting – Ingress of water into the top of the pole occurs when there
is cracking/splitting that results in water getting into untreated wood through
the grain. The top of the pole is shaped like a cone to stop water pooling, but
the effect of wind and rain coupled with sun will result in the wood splitting
over time in some exposed locations.
Pole base rot – Pole base rot can be caused by a number of conditions
including:
Internal rot
External rot
Termites
Cracking and splitting
Third-party damage
There are various stages in the process of decay. In the earliest stages, the
wood appears to be hard and firm, with the only evidence of attack, if any,
being a slight or marked colour change from the normal. This is known as the
‘incipient’ or ‘initial’ stage. In some cases, there is no indication of incipient
decay, hyphae (fungus) extending for half a metre or more longitudinally in
advance of the visible evidence of rot.
After the incipient stage has passed, the wood becomes more and more
noticeably affected until it is completely changed in appearance and structure,
with the continuity of the wood tissues destroyed. This is known as the
‘advanced’ stage, in which the strength of the wood is so reduced that it can
be crumbled between the fingers or easily broken (refer to Figure 9).
Fungi require oxygen, moisture and a substrate to feed on. It tends to be
‘light-shy’, developing inside the timber. The internal timber condition is
usually far worse than it appears externally.
Conductor damage – Damage to an OHL conductor can occur by:
Conductors clashing
Third-party damage
Degradation of steel wires
Sulphur corrosion of aluminium strands
Falling trees
Fatigue on high tower lines
Small section conductors
Lightning.

Asset Stewardship Report 2014 Working draft v0.1 SPN Wood Poles and Conductors Version 2 All of the cost numbers displayed in this document are before the application of on-going efficiencies and real price effects.
UK Power Networks (Operations) Limited. Registered in England and Wales. Registered No. 3870728. Registered Office: Newington House, 237 Southwark Bridge Road, London, SE1 6NP 22
3.2.3 Correlation between Defects and Age
The majority of defects raised over time associated to wood poles are related directly to the date of installation (i.e the age). Taking this into account, it is recognised that the number of defects associated to wood poles may increase over time however the level of defects will be controlled through effective inspection and maintenance regimes.
Figures 11, 12 and 13 shows the comparison between:
Current age profile of the population
Number of defects reported historically (including the age of the transformer when the defect was reported)
Figure 11 - Correlation between Defects and Asset Age
Two observations can be made from Figure 11;
1. The number of defects is low in the 33kV population due to the high importance of maintaing a safe and effective high voltage network and the nature of planned works carried out.
2. The small spikes in the number of defects are due to recognised
routes/circuits in poor condition with most of the assets of the same age.
These spikes have been identified and incorporated into our ED1 asset
replacement plans.
0
200
400
600
800
1000
1200
1400
0 5 10 15 20 25 30 35 40 45 50 55 60 65 70 75 80
No
of
assets
/defe
cts
Asset age
33kV wood poles – defect analysis
Count of Asset Manufactured Count of Defects of Age

Asset Stewardship Report 2014 Working draft v0.1 SPN Wood Poles and Conductors Version 2 All of the cost numbers displayed in this document are before the application of on-going efficiencies and real price effects.
UK Power Networks (Operations) Limited. Registered in England and Wales. Registered No. 3870728. Registered Office: Newington House, 237 Southwark Bridge Road, London, SE1 6NP 23
Figure 12 - Correlation between Defects and Asset Age
Three observations can be made from Figure 12;
1. The number of defects increases with age 2. There is a steady and stable increase in the number of defects from 20
years up until 55 years which aligns with an increase in population volumes with age.
3. Older assets closer to their expected life have had their defects mitigated/reduced.
0
500
1000
1500
2000
2500
3000
0 5 10 15 20 25 30 35 40 45 50 55 60 65 70 75 80
No
of
Assets
/Defe
cts
Asset Age
HV Poles - defect analysis
Count of Asset Manufactured Count of Defects of Age
Asset Stewardship Report 2014 Working draft v0.1 SPN Wood Poles and Conductors Version 2 All of the cost numbers displayed in this document are before the application of on-going efficiencies and real price effects.
UK Power Networks (Operations) Limited. Registered in England and Wales. Registered No. 3870728. Registered Office: Newington House, 237 Southwark Bridge Road, London, SE1 6NP 24
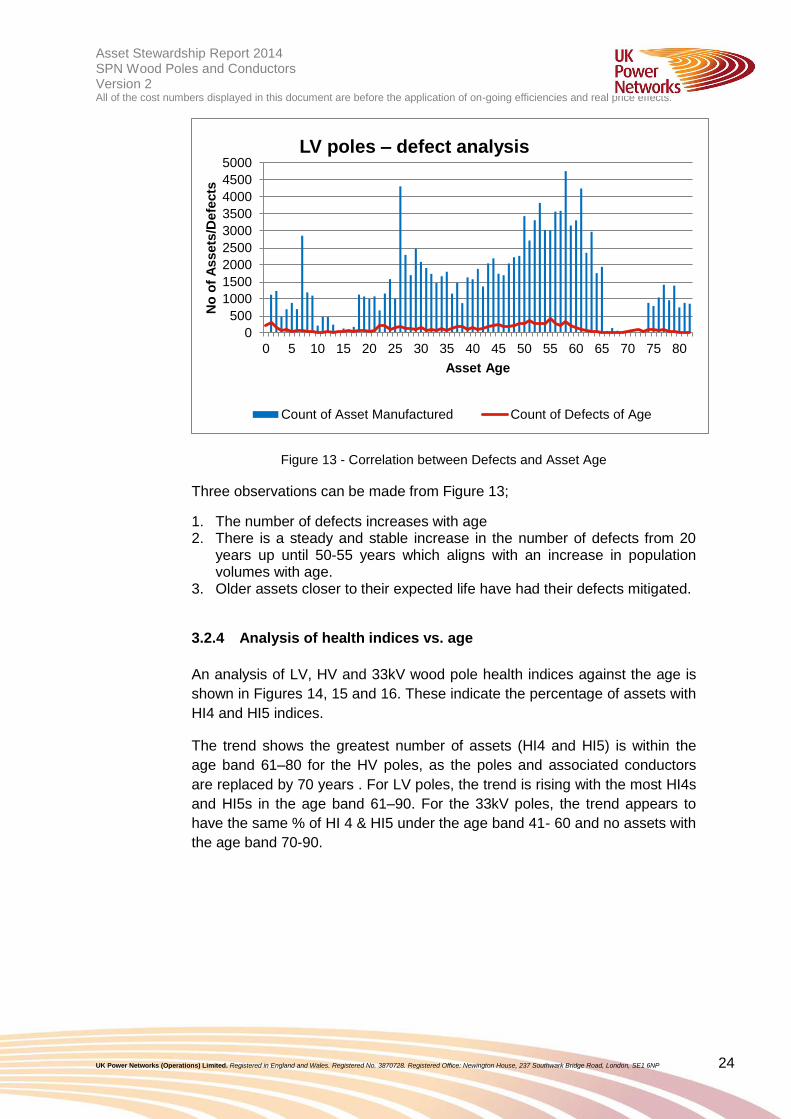
Figure 13 - Correlation between Defects and Asset Age
Three observations can be made from Figure 13;
1. The number of defects increases with age 2. There is a steady and stable increase in the number of defects from 20
years up until 50-55 years which aligns with an increase in population volumes with age.
3. Older assets closer to their expected life have had their defects mitigated.
3.2.4 Analysis of health indices vs. age
An analysis of LV, HV and 33kV wood pole health indices against the age is
shown in Figures 14, 15 and 16. These indicate the percentage of assets with
HI4 and HI5 indices.
The trend shows the greatest number of assets (HI4 and HI5) is within the
age band 61–80 for the HV poles, as the poles and associated conductors
are replaced by 70 years . For LV poles, the trend is rising with the most HI4s
and HI5s in the age band 61–90. For the 33kV poles, the trend appears to
have the same % of HI 4 & HI5 under the age band 41- 60 and no assets with
the age band 70-90.
0
500
1000
1500
2000
2500
3000
3500
4000
4500
5000
0 5 10 15 20 25 30 35 40 45 50 55 60 65 70 75 80
No
of
Assets
/Defe
cts
Asset Age
LV poles – defect analysis
Count of Asset Manufactured Count of Defects of Age

Asset Stewardship Report 2014 Working draft v0.1 SPN Wood Poles and Conductors Version 2 All of the cost numbers displayed in this document are before the application of on-going efficiencies and real price effects.
UK Power Networks (Operations) Limited. Registered in England and Wales. Registered No. 3870728. Registered Office: Newington House, 237 Southwark Bridge Road, London, SE1 6NP 25
Figure 14 – HI profile of HV poles by age
Figure 15 – HI profile of LV poles by age
0%
1%
2%
3%
4%
5%
6%
7%
8%
11-20 21-30 31-40 41-50 51-60 61-70 71-80 81-90
% o
f H
I4 a
nd
HI5
Age band
HV poles – % HI4 and HI5 by age
0%
2%
4%
6%
8%
10%
12%
11-20 21-30 31-40 41-50 51-60 61-70 71-80 81-90
% o
f H
I4 a
nd
HI5
Age band
LV poles – % HI4 and HI5 by age

Asset Stewardship Report 2014 Working draft v0.1 SPN Wood Poles and Conductors Version 2 All of the cost numbers displayed in this document are before the application of on-going efficiencies and real price effects.
UK Power Networks (Operations) Limited. Registered in England and Wales. Registered No. 3870728. Registered Office: Newington House, 237 Southwark Bridge Road, London, SE1 6NP 26
Figure 16 – HI profile of 33kV poles by age
3.2.5 Fault Rate
The five-year fault rate trends for 132kV, 33kV, HV and LV OHL conductors
are shown in Figures 17, 18, 19 and 20. The fault data has been split into two
categories: condition and non-condition faults. Non-condition faults relate to
any fault not caused by the asset itself, such as third-party damage, weather.
Figure 17 – 132kV OHL conductor fault rate
0.0%
0.5%
1.0%
1.5%
2.0%
2.5%
3.0%
3.5%
4.0%
4.5%
5.0%
11-20 21-30 31-40 41-50 51-60 61-70
% o
f H
I4 a
nd
HI5
Age band
33kV poles – % HI4 and HI5 by age
0.00000.00100.00200.00300.00400.00500.00600.00700.00800.00900.0100
2007 2008 2009 2010 2011 2012
Fau
lts/
OH
L C
on
du
cto
r (K
M)
Year
132KV OHL Conductor
All Faults
Poor Condition Due To Age & Wear
Asset Stewardship Report 2014 Working draft v0.1 SPN Wood Poles and Conductors Version 2 All of the cost numbers displayed in this document are before the application of on-going efficiencies and real price effects.
UK Power Networks (Operations) Limited. Registered in England and Wales. Registered No. 3870728. Registered Office: Newington House, 237 Southwark Bridge Road, London, SE1 6NP 27
(Source - UKPN Fault Cube)
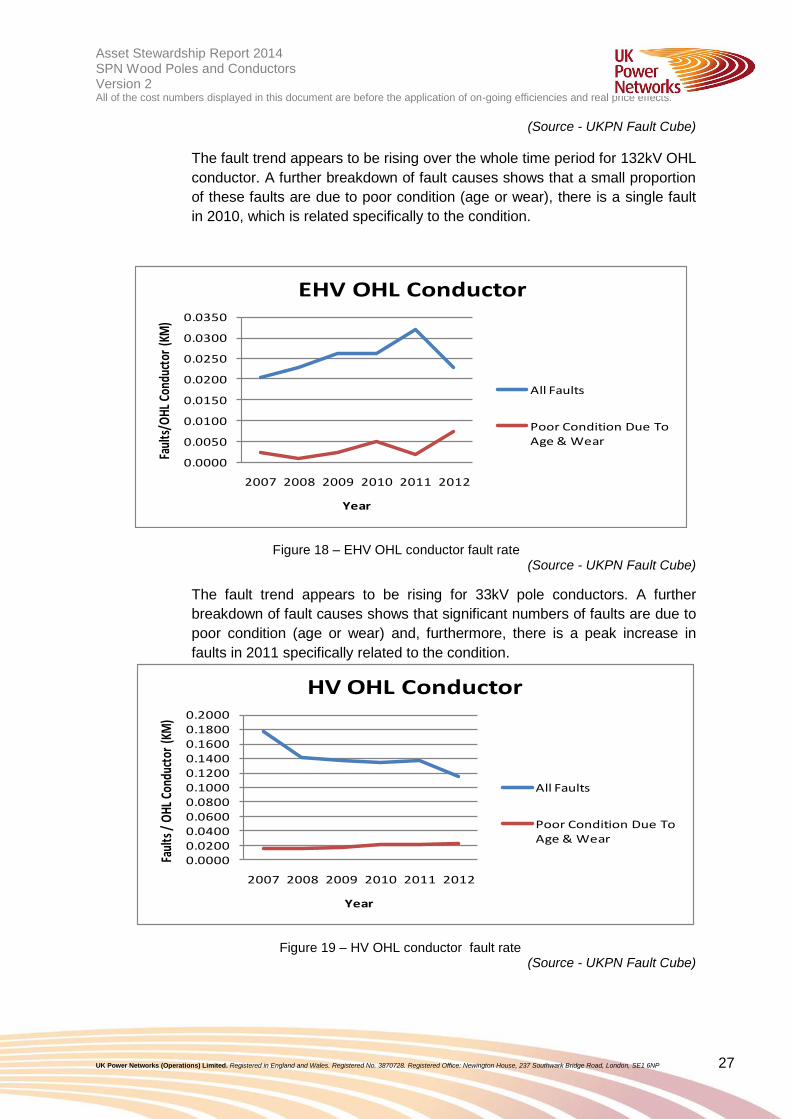
The fault trend appears to be rising over the whole time period for 132kV OHL
conductor. A further breakdown of fault causes shows that a small proportion
of these faults are due to poor condition (age or wear), there is a single fault
in 2010, which is related specifically to the condition.
Figure 18 – EHV OHL conductor fault rate (Source - UKPN Fault Cube)
The fault trend appears to be rising for 33kV pole conductors. A further
breakdown of fault causes shows that significant numbers of faults are due to
poor condition (age or wear) and, furthermore, there is a peak increase in
faults in 2011 specifically related to the condition.
Figure 19 – HV OHL conductor fault rate (Source - UKPN Fault Cube)
0.0000
0.0050
0.0100
0.0150
0.0200
0.0250
0.0300
0.0350
2007 2008 2009 2010 2011 2012
Faul
ts/O
HL C
ondu
ctor
(KM
)
Year
EHV OHL Conductor
All Faults
Poor Condition Due To Age & Wear
0.00000.02000.04000.06000.08000.10000.12000.14000.16000.18000.2000
2007 2008 2009 2010 2011 2012
Faul
ts /
OHL
Con
duct
or (K
M)
Year
HV OHL Conductor
All Faults
Poor Condition Due To Age & Wear
Asset Stewardship Report 2014 Working draft v0.1 SPN Wood Poles and Conductors Version 2 All of the cost numbers displayed in this document are before the application of on-going efficiencies and real price effects.
UK Power Networks (Operations) Limited. Registered in England and Wales. Registered No. 3870728. Registered Office: Newington House, 237 Southwark Bridge Road, London, SE1 6NP 28
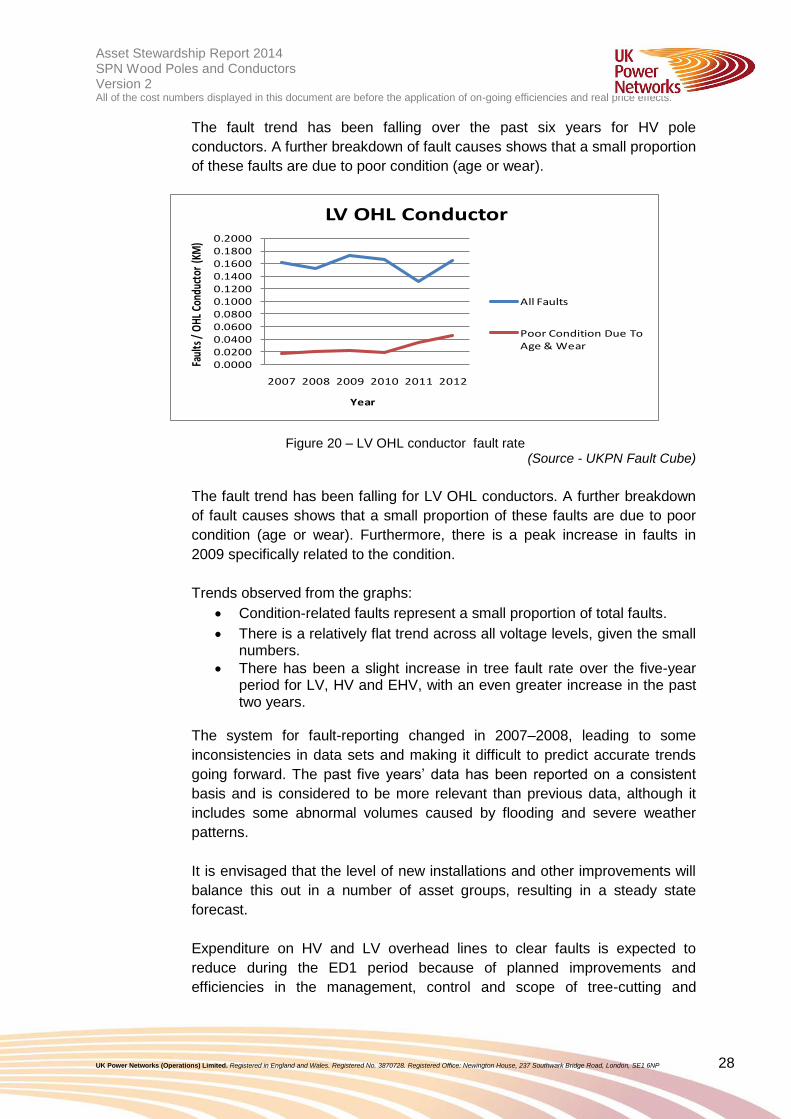
The fault trend has been falling over the past six years for HV pole
conductors. A further breakdown of fault causes shows that a small proportion
of these faults are due to poor condition (age or wear).
Figure 20 – LV OHL conductor fault rate (Source - UKPN Fault Cube)
The fault trend has been falling for LV OHL conductors. A further breakdown
of fault causes shows that a small proportion of these faults are due to poor
condition (age or wear). Furthermore, there is a peak increase in faults in
2009 specifically related to the condition.
Trends observed from the graphs:
Condition-related faults represent a small proportion of total faults.
There is a relatively flat trend across all voltage levels, given the small numbers.
There has been a slight increase in tree fault rate over the five-year period for LV, HV and EHV, with an even greater increase in the past two years.
The system for fault-reporting changed in 2007–2008, leading to some
inconsistencies in data sets and making it difficult to predict accurate trends
going forward. The past five years’ data has been reported on a consistent
basis and is considered to be more relevant than previous data, although it
includes some abnormal volumes caused by flooding and severe weather
patterns.
It is envisaged that the level of new installations and other improvements will
balance this out in a number of asset groups, resulting in a steady state
forecast.
Expenditure on HV and LV overhead lines to clear faults is expected to
reduce during the ED1 period because of planned improvements and
efficiencies in the management, control and scope of tree-cutting and
0.00000.02000.04000.06000.08000.10000.12000.14000.16000.18000.2000
2007 2008 2009 2010 2011 2012
Faul
ts /
OHL
Con
duct
or (K
M)
Year
LV OHL Conductor
All Faults
Poor Condition Due To Age & Wear
Asset Stewardship Report 2014 Working draft v0.1 SPN Wood Poles and Conductors Version 2 All of the cost numbers displayed in this document are before the application of on-going efficiencies and real price effects.
UK Power Networks (Operations) Limited. Registered in England and Wales. Registered No. 3870728. Registered Office: Newington House, 237 Southwark Bridge Road, London, SE1 6NP 29
surveys, the replacement of small section conductors, and the replacement of
bare LV overhead conductors with aerial-bundled conductors (ABC).
Asset Stewardship Report 2014 Working draft v0.1 SPN Wood Poles and Conductors Version 2 All of the cost numbers displayed in this document are before the application of on-going efficiencies and real price effects.
UK Power Networks (Operations) Limited. Registered in England and Wales. Registered No. 3870728. Registered Office: Newington House, 237 Southwark Bridge Road, London, SE1 6NP 30
3.3 Condition Measurements
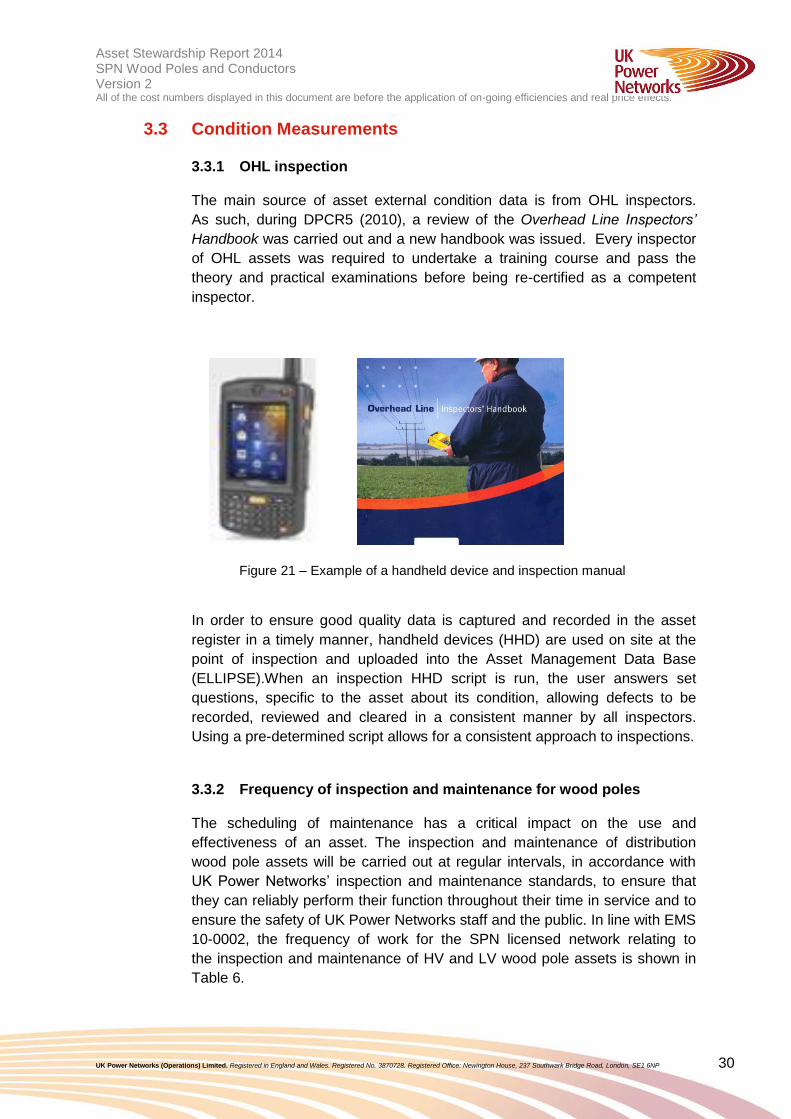
3.3.1 OHL inspection
The main source of asset external condition data is from OHL inspectors.
As such, during DPCR5 (2010), a review of the Overhead Line Inspectors’
Handbook was carried out and a new handbook was issued. Every inspector
of OHL assets was required to undertake a training course and pass the
theory and practical examinations before being re-certified as a competent
inspector.
Figure 21 – Example of a handheld device and inspection manual
In order to ensure good quality data is captured and recorded in the asset
register in a timely manner, handheld devices (HHD) are used on site at the
point of inspection and uploaded into the Asset Management Data Base
(ELLIPSE).When an inspection HHD script is run, the user answers set
questions, specific to the asset about its condition, allowing defects to be
recorded, reviewed and cleared in a consistent manner by all inspectors.
Using a pre-determined script allows for a consistent approach to inspections.
3.3.2 Frequency of inspection and maintenance for wood poles
The scheduling of maintenance has a critical impact on the use and
effectiveness of an asset. The inspection and maintenance of distribution
wood pole assets will be carried out at regular intervals, in accordance with
UK Power Networks’ inspection and maintenance standards, to ensure that
they can reliably perform their function throughout their time in service and to
ensure the safety of UK Power Networks staff and the public. In line with EMS
10-0002, the frequency of work for the SPN licensed network relating to
the inspection and maintenance of HV and LV wood pole assets is shown in
Table 6.

Asset Stewardship Report 2014 Working draft v0.1 SPN Wood Poles and Conductors Version 2 All of the cost numbers displayed in this document are before the application of on-going efficiencies and real price effects.
UK Power Networks (Operations) Limited. Registered in England and Wales. Registered No. 3870728. Registered Office: Newington House, 237 Southwark Bridge Road, London, SE1 6NP 31
Table 6 – Wood pole frequency of inspection
3.3.3 Testing of a pole using existing techniques
The values used for the basis of Residual Strength Value (RSV) in UK Power
Networks are based on values from BS 1990 Part 1: 1984.
A trained craftsman assesses the condition of a wood pole at the full
inspection with a hammer test. The pole should be hit with a hammer
weighing about 3lbs, starting near the ground and continuing upwards
circumferentially around the pole to a height of approximately six feet. A good
pole will produce a clear sound and a decayed pole will sound dull. It is not
possible to ascertain the actual RSV during an inspection using this process.
If a pole is suspected of having decay, it is labelled accordingly either with an
‘S’ (suspected pole rot below 10% rot) or with a ‘D’ (suspected pole rot of
20%). Further analysis would have to be arranged using one of the following
methods.
The PURL ultra-sonic tester – EA Technology makes the pole ultra-sonic rot
locator (PURL). It is operated at several points along a circumferential line
around the pole and the readings obtained are then analysed using a
computer program, which produces an estimate of the likely area of internal
decay and predicts the residual bending strengths of the pole at the chosen
cross-section (expressed as a percentage of the original strength). A decision
on whether to replace the pole or allow it to remain in service is made upon
this analysis.
Voltage
Safety inspection
frequency
Full inspection
frequency
Fault inspection
frequency
132kV wood pole
Every 2 years Every 2 years After fault trip where cause is
unknown
33kV wood pole Every 4 years Every 12 years After 3 reclose sequences within
31 days
HV wood pole Every 4 years Every 12 years After 3 reclose sequences within
31 days
LV wood pole Every 4 years Every 12 years None

Asset Stewardship Report 2014 Working draft v0.1 SPN Wood Poles and Conductors Version 2 All of the cost numbers displayed in this document are before the application of on-going efficiencies and real price effects.
UK Power Networks (Operations) Limited. Registered in England and Wales. Registered No. 3870728. Registered Office: Newington House, 237 Southwark Bridge Road, London, SE1 6NP 32
Auger – This method of testing uses a screw thread with a hollow inner that
goes into a pole. Once the auger is fully inserted into the pole, the internal
part of the auger is pulled out, and with it some of the internal parts of the
pole for the length of the drill. An assessment of the internal wood density will
determine the condition of the pole and its serviceability.
3.3.4 Pole condition based on Health Index
In order to get an HI rating for a pole, the residual strength percentage must
be calculated. This is based on the size of the pole and the condition of the
overall pole structure based on a condition rating between 1 and 4 (UK Power
Networks’ internal condition scoring).
The revised and consolidated pole condition score will then give an HI rating
for the pole. The process is shown in Figure 19, taken from ARP tool.
Figure 22 – Pole condition based on HI
RSV %
Light Pole RSV
Rating
Medium Pole RSV
Rating
Stout Pole RSV
Rating
Extra Stout Pole
RSV Rating
Revised Pole
Condition Score
UKPN LV /
HV Internal
Condition
Score (1-4)
Maximum Internal
Condition Score
Consolidated
Condition Score
Condition Of
Minimum &
Maximum HI
Wood Pole Condition Score

Asset Stewardship Report 2014 Working draft v0.1 SPN Wood Poles and Conductors Version 2 All of the cost numbers displayed in this document are before the application of on-going efficiencies and real price effects.
UK Power Networks (Operations) Limited. Registered in England and Wales. Registered No. 3870728. Registered Office: Newington House, 237 Southwark Bridge Road, London, SE1 6NP 33
4.0 Asset Assessment
4.1 Asset Health An innovative asset health modelling tool, the Asset Risk and Prioritisation
(ARP) model, has been developed for several asset categories, including
wood poles. The methodology behind the modelling is the same for all asset
categories.
The general methodology for the ARP model can be found in Commentary
15: Model Overview. The wood pole ARP model uses both the age and
condition data to calculate a Health Index for the asset. An initial HI is
calculated based on the year of manufacture and expected average life. The
environmental factors considered include the distance from coast. An average
life is assigned to show the expected time from when the asset was
manufactured until it shows signs of increased deterioration. It is not the time
from when the asset is commissioned until it is decommissioned. This initial
HI is capped at HI3.
This factor value is then combined with the initial HI to produce the current HI
of the asset.
4.2 Asset Criticality & Network Risk The ARP model can also be used to calculate the criticality of a particular
wood pole asset; this methodology is still under development. This is assigns
Criticality Index 1 to 4, with 1 being the least critical and 4 being the most. A
detailed methodology for calculating the criticality index can be found in
Commentary 15: Model Overview Description.
Asset Criticality provides a measure of the consequence of failure and is
evaluated in terms of the following four criticality areas
Network performance
Safety
Financial ,OPEX and CAPEX
Environmental
For network performance, the key factors are the condition performance risk,
condition of load at risk during failure, and the average value of critical asset.
The safety criticality specific to overhead lines is based around the condition
safety risk and average value of critical asset. The financial criticality is split
into operational and capital expenditure sections, and all faults are associated
with an operation cost for the overhead line. Finally, the environmental
section considers the proximity of major crossings and environmentally
sensitive areas.

Asset Stewardship Report 2014 Working draft v0.1 SPN Wood Poles and Conductors Version 2 All of the cost numbers displayed in this document are before the application of on-going efficiencies and real price effects.
UK Power Networks (Operations) Limited. Registered in England and Wales. Registered No. 3870728. Registered Office: Newington House, 237 Southwark Bridge Road, London, SE1 6NP 34
4.2.1 Network Risk
The network risk in monetary terms can also be calculated in the ARP model;
this methodology is still under development. This is done using the
probability of failure, the criticality, and the consequence of failure. The
probability of failure is calculated using the current Health Index of the item,
and the criticality is calculated as described in the previous section. The
consequence of failure is the average cost to either repair or replace the item
after one of four failure modes.
4.3 Data Validation All data used in the ARP model is subject to validation against a set of data
requirements. The requirements ensure data is within specified limits, up to
date and in the correct format for use in the model. On completion of the
validation process, an exception report is issued providing details of every
non-compliance, allowing continual improvement of data quality.
4.4 Data Verification
A sampling approach to data verification follows each data upload to ensure
an accurate transfer into the models.
4.5 Data Completeness The completeness, accuracy and timeliness of the data used in the ARP
model are routinely checked. The results for the data used in the wood poles
are given in Table 7.
.
Asset category Completeness Timeliness CAT score
33kV pole 60% 46% 56%
HV pole 60% 45% 56%
LV pole 61% 51% 58%
Table 7 – CAT scoring analysis
Data Source: ARP Wood pole data quality report 08_02_2013
The completeness score for wood poles is a combination of nameplate and
condition data. Although the overall completeness of data is 60%. The main
drivers for this asset group are inspector training courses and cyclic
inspection schedules, which will improve this data over the next few years.
The timeliness score shows the percentage of assets that have condition data
recorded and aligned to the inspection and maintenance frequency schedule.

Asset Stewardship Report 2014 Working draft v0.1 SPN Wood Poles and Conductors Version 2 All of the cost numbers displayed in this document are before the application of on-going efficiencies and real price effects.
UK Power Networks (Operations) Limited. Registered in England and Wales. Registered No. 3870728. Registered Office: Newington House, 237 Southwark Bridge Road, London, SE1 6NP 35
DPCR5 has seen a rise in comprehensive condition and defect data, and our
strategy is to gain even better data so that we can efficiently and effectively
manage the growing risks from ageing assets and greater defects. As a
consequence, UK Power Networks is prepared to carry the risk associated
with missing asset and condition data.
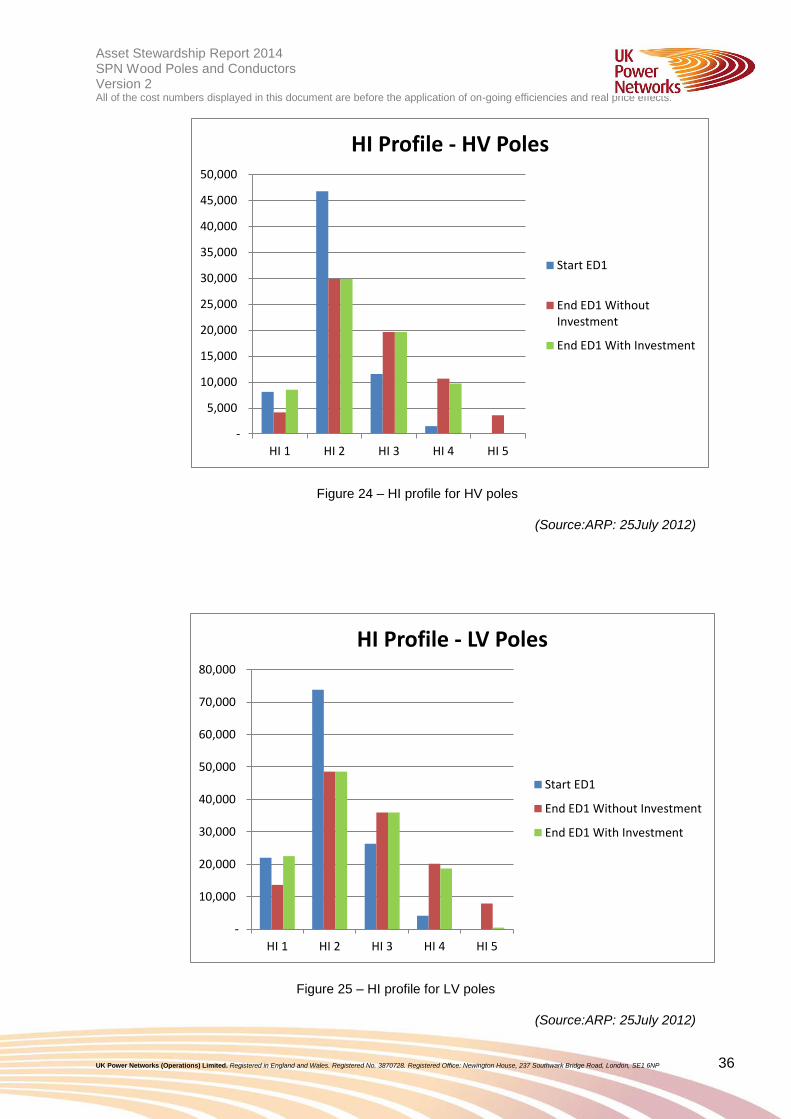
4.6 DPCR5 HI Profiles – With and Without Investment Figures 20–22 shows the output from the models with and without the
planned ED1 investment. This highlights the start point for the ED1 period.
The investment levels during ED1 have been set to manage the risk due to
the condition of the asset and to replace HI4 /HI5 in order to maintain an
asset profile consistently during ED1.
Figure 23 – HI profile for 33kV poles
(Source:ARP: 25July 2012)
-
1,000
2,000
3,000
4,000
5,000
6,000
7,000
8,000
9,000
10,000
HI 1 HI 2 HI 3 HI 4 HI 5
HI Profile - 33kV Poles
Start ED1
End ED1 Without Investment
End ED1 With Investment
Asset Stewardship Report 2014 Working draft v0.1 SPN Wood Poles and Conductors Version 2 All of the cost numbers displayed in this document are before the application of on-going efficiencies and real price effects.
UK Power Networks (Operations) Limited. Registered in England and Wales. Registered No. 3870728. Registered Office: Newington House, 237 Southwark Bridge Road, London, SE1 6NP 36
Figure 24 – HI profile for HV poles
(Source:ARP: 25July 2012)
Figure 25 – HI profile for LV poles
(Source:ARP: 25July 2012)
-
5,000
10,000
15,000
20,000
25,000
30,000
35,000
40,000
45,000
50,000
HI 1 HI 2 HI 3 HI 4 HI 5
HI Profile - HV Poles
Start ED1
End ED1 WithoutInvestment
End ED1 With Investment
-
10,000
20,000
30,000
40,000
50,000
60,000
70,000
80,000
HI 1 HI 2 HI 3 HI 4 HI 5
HI Profile - LV Poles
Start ED1
End ED1 Without Investment
End ED1 With Investment
Asset Stewardship Report 2014 Working draft v0.1 SPN Wood Poles and Conductors Version 2 All of the cost numbers displayed in this document are before the application of on-going efficiencies and real price effects.
UK Power Networks (Operations) Limited. Registered in England and Wales. Registered No. 3870728. Registered Office: Newington House, 237 Southwark Bridge Road, London, SE1 6NP 37
5.0 Intervention Policies
5.1 Interventions: Description of Intervention Options There are four types of intervention that are applicable to overhead lines:
Overhead line rebuilds
Overhead line refurbishments
Component replacements
ESQCR replacements and refurbishment (refer to ESQCR justification
document).
5.1.1 Overhead line rebuilds and refurbishments
The overhead line shall be considered for rebuilding either when 60% of the
overhead line supports have a condition rating of 4; or if the fault performance
of the overhead line is unacceptable, based on CIs/CML, and is therefore
driving the installation of covered conductors where repeat faults are
experienced. This will result in either the entire overhead line or manageable
sections of the overhead line being rebuilt.
The overhead line shall be considered for refurbishment when more than 20%
of the line’s components have a condition rating of 4 or the fault performance
of the line is unacceptable. This will result in either the entire line or
manageable sections of the line being refurbished.
Overhead line refurbishments and rebuilds form the scope of the following
work programmes in the NAMP:
LV overhead line work programme (1.44.01, 1.41.03)
HV overhead line work programme (1.19.12, 1.32.17, 1.32.19)
33kV overhead line work programme (1.09.01, 1.09.04, 1.09.05).
5.1.2 Component replacements/refurbishment
Replacement – Component replacements shall be carried out if less than
20% of the overhead line components have a condition rating of 4. This
intervention forms the basis of the ‘D’ pole replacement work programme. On
new poles the pole saver is installed as standard.
Refurbishment (Life Extension) – Four categories of interventions have
been considered for wood poles activities ( Boron rods / pole support ).These
are summarised in Table 8 and explained in more detail later in this section.

Asset Stewardship Report 2014 Working draft v0.1 SPN Wood Poles and Conductors Version 2 All of the cost numbers displayed in this document are before the application of on-going efficiencies and real price effects.
UK Power Networks (Operations) Limited. Registered in England and Wales. Registered No. 3870728. Registered Office: Newington House, 237 Southwark Bridge Road, London, SE1 6NP 38
Validates pole condition
Diagnostic Application Comment Cost Net benefit/ HI benefit
Micro-bore pressure sensing drill (resistograph)
A battery-operated machine that bores a drill into the wood. The resistance is analysed to assess the internal strength of the pole.. It measures the section depth of the pole at several locations, giving an internal view of the pole’s overall strength
UK Power Networks is pioneering the use of the micro-bore pressure sensing drill – a technique that can accurately record the internal condition of a wood pole, with the ability to undertake below-ground condition assessment of the wood without the need to excavate .
£21/pole If the results following testing show that the decay within a pole is not as first thought using existing simplified methods, the HI of a pole can reduce from HI5 to HI4 and even HI4 to HI3. This is due to below-ground testing being possible where rot in poles is known to be most prevalent.
Intervention on Existing Poles
Application Comment Cost Net benefit/ HI benefit
Boron rods Pole is drilled at base and boron rod inserted
Where pole is in a wet environment, the rods will delay the rotting process.
£30/pole
(NAMP line 1.13.20)
Life of the pole will be extended by up to 10 years
Pole support system
Installed adjacent to a pole where minor rot has been detected on a certain part of the pole at base level.
This metal plate would be better installed on wood poles that are in good condition but have been damaged at ground level
Where base rot has been detected, the support can be installed and fixed to the pole. This will provide physical strength to a pole that may be slightly weakened by rot.
Although being promoted to support rotten poles, the application on a D rotted pole would not be
£250/pole If used in conjunction with boron rods, this will delay the need to change a pole. It will delay the asset going from HI 2/3 to HI4.
The HI4 damaged wood poles would be reclassified as an HI2. This is a repair-only option.
Asset Stewardship Report 2014 Working draft v0.1 SPN Wood Poles and Conductors Version 2 All of the cost numbers displayed in this document are before the application of on-going efficiencies and real price effects.
UK Power Networks (Operations) Limited. Registered in England and Wales. Registered No. 3870728. Registered Office: Newington House, 237 Southwark Bridge Road, London, SE1 6NP 39
supported by operational staff, also by working practice issues.
Restriction to clean poles only as the plate raises the datum line up at least 1 metre.
Intervention on New Poles
Application Comment Cost Net benefit/ HI benefit
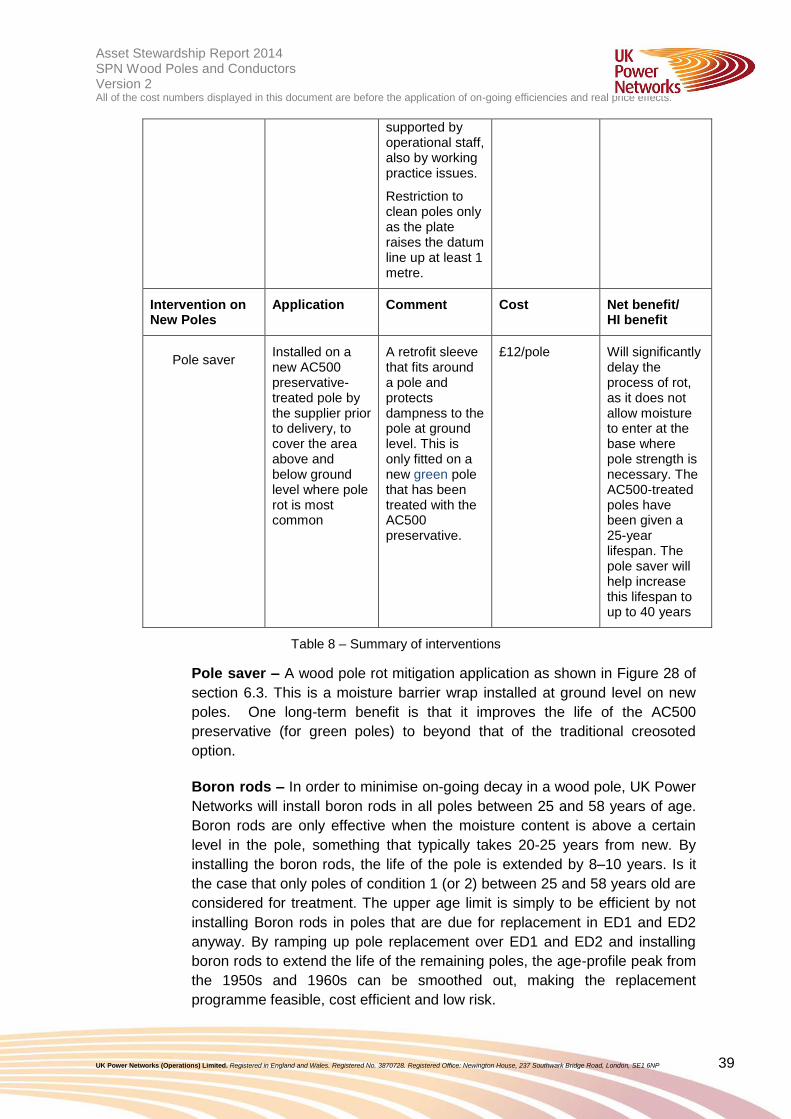
Pole saver Installed on a new AC500 preservative-treated pole by the supplier prior to delivery, to cover the area above and below ground level where pole rot is most common
A retrofit sleeve that fits around a pole and protects dampness to the pole at ground level. This is only fitted on a new green pole that has been treated with the AC500 preservative.
£12/pole Will significantly delay the process of rot, as it does not allow moisture to enter at the base where pole strength is necessary. The AC500-treated poles have been given a 25-year lifespan. The pole saver will help increase this lifespan to up to 40 years
Table 8 – Summary of interventions
Pole saver – A wood pole rot mitigation application as shown in Figure 28 of
section 6.3. This is a moisture barrier wrap installed at ground level on new
poles. One long-term benefit is that it improves the life of the AC500
preservative (for green poles) to beyond that of the traditional creosoted
option.
Boron rods – In order to minimise on-going decay in a wood pole, UK Power
Networks will install boron rods in all poles between 25 and 58 years of age.
Boron rods are only effective when the moisture content is above a certain
level in the pole, something that typically takes 20-25 years from new. By
installing the boron rods, the life of the pole is extended by 8–10 years. Is it
the case that only poles of condition 1 (or 2) between 25 and 58 years old are
considered for treatment. The upper age limit is simply to be efficient by not
installing Boron rods in poles that are due for replacement in ED1 and ED2
anyway. By ramping up pole replacement over ED1 and ED2 and installing
boron rods to extend the life of the remaining poles, the age-profile peak from
the 1950s and 1960s can be smoothed out, making the replacement
programme feasible, cost efficient and low risk.

Asset Stewardship Report 2014 Working draft v0.1 SPN Wood Poles and Conductors Version 2 All of the cost numbers displayed in this document are before the application of on-going efficiencies and real price effects.
UK Power Networks (Operations) Limited. Registered in England and Wales. Registered No. 3870728. Registered Office: Newington House, 237 Southwark Bridge Road, London, SE1 6NP 40
The benefits of boron rod installation, based on the condition data taken from
the ARP, is summarised in Table 9.
Table 9 – Summary of the benefits of boron rods
Pole support system – Installed adjacent to a pole that has minor rot on a
certain part at base level, this is an innovative pole support system, designed
to provide structural stability to a wood pole that has been physically
damaged or subjected to rot, ultimately extending its life.
5.2 Proposed expenditure by interventions
The proposed volumes ‘with intervention’ and ‘without interventions’ for ED1
period is shown below for comparison. The potential saving with various
intervention options per year during the ED1 period is detailed in section 6,
£1.3m for LV poles and £1.2m for the HV poles.
The current modelled average end-of-life for a wooden pole is 60 years
without intervention. With intervention, a wooden pole can have an average
end-of-life extended to 70 years.
Number of poles
Condition Non Boron Rod Boron rod
1 287,330 175,751
3 11,795 7,568
4 11,894 5,860
Mean life of poles
Condition Non Boron Rod Boron rod
1 31 39
3 43 44
4 44 44

Asset Stewardship Report 2014 Working draft v0.1 SPN Wood Poles and Conductors Version 2 All of the cost numbers displayed in this document are before the application of on-going efficiencies and real price effects.
UK Power Networks (Operations) Limited. Registered in England and Wales. Registered No. 3870728. Registered Office: Newington House, 237 Southwark Bridge Road, London, SE1 6NP 41
Figure 26 – Investment analysis for LV poles
(source; 19th February 2014 NAMP Table O)
Figure 27 – Investment analysis for HV poles
(source; 19th February 2014 NAMP Table O)
0
5000
10000
15000
20000
25000
30000
2016 2017 2018 2019 2020 2021 2022 2023
Nu
mb
er
of
po
les
Re
pla
ce
d
Year
LV poles
Without investment
With investment
0
2000
4000
6000
8000
10000
12000
14000
16000
18000
2016 2017 2018 2019 2020 2021 2022 2023
Nu
mb
er
of
po
les
Rep
lac
ed
Year
HV poles
Withoutinvestment
With investment

Asset Stewardship Report 2014 Working draft v0.1 SPN Wood Poles and Conductors Version 2 All of the cost numbers displayed in this document are before the application of on-going efficiencies and real price effects.
UK Power Networks (Operations) Limited. Registered in England and Wales. Registered No. 3870728. Registered Office: Newington House, 237 Southwark Bridge Road, London, SE1 6NP 42
5.3 Policies: Selecting Preferred Interventions Preferred interventions for each asset and justification for selection
Figure 28 – Intervention decision flow chart
All Wood Poles
( LV,EHV,HV & 132 KV )
HI = 4 / 5 ?
What are the Key Drivers HI4 /HI5 ?
Age
Review Of Model Outputs
Condition/Defect
Engineering Analysis
e.g Condition /defect
points are valid
Replace Wood Pole Normal Operation
Enhanced Monitoring
Intervention
Refurbishment
Pole Type Location
POF

Asset Stewardship Report 2014 Working draft v0.1 SPN Wood Poles and Conductors Version 2 All of the cost numbers displayed in this document are before the application of on-going efficiencies and real price effects.
UK Power Networks (Operations) Limited. Registered in England and Wales. Registered No. 3870728. Registered Office: Newington House, 237 Southwark Bridge Road, London, SE1 6NP 43
6.0 Innovation
6.1 Boron Rods
Figure 29 – Boron rod installation
These solid rods of high-strength boron 173 are used to protect wooden poles
that are constantly or occasionally damp. The standard size is 8mm x 24mm
and fit into a 10mm diameter holes. Plastic bang-in caps are used to cover
the holes.
Wooden poles are susceptible to wet rot and rapid insect attack after the
pressure creosote treatment has diminished, especially in the ground zone,
where splits and shakes allow moisture and air into the core. Boron rods are
used to prevent further decay and extend the working life of the poles.
6.2 Micro-Bore Pressure Sensing Drill (Resistograph)
UK Power Networks is pioneering the use of the Micro-Bore Pressure
Sensing Drill (Figure 30), a technique that can accurately record the internal
condition of a wood pole, with the ability to undertake below-ground condition
assessment of the wood without the need to excavate.

Asset Stewardship Report 2014 Working draft v0.1 SPN Wood Poles and Conductors Version 2 All of the cost numbers displayed in this document are before the application of on-going efficiencies and real price effects.
UK Power Networks (Operations) Limited. Registered in England and Wales. Registered No. 3870728. Registered Office: Newington House, 237 Southwark Bridge Road, London, SE1 6NP 44
Figure 30 – Micro-bore pressure sensing drill in use and output information
6.3 Pole Saver
This is a wood pole rot mitigation application, as shown in Figure 31, in the
form of a moisture barrier wrap installed at ground level on new poles. One
long-term benefit is that it improves the life of the AC500 preservative (used
on green poles) beyond that of the traditional creosoted option.
Figure 31 – Pole saver installed on a wood pole

Asset Stewardship Report 2014 Working draft v0.1 SPN Wood Poles and Conductors Version 2 All of the cost numbers displayed in this document are before the application of on-going efficiencies and real price effects.
UK Power Networks (Operations) Limited. Registered in England and Wales. Registered No. 3870728. Registered Office: Newington House, 237 Southwark Bridge Road, London, SE1 6NP 45
6.4 Pole Brace
On a pole that still has good residual strength across the majority of the pole,
but requires additional mechanical support at the base, a single galvanised
metal pole brace is installed and fixed to the butt with coach screws. The
brace extends below ground level by three feet and above ground by a similar
height. The brace provides sufficient support to the pole so that it does not
need to be changed. The amount of pole rot would be isolated to a part of the
pole and this type of mitigation is intended to provide additional support, not
residual strength.
Figure 32 – Pole brace installed
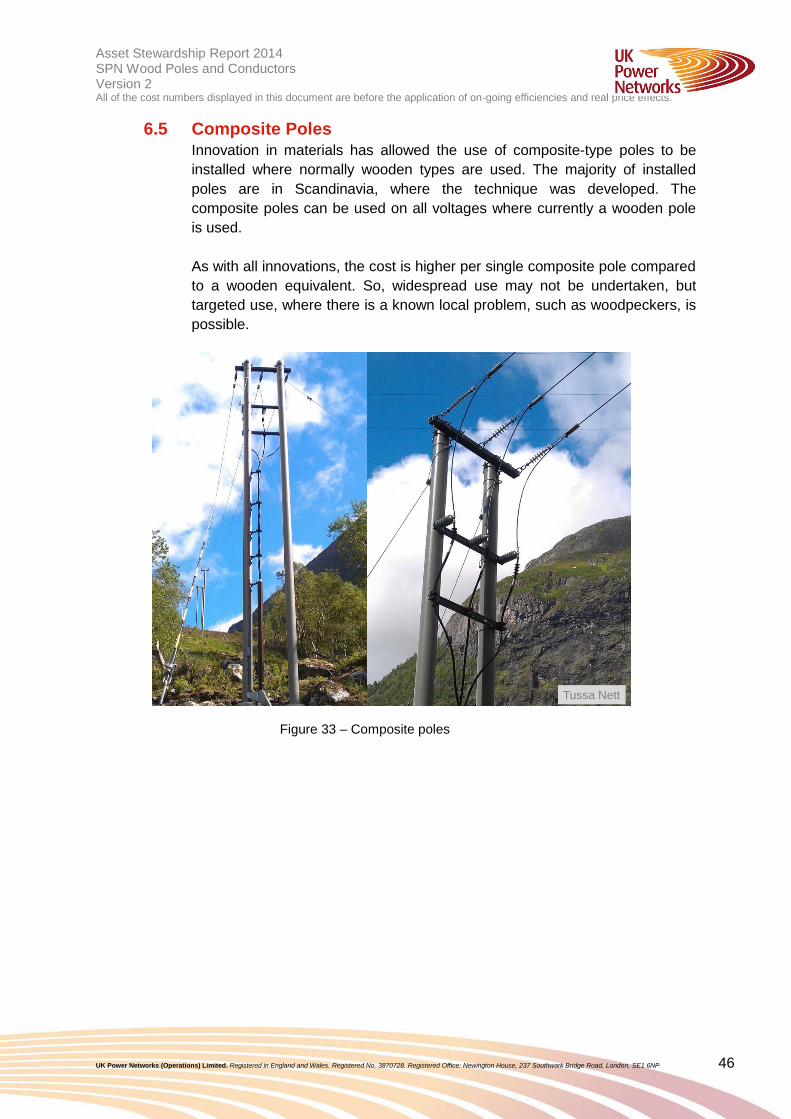
Asset Stewardship Report 2014 Working draft v0.1 SPN Wood Poles and Conductors Version 2 All of the cost numbers displayed in this document are before the application of on-going efficiencies and real price effects.
UK Power Networks (Operations) Limited. Registered in England and Wales. Registered No. 3870728. Registered Office: Newington House, 237 Southwark Bridge Road, London, SE1 6NP 46
6.5 Composite Poles
Innovation in materials has allowed the use of composite-type poles to be
installed where normally wooden types are used. The majority of installed
poles are in Scandinavia, where the technique was developed. The
composite poles can be used on all voltages where currently a wooden pole
is used.
As with all innovations, the cost is higher per single composite pole compared
to a wooden equivalent. So, widespread use may not be undertaken, but
targeted use, where there is a known local problem, such as woodpeckers, is
possible.
Tussa Nett
Figure 33 – Composite poles

Asset Stewardship Report 2014 Working draft v0.1 SPN Wood Poles and Conductors Version 2 All of the cost numbers displayed in this document are before the application of on-going efficiencies and real price effects.
UK Power Networks (Operations) Limited. Registered in England and Wales. Registered No. 3870728. Registered Office: Newington House, 237 Southwark Bridge Road, London, SE1 6NP 47
6.6 Woodpecker Mitigation
Damage to wooden poles by woodpeckers generally occurs six feet above
ground level and all the way to the top of the pole. It is generally accepted
that, while 25% of the pole above six feet can be lost to woodpecker damage,
there needs to be some intervention to avert any associated rot that may be
caused due to untreated wood being exposed to the elements.
Materials are continually being developed that fill the hole and provide
sufficient mechanical strength to a pole damaged by woodpeckers. The most
common type of infill material is resin-based. There is also some thought that
the woodpeckers are attracted to certain poles because they vibrate at a
frequency similar to where mites nest. Where this occurs, the previously
mentioned composite pole may prove to be the mitigation.
Figure 34 – Woodpecker damage on a HV wooden pole
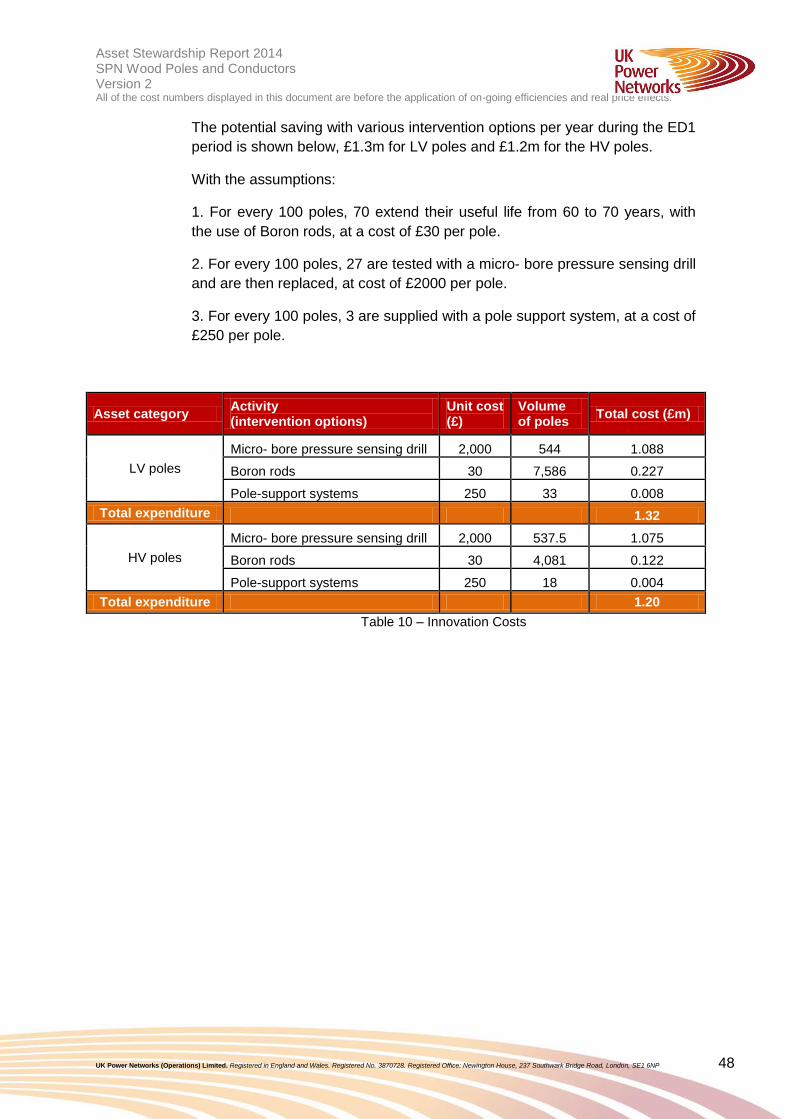
Asset Stewardship Report 2014 Working draft v0.1 SPN Wood Poles and Conductors Version 2 All of the cost numbers displayed in this document are before the application of on-going efficiencies and real price effects.
UK Power Networks (Operations) Limited. Registered in England and Wales. Registered No. 3870728. Registered Office: Newington House, 237 Southwark Bridge Road, London, SE1 6NP 48
The potential saving with various intervention options per year during the ED1
period is shown below, £1.3m for LV poles and £1.2m for the HV poles.
With the assumptions:
1. For every 100 poles, 70 extend their useful life from 60 to 70 years, with
the use of Boron rods, at a cost of £30 per pole.
2. For every 100 poles, 27 are tested with a micro- bore pressure sensing drill
and are then replaced, at cost of £2000 per pole.
3. For every 100 poles, 3 are supplied with a pole support system, at a cost of
£250 per pole.
Asset category Activity (intervention options)
Unit cost (£)
Volume of poles
Total cost (£m)
LV poles
Micro- bore pressure sensing drill 2,000 544 1.088
Boron rods 30 7,586 0.227
Pole-support systems 250 33 0.008
Total expenditure 1.32
HV poles
Micro- bore pressure sensing drill 2,000 537.5 1.075
Boron rods 30 4,081 0.122
Pole-support systems 250 18 0.004
Total expenditure 1.20
Table 10 – Innovation Costs

Asset Stewardship Report 2014 Working draft v0.1 SPN Wood Poles and Conductors Version 2 All of the cost numbers displayed in this document are before the application of on-going efficiencies and real price effects.
UK Power Networks (Operations) Limited. Registered in England and Wales. Registered No. 3870728. Registered Office: Newington House, 237 Southwark Bridge Road, London, SE1 6NP 49
7.0 ED1 Expenditure Requirements for Wood Poles and Conductors
7.1 Method Figure 35 shows an overview of the method used to construct the ED1 NLRE
investment plans.
Asset Heath
Modelling
Future HI Profile
End of DPCR5
Asset Health
Modelling
Future HI Profile
End of RIIO-ED1
Business
Objective
Maintain Constant
Level of Network
Risk
Calculate Volume
of Interventions
Required
Identify Preferred
Intervention
Options
LRE Expenditure
Plans Produced
Asset Health/
Criticality
Identify Named
Schemes
Stakeholder
Engagement
Maintenance
Engineers
Infrastructure
Planning
Investment
Delivery
Optimized NLRE
Expenditure Plan
Figure 35 – Constructing the NLRE plan
7.2 Constructing the Plan
7.2.1 Approach to network risk – keeping HI4/5 constant
The business objective throughout the planning process for ED1 NLRE was
to maintain an approximately constant level of risk within each asset category.
To achieve this, the ARP model was used to determine the HI profiles at the
end of DPCR5 and the end of ED1 to project how the number of HI4s and
HI5s would increase without investment. This provided the basis for the
volume of interventions required during ED1.

Asset Stewardship Report 2014 Working draft v0.1 SPN Wood Poles and Conductors Version 2 All of the cost numbers displayed in this document are before the application of on-going efficiencies and real price effects.
UK Power Networks (Operations) Limited. Registered in England and Wales. Registered No. 3870728. Registered Office: Newington House, 237 Southwark Bridge Road, London, SE1 6NP 50
7.2.2 Optimising the plan
Internal stakeholder engagement was an important part of the process to
finalise the ED1 plan. This provided another way of ensuring that the data
being used in the ARP model reflected stakeholders’ own assessments of the
assets condition. There was also detailed consultation with those involved in
constructing the ED1 LRE expenditure plans to ensure the optimal investment
for maximum achievement.
7.3 Additional Considerations If during scheduled work, engineers identify a need for further maintenance
work on a pole, they will consider carrying out this additional unplanned work
there and then, so that there is no need for a revisit. Other considerations
may follow the defect identification and inspector interventions.

Asset Stewardship Report 2014 Working draft v0.1 SPN Wood Poles and Conductors Version 2 All of the cost numbers displayed in this document are before the application of on-going efficiencies and real price effects.
UK Power Networks (Operations) Limited. Registered in England and Wales. Registered No. 3870728. Registered Office: Newington House, 237 Southwark Bridge Road, London, SE1 6NP 51
7.4 Asset Volumes and Expenditure [RIGs References] The proposed asset replacement and retrofit volumes for ED1 are shown in
the Figures 36-41, along with volumes for DPCR4, DPCR5 and ED2 for
comparison. The ED2 figures shown in the charts have been derived from
age-based modelling. Further work will be done in ED1 to explore additional
intervention options that can be used to extend asset life. Intervention
volumes can be found in more detail in Appendix 5.
Figure 36 – 33kV wood poles intervention volumes Sources :
DPCR4 & DPCR5 FBPQ - Table NL3 (DPCR5 FBPQ) DPCR5 (First three years) - 2013/2014 RIGS CV3 table DPCR5 (Last Two years) - 2013/2014 RIGS CV3 table ED1 - 2013/2014 RIGS CV3 table ED2 - From Age-Based Analysis
Figure 36 shows how the 33KV poles significantly increases over the ED2
period due to ageing population and the large number of decayed poles
identified .There are currently 304 ‘D’ poles and 262 ‘S’ poles in SPN. We
estimate that we will replace 223 poles per year are planned for replacement
during the ED2 period.
It is expected that ED2 numbers will reduce by using the proposed
interventions as shown in table 8.
0
50
100
150
200
250
33 KV Poles - Intervention Volumes
33KV Wood Poles FBPQ
DPCR4 DPCR5 ED1 ED2

Asset Stewardship Report 2014 Working draft v0.1 SPN Wood Poles and Conductors Version 2 All of the cost numbers displayed in this document are before the application of on-going efficiencies and real price effects.
UK Power Networks (Operations) Limited. Registered in England and Wales. Registered No. 3870728. Registered Office: Newington House, 237 Southwark Bridge Road, London, SE1 6NP 52
Figure 37 – Proposed expenditure for 33kV poles (£m) Sources: DPCR4 & DPCR5 FBPQ - Table NL1 (DPCR5 FBPQ) DPCR5 (First three years) - 2013/2014 RIGS CV3 table DPCR5 (Last Two years) – 14thJune NAMP (Table JLI) ED1 – 19th February NAMP (Table J Less Indirect) ED2 - From Age-Based Analysis * UCI
As shown in Figure 37, the expenditure increases significantly over ED1. This
is due to high numbers of poles commissioned during the period 1963 –1970
(as shown in Figure 1) of section 2 will reach their end of life by the end of
ED1.
0.00
0.20
0.40
0.60
0.80
1.00
1.20
1.40
20
06
20
08
20
10
20
12
20
14
20
16
20
18
20
20
20
22
20
24
20
26
20
28
20
30
Proposed Expenditure 33 KV Wood Pole £m)
33 KV Wood Pole FBPQ
DPCR4 DPCR5 ED1 ED2

Asset Stewardship Report 2014 Working draft v0.1 SPN Wood Poles and Conductors Version 2 All of the cost numbers displayed in this document are before the application of on-going efficiencies and real price effects.
UK Power Networks (Operations) Limited. Registered in England and Wales. Registered No. 3870728. Registered Office: Newington House, 237 Southwark Bridge Road, London, SE1 6NP 53
Figure 38 – Intervention volumes for HV wood poles Sources :
DPCR4 & DPCR5 FBPQ - Table NL3 (DPCR5 FBPQ) DPCR5 (First three years) - 2013/2014 RIGS CV3 table DPCR5 (Last Two years) - 2013/2014 RIGS CV3 table ED1 - 2013/2014 RIGS CV3 table ED2 - From Age-Based Analysis
The trend shows HV pole volumes are high compared with historic
achievement, resulting in a large step change into ED2. This is due to a
number of ‘D’ and ‘S’ poles – shown in Table 10.There are currently 1,491 ‘D’
poles and 1387 ‘S’ poles in SPN ,ED2 volumes been (942) set to manage the
outstanding ‘D ‘ poles and emerging ‘D ‘ poles in Ellipse.
0
100
200
300
400
500
600
700
800
900
1000
HV Poles - Intervention Volumes
HV Wood Poles FBPQ
DPCR4 DPCR5 ED1 ED2
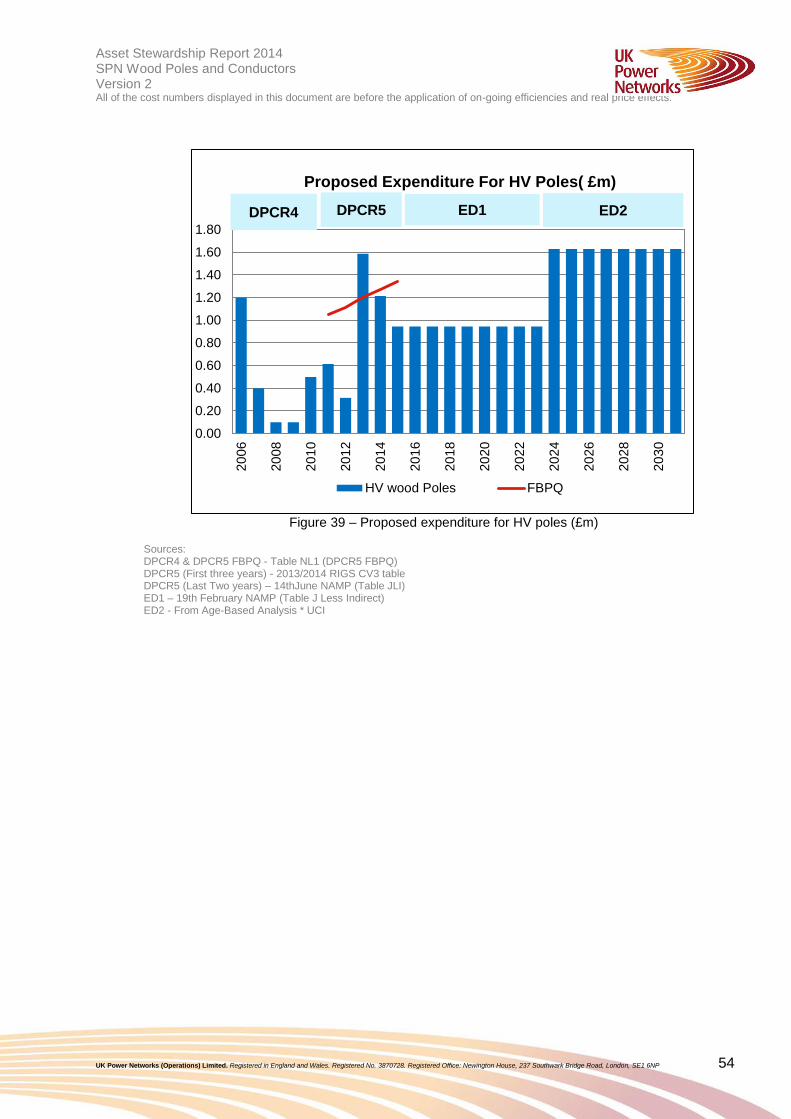
Asset Stewardship Report 2014 Working draft v0.1 SPN Wood Poles and Conductors Version 2 All of the cost numbers displayed in this document are before the application of on-going efficiencies and real price effects.
UK Power Networks (Operations) Limited. Registered in England and Wales. Registered No. 3870728. Registered Office: Newington House, 237 Southwark Bridge Road, London, SE1 6NP 54
Figure 39 – Proposed expenditure for HV poles (£m)
Sources: DPCR4 & DPCR5 FBPQ - Table NL1 (DPCR5 FBPQ) DPCR5 (First three years) - 2013/2014 RIGS CV3 table DPCR5 (Last Two years) – 14thJune NAMP (Table JLI) ED1 – 19th February NAMP (Table J Less Indirect) ED2 - From Age-Based Analysis * UCI
0.00
0.20
0.40
0.60
0.80
1.00
1.20
1.40
1.60
1.8020
06
20
08
20
10
20
12
20
14
20
16
20
18
20
20
20
22
20
24
20
26
20
28
20
30
Proposed Expenditure For HV Poles( £m)
HV wood Poles FBPQ
DPCR4 DPCR5 ED1 ED2
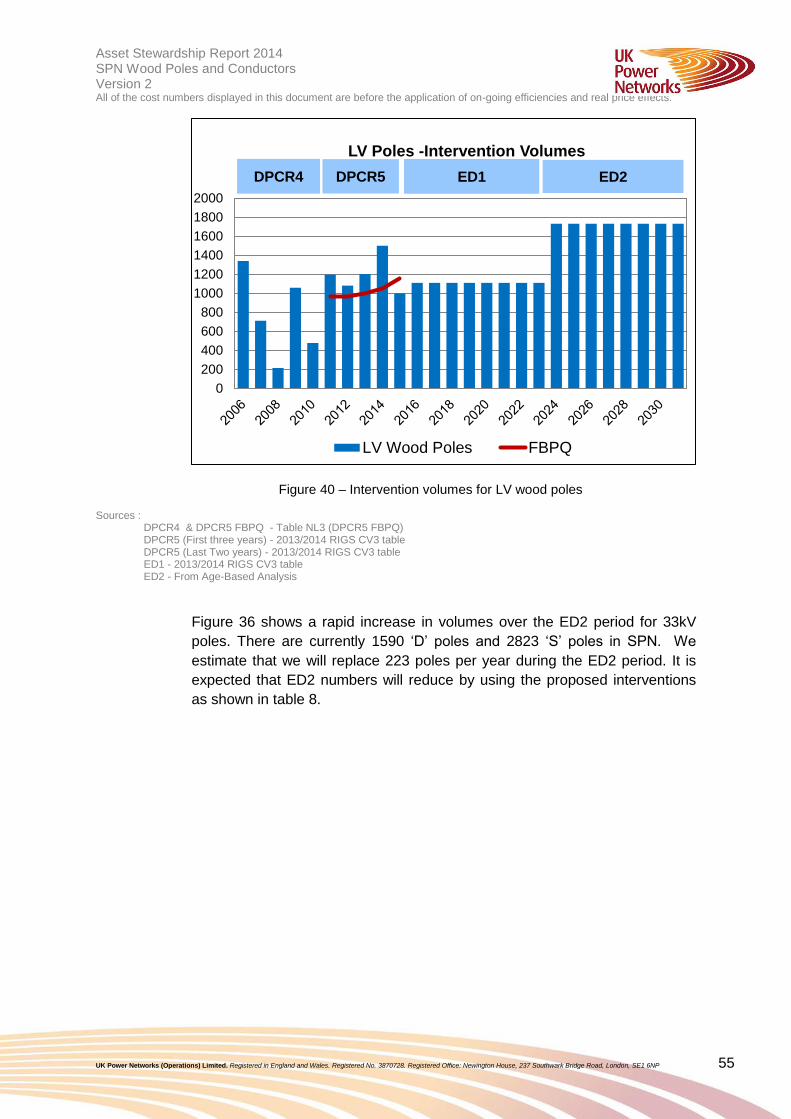
Asset Stewardship Report 2014 Working draft v0.1 SPN Wood Poles and Conductors Version 2 All of the cost numbers displayed in this document are before the application of on-going efficiencies and real price effects.
UK Power Networks (Operations) Limited. Registered in England and Wales. Registered No. 3870728. Registered Office: Newington House, 237 Southwark Bridge Road, London, SE1 6NP 55
Figure 40 – Intervention volumes for LV wood poles Sources :
DPCR4 & DPCR5 FBPQ - Table NL3 (DPCR5 FBPQ) DPCR5 (First three years) - 2013/2014 RIGS CV3 table DPCR5 (Last Two years) - 2013/2014 RIGS CV3 table ED1 - 2013/2014 RIGS CV3 table ED2 - From Age-Based Analysis
Figure 36 shows a rapid increase in volumes over the ED2 period for 33kV
poles. There are currently 1590 ‘D’ poles and 2823 ‘S’ poles in SPN. We
estimate that we will replace 223 poles per year during the ED2 period. It is
expected that ED2 numbers will reduce by using the proposed interventions
as shown in table 8.
0
200
400
600
800
1000
1200
1400
1600
1800
2000
LV Poles -Intervention Volumes
LV Wood Poles FBPQ
DPCR4 DPCR5 ED1 ED2

Asset Stewardship Report 2014 Working draft v0.1 SPN Wood Poles and Conductors Version 2 All of the cost numbers displayed in this document are before the application of on-going efficiencies and real price effects.
UK Power Networks (Operations) Limited. Registered in England and Wales. Registered No. 3870728. Registered Office: Newington House, 237 Southwark Bridge Road, London, SE1 6NP 56
Figure 41 – Proposed expenditure for LV poles (£m)
Sources: DPCR4 & DPCR5 FBPQ - Table NL1 (DPCR5 FBPQ) DPCR5 (First three years) - 2013/2014 RIGS CV3 table DPCR5 (Last Two years) – 14thJune NAMP (Table JLI) ED1 – 19th February NAMP (Table J Less Indirect) ED2 - From Age-Based Analysis * UCI
The trend shows pole volumes are high compared with historic achievement,
resulting in a large step change into ED2. This is due to a number of ‘D’ and
‘S’ poles – shown in Table 10, as extracted from Ellipse in March 2013.
Asset Category Number Of S Poles Number Of D Poles % Population
S poles D Poles
33 KV Pole 262 304 2% 3%
HV Pole 1387 1491 2% 2%
LV Pole 2823 1590 2% 1%
Table 10 – Number of ‘D’ and ‘S’ poles, March 2013
The increased investment on the pole replacement in ED2 is due to the
ageing population and the large number of decayed poles identified. There
are around 1,590 LV ‘D’ poles and 2,823 ‘S’ poles. We estimate that we will
replace 1,733 poles per year during the ED2 period. There are currently 1,491
‘D’ HV poles and 1,387 ‘S’ HV poles in Ellipse; 942 poles per year are
planned for replacement during the ED2 period. The ED1 volumes have been
set to manage the number of outstanding ‘D’ poles, as well as the new
emerging ‘D’ poles in Ellipse. The increase in volumes is due to the fact we
0.00
0.50
1.00
1.50
2.00
2.50
3.002
00
6
20
08
20
10
20
12
20
14
20
16
20
18
20
20
20
22
20
24
20
26
20
28
20
30
Proposed Expenditure For LV poles (£m)
LV Wood Poles FBPQ
DPCR4 DPCR5 ED1 ED2

Asset Stewardship Report 2014 Working draft v0.1 SPN Wood Poles and Conductors Version 2 All of the cost numbers displayed in this document are before the application of on-going efficiencies and real price effects.
UK Power Networks (Operations) Limited. Registered in England and Wales. Registered No. 3870728. Registered Office: Newington House, 237 Southwark Bridge Road, London, SE1 6NP 57
will be removing a high number of poles that were commissioned between
1955–1970 (as shown in Figure 2, 4 and 5) of section 2 that will reach their
end of life by the end of ED1. This is the worst case scenario considered, it is
expected that ED2 numbers will reduce by using the proposed intervention
options as detailed in section 6.

Asset Stewardship Report 2014 Working draft v0.1 SPN Wood Poles and Conductors Version 2 All of the cost numbers displayed in this document are before the application of on-going efficiencies and real price effects.
UK Power Networks (Operations) Limited. Registered in England and Wales. Registered No. 3870728. Registered Office: Newington House, 237 Southwark Bridge Road, London, SE1 6NP 58
7.4.1 Proposed intervention volumes and expenditure for conductors
The proposed asset replacement volumes for the ED1 period shown in
Figures 42, 44 and 46, along with the volumes for DPCR4 and DPCR5 and
ED2 for comparison. It is estimated that 50% of the LV ABC scheme will have
an impact on reducing ESQCR issues.
Figure 42 – Intervention volumes for HV OHL conductors
Sources : DPCR4 & DPCR5 FBPQ - Table NL3 (DPCR5 FBPQ) DPCR5 (First three years) - 2013/2014 RIGS CV3 table DPCR5 (Last Two years) - 2013/2014 RIGS CV3 table ED1 - 2013/2014 RIGS CV3 table ED2 - From Age-Based Analysis
0
20
40
60
80
100
120
140
160
180
200
20
06
20
07
20
08
20
09
20
10
20
11
20
12
20
13
20
14
20
15
20
16
20
17
20
18
20
19
20
20
20
21
20
22
20
23
20
24
20
25
20
26
20
27
20
28
20
29
20
30
20
31
HV OHL Conductor - Intervention Volumes
FBPQ
DPCR4 DPCR5 ED1 ED2

Asset Stewardship Report 2014 Working draft v0.1 SPN Wood Poles and Conductors Version 2 All of the cost numbers displayed in this document are before the application of on-going efficiencies and real price effects.
UK Power Networks (Operations) Limited. Registered in England and Wales. Registered No. 3870728. Registered Office: Newington House, 237 Southwark Bridge Road, London, SE1 6NP 59
Figure 43 – Proposed expenditure for HV OHL conductors
Sources: DPCR4 & DPCR5 FBPQ - Table NL1 (DPCR5 FBPQ) DPCR5 (First three years) - 2013/2014 RIGS CV3 table DPCR5 (Last Two years) – 14thJune NAMP (Table JLI) ED1 – 19th February NAMP (Table J Less Indirect) ED2 - From Age-Based Analysis * UCI
0
1
2
3
4
5
6
7
8
9
10
20
06
20
08
20
10
20
12
20
14
20
16
20
18
20
20
20
22
20
24
20
26
20
28
20
30
(£m
)
Proposed Expenditure For HV OHL Conductor (£m)
HV OHL Conductor FBPQ
DPCR4 DPCR5 ED1 ED2

Asset Stewardship Report 2014 Working draft v0.1 SPN Wood Poles and Conductors Version 2 All of the cost numbers displayed in this document are before the application of on-going efficiencies and real price effects.
UK Power Networks (Operations) Limited. Registered in England and Wales. Registered No. 3870728. Registered Office: Newington House, 237 Southwark Bridge Road, London, SE1 6NP 60
Figure 44 – Intervention volumes for LV OHL conductor Sources :
DPCR4 & DPCR5 FBPQ - Table NL3 (DPCR5 FBPQ) DPCR5 (First three years) - 2013/2014 RIGS CV3 table DPCR5 (Last Two years) - 2013/2014 RIGS CV3 table ED1 - 2013/2014 RIGS CV3 table ED2 - From Age-Based Analysis
0
100
200
300
400
500
600
2006 2008 2010 2012 2014 2016 2018 2020 2022 2024 2026 2028 2030
LV OHL Conductor-Intervention Volumes
LV OHL Conductor FBPQ
DPCR4 DPCR5 ED1 ED2
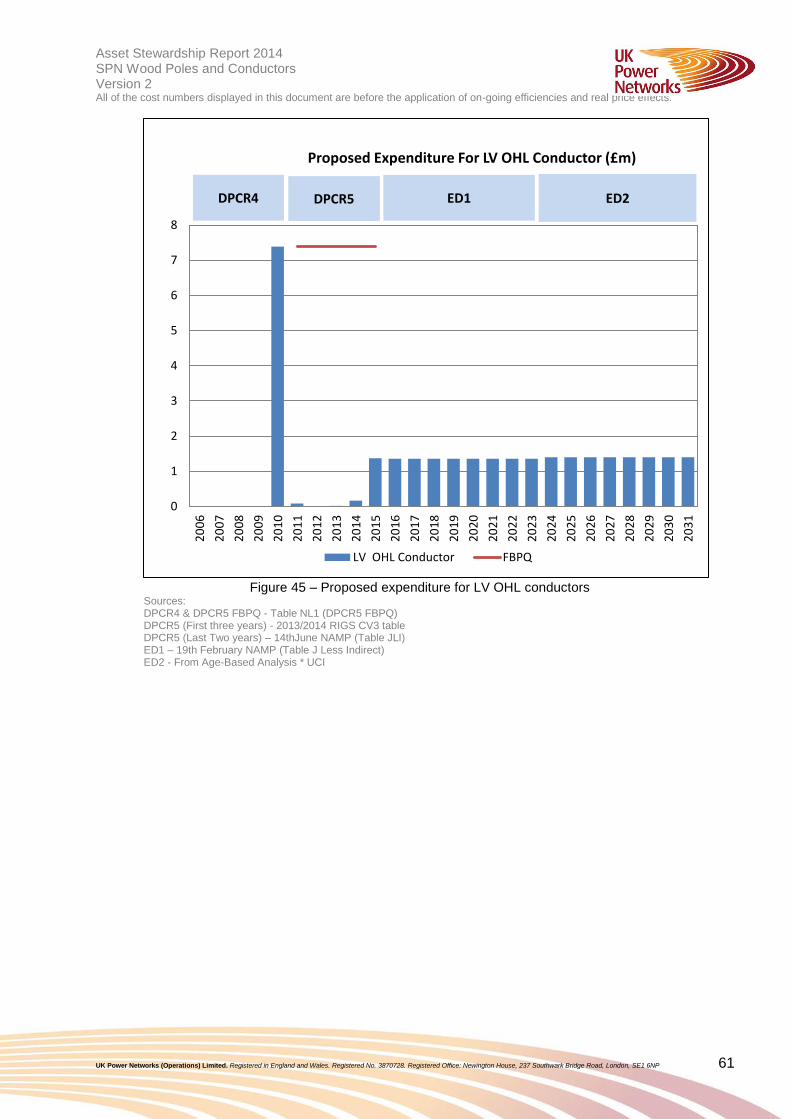
Asset Stewardship Report 2014 Working draft v0.1 SPN Wood Poles and Conductors Version 2 All of the cost numbers displayed in this document are before the application of on-going efficiencies and real price effects.
UK Power Networks (Operations) Limited. Registered in England and Wales. Registered No. 3870728. Registered Office: Newington House, 237 Southwark Bridge Road, London, SE1 6NP 61
Figure 45 – Proposed expenditure for LV OHL conductors
Sources: DPCR4 & DPCR5 FBPQ - Table NL1 (DPCR5 FBPQ) DPCR5 (First three years) - 2013/2014 RIGS CV3 table DPCR5 (Last Two years) – 14thJune NAMP (Table JLI) ED1 – 19th February NAMP (Table J Less Indirect) ED2 - From Age-Based Analysis * UCI
0
1
2
3
4
5
6
7
8
20
06
20
07
20
08
20
09
20
10
20
11
20
12
20
13
20
14
20
15
20
16
20
17
20
18
20
19
20
20
20
21
20
22
20
23
20
24
20
25
20
26
20
27
20
28
20
29
20
30
20
31
Proposed Expenditure For LV OHL Conductor (£m)
LV OHL Conductor FBPQ
DPCR4 DPCR5 ED1 ED2

Asset Stewardship Report 2014 Working draft v0.1 SPN Wood Poles and Conductors Version 2 All of the cost numbers displayed in this document are before the application of on-going efficiencies and real price effects.
UK Power Networks (Operations) Limited. Registered in England and Wales. Registered No. 3870728. Registered Office: Newington House, 237 Southwark Bridge Road, London, SE1 6NP 62
Figure 46 – Intervention volumes for 33kV OHL conductors
Sources : DPCR4 & DPCR5 FBPQ - Table NL3 (DPCR5 FBPQ) DPCR5 (First three years) - 2013/2014 RIGS CV3 table DPCR5 (Last Two years) - 2013/2014 RIGS CV3 table ED1 - 2013/2014 RIGS CV3 table ED2 - From Age-Based Analysis
05
101520253035404550556065707580
20
06
20
07
20
08
20
09
20
10
20
11
20
12
20
13
20
14
20
15
20
16
20
17
20
18
20
19
20
20
20
21
20
22
20
23
20
24
20
25
20
26
20
27
20
28
20
29
20
30
20
31
Intervention Volumes 33 KV OHL Conductor
33KV OHL conductor FBPQ
DPCR4 DPCR5 ED1 ED2
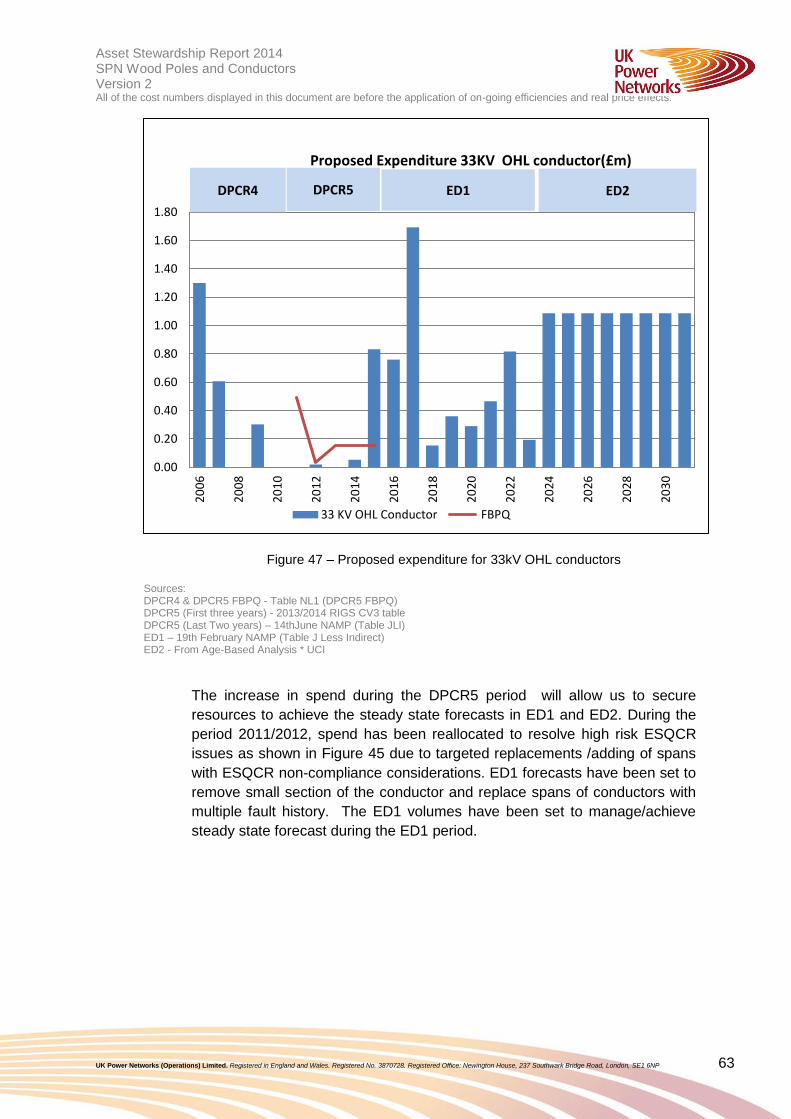
Asset Stewardship Report 2014 Working draft v0.1 SPN Wood Poles and Conductors Version 2 All of the cost numbers displayed in this document are before the application of on-going efficiencies and real price effects.
UK Power Networks (Operations) Limited. Registered in England and Wales. Registered No. 3870728. Registered Office: Newington House, 237 Southwark Bridge Road, London, SE1 6NP 63
Figure 47 – Proposed expenditure for 33kV OHL conductors
Sources: DPCR4 & DPCR5 FBPQ - Table NL1 (DPCR5 FBPQ) DPCR5 (First three years) - 2013/2014 RIGS CV3 table DPCR5 (Last Two years) – 14thJune NAMP (Table JLI) ED1 – 19th February NAMP (Table J Less Indirect) ED2 - From Age-Based Analysis * UCI
The increase in spend during the DPCR5 period will allow us to secure
resources to achieve the steady state forecasts in ED1 and ED2. During the
period 2011/2012, spend has been reallocated to resolve high risk ESQCR
issues as shown in Figure 45 due to targeted replacements /adding of spans
with ESQCR non-compliance considerations. ED1 forecasts have been set to
remove small section of the conductor and replace spans of conductors with
multiple fault history. The ED1 volumes have been set to manage/achieve
steady state forecast during the ED1 period.
0.00
0.20
0.40
0.60
0.80
1.00
1.20
1.40
1.60
1.802
00
6
20
08
20
10
20
12
20
14
20
16
20
18
20
20
20
22
20
24
20
26
20
28
20
30
Proposed Expenditure 33KV OHL conductor(£m)
33 KV OHL Conductor FBPQ
DPCR4 DPCR5 ED1 ED2
Asset Stewardship Report 2014 Working draft v0.1 SPN Wood Poles and Conductors Version 2 All of the cost numbers displayed in this document are before the application of on-going efficiencies and real price effects.
UK Power Networks (Operations) Limited. Registered in England and Wales. Registered No. 3870728. Registered Office: Newington House, 237 Southwark Bridge Road, London, SE1 6NP 64
7.5 Commentary The proposed investment level in ED1 for the replacement of LV, HV and
33kV wood poles in SPN is £71m.
We are currently on target for achieving wood pole replacements by the end
of March 2015. Resource issues in year 2 contributed to work being behind
schedule. However, a rise in contractors is set to increase the number of
resources (SAPs) for the remainder of DPCR5.
HV & LV Poles :
As detailed in the section 7.4 Figure 38 - 41 ,the trend shows HV and LV pole
volumes are high compared with historic achievement. The increased
investment in LV and HV pole replacement in ED1 is due to the ageing
population and the large number of decayed poles identified. There are
currently 1,590 LV ‘D’ poles and 2,823 ‘S’ poles. We estimate that we will
replace 1,733 poles per year during the ED1 period. There are around 1,491
‘D’ HV poles and 1,387 ‘S’ HV poles in Ellipse; 942 poles per year are
planned for replacement during the ED2 period.
The ED1 volumes have been set to manage the number of outstanding ‘D’
poles, as well as the new emerging ‘D’ poles in Ellipse. The increase in
volumes is due to the fact we will be removing a high number of poles that
were commissioned between 1955–1970 (as shown in Figure 2,4 and 5) of
section 2 that will reach their end of life by the end of ED1.
33KV Poles :
As shown in the Figure 36 and Figure 37 the increased investment in 33KV
pole replacement in ED1 is due to the ageing population and the large
number of decayed poles identified. ED1 volumes have been set to manage
the outstanding D poles and we will be removing a high number of poles that
were commissioned between 1955–1970 (as shown in Figure 1,3 and 5) of
section 2 that will reach their end of life by the end of ED1.
This is the worst case scenario considered ,as it is expected that ED1
numbers will come down through the proposed intervention options .As
demonstrated in the section 6 ,with the proposed interventions the modelled
average end of asset life of 70 years is achievable of all wood poles. LV
poles, while of a small size, are no more likely to decay than a much larger
pole.
Asset Stewardship Report 2014 Working draft v0.1 SPN Wood Poles and Conductors Version 2 All of the cost numbers displayed in this document are before the application of on-going efficiencies and real price effects.
UK Power Networks (Operations) Limited. Registered in England and Wales. Registered No. 3870728. Registered Office: Newington House, 237 Southwark Bridge Road, London, SE1 6NP 65
LV Conductors :
The increase in output during DPCR5 allows us to secure resources to
achieve the steady state forecasts in ED1 and ED2. During the DPCR5
period , spend has been reallocated to resolve high risk ESQCR issues as
shown in Figure 44 and 45 due to targeted replacements/adding of spans with
ESQCR non-compliance considerations. The ED1 volumes have been set to
manage /achieve steady state forecast during the ED1 period.
HV Conductors:
ED1 forecasts have been set to remove small section of the conductor and
replace spans of conductors with multiple fault history .
33KV Conductors :
The proposed investment level for the 33KV conductor is high, it is extracted
from ARP as based on the condition and age of the conductors. This will lead
to consequential benefits by resolving some ESQCR non-compliance
including D-poles and associated conductors, tree clearance issues etc.

Asset Stewardship Report 2014 Working draft v0.1 SPN Wood Poles and Conductors Version 2 All of the cost numbers displayed in this document are before the application of on-going efficiencies and real price effects.
UK Power Networks (Operations) Limited. Registered in England and Wales. Registered No. 3870728. Registered Office: Newington House, 237 Southwark Bridge Road, London, SE1 6NP 66
7.6 Sensitivity Analysis And Plan Validation An independent report has been carried out by Decision Lab to understand
how the Health Index profile of assets may change if their average life does
not turn out as predicted. All results are shown below as the percentages of
the population.
7.6.1 33kV wood poles
Average life
change
2015 percentage HI profile
HI1 HI2 HI3 HI4 HI5
-4 7.1 65.9 22.2 3.8 0.9
-2 7.1 73.0 15.5 3.4 0.9
-1 9.1 73.1 14.4 2.4 0.9
0 9.1 74.1 14.3 1.5 0.9
1 9.3 76.2 12.0 1.5 0.9
2 10.3 76.2 11.1 1.5 0.9
4 10.4 79.6 8.0 1.1 0.9
Average life
change
2023 percentage HI profile
HI1 HI2 HI3 HI4 HI5
-4 12.4 46.3 31.8 9.5 0.0
-2 12.4 52.0 30.8 4.9 0.0
-1 12.6 54.9 28.4 4.1 0.0
0 12.6 57.8 25.5 4.0 0.0
1 12.7 62.2 21.3 3.9 0.0
2 12.7 65.3 19.7 2.3 0.0
4 12.7 70.9 16.0 0.4 0.0
Table 12 – Results of sensitivity analysis for EHV poles
In Table 12, each average life change of years +/- 1, 2 and 4 is represented
as a percentage of the current population. With each change in average life,
there is a subsequent movement in the percentage of population in each
Health Index. An average life at 0 represents the current population split
within each Health Index with intervention strategies applied. The two tables
range from the start of ED1 (2015) and the end of ED1 (2023).
These tables show the percentage population movements over the eight-year
period and the impact any change in average life will have on the asset
group’s HI profile.
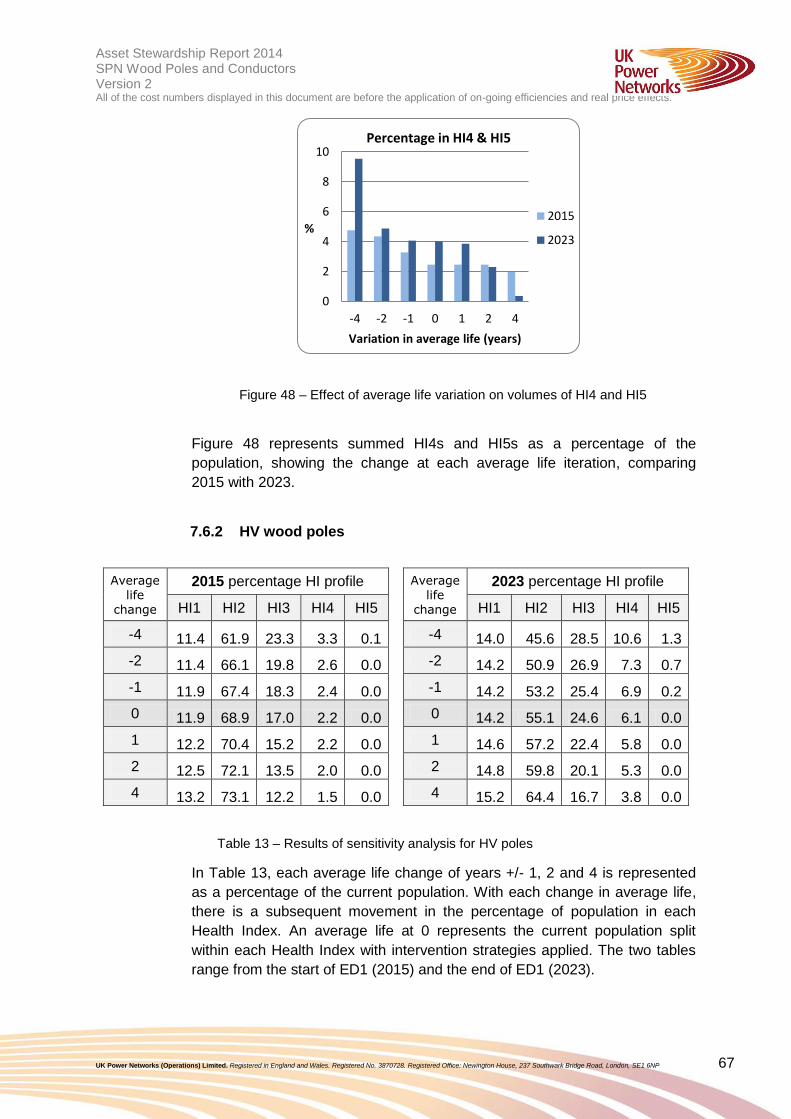
Asset Stewardship Report 2014 Working draft v0.1 SPN Wood Poles and Conductors Version 2 All of the cost numbers displayed in this document are before the application of on-going efficiencies and real price effects.
UK Power Networks (Operations) Limited. Registered in England and Wales. Registered No. 3870728. Registered Office: Newington House, 237 Southwark Bridge Road, London, SE1 6NP 67
Figure 48 – Effect of average life variation on volumes of HI4 and HI5
Figure 48 represents summed HI4s and HI5s as a percentage of the
population, showing the change at each average life iteration, comparing
2015 with 2023.
7.6.2 HV wood poles
Average life
change
2015 percentage HI profile
HI1 HI2 HI3 HI4 HI5
-4 11.4 61.9 23.3 3.3 0.1
-2 11.4 66.1 19.8 2.6 0.0
-1 11.9 67.4 18.3 2.4 0.0
0 11.9 68.9 17.0 2.2 0.0
1 12.2 70.4 15.2 2.2 0.0
2 12.5 72.1 13.5 2.0 0.0
4 13.2 73.1 12.2 1.5 0.0
Average life
change
2023 percentage HI profile
HI1 HI2 HI3 HI4 HI5
-4 14.0 45.6 28.5 10.6 1.3
-2 14.2 50.9 26.9 7.3 0.7
-1 14.2 53.2 25.4 6.9 0.2
0 14.2 55.1 24.6 6.1 0.0
1 14.6 57.2 22.4 5.8 0.0
2 14.8 59.8 20.1 5.3 0.0
4 15.2 64.4 16.7 3.8 0.0
Table 13 – Results of sensitivity analysis for HV poles
In Table 13, each average life change of years +/- 1, 2 and 4 is represented
as a percentage of the current population. With each change in average life,
there is a subsequent movement in the percentage of population in each
Health Index. An average life at 0 represents the current population split
within each Health Index with intervention strategies applied. The two tables
range from the start of ED1 (2015) and the end of ED1 (2023).
0
2
4
6
8
10
-4 -2 -1 0 1 2 4
%
Variation in average life (years)
Percentage in HI4 & HI5
2015
2023

Asset Stewardship Report 2014 Working draft v0.1 SPN Wood Poles and Conductors Version 2 All of the cost numbers displayed in this document are before the application of on-going efficiencies and real price effects.
UK Power Networks (Operations) Limited. Registered in England and Wales. Registered No. 3870728. Registered Office: Newington House, 237 Southwark Bridge Road, London, SE1 6NP 68
These tables show the percentage population movements over the eight-year
period and the impact any change in average life will have on the asset
group’s HI profile.
Figure 49 – Effect of average life variation on volumes of HI4 and HI5
7.6.3 LV wood poles
Average
life change
2015 percentage HI profile
HI1 HI2 HI3 HI4 HI5
-4 16.2 52.7 26.8 4.3 0.0
-2 17.1 55.7 23.4 3.8 0.0
-1 17.4 57.2 21.8 3.6 0.0
0 17.4 58.5 20.8 3.2 0.0
1 19.1 58.4 19.3 3.2 0.0
2 19.4 59.9 17.7 3.0 0.0
4 20.1 61.3 16.6 2.0 0.0
Average
life change
2023 percentage HI profile
HI1 HI2 HI3 HI4 HI5
-4 19.6 39.8 28.4 12.2 0.0
-2 20.1 42.4 28.5 8.9 0.0
-1 20.6 44.6 26.7 8.1 0.0
0 20.7 47.4 25.0 7.0 0.0
1 21.1 48.9 23.2 6.7 0.0
2 21.2 51.9 20.8 6.1 0.0
4 21.4 55.0 18.4 5.2 0.0
Table 14 – Results of sensitivity analysis for LV poles
In Table 14, each average life change of years +/- 1, 2 and 4 is represented
as a percentage of the current population. With each change in average life,
there is a subsequent movement in the percentage of population in each
Health Index. An average life at 0 represents the current population split
within each Health Index with intervention strategies applied. The two tables
range from the start of ED1 (2015) and the end of ED1 (2023).
0
2
4
6
8
10
12
-4 -2 -1 0 1 2 4
%
Variation in average life (years)
Percentage in HI4 & HI5
2015
2023

Asset Stewardship Report 2014 Working draft v0.1 SPN Wood Poles and Conductors Version 2 All of the cost numbers displayed in this document are before the application of on-going efficiencies and real price effects.
UK Power Networks (Operations) Limited. Registered in England and Wales. Registered No. 3870728. Registered Office: Newington House, 237 Southwark Bridge Road, London, SE1 6NP 69
These tables show the percentage population movements over the eight-year
period and the impact any change in average life will have on the asset
group’s HI profile.
Figure 50 – Effect of average life variation on volumes of HI4s and HI5s
0
2
4
6
8
10
12
14
-4 -2 -1 0 1 2 4
%
Variation in average life (years)
Percentage in HI4 & HI5
2015
2023

Asset Stewardship Report 2014 Working draft v0.1 SPN Wood Poles and Conductors Version 2 All of the cost numbers displayed in this document are before the application of on-going efficiencies and real price effects.
UK Power Networks (Operations) Limited. Registered in England and Wales. Registered No. 3870728. Registered Office: Newington House, 237 Southwark Bridge Road, London, SE1 6NP 70
7.7 Model Testing The ARP model had undergone rigorous testing to ensure it met the defined
requirements prior to acceptance. There were four distinct subsets to the
testing process: algorithm testing, software testing, data flow testing and user
and methodology testing. Each test is designed to capture potential errors in
specific parts of the system. The completion of all tests provides assurance
that a thorough evaluation has been carried out to ensure correctness and
validity of the outputs.
7.7.1 Algorithm testing
The ARP model comprises a set of algorithms implemented within the
database code. The tester in a spreadsheet mimicked each algorithm with the
results compared with those of the ARP algorithm for a given set of test data
inputs. The test data comprised data within normal expected ranges, low-
value numbers, high-value numbers, floating point numbers, integers,
negative numbers and unpopulated values. In order to pass the test, all
results from the ARP algorithm are required to match the spreadsheet
calculation.
7.7.2 Software testing
A number of new software functions used in the model required testing to
ensure they performed correctly. A test script was created to identify the
functional requirement, the method to carry out the function and the expected
outcome. In order to pass the test, the achieved outcome had to match the
expected outcome.
7.7.3 Data flow testing
Data flow testing was carried out to ensure that data presented in the ARP
upload files passes into the model correctly. Data counts from the ARP model
upload files were compared with data successfully uploaded to the model. To
pass the test, counts of the data had to match within specified tolerances.
7.7.4 User and methodology testing
The aim of the user and methodology testing is to ensure that the models are
fit for purpose. A test script has been created to check that displays operate
correctly and that outputs respond appropriately to changes in calibration
settings.

Asset Stewardship Report 2014 Working draft v0.1 SPN Wood Poles and Conductors Version 2 All of the cost numbers displayed in this document are before the application of on-going efficiencies and real price effects.
UK Power Networks (Operations) Limited. Registered in England and Wales. Registered No. 3870728. Registered Office: Newington House, 237 Southwark Bridge Road, London, SE1 6NP 71
7.8 Network Risk As described in section 4 of this document, the ARP model (and in-house
criticality modelling techniques for non-ARP assets) has the capability of
producing a criticality index (C1-4) for each individual asset, this is a new
concept and the methodology is under development. The criticality index can
be used with the health index to give an indication of the level of risk that can
be seen on the network. Table below shows the health and criticality matrix
for 2015 and 2023 with investment.
Source: Strategy Decision for the RIIO-ED1 Electricity Distribution Price
Control – Reliability and Safety 04/03/2012. Criticality & Health Index Working
Group – Recommendations for Common Principles for Criticality Index
Measures 13/12/2012.
33 KV Poles :
Asset categories Units
Estimated Asset Health and Criticality Profile 2015 with Investment Asset
Register
Asset health index
2015
HI1 HI2 HI3 HI4 HI5
33 KV Poles
Low No. Assets 61 499 96 11 6 673
Average No. Assets 3 37 3 0 0 43
High No. Assets 952 7695 1492 161 97 10,397 Very High No. Assets 58 473 91 10 6 638
Table 13: Asset Health and Criticality 2015 Source ARP Model
( HI :25th July 2012 ,Criticality : 27th November 2012)
Asset categories Units
Estimated Asset Health and Criticality Profile 2023 with Investment Asset
Register
Asset health index
2023
HI1 HI2 HI3 HI4 HI5
33 KV Poles
Low No. Assets 69 279 245 80 0 673
Average No. Assets 3 19 16 5 0 43
High No. Assets 1247 4313 3785 1052 0 10,397 Very High No. Assets 73 264 232 69 0 638
Table 14: Asset Health and Criticality 2023 Source ARP Model ( HI :25th July 2012 ,Criticality : 27th
November 2012)
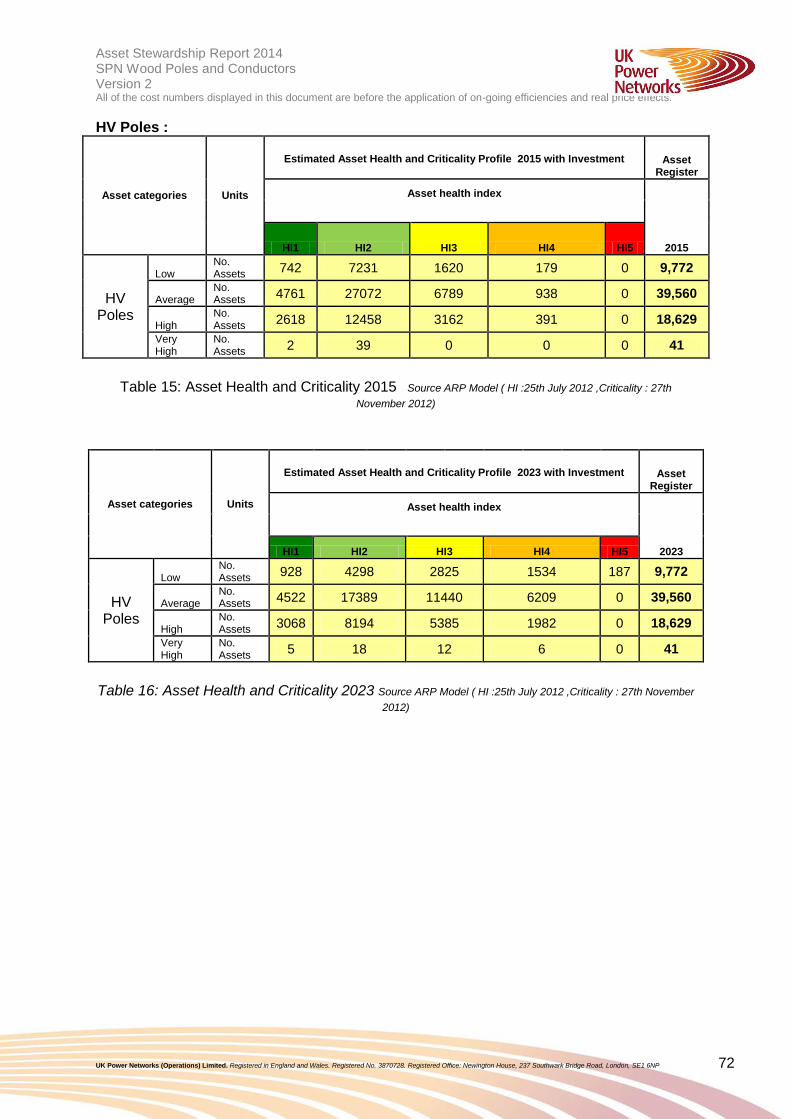
Asset Stewardship Report 2014 Working draft v0.1 SPN Wood Poles and Conductors Version 2 All of the cost numbers displayed in this document are before the application of on-going efficiencies and real price effects.
UK Power Networks (Operations) Limited. Registered in England and Wales. Registered No. 3870728. Registered Office: Newington House, 237 Southwark Bridge Road, London, SE1 6NP 72
HV Poles :
Asset categories Units
Estimated Asset Health and Criticality Profile 2015 with Investment Asset Register
Asset health index
2015
HI1 HI2 HI3 HI4 HI5
HV Poles
Low No. Assets
742 7231 1620 179 0 9,772
Average No. Assets
4761 27072 6789 938 0 39,560
High No. Assets
2618 12458 3162 391 0 18,629
Very High
No. Assets
2 39 0 0 0 41
Table 15: Asset Health and Criticality 2015 Source ARP Model ( HI :25th July 2012 ,Criticality : 27th
November 2012)
Asset categories Units
Estimated Asset Health and Criticality Profile 2023 with Investment Asset Register
Asset health index
2023
HI1 HI2 HI3 HI4 HI5
HV Poles
Low No. Assets
928 4298 2825 1534 187 9,772
Average No. Assets
4522 17389 11440 6209 0 39,560
High No. Assets
3068 8194 5385 1982 0 18,629
Very High
No. Assets
5 18 12 6 0 41
Table 16: Asset Health and Criticality 2023 Source ARP Model ( HI :25th July 2012 ,Criticality : 27th November
2012)

Asset Stewardship Report 2014 Working draft v0.1 SPN Wood Poles and Conductors Version 2 All of the cost numbers displayed in this document are before the application of on-going efficiencies and real price effects.
UK Power Networks (Operations) Limited. Registered in England and Wales. Registered No. 3870728. Registered Office: Newington House, 237 Southwark Bridge Road, London, SE1 6NP 73
LV Poles :
Asset categories Units
Estimated Asset Health and Criticality Profile 2015 with Intervention Asset
Register
Asset health index
2015
HI1 HI2 HI3 HI4 HI5
LV Poles
Low No. Assets
0 0 0 0 0 -
Average No. Assets
21863 72930 26079 4097 0 124,969
High No. Assets
143 852 189 0 0 1,184
Very High
No. Assets
0 1 1 0 0 2
Table 17: Asset Health and Criticality 2015 Source ARP Model ( HI :25th July 2012 ,Criticality : 27th November
2012)
Asset categories Units
Estimated Asset Health and Criticality Profile 2023 with Intervention Asset Register
Asset health index
2023
HI1 HI2 HI3 HI4 HI5
LV Poles
Low No. Assets
0 0 0 0 0 -
Average No. Assets
22294 48074 35619 18524 458 124,969
High No. Assets
230 456 337 161 0 1,184
Very High
No. Assets
0 1 1 0 0 2
Table 18: Asset Health and Criticality 2023 Source ARP Model ( HI :25th July 2012 ,Criticality : 27th November
2012)

Asset Stewardship Report 2014 Working draft v0.1 SPN Wood Poles and Conductors Version 2 All of the cost numbers displayed in this document are before the application of on-going efficiencies and real price effects.
UK Power Networks (Operations) Limited. Registered in England and Wales. Registered No. 3870728. Registered Office: Newington House, 237 Southwark Bridge Road, London, SE1 6NP 74
8.0 Deliverability
The volumes of work proposed in ED1 are comparable to that achieved in
DPCR4 and are spread fairly evenly across the network, and so access and
outage availability issues are not anticipated.
Hired contractors and current framework contracts are in place with a view to
delivering the targets through ED1.
The various innovations for extending pole serviceability will be incorporated
into the existing resource (inspectors), and contractors will undertake
specialised activities.
All ED1 projects have been created in the Network Asset Management Plan
(NAMP). This application costs the project based on compatible units and
automatically creates an entry in the NAMP. The majority of projects are for
specifically named schemes, but where this is not possible, a financial
provision has been created.

Asset Stewardship Report 2014 Working draft v0.1 SPN Wood Poles and Conductors Version 2 All of the cost numbers displayed in this document are before the application of on-going efficiencies and real price effects.
UK Power Networks (Operations) Limited. Registered in England and Wales. Registered No. 3870728. Registered Office: Newington House, 237 Southwark Bridge Road, London, SE1 6NP 75
Appendix 1 – Age Profiles
Figure 51 – 132kV Wood Pole Age Profile
(Source – RIGS 2012 CV3 Table V5)
Figure 52 – 33kV(EHV) Wood Pole Age Profile
(Source – RIGS 2012 CV3 Table V5)
0
200
400
600
800
1000
1200
1400
19
01
19
37
19
42
19
45
19
49
19
52
19
55
19
58
19
61
19
64
19
67
19
70
19
73
19
76
19
79
19
82
19
85
19
88
19
91
19
94
19
97
20
00
20
03
20
06
20
09
20
12
Co
un
t o
f assets
Year of manufacture
33kV wood poles – age profile

Asset Stewardship Report 2014 Working draft v0.1 SPN Wood Poles and Conductors Version 2 All of the cost numbers displayed in this document are before the application of on-going efficiencies and real price effects.
UK Power Networks (Operations) Limited. Registered in England and Wales. Registered No. 3870728. Registered Office: Newington House, 237 Southwark Bridge Road, London, SE1 6NP 76
Figure 53 – 33kV(EHV) Conductor Age Profile
(Source – RIGS 2012 CV3 Table V5)
Figure 54 – HV Wood Pole Age Profile
(Source – RIGS 2012 CV3 Table V5)
0
200
400
600
800
1000
1200
140019
01
19
37
19
42
19
45
19
49
19
52
19
55
19
58
19
61
19
64
19
67
19
70
19
73
19
76
19
79
19
82
19
85
19
88
19
91
19
94
19
97
20
00
20
03
20
06
20
09
20
12
Co
un
t o
f assets
Year of manufacture
33kV conductors – age profile
0
500
1000
1500
2000
2500
3000
3500
4000
4500
5000
19
00
19
12
19
23
19
31
19
35
19
39
19
43
19
47
19
51
19
55
19
59
19
63
19
67
19
71
19
75
19
79
19
83
19
87
19
91
19
95
19
99
20
03
20
07
20
11
Co
un
t o
f assets
Year of manufacture
HV wood poles – age profile
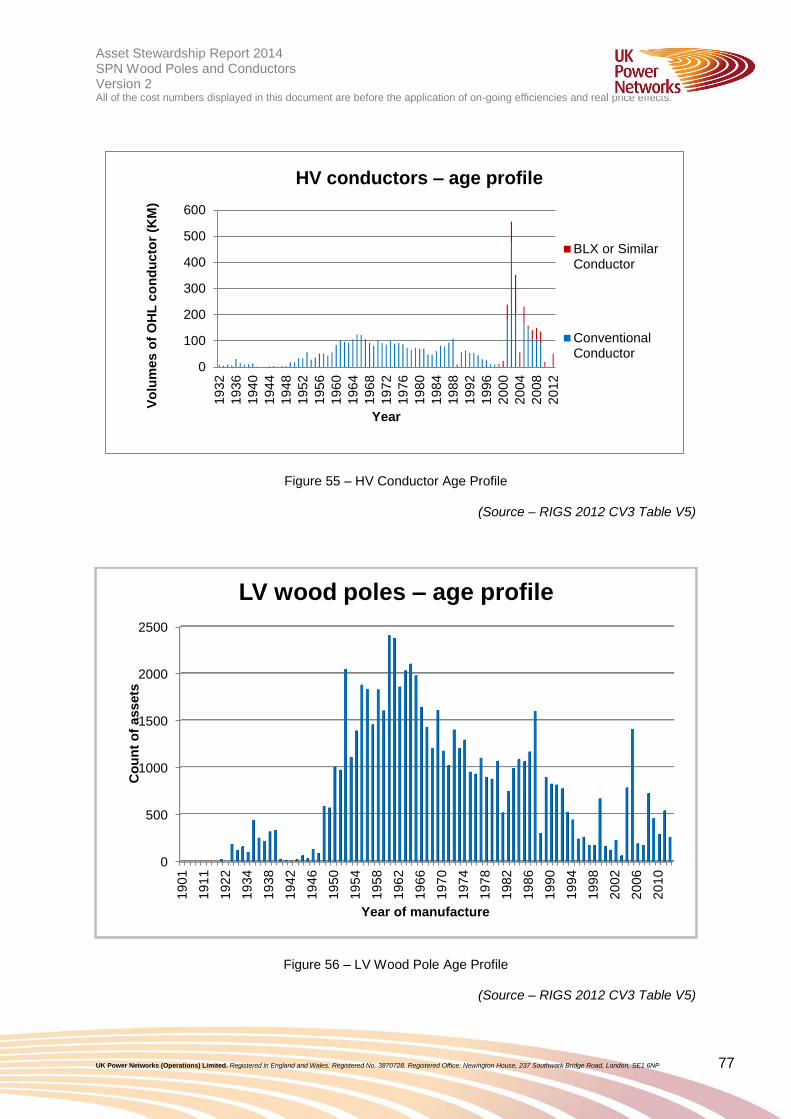
Asset Stewardship Report 2014 Working draft v0.1 SPN Wood Poles and Conductors Version 2 All of the cost numbers displayed in this document are before the application of on-going efficiencies and real price effects.
UK Power Networks (Operations) Limited. Registered in England and Wales. Registered No. 3870728. Registered Office: Newington House, 237 Southwark Bridge Road, London, SE1 6NP 77
Figure 55 – HV Conductor Age Profile
(Source – RIGS 2012 CV3 Table V5)
Figure 56 – LV Wood Pole Age Profile
(Source – RIGS 2012 CV3 Table V5)
0
100
200
300
400
500
60019
32
19
36
19
40
19
44
19
48
19
52
19
56
19
60
19
64
19
68
19
72
19
76
19
80
19
84
19
88
19
92
19
96
20
00
20
04
20
08
20
12
Vo
lum
es o
f O
HL
co
nd
uc
tor
(KM
)
Year
HV conductors – age profile
BLX or SimilarConductor
ConventionalConductor
0
500
1000
1500
2000
2500
19
01
19
11
19
22
19
34
19
38
19
42
19
46
19
50
19
54
19
58
19
62
19
66
19
70
19
74
19
78
19
82
19
86
19
90
19
94
19
98
20
02
20
06
20
10
Co
un
t o
f assets
Year of manufacture
LV wood poles – age profile

Asset Stewardship Report 2014 Working draft v0.1 SPN Wood Poles and Conductors Version 2 All of the cost numbers displayed in this document are before the application of on-going efficiencies and real price effects.
UK Power Networks (Operations) Limited. Registered in England and Wales. Registered No. 3870728. Registered Office: Newington House, 237 Southwark Bridge Road, London, SE1 6NP 78

Asset Stewardship Report 2014 Working draft v0.1 SPN Wood Poles and Conductors Version 2 All of the cost numbers displayed in this document are before the application of on-going efficiencies and real price effects.
UK Power Networks (Operations) Limited. Registered in England and Wales. Registered No. 3870728. Registered Office: Newington House, 237 Southwark Bridge Road, London, SE1 6NP 79
Figure 57 – LV Wood Pole Age Profile
(Source – RIGS 2012 CV3 Table V5)
0
50
100
150
200
250
300
19
30
19
34
19
38
19
42
19
46
19
50
19
54
19
58
19
62
19
66
19
70
19
74
19
78
19
82
19
86
19
90
19
94
19
98
20
02
20
06
20
10
Vo
lum
e o
f O
HL
co
nd
ucto
r (K
M)
Year of manufacture
LV OHL conductors – age profile
LV Main (OHL)Conductor

Asset Stewardship Report 2014 Working draft v0.1 SPN Wood Poles and Conductors Version 2 All of the cost numbers displayed in this document are before the application of on-going efficiencies and real price effects.
UK Power Networks (Operations) Limited. Registered in England and Wales. Registered No. 3870728. Registered Office: Newington House, 237 Southwark Bridge Road, London, SE1 6NP 80
Appendix 2 – HI and Criticality Profiles
33KV Poles :
Asset Health and Criticality 2015
Asset categories Units
Estimated Asset Health and Criticality Profile 2015 with Interventions Asset
Register
Asset health index
2015
HI1 HI2 HI3 HI4 HI5
33 KV Poles
Low No. Assets 61 499 96 11 6 673
Average No. Assets 3 37 3 0 0 43
High No. Assets 952 7695 1492 161 97 10,397
Very High
No. Assets 58 473 91 10 6 638
Table 19 - Asset Health and Criticality 2015
Source ARP Model (HI :25th July 2012 ,Criticality : 27
th November 2012)
Asset Health and Criticality 2023
Asset categories Units
Estimated Asset Health and Criticality Profile 2023with Interventions Asset
Register
Asset health index
2023
HI1 HI2 HI3 HI4 HI5
33 KV Poles
Low No. Assets 69 279 245 80 0 673
Average No. Assets 3 19 16 5 0 43
High No. Assets 1247 4313 3785 1052 0 10,397
Very High No. Assets 73 264 232 69 0 638
Table 20 - Asset Health and Criticality 2023
Source ARP Model (HI :25th July 2012 ,Criticality : 27
th November 2012)

Asset Stewardship Report 2014 Working draft v0.1 SPN Wood Poles and Conductors Version 2 All of the cost numbers displayed in this document are before the application of on-going efficiencies and real price effects.
UK Power Networks (Operations) Limited. Registered in England and Wales. Registered No. 3870728. Registered Office: Newington House, 237 Southwark Bridge Road, London, SE1 6NP 81
HV Poles :
Asset Health and Criticality 2015
Asset categories Units
Estimated Asset Health and Criticality Profile 2015 with Interventions
Asset Register
Asset health index
2015
HI1 HI2 HI3 HI4 HI5
HV Poles
Low No. Assets
742 7231 1620 179 0 9,772
Average No. Assets
4761 27072 6789 938 0 39,560
High No. Assets
2618 12458 3162 391 0 18,629
Very High
No. Assets
2 39 0 0 0 41
Table 21 - Asset Health and Criticality 2015
Source ARP Model (HI :25th July 2012 ,Criticality : 27
th November 2012)
Asset Health and Criticality 2023
Asset categories
Units
Estimated Asset Health and Criticality Profile 2023 with Interventions
Asset
Register
Asset health index
2023
HI1 HI2 HI3 HI4 HI5
HV Poles
Low
No. Assets
928 4298 2,825 1534 187 9,772
Average
No. Assets
4522 17389 11,440 6209 0 39,560
High
No. Assets
3068 8194 5,385 1982 0 18,629
Very High
No. Assets
5 18 12 6 0 41
Table 22 - Asset Health and Criticality 2023
Source ARP Model (HI :25th July 2012 ,Criticality : 27
th November 2012)

Asset Stewardship Report 2014 Working draft v0.1 SPN Wood Poles and Conductors Version 2 All of the cost numbers displayed in this document are before the application of on-going efficiencies and real price effects.
UK Power Networks (Operations) Limited. Registered in England and Wales. Registered No. 3870728. Registered Office: Newington House, 237 Southwark Bridge Road, London, SE1 6NP 82
LV Poles :
Asset Health and Criticality 2015
Asset categories Units
Estimated Asset Health and Criticality Profile 2015 with Interventions Asset
Register
Asset health index
2015
HI1 HI2 HI3 HI4 HI5
LV Poles
Low No. Assets
0 0 0 0 0 -
Average No. Assets
21863 72930 26079 4097 0 124,969
High No. Assets
143 852 189 0 0 1,184
Very High
No. Assets
0 1 1 0 0 2
Table 23 - Asset Health and Criticality 2015
Source ARP Model (HI :25th July 2012 ,Criticality : 27
th November 2012)
Asset Health and Criticality 2023
Asset categories Units
Estimated Asset Health and Criticality Profile 2023 with Interventions
Asset Register
Asset health index
2023
HI1 HI2 HI3 HI4 HI5
LV Poles
Low No. Assets
0 0 0 0 0 -
Average No. Assets
22294 48074 35619 18524 458 124,969
High No. Assets
230 456 337 161 0 1,184
Very High No. Assets
0 1 1 0 0 2
Table 24 - Asset Health and Criticality 2023
Source ARP Model (HI :25th July 2012 ,Criticality : 27
th November 2012)

Asset Stewardship Report 2014 Working draft v0.1 SPN Wood Poles and Conductors Version 2 All of the cost numbers displayed in this document are before the application of on-going efficiencies and real price effects.
UK Power Networks (Operations) Limited. Registered in England and Wales. Registered No. 3870728. Registered Office: Newington House, 237 Southwark Bridge Road, London, SE1 6NP 83
Appendix 3 – Fault Data
Figure 58 – Fault rate – 132kV OHL Conductor
(Source - UKPN Fault Cube)
Figure 59 – Fault rate – EHV(33kV) OHL Conductor
(Source - UKPN Fault Cube)
0.00000.00100.00200.00300.00400.00500.00600.00700.00800.00900.0100
2007 2008 2009 2010 2011 2012
Fau
lts/
OH
L C
on
du
cto
r (K
M)
Year
132KV OHL Conductor
All Faults
Poor Condition Due To Age & Wear
0.0000
0.0050
0.0100
0.0150
0.0200
0.0250
0.0300
0.0350
2007 2008 2009 2010 2011 2012
Faul
ts/O
HL C
ondu
ctor
(KM
)
Year
EHV OHL Conductor
All Faults
Poor Condition Due To Age & Wear

Asset Stewardship Report 2014 Working draft v0.1 SPN Wood Poles and Conductors Version 2 All of the cost numbers displayed in this document are before the application of on-going efficiencies and real price effects.
UK Power Networks (Operations) Limited. Registered in England and Wales. Registered No. 3870728. Registered Office: Newington House, 237 Southwark Bridge Road, London, SE1 6NP 84
Figure 60 – Fault rate – HV OHL Conductor
(Source - UKPN Fault Cube)
Figure 61 – Fault rate – LV OHL Conductor
(Source - UKPN Fault Cube)
0.00000.02000.04000.06000.08000.10000.12000.14000.16000.18000.2000
2007 2008 2009 2010 2011 2012
Faul
ts /
OH
L Co
nduc
tor
(KM
)
Year
HV OHL Conductor
All Faults
Poor Condition Due To Age & Wear
0.00000.02000.04000.06000.08000.10000.12000.14000.16000.18000.2000
2007 2008 2009 2010 2011 2012
Faul
ts /
OH
L Co
nduc
tor
(KM
)
Year
LV OHL Conductor
All Faults
Poor Condition Due To Age & Wear

Asset Stewardship Report 2014 Working draft v0.1 SPN Wood Poles and Conductors Version 2 All of the cost numbers displayed in this document are before the application of on-going efficiencies and real price effects.
UK Power Networks (Operations) Limited. Registered in England and Wales. Registered No. 3870728. Registered Office: Newington House, 237 Southwark Bridge Road, London, SE1 6NP 85
Appendix 4 – WLC and other Case Studies
Not relevant: intentionally left blank

Asset Stewardship Report 2014 Working draft v0.1 SPN Wood Poles and Conductors Version 2 All of the cost numbers displayed in this document are before the application of on-going efficiencies and real price effects.
UK Power Networks (Operations) Limited. Registered in England and Wales. Registered No. 3870728. Registered Office: Newington House, 237 Southwark Bridge Road, London, SE1 6NP 86
Appendix 5 – NLRE Expenditure Plan
SP
N
Wo
od
po
le
Sub-category
NAMP line(s)
NAMP description
2015/ 2016/ 2017/ 2018/ 2019/ 2020/ 2021/ 2022/
2016 2017 2018 2019 2020 2021 2022 2023
LV wood pole
1.44.01 Replace LV wood poles
(‘D’ condition) 1,577 1,577 1,577 1,577 1,577 1,577 1,577 1,577
1.41.03
LV overhead line
refurbishment (including
ABC)
1,356 1,356 1,356 1,356 1,356 1,356 1,356 1,356
HV wood pole
1.19.12 Replace HV wood poles
946 946 946 946 946 946 946 946
1.32.17 HV OHL Renewal
1201 1201 1201 1201 1201 1201 1201 1201
HV OHL conductor
1.32.19 Replace 0.025
11KV conductor
2,915 2,915 2,915 2,915 2,915 2,915 2,915 2,915
33kV wood pole
1.09.04 Replace 33kV wood poles
230 230 230 230 230 230 230 230
1.09.01
33kV wood pole OHL Renewal
1045 1977 439 645 575 750 1102 478
1.09.05 33kV Wood
Pole Refurbishment
54 54 54 54 54 54 54 54
Total (£k) 9,324 10,256 8,718 8,924 8,854 9,029 9,381 8,757
Table 25 - Wood Pole expenditure plan
(Source – 19th
February 2014 NAMP Table J Less Indirect)
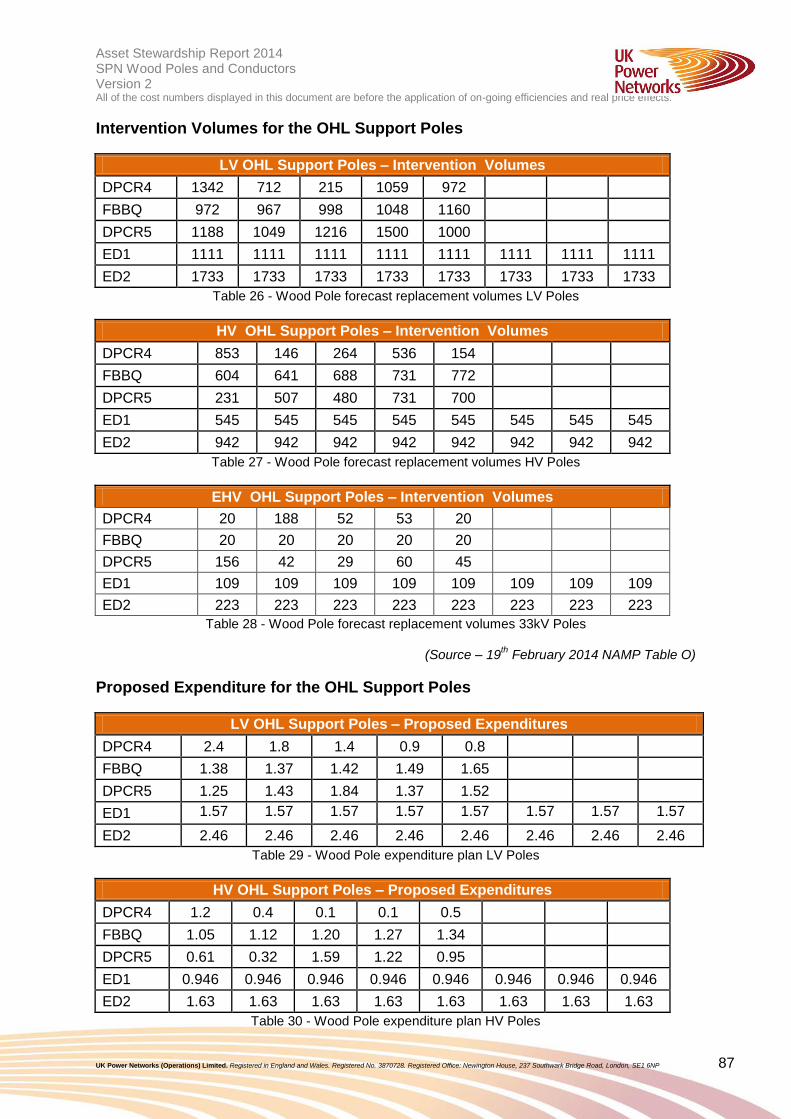
Asset Stewardship Report 2014 Working draft v0.1 SPN Wood Poles and Conductors Version 2 All of the cost numbers displayed in this document are before the application of on-going efficiencies and real price effects.
UK Power Networks (Operations) Limited. Registered in England and Wales. Registered No. 3870728. Registered Office: Newington House, 237 Southwark Bridge Road, London, SE1 6NP 87
Intervention Volumes for the OHL Support Poles
LV OHL Support Poles – Intervention Volumes
DPCR4 1342 712 215 1059 972
FBBQ 972 967 998 1048 1160
DPCR5 1188 1049 1216 1500 1000
ED1 1111 1111 1111 1111 1111 1111 1111 1111
ED2 1733 1733 1733 1733 1733 1733 1733 1733
Table 26 - Wood Pole forecast replacement volumes LV Poles
HV OHL Support Poles – Intervention Volumes
DPCR4 853 146 264 536 154
FBBQ 604 641 688 731 772
DPCR5 231 507 480 731 700
ED1 545 545 545 545 545 545 545 545
ED2 942 942 942 942 942 942 942 942
Table 27 - Wood Pole forecast replacement volumes HV Poles
EHV OHL Support Poles – Intervention Volumes
DPCR4 20 188 52 53 20
FBBQ 20 20 20 20 20
DPCR5 156 42 29 60 45
ED1 109 109 109 109 109 109 109 109
ED2 223 223 223 223 223 223 223 223
Table 28 - Wood Pole forecast replacement volumes 33kV Poles
(Source – 19th February 2014 NAMP Table O)
Proposed Expenditure for the OHL Support Poles
LV OHL Support Poles – Proposed Expenditures
DPCR4 2.4 1.8 1.4 0.9 0.8
FBBQ 1.38 1.37 1.42 1.49 1.65
DPCR5 1.25 1.43 1.84 1.37 1.52
ED1 1.57 1.57 1.57 1.57 1.57 1.57 1.57 1.57
ED2 2.46 2.46 2.46 2.46 2.46 2.46 2.46 2.46
Table 29 - Wood Pole expenditure plan LV Poles
HV OHL Support Poles – Proposed Expenditures
DPCR4 1.2 0.4 0.1 0.1 0.5
FBBQ 1.05 1.12 1.20 1.27 1.34
DPCR5 0.61 0.32 1.59 1.22 0.95
ED1 0.946 0.946 0.946 0.946 0.946 0.946 0.946 0.946
ED2 1.63 1.63 1.63 1.63 1.63 1.63 1.63 1.63
Table 30 - Wood Pole expenditure plan HV Poles

Asset Stewardship Report 2014 Working draft v0.1 SPN Wood Poles and Conductors Version 2 All of the cost numbers displayed in this document are before the application of on-going efficiencies and real price effects.
UK Power Networks (Operations) Limited. Registered in England and Wales. Registered No. 3870728. Registered Office: Newington House, 237 Southwark Bridge Road, London, SE1 6NP 88
EHV OHL Support Poles – Proposed Expenditures
DPCR4 0.8 1 0.6 0.1 1.2
FBBQ 0.04 0.04 0.04 0.04 0.04
DPCR5 0.02 0.11 0.08 0.10 0.23
ED1 0.23 0.23 0.23 0.23 0.23 0.23 0.23 0.23
ED2 0.47 0.47 0.47 0.47 0.47 0.47 0.47 0.47
Table 31 - Wood Pole expenditure plan 33kV Poles
(Source – 19th
February 2014 NAMP Table J Less Indirect)

Asset Stewardship Report 2014 Working draft v0.1 SPN Wood Poles and Conductors Version 2 All of the cost numbers displayed in this document are before the application of on-going efficiencies and real price effects.
UK Power Networks (Operations) Limited. Registered in England and Wales. Registered No. 3870728. Registered Office: Newington House, 237 Southwark Bridge Road, London, SE1 6NP 89
Intervention Volumes for the OHL Conductors
LV OHL Conductor – Intervention Volumes
DPCR4 0 0 0 0 0
FBBQ 528 528 528 528 528
DPCR5 0 0 2.645 1 12
ED1 100 100 100 100 100 100 100 100
ED2 100 100 100 100 100 100 100 100 Table 32 - Wood Pole forecast replacement volumes LV Conductor
HV OHL Conductor - Intervention Volumes
DPCR4 136 136 136 136 13
FBBQ 180.9 180.9 180.9 180.9 180.9
DPCR5 1 47 14.651 68.72 68.72
ED1 138 138 138 138 138 138 138 138
ED2 68.72 68.72 68.72 68.72 68.72 68.72 68.72 68.72
Table 33 - Wood Pole forecast replacement volumes HV Conductor
EHV OHL Conductor - Intervention Volumes
DPCR4 45 21 0 10.5 22.9
FBBQ 17.1 1.3 5.4 5.4 5.4
DPCR5 0 0 0.63 0.012 0
ED1 0 72 0 13 6 10 29 9.004
ED2 17 17 17 17 17 17 17 17 Table 34 - Wood Pole forecast replacement volumes 33kV Conductor
(Source – 19th February 2014 NAMP Table O)

Asset Stewardship Report 2014 Working draft v0.1 SPN Wood Poles and Conductors Version 2 All of the cost numbers displayed in this document are before the application of on-going efficiencies and real price effects.
UK Power Networks (Operations) Limited. Registered in England and Wales. Registered No. 3870728. Registered Office: Newington House, 237 Southwark Bridge Road, London, SE1 6NP 90
Proposed Expenditure for the OHL Conductors
LV OHL Conductor – Proposed Expenditures
DPCR4 0 0 0 0 7.39
FBBQ 7.39 7.39 7.39 7.39 7.39
DPCR5 0.08 0.00 0.01 0.16 1.37
ED1 1.36 1.36 1.36 1.36 1.36 1.36 1.36 1.36
ED2 1.4 1.4 1.4 1.4 1.4 1.4 1.4 1.4
Table 35 - Wood Pole expenditure plan HV Conductor
HV OHL Conductor – Proposed Expenditures
DPCR4 6.77 6.77 6.77 6.77 6.77
FBBQ 9.00 9.00 9.00 9.00 9.00
DPCR5 0.04 3.14 1.28 3.40 3.40
ED1 4.12 4.12 4.12 4.12 4.12 4.12 4.12 4.12
ED2 3.4 3.4 3.4 3.4 3.4 3.4 3.4 3.4
Table 36 - Wood Pole expenditure plan HV Conductor
EHV OHL Conductor – Proposed Expenditures
DPCR4 1.3005 0.6069 0 0.30345 0.66181
FBBQ 0.49 0.04 0.16 0.16 0.16
DPCR5 0 0.02 0 0.05 0.83
ED1 0.76 1.69 0.15 0.36 0.29 0.47 0.82 0.19
ED2 1.09 1.09 1.09 1.09 1.09 1.09 1.09 1.09
Table 37 - Wood Pole expenditure plan 33kV Conductor
(Source – 19th
February 2014 NAMP Table J Less Indirect

91
for evidence-based operational, tactical and strategic decisions ©DecisionLab Ltd
Appendix 6 – Sensitivity Analysis
Sensitivity Analysis: Asset Risk and Prioritisation Model for SPN EHV OHL Support (Poles) (written by Decision Lab)
Introduction
This is a report on the sensitivity analysis conducted on the Asset Risk and Prioritisation (ARP) Model, developed
by EA Technology and used to support the asset replacement and investment strategy for SPN EHV OHL
support (poles), which is included in the ED1 plan.
The objective is to understand how the Health Index profile of assets may change if the average life of assets
does not turn out as predicted.
An input to the ARP model is the starting asset population in each Health Index, which is different in each region.
Therefore, sensitivity analysis has been done on a region-by-region basis.
The Asset Risk and Prioritisation Model
The ARP model uses database information about each individual asset, and models many parameters to predict
the Health Index of each asset in the future. Significant parameters are age, location, loading and current
average life.
Sensitivity Analysis
Variation in average asset life can occur, but this is significantly less than the variation in individual asset lives.
Standard average asset lives are used in the ARP model. For wood poles, this is 60 years. This study covered
the full population of SPN EHV OHL support (poles).
Using 2012 asset data and the replacement plans up to 2023, the ARP model was used to predict the Health
Index of each asset at the beginning and end of ED1. This was then repeated, varying each current average
asset life by +/- 1, 2 and 4 years.
All results are shown below as the percentages of the population.
Average life
change
2015 percentage HI profile
HI1 HI2 HI3 HI4 HI5
-4 7.1 65.9 22.2 3.8 0.9
-2 7.1 73.0 15.5 3.4 0.9
-1 9.1 73.1 14.4 2.4 0.9
0 9.1 74.1 14.3 1.5 0.9
1 9.3 76.2 12.0 1.5 0.9
2 10.3 76.2 11.1 1.5 0.9
4 10.4 79.6 8.0 1.1 0.9
Average life
change
2023 percentage HI profile
HI1 HI2 HI3 HI4 HI5
-4 12.4 46.3 31.8 9.5 0.0
-2 12.4 52.0 30.8 4.9 0.0
-1 12.6 54.9 28.4 4.1 0.0
0 12.6 57.8 25.5 4.0 0.0
1 12.7 62.2 21.3 3.9 0.0
2 12.7 65.3 19.7 2.3 0.0
4 12.7 70.9 16.0 0.4 0.0
As the percentages above are rounded, the sum of a row may be 0.2% above or below 100%.
The upper and lower and current average life cases are charted below.

92
for evidence-based operational, tactical and strategic decisions ©Decision Lab Ltd
For all cases modelled, the sums of assets in Health Indices HI4 and HI5 are plotted below.
The results show:
A variation in average asset life will affect the proportions of HI4 and HI5 assets in 2015 and 2023.
In 2015, if average life is four years longer, the proportion of HI4 and HI5 assets will reduce from 2.4%
to 2.0%; if four years shorter, it will increase to 4.7%.
In 2023, if average life is four years longer, the proportion of HI4 and HI5 assets will reduce from 4.0%
to 0.4%; if four years shorter, it will increase to 9.5%.
Conclusion
The ED1 replacement plan for SPN EHV OHL support (poles) is moderately sensitive to a variation in average
asset life of up to four years.

93
for evidence-based operational, tactical and strategic decisions ©Decision Lab Ltd
Sensitivity Analysis Asset Risk and Prioritisation Model for SPN HV OHL Support (Poles) (written by Decision Lab)
Introduction
This is a report on the sensitivity analysis conducted on the Asset Risk and Prioritisation (ARP) Model, developed
by EA Technology and used to support the asset replacement and investment strategy for SPN HV OHL support
(poles), which is included in the ED1 plan.
The objective is to understand how the Health Index profile of assets may change if the average life of assets
does not turn out as predicted.
An input to the ARP model is the starting asset population in each Health Index, which is different in each region.
Therefore, sensitivity analysis has been done on a region-by-region basis.
The Asset Risk and Prioritisation Model
The ARP model uses database information about each individual asset and models many parameters to predict
the Health Index of each asset in the future. Significant parameters are age, location, loading and current
average life.
Sensitivity Analysis
Variation in average asset life can occur, but this is significantly less than the variation in individual asset lives.
Standard average asset lives are used in the ARP model. For wood poles, this is 60 years. This study covered
the full population of SPN HV OHL support (poles).
Using 2012 asset data and the replacement plans up to 2023, the ARP model was used to predict the Health
Index of each asset at the beginning and end of ED1. This was then repeated, varying each current average
asset life by +/- 1, 2 and 4 years.
All results are shown below as the percentages of the population.
Average life
change
2015 percentage HI profile
HI1 HI2 HI3 HI4 HI5
-4 11.4 61.9 23.3 3.3 0.1
-2 11.4 66.1 19.8 2.6 0.0
-1 11.9 67.4 18.3 2.4 0.0
0 11.9 68.9 17.0 2.2 0.0
1 12.2 70.4 15.2 2.2 0.0
2 12.5 72.1 13.5 2.0 0.0
4 13.2 73.1 12.2 1.5 0.0
Average life
change
2023 percentage HI profile
HI1 HI2 HI3 HI4 HI5
-4 14.0 45.6 28.5 10.6 1.3
-2 14.2 50.9 26.9 7.3 0.7
-1 14.2 53.2 25.4 6.9 0.2
0 14.2 55.1 24.6 6.1 0.0
1 14.6 57.2 22.4 5.8 0.0
2 14.8 59.8 20.1 5.3 0.0
4 15.2 64.4 16.7 3.8 0.0
As the percentages above are rounded, the sum of a row may be 0.2% above or below 100%.
The upper and lower and current average life cases are charted below.

94
for evidence-based operational, tactical and strategic decisions ©Decision Lab Ltd
For all cases modelled, the sums of assets in Health Indices HI4 and HI5 are plotted below.
The results show:
A variation in average asset life will affect the proportions of HI4 and HI5 assets in 2023 and possibly
also in 2015.
In 2015, if average life is four years longer, the proportion of HI4 and HI5 assets will reduce from 2.2%
to 1.5%; if four years shorter, it will remain at 3.4%.
In 2023, if average life is four years longer, the proportion of HI4 and HI5 assets will reduce from 6.1%
to 3.8%; if four years shorter, it will increase to 11.9%.
Conclusion
The ED1 replacement plan for SPN HV OHL support (poles) is moderately sensitive to a variation in average
asset life of up to four years.

95
for evidence-based operational, tactical and strategic decisions ©Decision Lab Ltd
Sensitivity Analysis: Asset Risk and Prioritisation Model for SPN LV OHL Support (Poles) (written by Decision Lab)
Introduction
This is a report on the sensitivity analysis conducted on the Asset Risk and Prioritisation (ARP) Model, developed
by EA Technology and used to support the asset replacement and investment strategy for SPN LV OHL support
(poles), which is included in the ED1 plan.
The objective is to understand how the Health Index profile of assets may change if the average life of assets
does not turn out as predicted.
An input to the ARP model is the starting asset population in each Health Index, which is different in each region.
Therefore, sensitivity analysis has been done on a region-by-region basis.
The Asset Risk and Prioritisation Model
The ARP model uses database information about each individual asset and models many parameters to predict
the Health Index of each asset in the future. Significant parameters are age, location, loading and current
average life.
Sensitivity Analysis
Variation in average asset life can occur, but this is significantly less than the variation in individual asset lives.
Standard average asset lives are used in the ARP model. For wood poles, this is 60 years. This study covered
the full population of SPN LV OHL support (poles).
Using 2012 asset data and the replacement plans up to 2023, the ARP model was used to predict the Health
Index of each asset at the beginning and end of ED1. This was then repeated, varying each current average
asset life by +/- 1, 2 and 4 years.
All results are shown below as the percentages of the population.
Average life
change
2015 percentage HI profile
HI1 HI2 HI3 HI4 HI5
-4 16.2 52.7 26.8 4.3 0.0
-2 17.1 55.7 23.4 3.8 0.0
-1 17.4 57.2 21.8 3.6 0.0
0 17.4 58.5 20.8 3.2 0.0
1 19.1 58.4 19.3 3.2 0.0
2 19.4 59.9 17.7 3.0 0.0
4 20.1 61.3 16.6 2.0 0.0
Average life
change
2023 percentage HI profile
HI1 HI2 HI3 HI4 HI5
-4 19.6 39.8 28.4 12.2 0.0
-2 20.1 42.4 28.5 8.9 0.0
-1 20.6 44.6 26.7 8.1 0.0
0 20.7 47.4 25.0 7.0 0.0
1 21.1 48.9 23.2 6.7 0.0
2 21.2 51.9 20.8 6.1 0.0
4 21.4 55.0 18.4 5.2 0.0
As the percentages above are rounded, the sum of a row may be 0.2% above or below 100%.
The upper and lower and current average life cases are charted below.

96
for evidence-based operational, tactical and strategic decisions ©Decision Lab Ltd
For all cases modelled, the sums of assets in Health Indices HI4 and HI5 are plotted below.
The results show:
A variation in average asset life will affect the proportions of HI4 and HI5 assets in 2023 and possibly
also in 2015.
In 2015, if average life is four years longer, the proportion of HI4 and HI5 assets will reduce from 3.2%
to 2.0%; if four years shorter, it will remain at 4.3%.
In 2023, if average life is four years longer, the proportion of HI4 and HI5 assets will reduce from 7.0%
to 5.2%; if four years shorter, it will increase to 12.2%.
Conclusion
The ED1 replacement plan for SPN LV OHL support (poles) is moderately sensitive to a variation in average
asset life of up to four years.

Asset Stewardship Report 2014 Working draft v0.1 SPN Wood Poles and Conductors Version 1.12
UK Power Networks (Operations) Limited. Registered in England and Wales. Registered No. 3870728. Registered Office: Newington House, 237 Southwark Bridge Road, London, SE1 6NP 97
Appendix 7 – Named Schemes
The following tables show the planned replacement/refurbishment projects for ED1 and their
main driver(s) for intervention.
33kV OHL Replacements
Route Asset Replacement
driver Scheme Paper
Chelsfield Grid/Four Elms (Sundridge Zone)
33kV OHL Conductor Asset Health
No
Canterbury South/Wingham 33kV OHL Conductor Asset Health No
Hartley Grid/Goudhurst 33kV OHL Conductor Asset Health No
Sellindge Grid local/Stanford & Tees
33kV OHL Conductor Asset Health No
Folkestone/ShorncliffeHythe No1
33kV OHL Conductor Asset Health No
Lewes Grid/Lewes Town No2
33kV OHL Conductor Asset Health No
Medway Grid/Wrotham Heath No2
33kV OHL Conductor Asset Health Yes
Lewes Grid/Lewes Town No1
33kV OHL Conductor Asset Health No
Ashford Grid/Smeeth 33kV OHL Conductor Asset Health No
Northfleet East Grid/Shornewood No1
33kV OHL Conductor Asset Health No
Northfleet East Grid/Shornewood No2
33kV OHL Conductor Asset Health No
Table 38 – Named Schemes (Source – 19th February 2014 NAMP Table J Less Indirect)
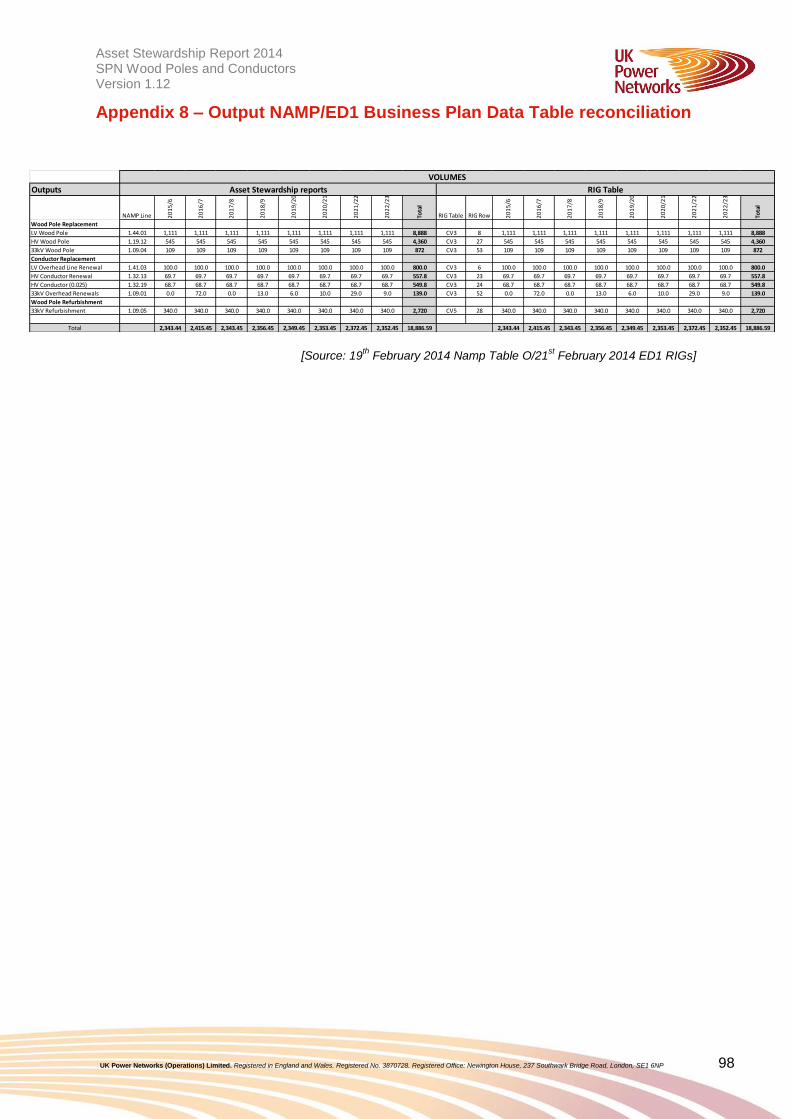
Asset Stewardship Report 2014 Working draft v0.1 SPN Wood Poles and Conductors Version 1.12
UK Power Networks (Operations) Limited. Registered in England and Wales. Registered No. 3870728. Registered Office: Newington House, 237 Southwark Bridge Road, London, SE1 6NP 98
Appendix 8 – Output NAMP/ED1 Business Plan Data Table reconciliation
[Source: 19th
February 2014 Namp Table O/21st February 2014 ED1 RIGs]
Outputs
NAMP Line 20
15
/6
20
16
/7
20
17
/8
20
18
/9
20
19
/20
20
20
/21
20
21
/22
20
22
/23
Tota
l
RIG Table RIG Row 20
15
/6
20
16
/7
20
17
/8
20
18
/9
20
19
/20
20
20
/21
20
21
/22
20
22
/23
Tota
l
Wood Pole Replacement
LV Wood Pole 1.44.01 1,111 1,111 1,111 1,111 1,111 1,111 1,111 1,111 8,888 CV3 8 1,111 1,111 1,111 1,111 1,111 1,111 1,111 1,111 8,888
HV Wood Pole 1.19.12 545 545 545 545 545 545 545 545 4,360 CV3 27 545 545 545 545 545 545 545 545 4,360
33kV Wood Pole 1.09.04 109 109 109 109 109 109 109 109 872 CV3 53 109 109 109 109 109 109 109 109 872
Conductor Replacement
LV Overhead Line Renewal 1.41.03 100.0 100.0 100.0 100.0 100.0 100.0 100.0 100.0 800.0 CV3 6 100.0 100.0 100.0 100.0 100.0 100.0 100.0 100.0 800.0
HV Conductor Renewal 1.32.13 69.7 69.7 69.7 69.7 69.7 69.7 69.7 69.7 557.8 CV3 23 69.7 69.7 69.7 69.7 69.7 69.7 69.7 69.7 557.8
HV Conductor (0.025) 1.32.19 68.7 68.7 68.7 68.7 68.7 68.7 68.7 68.7 549.8 CV3 24 68.7 68.7 68.7 68.7 68.7 68.7 68.7 68.7 549.8
33kV Overhead Renewals 1.09.01 0.0 72.0 0.0 13.0 6.0 10.0 29.0 9.0 139.0 CV3 52 0.0 72.0 0.0 13.0 6.0 10.0 29.0 9.0 139.0
Wood Pole Refurbishment
33kV Refurbishment 1.09.05 340.0 340.0 340.0 340.0 340.0 340.0 340.0 340.0 2,720 CV5 28 340.0 340.0 340.0 340.0 340.0 340.0 340.0 340.0 2,720
Total 2,343.44 2,415.45 2,343.45 2,356.45 2,349.45 2,353.45 2,372.45 2,352.45 18,886.59 2,343.44 2,415.45 2,343.45 2,356.45 2,349.45 2,353.45 2,372.45 2,352.45 18,886.59
RIG TableAsset Stewardship reports
VOLUMES

Asset Stewardship Report 2014 Working draft v0.1 SPN Wood Poles and Conductors Version 1.12
UK Power Networks (Operations) Limited. Registered in England and Wales. Registered No. 3870728. Registered Office: Newington House, 237 Southwark Bridge Road, London, SE1 6NP 99
Appendix 9 – Efficiency benchmarking with other DNO’s
The investment plan has been developed in accordance with this strategy and by making
use of the Asset Risk and Prioritisation (ARP) model to assess all asset data available in
order to determine asset health, criticality and consequence of failure. This has enabled the
construction of a well-justified plan based on detailed knowledge of individual assets rather
than age or statistical modelling approaches.
The investment strategy for wood poles at all voltages is that they should have the same
Health Index references of HI4 or HI5 at the end of ED1 as they do at the start.
Any new pole installed on the network should have a ‘pole saver’ fitted that will extend the
life of a wooden pole; this strategy is referred to in section 6.3.
Further intervention, such as boron rods, which can delay or defer a replacement on suitable
poles, will be installed throughout ED1; this strategy is referred to in section 6.1.
Benchmarking
Figure 62 - Levels of proposed asset replacement in ED1 as a percentage of installed network
The graph shows that SPN’s proposed % replacement volumes are the one of the lowest in
the industry.
EPN
LPN
SPN
EMID
WMID
SWALES
SWEST
ENW
NPGN NPGY
SPD SPMW
SSES
SSEH
0%
5%
10%
15%
20%
25%
32.0 37.0 42.0 47.0 52.0
ED
1 R
ep
lacem
en
ts (
% o
f P
op
ula
tio
n)
Mean Age (Years)
Total OHL Support (poles)(Additions)
All DNO Average Age
All DNO AverageReplacement Rate

Asset Stewardship Report 2014 Working draft v0.1 SPN Wood Poles and Conductors Version 1.12
UK Power Networks (Operations) Limited. Registered in England and Wales. Registered No. 3870728. Registered Office: Newington House, 237 Southwark Bridge Road, London, SE1 6NP 100
Appendix 10 – Material changes since the July 2013 ED1 submission
Changes between the July 2013 submission and the March 2014 re-submission are
summarised and discussed below.
Asset type
Action Change type 2013
Submission 2014
Submission Difference Comment
6.6/11kV Poles (EPN) CV3
Replace
Volume km (Conventional
Conductor) Row 23
550 558 +8
CV5 to CV3 change
equates to adding 640km
conductor to CV3.
549.76km in 2013 moved to CV3 24
UCI (£k) 49.8 23.8 -26
UCI reduced as poles
replaced will be on the D
pole line CV3 27
Investment
(£m) Row 23 27.4 13.3 -14.1
Replace
Volume km (BLX
Conductor) Row 24
0 550 +550
Movement of +549.76km
from CV3 23 to CV3 24
UCI (£k) 0 35.7 +35.7
Cost/Volumes moved from CV3 23 and UCI reduced
to correct costs. Higher than normal
as BLX (Covered Conductor costs more
per km)
Investment
(£m) Row 24 0 19.6 +19.6
TOTAL Investment Row 23 and
24 (£m) 27.4 32.9 +5.5
Table 39 – Material Changes to July ED1 Submission (CV3)
[Source: Final EPN Business Plan Data Tables following the OFGEM Question and Answer Process / 21st
February 2014 ED1 Business Plan Data Tables]
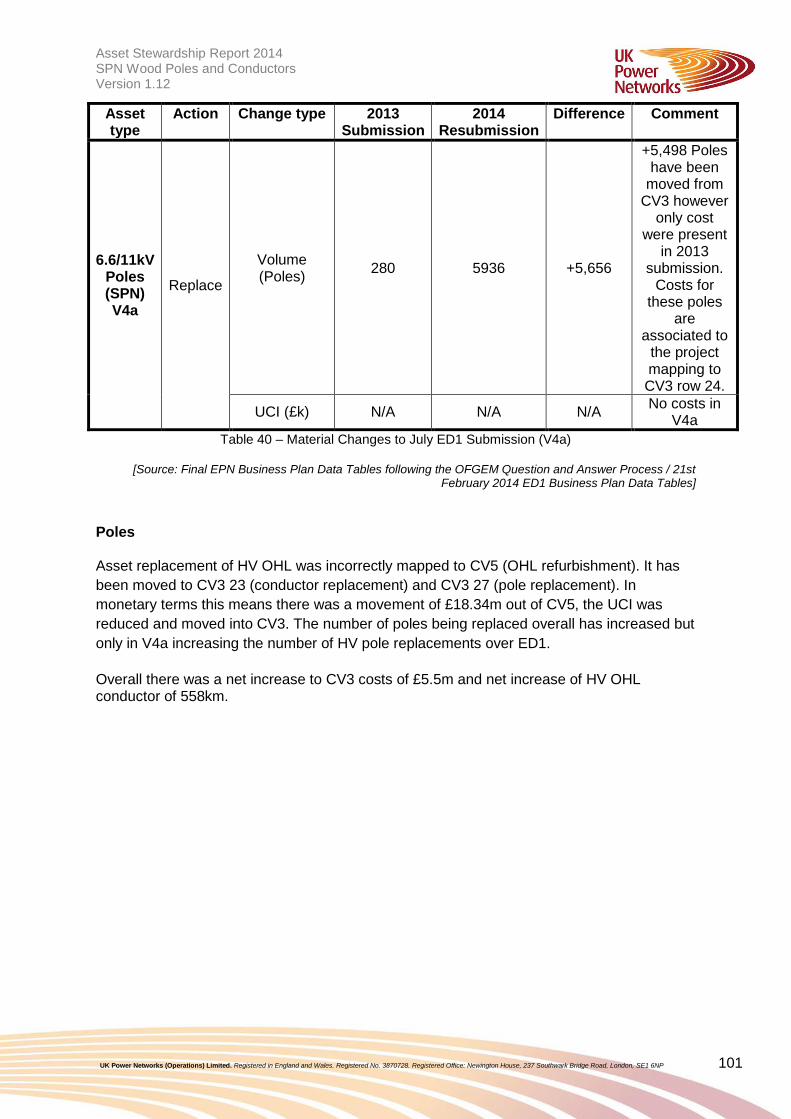
Asset Stewardship Report 2014 Working draft v0.1 SPN Wood Poles and Conductors Version 1.12
UK Power Networks (Operations) Limited. Registered in England and Wales. Registered No. 3870728. Registered Office: Newington House, 237 Southwark Bridge Road, London, SE1 6NP 101
Asset type
Action Change type 2013 Submission
2014 Resubmission
Difference Comment
6.6/11kV Poles (SPN) V4a
Replace
Volume (Poles)
280 5936 +5,656
+5,498 Poles have been
moved from CV3 however
only cost were present
in 2013 submission.
Costs for these poles
are associated to
the project mapping to CV3 row 24.
UCI (£k) N/A N/A N/A No costs in
V4a
Table 40 – Material Changes to July ED1 Submission (V4a)
[Source: Final EPN Business Plan Data Tables following the OFGEM Question and Answer Process / 21st February 2014 ED1 Business Plan Data Tables]
Poles Asset replacement of HV OHL was incorrectly mapped to CV5 (OHL refurbishment). It has
been moved to CV3 23 (conductor replacement) and CV3 27 (pole replacement). In
monetary terms this means there was a movement of £18.34m out of CV5, the UCI was
reduced and moved into CV3. The number of poles being replaced overall has increased but
only in V4a increasing the number of HV pole replacements over ED1.
Overall there was a net increase to CV3 costs of £5.5m and net increase of HV OHL conductor of 558km.