DOCTOR OF PHILOSOPHY - National Institute of Technology...
160
Preparation and Characterization of Bioactive Silica-based Ceramics derived from Rice Husk Ash A Thesis Submitted in Partial Fulfillment of the Requirements for the Degree of DOCTOR OF PHILOSOPHY by Jyoti Prakash Nayak (Roll No. 507CR002) Supervisor: Dr. Japes Bera DEPARTMENT OF CERAMIC ENGINEERING NATIONAL INSTITUTE OF TECHNOLOGY, ROURKELA AUGUST, 2010
Transcript of DOCTOR OF PHILOSOPHY - National Institute of Technology...

i
Preparation and Characterization of Bioactive Silica-based Ceramics
derived from Rice Husk Ash
A Thesis Submitted in Partial Fulfillment of the Requirements for the Degree of
DOCTOR OF PHILOSOPHY
by
Jyoti Prakash Nayak (Roll No. 507CR002)
Supervisor: Dr. Japes Bera
DEPARTMENT OF CERAMIC ENGINEERING
NATIONAL INSTITUTE OF TECHNOLOGY, ROURKELA AUGUST, 2010

ii
Dedicated to my parents and
years of hard work…..

iii
NATIONAL INSTITUTE OF TECHNOLOGY
ROURKELA, INDIA
Dr. Japes Bera 18th August, 2010 Associate Professor, Department of Ceramic Engineering, N. I. T. Rourkela, Rourkela- 769008, Orissa, India
This is to certify that the thesis entitled “Preparation and characterization of
bioactive silica-based ceramics derived from rice husk ash” being
submitted by Mr. Jyoti Prakash Nayak for the degree of Doctor of Philosophy in
Engineering from N.I.T. Rourkela, is a record of bonafied research work carried
out by him under my supervision at the Department of Ceramic Engineering. In
my opinion, this is a fit piece of work for submission for the degree of Doctor of
Philosophy. To the best of our knowledge, the work has not been submitted to
any other University or Institute for the award of any degree or diploma.
(Dr. J. Bera)
________________________________________________________________________
Mail ID: [email protected], [email protected]
Phone No: +91-661-2462201 (O), +91-661-2463204 (R), +91-9437246159 (M)
CERTIFICATE

iv
ACKNOWLEDGEMENTS
With deep regards and profound respect, I avail this opportunity to express my
deep sense of gratitude and indebtedness to Prof. Japes Bera, Department of Ceramic
Engineering, N. I. T. Rourkela, for introducing the present research topic and for
inspiring guidance. Two things that I have learned from him-quantitative approaches of
scientific problems and critical evaluation of results will be the invaluable legacy that I
will carry on for the rest of my career.
I would like to express my gratitude to Prof. Santanu Bhattacharyya especially,
for his valuable suggestions, encouragements and helps at various stages of the work.
Including him, I want to thank other members of my thesis Advisory Committee: Prof. S.
K. Pratihar and Prof. (Mrs.) S. Mishra (Department of Chemical Engineering), for their
useful comments and suggestions for the work included in this thesis. I would also like to
thank the professors in Ceramic Engineering department who I have a wonderful
intellectual interaction with during my research work.
I express my sincere thanks to Prof. S. K. Sarangi, Director, NIT Rourkela for
providing the financial assistanceship inform of institute fellowship, sponsored by
MHRD, Government of India during the last year of my research work. I also want to
thank Ministry of Environment and Forests, Govt. of India for sponsoring me to start the
research work.
It was a nice and memorable association with all the staff of my department with
whom I have enjoyed the working in research period- I wish to give them my heartfelt
thanks.
Finally, I would like to thank my family - my wife Baby and my little angel
“Gunu” who have been supporting me with love that I cherish the most. Last but
definitely not least, my parents and my relatives are so lovingly acknowledged. My
father, always catching my fall, all your support and endless encouragement is
acknowledged. My mother, for all your encouragement and prayers are so much
appreciated.
Maa Tarini - Namaste
Date: 18.08.2010 (Jyoti Prakash Nayak)

v
ABSTRACT
This thesis deals with the preparation and characterization of amorphous silica based
bioactive ceramics using rice husk ash (RHA) as silica source. Three types of silica
precursors were prepared depending on impurity and forms. Ceramics were fabricated
through conventional powder compaction, polymeric sponge replication and gelcasting
methods. Bioglass-ceramics and mesoporous silica aerogel were also prepared using
silica precursor. Mechanical, in vitro bioactivity and biodegradability properties of above
ceramics were investigated.
Brown ash (BA), obtained by burning husk at 700 oC, contains about 96 wt.%
amorphous SiO2 and the rest 4% impurities like CaO, Fe2O3, K2O, ZnO, and Mn2O3.
White ash (WA), prepared by burning acid-leached husk, and contains almost pure silica
(99.86%). Silica gel (SG) powder was prepared from BA through the alkaline extraction
of silica from ash followed by acid neutralization. SG contains about 99.79% silica.
During sintering, amorphous silica transformed into cristobalite phase at 1000, 1200, and
1300 oC, respectively for BA, SG, and WA ceramics. The earlier phase transformation in
BA was due to its highest impurity content. There was a fall in compressive strength of
all three (BA, SG and WA) sintered silica ceramics as and when amorphous silica
transformed to cristobalite. This was due to the crack formation by the high-low
displacive phase transformation of cristobalite.
Amorphous silica based scaffolds were fabricated by slurry impregnation process
using polymeric sponge as the replica. The aqueous slurry with 40 wt.% solid loading
showed good thixotropic behaviour in presence of polyvinyl alcohol (PVA) binder. The
strength of scaffold decreased above a sintering temperature where the amorphous silica
transformed into cristobalite. In vitro bioactivity test showed the formation of apatite
layer on silica scaffold surface.

vi
Amorphous silica-based porous ceramics was also prepared by gel casting method
using SG powder. The slurry with 42 vol.% solid loading in 1:30 (MBAM:AM)
monomer cross-linker solution, showed good thixotropic behaviour and generated a good
casting. Casted body also showed good machinability. Sintered gel-casted body having
~25% porosity showed a mechanical strength of 27.5 ± 0.2 MPa. In vitro bioactivity
experiment showed the formation of apatite layer on silica body.
Soda-lime-silica based bioglass-ceramics was synthesized via sol-gel route
utilizing sodium silicate, derived from rice husk ash. Gel powder was calcined at 700 °C
for 2 h to get a reactive glass-ceramic powder. The calcined powder mainly contains
combeite-I (Na6Ca3Si6O18) crystalline phase dispersed in amorphous glass matrix. The
material was sintered at different temperatures ranging from 900-1050 oC for 2 h. Glass-
ceramics sintered at 1000 oC showed better mechanical property among all. Strength of
1050 oC sintered body was low due to the formation of cracks in it.
Crystalline combeite phase of the glass-ceramics was found to dissolve easily in
TRIS buffer solution. Carbonated hydroxyapatite was formed on the surface of the glass-
ceramics within 3-days of incubation in SBF. 900 oC sintered body showed better
bioactivity and biodegradability than others. On increasing sintering temperature, both
bioactivity and biodegradability of glass-ceramic decreased due to the transformation of
glass into crystalline phases. Optimum sintering temperature for the material should be
around 950-1000 oC with respect to strength and bioactivity.
Silica aerogel was successfully prepared through ambient pressure drying method
using sodium silicate that was derived from WA. Surface modification and strengthening
of wet gel was obtained by aging it in tetraethylorthosilicate (TEOS)/ethanol solution.
Low surface tension liquid n-heptane was used to suppress capillary stresses and
associated shrinkage during ambient pressure drying. Aerogel with low density (0.67),
high porosity (80%) and a specific surface area of 273 m2.g-1 was obtained. Mesoporous
aerogel was tested for its bio-activity and degradability. Apatite was formed on aerogel
surface within 7-days of incubation in SBF. Aerogel showed quick release of silicic acid
in TRIS buffer solution during biodegradability test.

vii
All these results suggest that the rice husk ash could be a promising low cost raw
material for the preparation of bioactive amorphous silica, bioglass-ceramics and
mesoporous aerogel. Reticulated and gelcasted porous ceramics, bioglass-ceramics and
aerogel can be used as novel low cost biomaterial for different clinical applications like;
scaffold for Tissue engineering, biosensor, drug delivery, and protein encapsulations etc.
________________________
Keywords:
Rice husk; Rice husk ash; Silica; Amorphous; Ceramics; Porous Ceramics; Scaffold;
Gelcasting; Sol-gel; Glass-ceramics; Aerogel; Silanol; Bioactivity; Biodegradability;
Apatite; Microstructure; Compressive strength.

viii
CONTENTS
Page No.
Acknowledgement iv
Abstract v
Table of Contents viii
List of Figures xiv
List of Tables xix
Acronyms and Symbol xx
Chapter 1 - Introduction
1.1 Introduction 1
1.2 Layout of the Thesis 5
References 7
Chapter 2 - Literature Review
2.1 Amorphous Silica Derived from Rice Husk Ash 10
2.2 Bioactivity of Silica-based Ceramics 11
2.3 Bioactive Silica-based Ceramics by Powder Compaction Method 14
2.4 Bioactive Silica-based Scaffold Prepared by Polymer Sponge Replication Technique
15
2.5 Bioactive Silica-based Ceramics Prepared by Gelcasting Method 16
2.6 Bioglass-Ceramics 17
2.7 Silica Aerogel 20
2.8 Summary and Scope of Work 23
2.9 Objectives of Present Work 24
References 25
Chapter 3 - Experimental Details
3.1 Preparation of Amorphous Silica Precursor 32
3.1.1 Preparation of Rice Husk Ash Silica 32
3.1.2 Characterization of Ash Silica 32

ix
3.1.2.1 Chemical Analysis 32
3.1.2.2 Phase Analysis 34
3.1.2.3 Fourier Transformed Infrared (FTIR) Analysis 34
3.1.3 Preparation of Silica Gel Precursor 35
3.1.4 Characterization of Silica Gel 35
3.1.4.1 Chemical, Phase and FTIR Analysis 35
3.1.4.2 Microstructure and EDS Analysis 36
3.2 Silica Ceramics Prepared by Powder Compaction Method 37
3.2.1 Preparation of Silica Ceramics 37
3.2.2 Characterization of Silica powders and Ceramics 38
3.2.2.1 Particle Size Distribution of BA, WA and SG Powders
38
3.2.2.2 Phase Analysis and Rietveld Quantitative Phase Analysis
39
3.2.2.3 Density and Porosity of Sintered Specimen 40
3.2.2.4 Mechanical Property 41
3.2.2.5 In vitro Bioactivity 41
3.2.2.6 In vitro Biodegradability 43
3.3 Silica-based Scaffolds Prepared by Sponge Replication Technique
45
3.3.1 Preparation of Silica Scaffolds 45
3.3.2 Characterization of Silica Powders and Scaffolds 46
3.3.2.1 Zeta-potential 46
3.3.2.2 Sedimentation Test 47
3.3.2.3 Slurry Rheology 47
3.3.2.4 Fabrication of Reticulated Porous Body 48
3.3.2.5 Sintering of Reticulated Porous Body 48
3.3.2.6 Density and Porosity of Sintered Specimen 49
3.3.2.7 Mechanical Property 49
3.3.2.8 In vitro Bioactivity 49
3.4 Silica-Based Ceramics Prepared by Gelcasting Method 50
3.4.1 Preparation of Gelcasted Body 50

x
3.4.2 Characterization of Gelcasted Body 50
3.4.2.1 Slurry Preparation 50
3.4.2.2 Fabrication of Gelcasted body 52
3.4.2.3 Thermal Decomposition Behaviour of Gelcast Body
53
3.4.2.4 Sintering and Mechanical Property of Gelcast Body
53
3.4.2.5 In vitro Bioactivity 53
3.5 Sol-gel Synthesis of Glass-Ceramics 54
3.5.1 Preparation of Glass-Ceramics 54
3.5.2 Characterization of Gel Powder and Glass-Ceramics 54
3.5.2.1 Thermal Analysis of Gel Powder 54
3.5.2.2 Sintering and Phase Analysis of Glass-Ceramics
54
3.5.2.3 Mechanical Properties of Glass-Ceramics 56
3.5.2.4 In vitro Bioactivity of Glass-Ceramics 56
3.5.2.5 In vitro Biodegradability of Glass-Ceramics 56
3.6 Silica Aerogel by Ambient Pressure Drying 56
3.6.1 Preparation of Silica Aerogel 56
3.6.2 Characterization of Aerogel 57
3.6.2.1 Density, Apparent Porosity, Microstructure and FTIR analysis
57
3.6.2.2 Surface Area and Pore Size Distribution 57
3.6.2.3 In vitro Bioactivity and Biodegradability of Aerogel
59
References 60
Chapter 4 – Results and Discussion
4.1 Preparation and Characterization of Amorphous Silica Precursors
61
4.1.1 Introduction 61
4.1.2 Results and Discussion 61
4.1.2.1 Phase Analysis 61
4.1.2.2 Chemical Analysis 63

xi
4.1.2.3 FTIR Analysis 64
4.1.3 Summary 65
4.2 Silica-based Ceramics Prepared by Powder Compaction Method
66
4.2.1 Introduction 66
4.2.2 Results and Discussion 66
4.2.2.1 Particle Size Distribution 66
4.2.2.2 Phase Analysis 67
4.2.2.3 FTIR Analysis 69
4.2.2.4 Density and Apparent Porosity 70
4.2.2.5 Mechanical Property and Microstructure 72
4.2.2.6 In vitro Bioactivity 77
4.2.2.6.1 Phase Analysis 77
4.2.2.6.2 Microstructural Analysis 79
4.2.2.7 In vitro Biodegradability 80
4.2.3 Summary 81
4.3 Silica-based Scaffold Prepared by Polymer Sponge Replication Technique
82
4.3.1 Introduction 82
4.3.2 Results and Discussion 82
4.3.2.1 Particle Size Distribution 82
4.3.2.2 Zeta-potential 83
4.3.2.3 Sedimentation Behaviour 83
4.3.2.4 Slurry Rheology 84
4.3.2.5 Thermal Decomposition Behavior of Impregnated Sponge
86
4.3.2.6 Mechanical Property 87
4.3.2.7 In vitro Bioactivity 89
4.3.2.7.1 Phase Analysis 89
4.3.2.7.2 Microstructural Analysis 90
4.3.3 Summary 92
4.4 Porous Silica Ceramics Prepared by Gelcasting Technique 93

xii
4.4.1 Introduction 93
4.4.2 Results and Discussion 93
4.4.2.1 Zeta-potential (ζ) 93
4.4.2.2 Sedimentation 94
4.4.2.3 Gelation Time 95
4.4.2.4 Slurry Rheology 97
4.4.2.5 Thermal Decomposition Behaviour of Gelcasted body
98
4.4.2.6 Mechanical Property 99
4.4.2.7 In vitro Bioactivity 101
4.4.2.7.1 Phase Analysis 101
4.4.2.7.2 Microstructural Analysis 102
4.4.3 Summary 102
4.5 Sol-gel Glass-Ceramics 103
4.5.1 Introduction 103
4.5.2 Results and Discussion 103
4.5.2.1 Thermal Decomposition of Gel Powder 103
4.5.2.2 Phase Analysis 104
4.5.2.3 Particle Size Distribution of Glass-ceramics Powder
106
4.5.2.4 Mechanical and Microstructural Properties 107
4.5.2.5 In vitro Bioactivity 108
4.5.2.5.1 Phase and Microstructural Analysis
108
4.5.2.5.2 Effect of Sintering on Bioactivity 111
4.5.2.6 In vitro Biodegradability 114
4.5.2.7 Physical Model 115
4.5.3 Summary
117
4.6 Silica Aerogel Prepared by Ambient Pressure Drying 118
4.6.1 Introduction 118
4.6.2 Results and Discussion 118

xiii
4.6.2.1 Ambient pressure Drying Mechanism 118
4.6.2.2 Aerogel and its Characterization 119
4.6.2.3 In vitro Bioactivity 123
4.6.2.4 In vitro Biodegradability 124
4.6.3 Summary 125
References 126
Chapter 5 – Epilogue
5.1 Conclusions 129
5.2 Scope of Future work 130
Publications resulting from the Ph.D. work 131
Curriculum Vitae 132

xiv
LIST OF FIGURES
Fig. No Figure Caption Page No
Chapter 3
Fig. 3.1 Flow diagram for the preparation of BA and WA silica precursors.
33
Fig. 3.2 Silica hydrogel (a) and Dried Silica Gel (b). 35
Fig. 3.3 Flow diagram of the preparation of silica gel from BA. 34
Fig. 3.4 Flow diagram for the preparation of silica-based bioactive ceramics by powder compaction method.
38
Fig. 3.5 Absorbance at 820 nm as a function of concentration of silicon.
44
Fig. 3.6 Flow diagram for preparation of silica scaffolds. 45
Fig. 3.7 Schematic representation of electrical double layer and zeta-potential.
46
Fig. 3.8 (a) Optical photograph, and (b) SEM of raw sponge. 48
Fig. 3.9 Flow diagram for preparation of bioactive silica ceramics using gelcasting techniques.
51
Fig. 3.10 (a); (I) is the slurry in a beaker before gelling, (II)
demolding of casted body from the beaker, (III) green gel
casted body, (IV) dried cylindrical gelcated body, and (b)
rod shaped demolded gel casted body along with PVC pipe
and machined disk-shaped green bodies.
52
Fig. 3.11 Flow diagram of the procedure to prepare bioglass-
ceramics.
55

xv
Fig. 3.12 Flow diagram of the procedure used to prepare silica aerogel by ambient pressure drying technique using WA as silica source.
58
Chapter 4
Fig. 4.1 X-ray diffraction patterns for WA, BA, cleaned husk and raw husk.
61
Fig. 4.2 X-ray diffraction patterns for (a) Unwashed and (b) Washed Silica gel (SG).
62
Fig. 4.3 SEM and EDS photographs of (a) Unwashed and (b) Washed silica gel.
63
Fig. 4.4 FTIR spectra of (a) BA, (b) WA and (c) SG powders. 65
Fig. 4.5 Particle size distribution of BA, WA, and SG powders. 66
Fig. 4.6 Amorphous and crystalline XRD patterns of sintered specimen made of (a) BA, (b) SG, and (c) WA. Sintering temperature and crystalline phases are indicated.
67
Fig. 4.7 Rietveld refinement output for quantitative phase estimation of BA.
69
Fig. 4.8 FTIR spectra of BA, SG, and WA specimens. Sintering temperature is presented with each spectra.
70
Fig. 4.9 Variation of (a) bulk density and (b) water absorption of specimen with sintering temperature.
71
Fig. 4.10 Variation of compressive strength with sintering temperature.
73
Fig. 4.11 Surface microstructure of BA specimen sintered at different temperatures.
74
Fig. 4.12 Surface microstructure of SG specimen sintered at different temperatures.
75
Fig. 4.13 Surface microstructure of WA specimen sintered at different temperatures.
76

xvi
Fig. 4.14 XRD patterns of the silica ceramics after SBF incubation for different days; (a) BA (sintered at 900 oC), (b) SG (sintered at 1100 oC) and (c) WA (sintered at 1200 oC).
77
Fig. 4.15 Schematic diagram representing the events take place at
the interface between amorphous silica ceramics and SBF.
78
Fig. 4.16 SEM images and EDS spectra of BA (a-b), SG (c-d) and
WA (e-f) surfaces after incubation in SBF for 14 and 21
days respectively.
79
Fig. 4.17 (a) Change of silicon concentration, and (b) pH in TRIS
medium with incubation time.
80
Fig. 4.18 Particle size distribution of different silica powders. 82
Fig. 4.19 Zeta potential of different silica powders with pH. 83
Fig. 4.20 Sedimentation heights as a function of pH for silica powders.
84
Fig. 4.21 Rheological behaviors of different silica slurries (a) shear rate vs. viscosity (b) shear rate vs. shear stress.
85
Fig. 4.22 BA-slurry impregnated dry sponge cubes. 86
Fig. 4.23 Fabricated green and sintered sponge cubes. 86
Fig. 4.24 Weight losses as a function of temperature (heating rate@10 oC/min) for impregnated sponge.
87
Fig. 4.25 Effect of sintering temperature on porosity of different RPCs.
87
Fig. 4.26 Effect of sintering temperature on compressive strength of the RPCs.
88
Fig. 4.27 Compressive stress-strain curve of the SG based RPC. 89
Fig. 4.28 XRD patterns of SG scaffold (a) without and (b) with SBF treatment.
90

xvii
Fig. 4.29 SEM micrographs and EDS graph of SG scaffold with (a)
open and inter connected pores and (b, c, d, e) deposited
carbonated HAp on strut boundary with sponge-wig like
structure.
91
Fig. 4.30 Particle size distribution of silica gel powder. 93
Fig. 4.31 Zeta potential of silica gel powder with pH measured in 1:30 premix solution.
94
Fig. 4.32 Sedimentation behaviour of SG particles at different pH when dispersed in 1:30 premix solution.
95
Fig. 4.33 Variation of gelation time with initiator concentration (slurry with 42 vol.% solid loading).
96
Fig. 4.34 Optimized silica gel slurry after preparation. 97
Fig. 4.35 Rheological behavior of the optimized slurry. 97
Fig. 4.36 TGA-DSC curves of gelcast body at a heating rate of 10 oC/min.
98
Fig. 4.37 Different sintered shapes prepared by machining gelcasted ingot.
99
Fig. 4.38 Variation of porosity and compressive strength of gelcasted specimen with sintering temperature.
100
Fig. 4.39 XRD pattern of gelcasted SG-body after sintering at 1100 and 1200 oC.
100
Fig. 4.40 Surface microstructure of a gelcasted SG pellet after sintering at (a) 1100, and (b) 1200 oC.
101
Fig. 4.41 XRD patterns of SG scaffold (a) without, and (b) with SBF incubation.
101
Fig. 4.42 SEM and EDS of SG surface after 28 days SBF incubation.
102
Fig. 4.43 DSC-TGA plot of soda-lime-silicate gel powder. 104

xviii
Fig. 4.44 XRD patterns of gel powder; (a) as prepared, and after
calcination at (b) 300 (c) 500 (d) 700 and (e) 900 oC.
105
Fig. 4.45 XRD patterns of glass-ceramics; (a) as prepared (b)
powder calcined at 700 oC, and pellet sintered at (c) 900,
(d) 950, (e) 1000, (f) 1050 oC.
106
Fig. 4.46 Particle size distribution of glass-ceramics powder. 107
Fig. 4.47 Change of bulk density, porosity and compressive strength
of glass-ceramics with sintering temperatures.
108
Fig. 4.48 Surface microstructures of glass-ceramics those sintered at
(a) 900, (b) 950, (c) 1000 and (d) 1050 oC.
109
Fig. 4.49 XRD patterns of glass-ceramic surface after incubation in
SBF for different time periods.
110
Fig. 4.50 SEM image and EDS spectra of glass-ceramics; (a) as
prepared, and after incubation in SBF for (b) 3 (c) 14, and
(d) 21 days.
110
Fig. 4.51 XRD patterns of glass-ceramics specimen, (a) sintered at
900 oC; and the patterns after 3-days SBF incubation of
specimen those sintered at (b) 900, (c) 950, (d) 1000, and
(e) 1050 oC.
112
Fig. 4.52 SEM image and EDS spectra of 3-days SBF incubated
glass-ceramic specimen those sintered at (a) 900, (b) 950
(c) 1000, and (d) 1050 oC respectively.
113
Fig. 4.53 Dissolution kinetics of glass-ceramics those sintered at
different temperatures; (a) Change in pH of TRIS medium,
and (b) water absorption capacity of specimen with
incubation period.
114

xix
Fig. 4.54 Schematic diagram representing the events take place at
the interface between bioglass-ceramics and the SBF.
116
Fig. 4.55 Photographs of silica aerogel (a) strengthened by TEOS,
(b) dried monolithic translucent piece.
119
Fig. 4.56 SEM and EDS photographs of silica aerogel. 120
Fig. 4.57 DSC/TGA curves of air-dried silica aerogel. 120
Fig. 4.58 FTIR spectra of silica aerogel after heating at different temperatures.
121
Fig. 4.59 Nitrogen adsorption-desorption isotherm of silica aerogel. 122
Fig. 4.60 Pore size distribution of silica aerogel. 122
Fig. 4.61 SEM images and EDS spectra of aerogel after incubation in SBF for (a) 7 (b) 14 and (c) 21 days.
123
Fig. 4.62 XRD pattern of aerogel specimen after 21-days incubation in SBF.
124
Fig. 4.63 Change of silicon concentration and pH in TRIS medium with incubation time for aerogel biodegradation.
125
LIST OF TABLES
Table No Table Caption Page No
Table 3.1 Amounts of reagents for preparation of SBF. 42
Table 4.1 Chemical analysis of raw materials (mass %). 64

xx
Acronyms & Symbol
A Area of Cross-section
APS Ammonium persulfate
AM Acrylamide
BA Brown Ash
BD Bulk density
BET Brunauer-Emmet-Teller
BGC Bioglass-ceramics
BOD Biological Oxygen Demand
BSE Back scattered electrons
D Diameter
DTA Differential thermal analysis
EDS Energy dispersive X-ray analysis
EtOH Ethanol
FTIR Fourier Transformed Infrared
G Goodness of fit
GC Glass-ceramics
HAp Hydroxyapatite
HCA Hdroxycarbonate Apatite
Kg Kilogram
kmol Kilomole
MBAM Methylene-bisacrylamide
min Minutes
mL Milliliter
mm Millimeter
mol Mole
MPa Mega Pascal
MW Molecular Weight
P Breaking Load
Po Vapor pressure

xxi
pH Potential of Hydrogen
PVA Polyvinyl alcohol
PVC Polyvinyl Chloride
RH Rice Husk
RHA Rice Husk Ash
SBF Simulated Body Fluid
SE Secondary Electron
SEM Scanning Electron Microscope
SG Silica Gel
T Transmittance
TE Tissue Engineering
TEMED Tetramethylethylenediamine
TEOS Tetraethyl orthosilicate
TGA Thermo gravimetric analysis
TMOS Tetramethyl orthosilicate
UV/VIS Ultra Violet-Visible
vol Volume
Wa Suspended weight
Wd Dry weight
Ws Soaked weight
WA White Ash
XRF X-ray Fluorescence
XRD X-ray diffraction
Yi Observed intensity
Yic Calculated intensity
cm Centimeter
gm Gram
h Hour (s)
K Kelvin
KV Kilo volt
nm Nano meter

xxii
r Radius
t Thickness
wt Weight
Å Angstrom
θ Bragg’s angle oC Degree Celsius
μ m Micronmeter
g Gram
β Beta
α Alpha
ζ Zeta-potential
% Percentage
~ About
± Standard Deviation
< Less than
> Greater than
γ Surface tension
π Pie

xxiii
Chapter 1
Introduction

1
1.1 Introduction During the past four decades, a great revolution has occurred in the uses of ceramics to
improve the quality of human life. This revolution is the innovative use of specially
designed ceramics-termed as “bioceramics” for the potential replacement or repairing of
lost, injured or diseased bone [1].
When a biomaterial is placed within the human body, tissue reacts towards the
implant in a variety of ways depending on the material type. According to the tissue
responses, a biomaterial may be classified into bioinert, bioactive, and bioresorbable [2].
The term bioinert refers to any materials that after introducing into the physiological
environment, it will induce a minimal biological response with absence of toxic in nature
[3]. Several ceramic materials, like titania, alumina, and partially stabilized zirconia are
widely used clinically as bioinert materials.
A bioactive material can be defined as that able to form bone like apatite layer on
its surface when in contact with physiological fluids in vivo or with simulated body fluids
(SBF) [4]. This layer seems to be responsible for the bonding of bioactive ceramics to the
living bone. Bioactive ceramics like, glass, glass-ceramics, hydroxyapatite (HAp),
calcium phosphates, and calcium silicate have been used for practical clinical
applications. Bioactive ceramics may be resorbable or non-resorbable. Bioresorbable
refers to a material that upon placement within the living body starts to dissolve
(resorbed) and slowly replaced by advancing tissue (such as bone). Common examples of
bioresorbable ceramic material is tricalcium phosphate [Ca3(PO4)2]. Calcium oxide,
calcium carbonate and gypsum are other common bioresorbable materials that have also
been utilized.
Bioactive ceramics have attracted increasing attention as promising biomaterials
for bone tissue engineering [5]. Bone is a complex biomineralized system with an
intricate hierarchical microstructure assembled through the deposition of apatite minerals
within a collagenous matrix [6]. Even if bone is known for its self-healing abilities, it
cannot grapple with larger defects. The current treatment methods used to treat bone
defects such as transplantation and implantation do not restore the original function of the
tissue it replaces. Thus, a tissue engineered solution is considered ideal [7].

2
Tissue engineering is the use of a combination of cells, engineering and materials
methods to repair or replace portions of or whole tissues (i.e., bone, cartilage, blood
vessels, bladder, skin etc.). A key component in tissue engineering for bone regeneration
is the scaffold that serves as a template for cell interactions and the formation of bone-
extracellular matrix to provide structural support to the newly formed tissues [8]. The
clinical success of the tissue-engineered construct is critically dependent on the
biomaterials and three-dimensional scaffolds which guide the growth of new tissue in
vitro and in vivo [9].
Since the discovery of silica-based bioactive glass by Hench in 1971 and then
ordered mesoporous silica materials in the early 1990s by scientists of the Mobil
Corporation [10] and Waseda University [11], these materials lead to the development of
a wide area of research on new silica-based bioactive materials for biomedical
applications [12]. Recently, the potential applications of silica-based materials like,
amorphous silica spheres [13], nano sphere of SiO2-γFe2O3 [14], bioglass [15], bioactive
glass-ceramics [16], mesoporous silica gel [17], silica aerogel [18] and silica star gel [19]
have been expanded into the biomedical field for bone tissue regeneration and drug
delivery purposes.
Silica in crystalline form induces adverse biological effects, while amorphous
silica is known to be bioactive, biocompatible, biodegradable, and non-toxic in living
tissue, as well as in corresponding simulated physiological conditions [20, 21].
Nowadays, along with above stated amorphous silica-based materials, amorphous fumed
and precipitated silicas are increasingly used in diagnostic and biomedical research.
In general, amorphous silica is prepared using silicon alkoxide raw materials;
such as tetramethylorthosilicate (TMOS), tetraethylorthosilicate (TEOS) and
polyethoxydisiloxane (PEDS), etc [22, 23]. However, such precursors are fairly
expensive [24]. Thus alternative low cost amorphous silica precursors are required to
substitute alkoxides. In that respect, a cheap source of amorphous silica of bio-origin
would be the rice husk ash (RAH). Although RHA contains minor amount of other
metallic impurities; it may be safely used in physiological environment as it is generated
from biomass.

3
Bioactive ceramics are used in the form of powder, densed ceramics, highly
porous reticulated ceramics, mesoporous ceramics, etc. Dense and porous ceramics are
fabricated through different methods like powder compaction, fiber bonding, solvent
casting/particulate leaching, gas foaming, phase separation, replication technique,
gelcasting, and sol-gel technique, etc [25-30]. Among them, powder compaction method
is mostly applicable for dense ceramics, the rest are for porous ceramics preparation.
Powder compaction, is the simplest method of producing dense structures of
rectangular, cubical, cylindrical and circular shapes. On the other hand, replication
technique is the most popular and the simplest method for producing reticulated porous
ceramics (RPC). The basic principle of this method involves dipping a sacrificial organic
template (polymer sponge) in ceramic slurry, squeezing the excess slurry out, then drying
at room temperature followed by pyrolysis and sintering which will eliminate the
template and results in a RPC [31]. Nowadays, HAp, calcium phosphate, bioactive glass
and glass-ceramics porous scaffolds are being fabricated through this route. Due to the
presence of ordered 3D interconnected open cell porous structure analogous to the
spongious bone, it allows cell attachment, proliferation, and differentiation, and pathways
for biofluids [32]. However, the mechanical properties of RPC scaffold still remain poor
due to the presence of high percent porosity and large pores.
Strength of porous body can be improved by decreasing pore size and increasing
packing density of structure. Gelcast ceramics can provide these characteristics. Gel
casting is a well-known wet forming method based on the combination of ceramic
processing and polymer chemistry. This process involves the dispersion of a ceramic
powder into a monomer solution and casting of this suspension into a non-porous mould.
Polymerization is then promoted by initiator/catalyst and consequently ceramic particles
are entrapped into the rigid and homogeneous polymeric network [33]. The main
advantage of this method is the high strength of green body that assures its machinability.
According to Jones and Hench [34], gel-casting results in the production of scaffolds
most closely mimicking the structure of trabecular bone. Moreover, the sintered gel-cast
bodies show relatively high mechanical strength than the RPCs due to their well-
densified connecting-cells [35]. Different bioactive ceramics like HAp, calcium

4
phosphate, and glass-ceramics are fabricated to complex shapes by this method for
different clinical applications.
As far as the bioactivity is concerned, silica-based glass and glass-ceramics are
most bioactive among all bioceramics [36]. Bioactive glasses and glass-ceramics have
attracted much attention towards clinical applications due to their good bioactivity,
osteoconductivity and biodegradability characteristics [37-39]. Glass-ceramics have
added advantage of better mechanical properties than glass [40]. Therefore, it is proposed
that bioactive glass-ceramics with mechanical properties much closer to that of natural
bone can be prepared [41]. Generally, glass-ceramics are prepared by the traditional
melting, quenching, and subsequent preheating for crystallization of glass [42–44]. This
method has disadvantage of evaporation of volatile component during high temperature
processing [45]. An alternative approach to prepare glass-ceramics without melting
operation is the sol-gel technique, which requires low processing temperature [46, 47].
This route enables a wide range of compositions with high purity, homogeneity and
production of various shapes; such as monoliths, powders, fibers or coatings [48].
Additionally, glass-ceramics obtained by this route exhibit higher surface area and
porosity which are the critical factors for their bioactivity [49]. Conventional sol-gel
process uses expensive alkoxysilane precursors for glass preparation. Research is going
on to get an alternative low cost silica source for sol-gel glass-ceramics. As stated above,
RHA can be a low cost source of amorphous silica for sol-gel glass-ceramics, as the
amorphous material can be easily dissolved into solution.
At present the most intense research work is going on in the area of ordered
mesoporous silica for drug delivery and other biomedical applications. The important
feature of mesoporous material is to host molecular size of particles within it. Silica
aerogel is one such ordered mesoporous material and is also used in biomedical
applications for controlled release of drugs, peptides, hormones, etc [50].
Aerogels are usually prepared by supercritical drying of wet silica gels [51-53].
However, supercritical drying process is so energy intensive and dangerous that real
practice and commercialization of the process is difficult [54]. An alternative cost-
effective process is required for commercial success for the production of aerogels.

5
Ambient pressure drying technique is an alternative process for aerogel synthesis. At the
same time, the use of cost effective silica source (RHA) for the preparation of aerogel
will be more economical and commercializable.
With this brief introduction about silica-based bioceramics and its different
fabrication techniques, this work presents some attempts to prepare bioactive amorphous
silica-based ceramics using rice husk ash and to characterize the bioactivity of these
ceramics.
1.2 Layout of the Thesis
The thesis has been divided into five chapters:
Chapter-1 presents a brief introduction of different silica based bioactive ceramics, their
fabrications and applications. The layout of the thesis is presented at the end of this
chapter.
Chapter-2 consists of a thorough literature review. This chapter incorporates background
information about amorphous silica derived from rice husk ash, bioactivity of silica-based
ceramics, bioactive silica-based ceramics by powder compaction method, bioactive
silica-based scaffolds prepared by polymer sponge replication technique, bioactive silica-
based ceramics prepared by gelcasting method, bioglass-ceramics using sol-gel
technique, and silica aerogel by ambient pressure drying.
Chapter-3 gives a detailed description of the experimental procedures, the materials, and
the characterization methods used in this research work.
Chapter-4 describes the results and discussion, which has been divided into six sections,
where, section 1 speaks about the preparation and characterization of amorphous silica
precursors, section 2 explains about the preparation and characterization of bioactive
silica ceramics by powder pressing method, Section 3 describes about the properties of
amorphous silica scaffolds prepared by polymeric sponge replication technique, section 4
narrates the characteristics of bioactive silica ceramics prepared by gelcasting method,
section 5 tells about sol-gel synthesis and characterization of bioglass-ceramics using
RHA as silica source and finally section 6 discusses the preparation of silica aerogel by
ambient pressure drying technique and its bioactivity characteristics.

6
Chapter-5 points out the conclusions based on the results of the investigation carried out
in chapter 4, and it also gives remarks for future work that could be carried out for
further exploitation of research.
A list of references has been given towards the end of each chapter. Finally, a list of
publications in-peer reviewed national and international journals related to the present
research work has been presented at the end.

7
References
[1] L.L. Hench, J. Am. Ceram. Soc. 74 [7] (1991) 1487.
[2] L.L. Hench, Biomaterials 19 (1998) 1419.
[3] S.M. Best, A.E. Porter, E.S. Thian, J. Huang, J. Eur. Ceram. Soc. 28 (2008) 1319.
[4] L.L. Hench, I.D. Xynos, J.M. Polak, J. Biomat. Sci. Polym E 15 (2004) 543.
[5] V. Maquet, A.R. Boccaccini, L. Pravata, I. Notingher, R. Jerome, Biomaterials 25
(2004) 4185.
[6] S.S. Liao, F.Z. Cui, W. Zhang, Q.L. Feng, J. Biomed. Mater. Res. B 69 (2004)
158.
[7] A.I. Muthutantri, Novel processing of porous bioceramics, Ph.D. thesis (2009).
[8] V. Karageorgiou, D. Kaplan, Biomaterials 26 (2005) 5474.
[9] A. Vats, N.S. Tolley, J.M. Polak, J.E. Gough, Clin. Otolaryngol. 28 (2003) 165.
[10] C. T, Kresge, M. E. Leonowicz, W. J. Roth, J. C. Vartuli, J. S. Beck, Nature 359
(1992) 710.
[11] T. Yanagisawa, T. Shimizu, K. Kuroda, C. Kato, Bull. Chem. Soc. Japan, 63
(1990) 988.
[12] A. Izquierdo-Barba, M. Colilla, M. Vallet-Regi, Journal of Nanomaterials,
doi:10.1155/2008/106970.
[13] A. H. Lu, F. Schuth, Adv. Mater. 18 (2006) 1793.
[14] S. Mornet, J. Portier, E. Duguet, J. Magn. Magn. Mater. 293 (2005) 127.
[15] C. A. Harper, Handbook of Ceramics, Glasses and Diamonds, Blacklick,
McGraw-Hill Professional Pub (2001).
[16] P. Li, Q. Yang, F. Zhang, T. Kokubo, J. Mater. Sci. Mater. Med. 3 (1992) 452.
[17] F. Balas, M. Manzano, P. Horcajada, M. Vallet-Regi, J. Am. Chem. Soc. 128
(2006) 8116.
[18] J.A. Toledo-Fernandez, R.O Mendoza-Serna, V. Morales, N. de la Rosa-Fox, M.
Pinero, A. Santos, L. Esquivias, J. Mater. Sci-Mater Medicine 19 (2008) 2207.
[19] M. Manzano, D. Arcos, M. Rodriguez-Delgado, E. Ruiz, F. J. Gil, M. Vallet-
Regi, Chem. Mater., vol. 18, pp. 5696-5703, 2006.

8
[20] P. Kortesuo, M. Ahola, S. Karlson, I. Kangasniemi, A. Yli-Urpo, J. Kiesvaara,
Biomaterials 21 (2000) 193.
[21] A. nieto, S. Areva, T. Wilson, R. Viitala, M. Vallet-Regi, Acta Biomater. 5 (2009)
3478.
[22] S. Radin, G. El-Bassyouni, E.J. Vresilovic, E. Schepers, P. Ducheyne,
Biomaterials 26 (2005) 1043.
[23] J. Andersson, J. Rosenholm, S. Areva, M. Linden, Chem. Mater. 16 (2004) 4160.
[24] Q. Tang, T. Wang, J. of Supercritical Fluids 35 (2005) 91.
[25] A.G. Mikos, A.J. Thorsen, L.A. Czerwonka, Y. Bao, R. Langer, D.N. Winslow,
J.P. Vacanti, Polymer 35 (1994) 1068.
[26] Y.S. Nam, J.J. Yoon, T.G. Park, J. Biomed. Mater. Res. 53 (2000) 1.
[27] E. Ebaretonbofa, J.R.G. Evans, J Porous Mater. 9 (2002) 257.
[28] Y.S. Choi, S.R. Hong, Y.M. Lee, K.W. Song, Y.S. Nam, T.G. Park, J. Biomed.
Mater. Res. 48 (1999) 631.
[29] S. Deville, E. Saiz, A. Tomsia, Biomater. 27 (2006) 5480.
[30] C. Wu, J. Chang, W. Zhai, S. Ni, J. Wang, J. Biomed. Mater. Res. B 78 (2006) 47.
[31] K. Schwartzwalder, H. Somers, A. V. Somers, (1963) US Patent No. 3090094.
[32] Q.Z. Chen, I.D. Thompson, A.R. Boccaccini, Biomater. 27 (2006) 2414.
[33] O.O. Omatete, M.A. Janney, R. A. Strehlow, Am. Ceram. Soc. Bull. 70 (10)
(1991) 1641.
[34] J.R. Jones, L.L. Hench, Curr. Opin. Solid State Mater. Sci. 7 (2003) 301.
[35] P. Sepulveda, F.S. Ortega, M.D.M. Innocentini, V.C. Pandolfelli, J. Am. Ceram.
Soc. 83 (12) (2000) 3021.
[36] D.L. Wheeler, M.J. Montfort, S.W. McLoughlin, J. Biomed. Mater. Res. A 55
(2001) 603.
[37] J. Wilson, S.B. Low, J. Appl. Biomater. 3 (1992) 123.
[38] M. Vallet-Regi, C.V. Ragel, A.J. Salinas, Eur. J. Inorg. Chem. (2003) 1029.
[39] L.L. Hench, J. Am. Ceram. Soc. 74 (1991) 1487.
[40] T. Kokubo, S. Ito, S. Sakka, T. Yamamuro, J. Mater. Sci. 21 (1986) 536.
[41] A. Salinas, M. Vallet-Regi, Z. Anorg, Allg. Chem. 663 (2007) 1762.
[42] T. Kasuga, Y. Abe, J. Non-Cryst. Solids 243 (1999) 70.

9
[43] Y. Zhang, J.D. Santos, J. Non-Cryst. Solids 272 (2000) 14.
[44] S. Kumar, P. Vinatier, A. Levasseur, K.J. Rao, J. Solid State Chem. 177 (2004)
1723.
[45] Z. Hong, A. Liu, L. Chen, X. Chen, X. Jing, J Non-Cryst. Solids 355 (2009) 368.
[46] D.B. Joroch, D.C. Clupper, J Biomed. Mater. Res. 82A (2007) 575.
[47] J. Roman, S. Padilla, M. Vallet-Regi, Chem. Mater. 15 (2003) 798.
[48] J. Lao, J.M. Nedelec, Ph. Moretto, E. Jallot, Nuclear Instru. Methods in Phy. Res.
B 245 (2006) 511.
[49] M. Vallet-Regi, L. Ruiz-Gonzalez, I. Izquierdo, J.M. Gonzalez-Calbet, J. Mater.
Chem. 16 (2006) 26.
[50] Gill, A. Ballesteros, Trends Biotechnol 18 (2000) 282.
[51] H. Tamon, T. Kitamura, M. Okazaki, J. Colloid Interf. Sci. 197 (1998) 353.
[52] S. Yoda, S. Ohshima, F. Ikazaki, J. Non-Cryst. Solids 231 (1998) 41.
[53] Q. Tang, T. Wang, J. Supercritical Fluids, 35 (2005) 91.
[54] F. Shi, L. Wang, J. Liu, Mater. Lett 60 (2006) 3718.

10
Chapter 2
Literature Review

10
2.1 Amorphous Silica Derived from Rice Husk Ash
Rice husk ash (RHA) is a cheap source of amorphous silica. It is generated by burning
rice husk (RH), an agricultural byproduct. RH is used as a fuel for generation of energy
mainly in rice milling plants [1]. A large quantity of RHA is generated as waste material
from rice mill. RHA is also generated from industries like brick making, distilleries,
furnaces, gasifiers, and power plants, where RH is used as a fuel [2]. Usually, the ash is
dumped in the open, which causes air and water pollution by blowing wind. Thus it is a
great challenge to dispose off RHA or to utilize it economically for other useful purposes.
RHA contains mainly silica [3] and that silica may be used for a variety of
purposes. Silica of the ash may be either amorphous or crystalline or mixture of both,
depending on the burning temperature [4, 5]. The ashes obtained after slow combustion
of husk at low temperatures contain amorphous silica, whereas ash formed at higher
temperatures contains mostly crystalline silica. This crystalline silica comprises mainly
cristobalite and tridymite with small proportions of quartz [6]. There are limited uses of
crystalline silica as compared to the amorphous silica, because amorphous silica has high
surface area and is very reactive due to its nano-particle size. Amorphous silica of RHA
has been widely used in vegetable oil refining, pharmaceutical products, detergents,
adhesives, chromatograph column packing, and different ceramic compositions [7-9].
Amorphous silica can be prepared by burning the husks in a controlled
temperature. According to Hamad et al [10] and Jain et al [11], ash prepared at a
temperature of about 500 to 600 oC, consists of amorphous silica. Cristobalite was
formed at 800 oC. At 1150 oC, both cristobalite and tridymite were present [10].
However, Nehdi et al [12] stated that silica in RHA can remain in amorphous form at
combustion temperatures up to 900 oC if the combustion time is less than one hour,
whereas crystalline silica is produced at 1000 oC with combustion time greater than 5 min
[12]. Chopra et al [13] has reported that for incineration temperatures up to 700 °C the
silica was predominantly in amorphous form. Adam et al [14], Kurama et al [15], and
Della et al [16] have prepared white silica powder by pyrolyzing the RH in a muffle
furnace at 700 oC for 5 hours.

11
Completely burnt ash is grey or whitish in colour, while partially burnt ash is
blackish [17, 18]. RHA generally contains 90-95% silica, rest being impurities like
magnesium, calcium, iron, sodium, potassium, phosphorus, manganese, and zinc; of
which the concentration of calcium is highest [16, 6]. The ash containing >99% (w/w)
silica can be prepared by acid leaching of husk before burning [6, 19, 20, 21].
Quality of RHA silica depends on the leaching procedure. Real et al [20] found
that leaching of rice husks with an acid solution before their combustion would yield
silica powder of high specific surface area. However, if the ash is leached with acid, the
specific surface area of silica would be poor [20]. Different kind of acids like HCl,
H2SO4, H3PO4 and HNO3 are used for acid treatment of RH [18, 20, 21, 22, 23]. Liou et
al [24] suggested that leaching of husk with HCl is better than that with H2SO4, HNO3 or
H3PO4.
Several researchers suggested that RHA can be an economically viable raw
material for the production of silicates and silica gel [25-28]. The amorphous natures of
silica makes it extractable by simple boiling in alkali solution and hence provide a low
energy method as an alternative to the current high energy method for the production of
silicates using crystalline silica [29]. Silica gel can be prepared by acid neutralization of
sodium silicate extracted from RHA [25, 30, 31].
Adam and Chua [32] did the work on the adsorption of palmytic acid on
chemically modified RHA. Bonded phase octadecylsilyl (ODS) silica has been prepared
by Burns et al [33] using purified RHA, reflux with sodium hydroxide solution followed
by precipitation as a gel. The gel was spray dried, further purified by washing with
concentrated hydrochloric acid then distilled water prior to vacuum drying and
silanization and end-capping. Guha and Roy [34] have prepared silica gel from RHA to
use in gas chromatography. They reported that the silica gel prepared from RHA is
comparable with commercial silica gel.
2.2 Bioactivity of Silica-based Ceramics
Silica plays an integral role in the bioactivity and osteogenic potential of bioglass, as
shown by Hench et al [35]. They suggested that the high density of surface silanol groups
(Si-OH) that exist on amorphous silica is the basis for enhanced hydroxyapatite (HAp)

12
and bone formation in bioglass and related glass ceramic systems. The silanol groups are
proposed to be very effective at inducing HAp formation [36].
Hypothesis on physiological silicon research was developed by Hench [37] and
Birchall [38]. Silicic acid is essential for the healthy growth of bone and connective
tissue. They conclude that the interaction of silicic acid with many metals in vivo
produces positive health effects. Mann et al [39] suggested on the bioactivity of
amorphous silica. Silica is present in aquatic organisms, the protruding spicules of certain
sponges, and the teeth of certain molluscs. These biosilicates are made up of particulate
or solid-gel silica with species-specific sizes, shapes, and aggregate arrangements.
` Xynos et al [40] pointed out that, silica based materials provide an additional
parameter in the form of biologically active, soluble SiO2, which is known to affect, e.g.,
osteoblast activity. Hench et al [41, 42] also suggested that amorphous silica owing to its
bioactivity is used in medical devices. Pereira et al [43] reported that silica-gel samples
with high volume percentage porosity and pore size > 2 nm are suitable for inducing in
vitro hydroxycarbonate apatite (HCA) formation in simulated body solutions.
Kortesuo et al [44] pointed out that amorphous silica is biocompatible and
degradable in living tissue, as well as in corresponding simulated physiological
conditions. Kros et al [45] studied the toxicity of silica over silica based hybrid material.
They proved that sol-gel silica coating material is biocompatible and non-toxic, and the
response of cells such as osteoblasts to silica gels was quite good as studied by Anderson
et al [46]. Several authors suggested that silica nanoparticles are biocompatible and
degrade over time in the body [47–49].
The biocompatibility of silica precursor was monitored by Gill and Ballesteros
[50]. It was also shown by Meyer et al [51] that tetraalkoxysilanes can be successfully
exchanged for tetrakis (2-hydroxyethyl) orthosilicate (THEOS). Several researchers like
Radin et al [49], Santos et al [52], and Avnir et al [53] suggested that silica xerogel
prepared from alkoxysilane can be coated on titanium at room temperature, especially for
cardiovascular therapeutic applications. The silica xerogel system is an attractive material
to apply to metallic substrates, because sol-gel derived silica xerogels are known to have

13
excellent bioactivity and exhibit chemical bonding to the surrounding tissues, particularly
bone.
Gallardo et al [54] reported that, porous silica gels obtained from TEOS and
polyacrylic acid (PAA) was bioactive in vitro. Nieto et al [55] studied the cell viability in
a wet silica gel, made from TEOS and found that the cells can stay alive within the gel.
Klein et al [56] also studied on bone bonding ability of silica gel with respect to the
synthesis temperature of the gel and shown that the lower temperature treatment at 400
and 600°C allowed the silica gels to be degraded easily, while gels treated at 800 and
1000°C were more stable.
Many researchers suggested that sol-gel derived silicas are potential biomaterials
and they have been studied both for tissue regeneration and drug delivery applications.
They are used either in a pure SiO2 gel form or in the form of composites [57-61].
Kortesuo et al [44] observed that, no changes in liver, kidney, uterus or lymph nodes
related to silica xerogel, even though the applied amount of silica xerogel was high.
Recently, some reviews reported on sol-gel silica and hybrid biomaterials and the
processes of biosilicification [62-64]. Novel synthetic approaches, allowing the
immobilization of enzymes, living cells, antibodies, immune molecules, polysaccharides,
phospholipids, nucleic acids, proteins and other biomolecules in the sol-gel matrices,
have been proposed. Kros et al [45] studied prospects of silica based hybrid materials for
glucose sensor. This hybrid material was found to be non-toxic and also slows down the
growth of fibroblasts on its surface, which is important since a thick capsule could inhibit
the diffusion of glucose to an implanted glucose sensor [65, 66].
Many researchers including Hench et al [67] and Sepulveda et al [68] studied the
dissolution features of glass and glass-ceramics in SBF medium. Silica is a bio-
degradable material as stated by Carlisle [69] and proved by other researchers. Xie et al
[70] studied the dissolution characteristics of bioactive titanium-particle-containing
dicalcium silicate coating in tris-hydroxy methyl amino methane (TRIS) buffered
solution.
Dissolution study of porous poly (DL-lactide-co-glycolide) (PLGA)/bioactive
glass composite was carried out in TRIS medium by Orva et al [71]. Similar dissolution

14
features of zinc-containing bioactive glasses in TRIS medium was also studied by Aina et
al [72].
2.3 Bioactive Silica-based Ceramics by Powder Compaction Method
Powder pressing technique is the conventional ceramic manufacturing process commonly
used to produce “green” bodies prior to final sintering. In this process ceramic powders
are compacted using die and punch to give different shapes.
Silica based bioceramics have also been prepared by this conventional powder
compaction method by several researchers. Lin et al [73] studied the biocompatibility of
CaSiO3 ceramics. CaSiO3 powder was uniaxially compacted and sintered in air. The
sintered CaSiO3 ceramics showed excellent biocompatibility.
Ni et al [74] studied the preparation and characterization of forsterite (Mg2SiO4)
bioceramics. Forsterite powder was uniaxially pressed and sintered at different
temperatures. The in vitro study showed the significant osteoblasts adhesion, spreading
and growing on the surface of forsterite ceramic.
Wu et al [75] prepared bredigite (Ca7MgSi4O16) ceramics by uniaxial pressing of
the bredigite powders at 10 MPa followed by isostatic pressing at 200 MPa. The compact
specimens were sintered at 1350 oC for 8 h. The apatite formation was observed within 7-
days immersion in SBF upon the bredigite ceramics. The cell proliferation was also very
good on the surface of this kind of silica based biomaterials.
Agathopoulos et al [76] studied bioactivity of a new silica based bioceramic, by
characterizing it through in vitro assessment. They used glass powder and compacted by
uniaxial pressing. Compacted discs were sintered at several temperatures between 650 to
920 oC. Glass-ceramics sintered at 800 oC showed better mechanical property and
bioactivity.
Similarly, Liu et al. studied the bioactivity, biodegradability and mechanical
strength of silica-based bioglass-ceramics. The bioglass powder was pressed and sintered
at 500, 800, 1000, and 1200 oC, respectively. At 1000 oC, the ceramic material showed
maximum density. The formation of hydroxyl-carbonate apatite layer on the surface of 7-
days SBF incubated specimen confirmed its bioactivity [77].

15
Many researchers also studied the synthesis, mechanical property and bioactivity
of nanocrystalline apatite [78], hydroxyapatite [79], hydroxyapatite-CaO and
hydroxyapatite-CaO-bioactive glass [80], calcium-phosphate [81], β-TCP [82], calcium
carbonate [83] etc. using powder pressing technique.
2.4 Bioactive Silica-based Scaffold Prepared by Polymer Sponge
Replication Technique
The sponge replication method is a very popular method of producing ceramic foams
owing to its simplicity and efficiency. The method was patented in 1963 by
Schwartzwalder and Somers [84]. The method involves the use of a polymeric template,
usually polyurethane (PU) foam, which is immersed in slurry that infiltrates the porous
structure of the template by repetition of compression/release processes. Excess slurry is
squeezed out from the polymeric template, to obtain a homogeneous coating on the foam
struts and the foam is allowed to dry either at ambient temperature for 12 hours [85] or at
elevated temperatures of approximately 80 °C for about 10 minutes [86].
The dried body is heat treated to burn out the polymer template and sintered at
higher temperatures to obtain dense structures. The result is a three-dimensional open-cell
foam structure of high porosity and interconnectivity. The structure is known as
reticulated porous ceramic (RPC). Using the sponge replication technique it is possible
to obtain RPC of high porosity (~90%), pore size of >400-500 μm and pore
interconnectivity [84].
Han et al [87, 88] investigated the preparation of porous silica composite using
the reticulate method. They studied the effect of sintering temperature and addition of
SiO2 on the strength of the porous body. The strength of the porous body decreased at the
temperature at which cristobalite phase appeared. On adding 30 wt.% of SiO2, the
composite porous body achieved maximum compressive strength and on further addition
of silica content, the strength was decreased. At 1360 oC sintering temperature and 30
wt.% of SiO2 addition, the silica composites were able to obtain up to 80% porous and
interconnected structures. These composites were also deduced that the compressive
strength of porous body has an exponential reduction with porosity.

16
Wen et al [89], also prepared porous silica composites by choosing different
sponge templates and the relationship between pore size, porosity and mechanical
strength of the sintered products were investigated. It is important to burn out the
polymer template slowly, using an appropriate heating rate, in order to minimize the
damage (e.g. formation of microcracks) to the ceramic coating [90].
Kim et al [91] used this reticulate method to fabricate a scaffold-coating system
using poly (α-caprolactone) (PCL) polymer and HA hybrid, that are be used in hard tissue
regeneration. This was an attempt to improve the mechanical properties of scaffolds and
to enhance wound healing by incorporating vancomycin, which is an antibiotic. Callcut
and Knowles [92] used glass reinforced slurry to fabricate scaffolds and the foams were
coated twice. A significant enhancement of both the scaffold density and mechanical
properties was observed and there seemed to be no degradation of the macrostructure by
using the poly urethane (PU) template. Zhu et al [93], improved the mechanical strength
of porous body by vacuum degassing the slurry, which was used for impregnation.
Jones et al [94] studied the bioactivity and mechanical property of silica-based
glass-ceramic scaffold. The scaffolds were sintered at 600, 700, 800 and 1000 oC. As
sintering temperatures were increased, compressive strength increased from 0.34 to 2.26
MPa. Bioactivity of this scaffold decreased on increasing the temperature from 600 to
1000 oC, however, apatite formation was observed within 3-days incubation in SBF for
all glass-ceramic specimens.
Ramay and Zhang [95] introduced a method of producing scaffolds by combining
the gel-casting and the replication method. This was an attempt to overcome the
disadvantages and to develop a method to combine the advantages of both methods. It
was possible to obtain a pore size range of 200-400 μm of interconnected porosity and the
elastic modulus obtained was comparable to that of cortical bone. These features were
more favorable for bone tissue engineering applications than the structures produced only
by gel-casting.
2.5 Bioactive Silica-based Ceramics Prepared by Gelcasting Method
Gelcasting is considered to be one of the most versatile routes for producing foam
structures of complex shapes and good mechanical properties. This method involves

17
preparing homogeneous slurry that consists of the ceramic powder, water, dispersing
agents and a monomer solution. Into this slurry, initiators and catalysts are added to
promote polymerization at the time of gelling. The gelled body with a rubbery texture is
dried, machined and then fired to remove the polymer [96, 97].
Gelcasting method has also been used to produce silica based porous body for
different applications. Xueman [98] studied the rheological properties of aqueous silicon
slurry used for gelcasting. They concluded that, rheology of silicon slurries would be
influenced by solid concentration, concentration of dispersant and high-speed dispersing
time.
Yiechen et al [99], studied the preparation of gelcasted body using fused silica of
60 wt.% in the slurry. By using this technique, silica based ceramics were able to
withstand 40 MPa of bending strength on addition of nano meter silica dopant.
Zhang et al [100], prepared porous silica-based gelcasted body, where pores were
developed by purging N2 into the silica slurry of 68 wt.% solid loading. The porous body
contained ~73.5 % porosity with pores size of 90 to 340 μm.
Li et al had studied the change of shrinkage rate with porosity of porous silica
ceramics, which was prepared by gelcasting technique [101]. Padilla et al studied the
bioactivity and biocompatibility of gel-casted porous bodies with different shapes
prepared by using HA/sol-gel glass mixtures [102]. These materials showed in vitro
bioactive behavior in simulated body fluid; additionally, the proliferation and spreading
assays with osteoblastic cells (HOS) showed that the materials are biocompatible.
2.6 Bioglass-Ceramics
In the 1970’s, Hench et al [103] reported the bioactive material, Bioglass. It was then
realized that the special properties of this kind of ceramic material could be exploited to
provide better materials for biomedical applications. The field has since expanded
enormously. Bioglass® 45S5, was a four-component silica glass (45 wt.% SiO2, 24.5
wt.% CaO, 24.5 wt.% Na2O and 6 wt.% P2O5). The low silica content and the presence of
sodium ions in the glass result in very rapid ion exchange with the proton and hydronium
ions of physiological solutions. The ion exchange creates alkalinity at the implant
18
interface with the body fluid leading to the nucleation and crystallization of a carbonate
apatite layer that is equivalent chemically and structurally to the biological bone mineral
[104].
Hench et al [105] had studied the melt-derived bioactive glasses, i.e. ternary
system of Na2O-CaO-SiO2 glasses, which was highly reactive and showed good
bioactivity when exposed to an aqueous medium of SBF.
Kokubo [106] had discussed the bioactivity of glass-ceramics (GC) on the basis of
their surface chemistry. The observed result shows that apatite phase present in the GC
does not play an important role in forming the chemical bond to bone. However, Ca-P
rich layer formed on the surface of the GC in the body environment plays the essential
role in forming the chemical bond between the glass-ceramic and bone.
Ohtsuki et al [107] had reported an intimate contact between living tissues and
Ceravital glasses. Vogel and Holan [108] developed the Bioverit family of melt-derived
GC. They found that its ability to form the apatite layer in GC decreased with increasing
MgO content.
Roman et al [109] had studied the bioactivity of melt-derived CaO-SiO2-P2O5-
MgO-CaF2 GC, which was chemically treated with HCl for different time period through
in vitro studies. Verne et al [110] studied the bioactivity of different sets of melt-derived
glasses and GC belonging to the CaO-SiO2-P2O5-MgO-K2O-Na2O system. Both glass
and GC showed bioactivity after the pretreatment in SBF.
Agathopoulos et al [76] studied the bioactivity of a new silica based bioceramic,
SiO2-Al2O3-B2O3-MgO-CaO-Na2O-F GC, by characterizing it through in vitro
assessment. Glass was prepared by conventional melting procedure. The glass powder
was compacted by uniaxial pressing and compacted disks were sintered at several
temperatures between 650 to 920 oC. GC sintered at 800 oC showed better mechanical
property and bioactivity. Submicron precipitates, enriched in Ca and P (found by EDS),
were uniformly formed on the surface of glass-ceramics after 7 days of immersion in
SBF.

19
Itala et al [111] had studied the property of porous bioactive glasses, which were
immersed in SBF for several hours. In this study, it was revealed that sintering
temperature also affects the formation of crystalline hydroxyapatite layer on the specimen
after immersion in SBF for 20-24 hours.
In the early 1990s, sol-gel processing was introduced for the synthesis of
bioactive glasses [112]. The sol-gel route allows glasses of higher purity and
homogeneity to be obtained at temperatures notably lower than those required to obtain
glasses by the melting method. These bioactive glasses, converted into bioactive glass-
ceramics (BGC) have higher bioactivity and resorbability in vitro, which have application
as bone graft material [113].
Various research groups used the sol-gel route for the preparation of BGC in the
ternary SiO2-CaO-P2O5, quaternary SiO2-CaO-P2O5-Mg systems and the binary SiO2-
CaO system for biomedical applications. In vitro studies have shown that nucleation and
crystallization rates of HCA depend on many factors including the sol-gel glass
composition.
Xia and Chang [114] prepared nano BGC using the sol-gel technique. In this
study, they prepared nano bioactive-glass powders. The size of the bioactive glass
particles were controlled in the range of 20-40 nm by controlling the concentration of the
ammonia solution in the alkali-mediated sol-gel process.
Li et al [115] studied the bioactivity of sol-gel derived quaternary bioglass system
between SiO2, CaO, P2O5 and Na2O, formed apatite layers in a TRIS buffer solution. Lao
et al [116] prepared gel-glass powders containing 75wt.% SiO2, 25wt.% CaO using the
sol-gel process. The reason for choosing a glass in the SiO2-CaO binary system was due
to the expected higher homogeneity in the glass. Furthermore, the study of the Ca-P layer
growth process was easier since the phosphate ions were only coming from the solution.
Balamurugan et al [117] studied the in vitro bioactivity and biocompatibility of
sol-gel derived glass composed of SiO2-CaO-P2O5-ZnO. Incorporation of Zn into the
bioglass system does not diminish the bioactivity of bioglass. Addition of Zn is beneficial
for cell attachment and for maintaining the pH of SBF within the physiological limit by
forming zinc hydroxide in the SBF solution.

20
SiO2-CaO-P2O5 BGC nanoparticles were prepared by Hong et al [118], via the
combination of sol-gel and coprecipitation processes. BGC nanoparticles with 30-100 nm
in diameter were obtained. After 3-days soaking in SBF solution, the BGC nanoparticles
could rapidly induce the carbonated hydroxyapatite from solution.
Bioactivity of GC is fully dependent upon the sintering temperature or
crystallization temperature of the material. On increasing the sintering temperature,
bioactivity and bio-dissolvability of the specimen decreased, although, mechanical
properties of the specimen effectively increased [119]. Similar observation was also made
by Peitl et al [120] when studying the GC having a chemical composition of 1Na2O-
2CaO-3SiO2 and 1.5Na2O-1.5CaO-3SiO2, containing different wt.% of P2O5.
Similarly, Liu et al [77] studied the bioactivity, biodegradability and mechanical
strength of sol-gel derived bioglass coated alumina scaffolds. Their study resulted in
bioglass powder with the composition of 58 mol% SiO2-38 mol% CaO-4 mol% P2O5.
The bioglass powder was then pressed uniaxially and sintered at 500, 800, 1000, and
1200 oC, respectively. It was found that at sintering temperatures above 800 oC, the
bioactivity and bio degradability of the bioglass started to decrease.
2.7 Silica Aerogel
Aerogels, which are highly porous, low-density materials consisting of nano-sized pores,
are of interests for applications as varied as thermal insulation, catalysis, drug delivery,
etc [121].
The synthesis of silica aerogel can be divided into three general steps, which are
(a) preparation of gel, (b) ageing of gel, and (c) drying of gel. In the first step, colloidal
system of liquid character changed into colloidal system of solid character in which the
dispersed substance forms a continuous, coherent framework that is interpenetrated by
liquid. The gel prepared is aged in its mother solution to strengthen the gel, so that
shrinkage during the drying step will be a minimum. In the last step, the gel should be
freed of the pore liquid. To prevent the collapse of the gel structure, drying is made to
take place under special precaution.

21
Kistler in 1931 [122] first attempted the preparation of silica aerogel by removing
the liquid from a gel by a gas (air). The liquid held inside the gel has greater pressure
than its vapour. To transform this liquid into a supercritical fluid (gas), a certain
temperature is required which is known as critical temperature. Above that critical
temperature the air can be replaced for that supercritical fluid to get a non-collapsed gel
structure [123].
During drying under atmospheric conditions, the nanostructured porous layers are
exposed to the capillary force and large surface tension, which destroys the
microstructure and cause the shrinkage of the gel [124]. Supercritical drying (SCD)
method is usually used to solve this problem. In this process, the liquid in a substance is
transformed into gas in the absence of surface tension and capillary stress. Thus, no
damage occurs to the material’s delicate nanostructured pore network. However, the SCD
is relatively an expensive process due to its high-pressure operating condition. For this
reason there is a great interest in subcritical or ambient pressure drying.
Ambient-pressure method for silica aerogel includes both surface modification
and network strengthening of sol-gel derived silica wet gel. To prepare silica gel, silicon
alkoxides like, tetramethoxysilane (TMOS) tetraethoxysilane (TEOS),
methyltriethoxysilane (MTES) and polyethoxydisiloxane (PEDS) are mainly used [125-
128]. In Ambient-pressure method, the water-alcohol mixture in the pores of the gel is
first exchanged for a water-free solvent. Then, reaction with silylating agent takes place
so that Si-OH groups are silylated. Silylation is carried out directly in the water phase of
the hydrogel, which results in a solvent exchange as well as a phase separation of the gel
water and the solvent. The replacement of H from the Si-OH groups by the hydrolytically
stable Si-R groups through the oxygen bond prevents the adsorption of water and hence
results in the hydrophobic aerogels [129].
Washing in H2O/ethanol (EtOH) increases the liquid permeability of the solid part
of the gel by a dissolution reprecipitation process for silica. Aging in a siloxane solution
increases the stiffness and strength of the alcogel by adding new monomers to the silica
network as stated by Kirkbir et al [130]. Einarsrud et al [131] removed the pore water
through exchanging EtOH and n-heptane.

22
All the silicon alkoxides materials are not only expensive but also hazardous and
can cause blindness (with TMOS). To avoid the cost of raw materials, Schwertfeger et al
[124] used water glass as a cheaper silica source. Waterglass (or sodium silicate) solution
was used for low-cost aerogel production by Kistler [132] using super critical drying
method. Water glass based aerogel was also prepared by Schwertfeger [124], Tyler [133],
Rao [134] and others using SCD method. Einarsrud et al [128] investigated properties of
aerogels synthesized by different precursors and reported that waterglass, produced
aerogel with the highest degree of monolithicity because these gels had the highest
stiffness and the largest pore size.
In the case of water glass based aerogel, the sol preparation is quite different. The
sol in this case is silicic acid (H2SiO3) which is produced by exchanging Na+ ions of
water glass with H+. To remove sodium ions in the water glass, the dilute sodium silicate
is passed through ion-exchange column filled with strong acidic cation resin such as
sulphonated polystyrene. Adopting this ion exchanging technique, Lee et al [135] and
Hwang et al [136] have prepared silica aerogel. But, Sarawade et al [137] had removed
the sodium portion from the silica aerogel beads by washing with distilled water for 12 h.
Silica aerogel was prepared in this study by ambient pressure drying method using
sodium silicate as silica precursor.
Wang and Tang [138, 139] prepared silica aerogel from RHA by sol-gel process
followed by supercritical drying. A new process for preparing silica aerogel was
proposed. RHA, which is not only cheap but also rich in silica, was used as the silicon
source. Li and Wang [140] prepared the aerogel through sol-gel process using RHA; a
small quantity of TEOS was used as the modifier, and added into the hydro-sol. Then the
aerogel was prepared by drying the gel at atmospheric pressure.
Several authors have suggested that silica aerogel is a promising biocompatible
scaffold for the immobilization of biological material for a variety of applications [141]
and as matrices in the design of biosensors [142-144].
Fernandez et al [145] studied the preparation and bioactivity of
wollastonite/aerogels composites obtained from a TEOS-MTES matrix through the sol-

23
gel process. Bioactivity of this aerogel was studied by immersing it in SBF for 25 days. A
spherical apatite layer covered the entire surface of the aerogel.
Li et al [146] prepared protein encapsulated silica aerogel to form bioaerogel via
the sol-gel polymerization of TEOS with an ionic liquid as the solvent and pore-forming
agent and the solvent extraction process. The final gel was dried through Freeze-drying
process. It was found that the DsRed protein was quite stable in this aerogel.
2.8 Summary and Scope of Work
From this brief survey, it may be concluded that amorphous silica of RHA can be used
for different novel applications. This amorphous silica has a promising future as a bio-
material because it originates from biomass.
Literature survey shows that silica-based materials are frequently used for
different bio-applications due to their good bioactivity and bio-degradability
characteristics. Silica-based bioceramics are mainly prepared from silicon alkoxides.
However, there is no report on the preparation of silica-based bioceramics using RHA
and/or silica gel derived from RHA.
From the literature survey it has been found that silica-based ceramics which are
being used for different bio-applications are made by conventional pressing technique.
For that reason, amorphous silica derived from RHA should be investigated for its
bioactivity on the specimen fabricated through conventional pressing method, because
this method is very simple and quick.
Literature survey shows that silica-based reticulated porous ceramics are also
fabricated through sponge replication technique. Most of the ceramics are silicate glass,
glass-ceramics and fused silica ceramics. However, there is no report on preparation of
pure amorphous silica-based scaffolds by replication technique. Similarly, silica-based
porous ceramics have also been fabricated by gelcasting technique. But, there is no report
on gelcasting of pure amorphous silica-based porous ceramics.
From the literature survey it has been found that sol-gel derived silica-based
bioglass-ceramics are better than melt driven one. All the silica-based bioceramics are
mainly prepared by using silicon alkoxides as silica precursors. However, there is no

24
report on preparation of silica-based bioglass-ceramics by sol-gel technique using RHA
as silica precursors.
It has been found that ambient pressure dried silica aerogel is much more cost
effective than supercritical dried aerogel. Also, silica aerogel has been prepared mainly
by using silicon alkoxides as silica precursors. There is no report on preparation of
bioactive silica aerogel through ambient pressure drying process using RHA as the silica
precursor.
2.9 Objectives of Present Work
The aim of the present study is the utilization of amorphous silica from rice husk ash for
bio-active ceramic preparation with the following objectives:
(a) Preparation and characterization of amorphous silica derived from rice husk and
silica gel derived from husk ash.
(b) Preparation and characterization of silica-based bioactive ceramics by conventional
pressing method.
(c) Fabrication and characterization of silica-based reticulated porous scaffold using
polymeric sponge replication technique.
(d) Fabrication and characterization of silica-based bioactive porous ceramics using
gelcasting technique.
(e) Sol-gel synthesis of bioglass-ceramics using rice husk ash as a source for silica and
its characterization.
(f) Preparation of bioactive silica aerogel through ambient pressure drying using husk
ash as silica source.

25
References
[1] F. Bondioli, F. Andreola, L. Barbieri, T. Manfredini, A.M. Ferrari, J. Eur. Ceram.
Soci. 27 (2007) 3483.
[2] A. Sharma, T.R. Rao, Bioresource Technology 67 (1999) 53.
[3] M. Andreoli, G.T. Luca, E.S. Miyamaru Seo, Materials Letters 44 (2000) 294.
[4] Bronzeoak Ltd., 3 MWe Rice Husk Power plants in Indonesia: A Feasibility
Study. Internal Report, 2001.
[5] The UK Steel Association (www.uksteel.org).
[6] T-Z Liou, Mater. Sci. Eng. A 364 (2004) 313.
[7] C.J. Brinker, G.W. Scherer, Applications. In: Sol–Gel Science, The Physics and
Chemistry of Sol–Gel Processing. Academic Press, Inc., San Diego, CA, (1990).
[8] R.K. Iler, Silica gels and powders. In: Iler, R.K. (Ed.), The Chemistry of Silica.
John Wiley and Sons, New York, NY, (1979).
[9] A. Proctor, P.K. Clark, C.A. Parker, J. AOCS 72 (1995) 459.
[10] M.A. Hamad, I.A. Khattab, Thermochim. Acta 48 (1981) 343.
[11] A. Jain, T.R. Rao, S.S. Sambi, P.D. Grover, Biomass and Bioenergy 7 (1995) 285.
[12] M. Nehdi, J. Duquette, A. El Damatty, Cement and Concrete Res. 33 (2003)
1203.
[13] S.K. Chopra, S.C. Ahluwalia, S. Laxmi, ESCAP/RCTT 3rd Workshop on Rice
Husk Ash Cements, New Delhi, 1981.
[14] F. Adam, K. Kandasamy, S. Balakrishnan, J Colloid and Int. Sci. 304 (2006) 137.
[15] S. Kurama, H. Kurama, Ceram. Int. 34 (2) (2008) 269.
[16] V.P. Della, I. Kuhn, D. Hotza, Mater. Letters 57 (2002) 818.
[17] P.K. Metha, In Proc. UNIDO/ESCAP/RCTT Workshop on RHA, Cement,
Prshuwur. Pukistun, 1979.
[18] M.A. Rahman, The Internatlonal Journal of Cement Composites and Lightweight
Concrete, 9 (2) 1987.
[19] J. James, M.S. Rao, Thermochim. Acta 97 (1986) 329.
[20] C. Real, M.D. Alcala, J.M. Criado, J. Am. Ceram. Soc. 79 (8) (1996) 2012.

26
[21] K. Kandasamy, S. Balakrishnan, J. Colloid Inter. Sci. 304 (2006) 137.
[22] A. Chakraverty, P. Mishra, H.D. Banerjee, J. Mater. Sci. 23 (1988) 21.
[23] H. Halimaton, N.M.M. Mohd, E. Salasiah, L. Endang, R. Zainab, J. Non-Cryst.
Solids 211 (1997) 126.
[24] T-H Liou, F-W Chang, J-J Lo, Ind. Eng. Chem. Res. 36 (1997) 568.
[25] U. Kalapathy, A. Proctor, J. Shultz, Bioresour. Technol. 85 (2002) 285.
[26] R.V. Krishnaro, M.M. Godkhindi, Ceram. Int. 18 (1992) 243.
[27] P.W. Lender, R. Ruiter, Inorganic and Metal-Containing Polymeric Materials.
Plenum Press, New York, (1990).
[28] T.C. Luan, T.C. Chou, Ind. Eng. Chem. Res. 29 (1990) 1922.
[29] D.D. Bui, Rice husk ash a mineral admixture for high performance concrete, Civil
Engineering and Geosciences, Ph.D. Thesis, Delft University of Technology,
Delft, 2001.
[30] U. Kalapathy, A. Proctor, J. Schultz, Biores. Technol. 73 (2000a) 257.
[31] S.R. Kamath, A. Proctor, Cereal Chem. 75 (1998) 484.
[32] F. Adam, J.H. Chua, J. Colloid and Inter. Sci. 280 (2004) 55.
[33] D.T. Burns, K. Tungkananurak, D. Jadsadapattarakul, Microchim. Acta 154
(2006) 81.
[34] O.K. Guha, J. Roy, J. Chromatography. 437 (1988) 244.
[35] L.L. Hench, H.A. Paschall, J. Biomed. Mater. Res. 7 (1973) 25.
[36] P. Li, C. Ohtsuli, T. Kokubo, N. Soga, N. Nakamura, T. Yamamuro, J. Am.
Ceram. Soc. 75 (1992) 2094.
[37] L.L. Hench, Chem. Ind. 14 (1995) 547.
[38] J.D. Birchall, Chem. Sot. Rev. 24 (1995) 351.
[39] S. Mann, Biomimetic Materials Chemistry, New York, (1996).
[40] I.D. Xynos, A.J. Edgar, L.D.K. Buttery, L.L. Hench, J.M. Polak, J. Biomed.
Mater. Res. 55 (2001) 151.
[41] L.L. Hench, J.M. Polak, Science 295 (2002) 1014.
[42] L.L. Hench, J. Am. Ceram. Soc. 74 (1991) 1487.
[43] M. Pereira, A. Clark, L.L. Hench, J. Am. Ceram. Soc. 78 (1995) 2463.

27
[44] P. Kortesuo, M. Ahola, S. Karlson, I. Kangasniemi, A. Yli-Urpo, J. Kiesvaara,
Biomaterials 21 (2000) 193.
[45] A. Kros, M. Gerritse, V.S.I. Sprakel, N.A.J.M. Sommerdijk, J.A. Jansen, R.J.M.
Nolte, Sensors Actuators B 81 (2001) 68.
[46] S.I. Anderson, S. Downes, C.C. Perry, A.M. Caballero, J. Mater. Sci-Mater. Med.
9 (1998) 731.
[47] C. Barbe, J. Bartlett, L.G. Kong, K. Finnie, H.Q. Lin, M. Larkin, et al. Adv.
Mater. 16 (2004) 1959.
[48] A. Roy, T.Y. Ohulchanskyy, H.E. Pudavar, E.J. Bergey, A.R. Oseroff, J. Morgan,
et al. J. Am. Chem. Soc. 125 (2003) 7860.
[49] S. Radin, G. El-Bassyouni, E.J. Vresilovic, E. Schepers, P. Ducheyne,
Biomaterials 26 (2005) 1043.
[50] I. Gill, A. Ballesteros, J. Am. Chem. Soc. 120 (1998) 8587.
[51] M. Meyer, A. Fischer, H. Hoffmann, J. Phys. Chem. B 106 (2002) 1528.
[52] E.M. Santos, S. Radin, B.J. Shenker, I.M. Shapiro, P. Ducheyne, J. Biomed.
Mater. Res. 41 (1998) 87.
[53] D. Avnir, T. Coradin, O. Lev, J. Livage, J. Mater. Chem. 16 (2006) 1013.
[54] G. Janet, G. Pablo, J.M. Galliano, P. Lopez, Biomaterials 23 (2002) 4277.
[55] A. nieto, S. Areva, T. Wilson, R. Viitala, M. Vallet-Regi, Acta Biomater. 5 (2009)
3478.
[56] C.P.A.T. Klein, P. Li, J.M.A. de Blieck-Hogervorstt, K. de Groot, Biomaterials 16
(1995) 715.
[57] M. Vallet-Regi, A. Ramila, R.P. Del Real, J. Perez-Pariente, Chem. Mater. 13
(2001) 308.
[58] M. Vallet-Regi, F. Balas, M. Colilla, M. Manzano, Solid State Sci. 9 (2007) 768.
[59] T. Peltola, M. Jokinen, S. Veittola, J. Simola, A. Yli-Urpo, J. Biomed. Mater. Res.
54 (2001) 579.
[60] M. Vallet-Regi, F. Balas, D. Arcos, Angew Chem Int Ed 46 (2007) 7548.
[61] D. Arcos, I. Izquierdo-Barba, M. Vallet-Regi, J. Mater. Sci-Mater. Medicine 20
(2009) 447.
[62] C. Sanchez, B. Julian, P. Belleville, M. Popall, J. Mater. Chem. 15 (2005) 3559.

28
[63] C. Sanchez, H. Ariribart, M.M.G. Guille, Nat. Mater. 4 (2005) 277.
[64] D. Avnir, T. Coradin, O. Lev, J. Livage, J. Mater. Chem. 16 (2006) 1013.
[65] S.P. Hudson, R.F. Pradera, R. Langer, D.S. Kohane, Biomaterials 29 (2008) 4045.
[66] T. Nash, A.C. Allison, J.S. Harington, Nature 210 (1966) 259.
[67] L.L. Hench, R.J. Splinter, W.C. Allen, T.K. Greeenlee, J. Biomed. Mater. Res. 2
(1971) 117.
[68] P. Sepulveda, J. R. Jones, L. L. Hench, J. Biomed. Mater. Res. 61 (2) (2002) 301.
[69] E.M. Carlisle, Science 167 (1970) 279.
[70] Y. Xie, X. Liu, P.K. Chu, X. Zheng, C. Ding, Surface & Coatings Techno 200
(2005) 1950.
[71] E. Orava, J. Korventausta, M. Rosenberg, M. Jokinen, A. Rosling, Polymer
Degradation and Stability 92 (2007) 14.
[72] V. Aina, G. Malavasi, A. Fiorio Pla, L. Munaron, C. Morterra, Acta Biomater. 5
(2009) 1211.
[73] K. Lin, W. Zhai, S. Ni, J. Chang, Y. Zeng, W. Qian, Ceram. Intl. 31 (2005) 323.
[74] S. Ni, L. Chou, J. Chang, Ceram. Intl. 33 (2007) 83.
[75] C. Wu, J. Chang, J. Wang, S. Ni, W. Zhai, Biomaterials 26 (2005) 2925.
[76] S. Agathopoulos, D. U. Tulyaganov, P. Valerio, J.M.F. Ferreira, Biomaterials 26
(2005) 2255.
[77] J. Liu, X. Miao, Ceram. Intl. 30 (2004) 1781.
[78] C. Drouet, F. Bosc, M. Banu, C. Largeot, C. Combes, G. Dechambre, C.
Estournes, G. Raimbeaux, C. Rey, Powder Technol. 190 (2009) 118.
[79] M. Trecant-Viana, T. Le Neel, C. Canto-Nicolazo, E. Champion, M. Leroy, G.
Daculsi, J. Phys. 7 (1997).
[80] E. Hatzistavrou, X. Chatzistavrou, L. Papadopoulou, N. Kantiranis, E.
Kontonasaki, A.R. Boccaccini, K.M. Paraskevopoulos, Mater. Sc. Eng. C 30
(2010) 497.
[81] C. Balazsi, F. Weber, Z. Kover , E. Horvath, C. Nemeth, J. Euro. Ceram. Soc. 27
(2007) 1601.
[82] K. Lin, J. Chang, J. Lu, W. Wu, Y. Zeng, Ceram. Intl. 33 (2007) 979.
29
[83] A. Lucas-Girot, P. Langlois, J.C. Sangleboeuf, A. Ouammou, T. Rouxel, J.
Gaude, Biomaterials 23 (2002) 503.
[84] K. Schwartzwalder, H. Somers, A. V. Somers, US Patent No. 3090094 (1963).
[85] Q.Z. Chen, A.R. Boccaccini, H.B. Zhang, D.Z. Wang, M.J. Edirisinghe, J.Am.
Ceram. Soc. 89 (2006a) 1534.
[86] H.W. Kim, H.E. Kim, J. C. Knowles, J Biomedical Mater Res B-Appl. Biomater.
70 (2004a) 270.
[87] Y.S. Han, J.B. Li, B. Chi, Z.H. Wen, J. Porous Mater. 10 (2003) 41.
[88] Y.S. Han, J.B. Li, Q.M. Wei, Z.H. Wen, Mater. Letters 57 (2003) 3847.
[89] Z.H. Wen, Y.S. Han, L. Liang, J.B. Li, Mater. Char. 59(9) (2008) 1335.
[90] H.W. Kim, H.E. Kim, J.C. Knowles, J. Biomed Mater Res-Appl. Biomater. 70B
(2004a) 270.
[91] H.W. Kim, J.C. Knowles, H.E. Kim, J. Mater. Sci-Mater. Medicine 16 (2005b)
189.
[92] S. Callcut, J.C. Knowles, J. Mater. Sci-Mater. Medicine 13 (2002) 485.
[93] X. Zhu, D. Jiang, S. Tan, Mater. Letters 51 (2001) 363.
[94] J.R. Jones, L.M. Ehrenfried, L.L. Hench, Biomaterials 27 (2006) 964.
[95] H.R. Ramay, M.Q. Zhang, Biomaterials, 24, (2003) 3293.
[96] P. Sepulveda, Am. Ceram. Soc. Bul. 76 (1997) 61.
[97] S. Dhara, M. Pradhan, D. Ghosh, P. Bhargava, Adv. Appl. Ceram. 104 (2005) 9.
[98] P. Xueman, X. Mingxia, L. Hui, L. Xiaolei, J. Huiming, Colloids and Surf. A 317
(2008) 136.
[99] H. Yichen, W. Zhongjian, L. Jianying, J. Non-Cryst. Solids 354 (2008) 1285.
[100] F-Z Zhang, T. Kato, M. Fuji, M. Takahashi, J. Eur. Ceram. Soc. 26 (2006) 667.
[101] S. Li, H. Du, D. Yang, J.G.D. Song, G. Li, Key Engg. Mater. 434-435 (2010) 79.
[102] S. Padilla, S. Sanchez-Salcedo, M. Vallet-Regi, J. Biomed. Mater. Res. A 75(1)
(2005) 63.
[103] L.L. Hench, O. Anderson, Wilson J (Eds.), An introduction to bioceramics. World
Scientific, Singapore (1993).
[104] L.L. Hench, J. Am. Ceram. Soc. 74 (1991) 1487.

30
[105] L.L. Hench, R.J. Spinter, W.C. Allen, T.K. Greenlee, J. Biomed Mater.Res.2
(1971) 117.
[106] T. Kokubo, J. Non-Cryst. Solids 138 (1990) 120.
[107] C. Ohtsuki, H. Kushitani, T. Kokubo, S. Kotani, T. Yamamuro, J. Biomed. Mater.
Res. 25 (1991) 1363.
[108] W. Vogel, W. Holan, J. Non-Cryst. Solids (1990) 1223.
[109] J. Roman, A.J. Salinas, M. Vallet-Regi, J.M. Oliveira, R.N. Correia, M.H.
Fernandes, Biomaterials 22 (2001) 2013.
[110] E. Verne, O. Bretcanu, C. Balagna, C.L. Bianchi, M. Cannas, S. Gatti, C. Vitale-
Brovarone, J. Mater. Sci: Mater. Medicine 20 (2009) 75.
[111] A. Itala, H.O. Ylaneen, J. Yrjans, T. Heono, T. Hentunen, M. Hupa, H. T. Aro, J.
Biomed. Mater. Res. 62 (2002) 404.
[112] R. Li, A.E. Clark, L.L. Hench, J. Appl. Biomaterials 2 (1991) 231.
[113] D.B. Joroch, D.C. Clupper, J Biomed. Mater. Res. 82A (2007) 575.
[114] W. Xia, J. Chang, Mater. Letters 61 (2007) 3251.
[115] R. Li, A.E. Clark, L.L. Hench, in Transactions of 16th Annual Meeting of the
Societey for Biomaterials (Charleston SC, May 20-23, 1990), Vol. XII. Society
for Biomaterials, Algonquin, IL, 40 (1990).
[116] J. Lao, J.M. Nedelec, P. Moretto, E. Jallot, N.I.M. in Phy Res B 245 (2006) 511.
[117] A. Balamurugan, G. Balossier, S. Kannan, J. Michel, A.H.S. Rebelo, J.M.F.
Ferreira, Acta Biomater. 3 (2007) 255.
[118] Z. Hong, A. Liu, L. Chen, X. Chen, X. Jing, J. Non-Cryst. Solids 355 (2009) 368.
[119] L.L. Hench, O. Peital, G.L. Torre, E.D. Zanotto, Bioactive ceramics and Method
of preparing., USPTO: US Patent 5981412 (1997).
[120] O. Peital, E.D. Zanotto, L.L. Hench, J. Non-Cryst solids, 292 (2001) 115.
[121] G.W. Scherer, Adv. Colloid Interf. Sci. 76–77 (1998) 321.
[122] S.S Kistler, Nature 127 (1931) 741.
[123] S. Frohnhoff, R.A. Fischer, T. Heinrich, Thin Solid Films 255 (1995) 115.
[124] F. Schwertfeger, D. Frank, M. Schmidt, J. Non-Cryst. Solids. 225 (1998) 24.
[125] J.H. Harreld, T. Ebina, G. Stucky, J. Non-Cryst. Solids 298 (2002) 241.
[126] L.A. Colon, Y. Guo, A. Fermier, Anal. Chem. 68 (1996) 2753.

31
[127] N. Ishizuka, H. Minakuchi, K. Nakanishi, N. Soga, K. Hosoya, N. Tanaka, Anal.
Chem. 72 (2000) 1275.
[128] M-A. Einarsrud, E. Nilsen, A. Rigacci, G.M. Pajonk, D. Valette, M. Durant, B.
Chevalier, P. Nitz, F. Ehrburger-Dolle, J. Non-Cryst. Solids 285 (2001) 1.
[129] F. Schuth, K.S.W. Sing, J. Weitkamp, (Eds.), Hand Book of Porous Solids, 3
(2002) 2014.
[130] F. Kirkbir, H. Murata, D. Meyers, S. Ray Chaudhuri, J. Non-Cryst. Solids 225
(1998) 14.
[131] M-A. Einarsrud, J. Non-Cryst. Solids 225 (1998) 1.
[132] S.S. Kistler, J. Phys. Chem. 36 (1932) 52.
[133] L.J. Tyler, Dow Corning, GB 682574, (1959).
[134] A.V. Rao, A.P. Rao, M.M. Kulkarni, J. Non-Cryst. Solids 350 (2004a) 224.
[135] C.J. Lee, G.S. Kim, S.H. Hyun, J. Mater. Sci. 37 (2002) 2237.
[136] S-W. Hwang, H.H. Jung, S.H. Hyun, Y.S. Ahn, J. Sol-Gel Sci. Technol. 41
(2007) 139.
[137] P.B. Sarawade, J-K Kim, A. Hilonga, H.T. Kim, Solid State Sci. 12 (2010) 911.
[138] T.Wang, Q. Tang, CN Patent 1449997A (2003).
[139] Q. Tang, T.Wang, J. Supercrit. Fluids 35 (2005) 91.
[140] T. Li, T. Wang, Mater. Chem. Phy. 112 (2008) 308.
[141] M. Power, B. Hosticka, E. Black, C. Daitch, P. Norris, J. Non-Cryst Solids 285
(2001) 303.
[142] X. Chen, G.S. Wilson, Langmuir 20 (2004) 8762.
[143] J.M. Wallace, J.K. Rice, J.J. Pietron, R.M. Stroud, J.W. Long, D.R. Rolison, Nano
Lett. 3 (2003) 1463.
[144] Anon, Science 302 (2003) 199.
[145] J.A. Toledo-Fernandez, R. Mendoza-Serna, V. Morales, N.de la Rosa-Fox, M.
Pinero, A. Santos, L. Esquivias, J Mater Sci: Mater. Medicine 19 (2008) 2207.
[146] Y.K. Li, M.J. Chou, T-Y Wu, T-R Jinn, Y.W. Chen-Yang, Acta Biomater. 4
(2008) 725.

32
Chapter 3
Experimental Details

33

32
3.1 Preparation of Amorphous Silica Precursor
3.1.1 Preparation of Rice Husk Ash Silica
Rice husk (RH) was collected from a local rice mill. Unwanted fine dust materials were
removed through air-blowing separation technique and then washed properly to remove
the physically adhered impurities using tap water. After successive washing, RH was
dried in an air-circulated oven at 100 ± 2 oC for 12 h to get clean and dry RH.
The cleaned RH was burned at 700 oC for 6 h in air to get the rice husk ash
(RHA). The ash was brownish in colour and termed brown ash (BA). To get impurity
free ash, cleaned husk was acid leached using 3 N HCl (Merck, India) solutions under
boiling condition for 1 h followed by thorough washing with warm distilled water to
remove acid. The husk was then dried and burned following same procedure stated above
for BA. The ash thus obtained was whitish in color and designated as WA. Fig. 3.1 shows
the flow diagram of preparation of BA and WA.
3.1.2 Characterization of Ash Silica
3.1.2.1 Chemical Analysis
Elemental content of RH, BA and WA was determined by X-ray fluorescence (XRF,
Horiba MESA 500W). XRF spectroscopy is widely used for the qualitative and
quantitative elemental analysis of samples. XRF has the advantage of generally being
non-destructive, multi-elemental detection, fast analysis, and cost effective. The main
disadvantage is that analyses are generally restricted to elements heavier than fluorine.
The principle of X-ray fluorescence is as follows; the sample excited by X-rays
emits a short wavelength radiation (fluorescence), characteristic of each alloying element.
A parallel beam of the secondary radiation is directed, by means of a collimator, onto the
analyzing crystal, it is separated according to wavelengths and then reflected into a
radiation detector mounted on a high precision goniometer. The angular position of
crystal and goniometer is a function of the wavelength and allows the identification of the
element in the matrix.
Since XRF technique determines the surface elemental content of particles,
samples were finely ground to minimize the possible effect of non-uniform distribution of

33
elements of the material. Ground samples were dried at 130 oC for 2 h and stored under
nitrogen. Samples were loaded into the vacuum sampling chamber of the XRF and
analyzed after the vacuum reached < 0.01 Torr. This precaution was taken to minimize
contribution from residual moisture of the samples and oxygen of the environment.
Fig. 3.1 Flow diagram for the preparation of BA and WA silica precursors.
Rice mill Husk
Air-blowing separation
Washing with Tap water (in stirring condition)
Drying, at 100 C for 12 h
Cleaned Husk
Acid Leaching: Boiling in 3 N HCl solution with reflux condition, for 1 h
White Ash (WA)
Washing of leached husk with warm water
Drying, at 100 C for 12 h
Burning in Air atm. at 700 oC for 6 h
Filtration
Characterization:
Particle size analysis Phase analysis Chemical analysis (XRF) FTIR
Brown Ash (BA)
Burning in Air atm. at 700 oC for 6 h

34
3.1.2.2 Phase Analysis
BA and WA powders were analyzed for their phase content by X-ray powder diffraction
performed with a Philip’s Diffractometer (model: PW-1830, Philips, Netherlands).
Powder sample is packed on a sample stage so that it can be irradiated by the X-ray. To
detect the diffracted X-rays, an electronic detector is placed on the other side of the
sample from the X-ray tube, and rotated through different Bragg’s angles. The
goniometer keeps track of the angle (θ), and the detector records the detected X-rays in
units of counts/sec and sends this information to the computer. The operating parameters
were; 40kV and 35mA with the Cu target, a step size of 0.02 (degree) with continuous
scanning. X-ray intensity (counts/sec) was plotted against the angle two-theta (2θ). The
angle (2θ) for each diffraction peak was then converted to d-spacing, using the Bragg
equation. The identification of different phases was carried out by Hanawalt method
using Philips X-pert high score software.
3.1.2.3 Fourier Transformed Infrared (FTIR) Analysis
FTIR spectroscopy was used to characterize the chemical functional groups present in
BA and WA, based on the characteristics of vibrational and rotational energies of
different molecular bonds in the materials. Fourier transformation is a mathematical
operation used to translate a complex curve into its component curves. In a FTIR
instrument, the complex curve is an interferogram, or the sum of the constructive and
destructive interferences generated by overlapping light waves, and the component
curves are the infrared spectrum. An interferogram is generated because of the unique
optics of FTIR instrument. The key components are a moveable mirror and a beam
splitter. The moveable mirror is responsible for the quality of the interferogram, and it is
very important to rotate the mirror at constant speed. The beam splitter, a piece of semi-
reflective material, splits the IR beam 50/50 to the fixed and moveable mirrors, and then
recombines the beams after being reflected at each mirror. The standard infrared
spectrum is then calculated from the Fourier transformed interferogram, giving a
spectrum in percent transmittance (% T) vs. light frequency (cm-1).
FTIR analyses of BA and WA powder were done at a resolution of 4 cm-1
using Spectrum RX-1 instrument (Perkin Elmer) in the wave number range 400 to 4000

35
cm-1. A small amount of sample (1 wt.%) was thoroughly mixed with ground KBr in an
agate mortar and a disc was prepared in vacuum maintaining a pressure of 33 kg/cm2.
The spectrogram of the sample is observed on computer monitor and a graphic
representation of the spectra was taken.
3.1.3 Preparation of Silica Gel Precursor
Silica gel (SG) prepared using RHA was used for the preparation of silica ceramics for
bio application. BA was used to synthesize SG raw material. BA was added to 1 M
NaOH (Merck, India) solution and boiled for 1 h in reflux condition to extract silica from
ash. The solution was filtered to separate the residue. The extracted sodium silicate
solution was added drop wise into 1 N HCl solution with constant stirring until the
solution pH reached 6. Within few minutes the solution turned into gel. The gel was
washed thoroughly with distilled water to remove the sodium chloride. Washed gel is
called hydro-gel (Fig. 3.2 (a)). The hydro-gel was dried at 150 C for 12 h to get dried SG
(Fig. 3.2 (b)) material. Fig. 3.3 shows the detailed flow diagram of preparation of silica
gel (SG).
Fig. 3.2 Silica hydrogel (a) and Dried Silica Gel (b).
3.1.4 Characterization of Silica Gel
3.1.4.1 Chemical, Phase and FTIR Analysis
Chemical composition, phase and different functional groups associated in SG were
determined by using XRF, XRD and FTIR respectively. Fundamentals and working
principle and procedure of each experiment have been described in section 3.1.2.1,
3.1.2.2 & 3.1.2.3 respectively.
(a) (b)
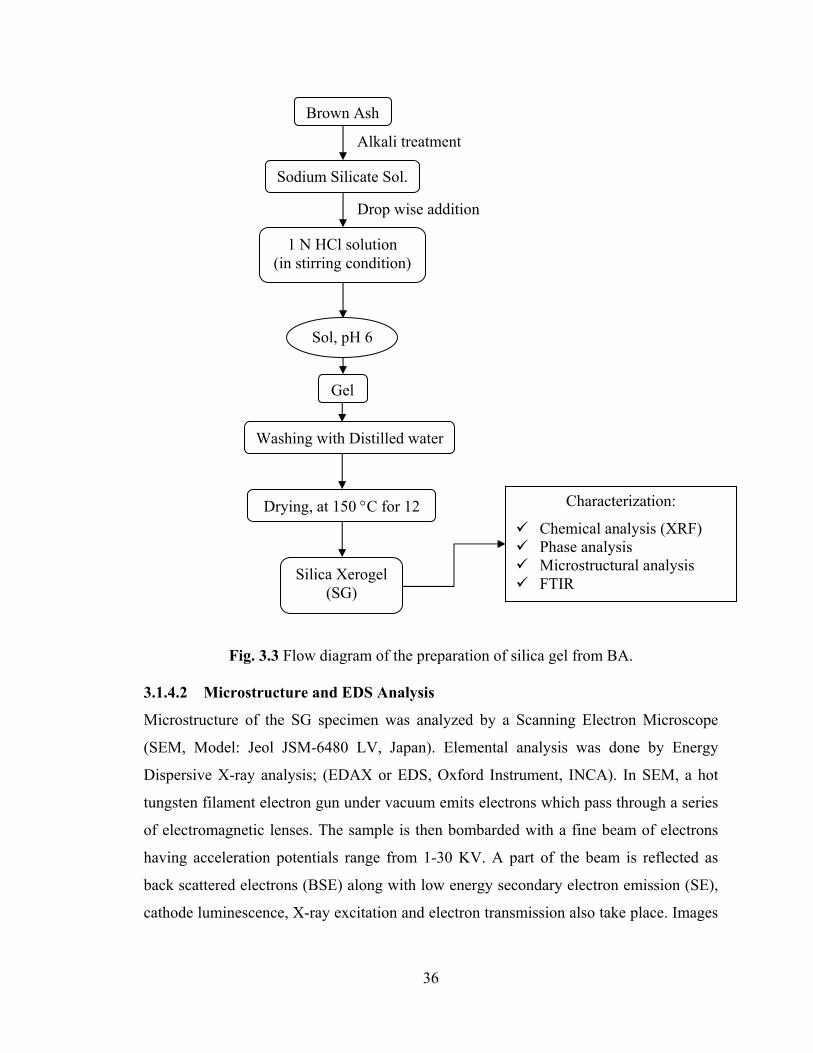
36
Fig. 3.3 Flow diagram of the preparation of silica gel from BA.
3.1.4.2 Microstructure and EDS Analysis
Microstructure of the SG specimen was analyzed by a Scanning Electron Microscope
(SEM, Model: Jeol JSM-6480 LV, Japan). Elemental analysis was done by Energy
Dispersive X-ray analysis; (EDAX or EDS, Oxford Instrument, INCA). In SEM, a hot
tungsten filament electron gun under vacuum emits electrons which pass through a series
of electromagnetic lenses. The sample is then bombarded with a fine beam of electrons
having acceleration potentials range from 1-30 KV. A part of the beam is reflected as
back scattered electrons (BSE) along with low energy secondary electron emission (SE),
cathode luminescence, X-ray excitation and electron transmission also take place. Images
Brown Ash
Alkali treatment
Sodium Silicate Sol.
Drop wise addition
1 N HCl solution (in stirring condition)
Sol, pH 6
Gel
Characterization:
Chemical analysis (XRF) Phase analysis Microstructural analysis FTIR
Washing with Distilled water
Drying, at 150 C for 12
Silica Xerogel (SG)

37
formed from the (SE) beam were studied in the extrinsic mode of SEM. The emitted
secondary electrons are detected and displayed on a scanning TV display.
EDS is a technique used for identifying the elemental composition of specimen.
The EDS analysis system works as an integrated feature of an electron microscope.
During SEM scanning, the specimen is bombarded with an electron beam. The
bombarding electrons collide with the electrons of the specimen atoms, knocking some of
them off, thus, transferring some of its energy by emitting an X-ray. By measuring the
amounts of energy present in the X-rays being released by a specimen, the identity of the
atom from which the X-ray is emitted can be established. The output EDS spectrum
normally displays peaks corresponding to the energy levels for which the most X-rays
had been received. Each of these peaks is unique to an atom, and therefore corresponds to
an individual element. The concentration of the element in the specimen is indicated by
the high intensity of the peak in a spectrum.
3.2 Silica Ceramics Prepared by Powder Compaction Method
3.2.1 Preparation of Silica Ceramics
Amorphous silica-based ceramics were prepared using three different silica precursors
BA, WA and SG. Fig. 3.4 show flow diagram for the preparation and characterization of
silica ceramics by powder compaction method. All silica precursors were wet milled
thoroughly in pot mill individually for 24 h to get fine powder. Particle size distributions
of each powder were measured. The powders were granulated by blending 1 wt.% poly
vinyl alcohol (PVA) (M.W. 85,000 Loba, India, LR grade) aqueous solution. The
granulated powders were compacted to make pellets using circular die and punch. The
weighed amount of powders were taken in a stearic acid lubricated die and punch and
uniaxially pressed at 250 MPa pressure for 2 minutes to form cylindrical shapes (pellet)
of 15 mm diameter and 3.5 mm thickness. Green densities were calculated from
weight/volume ratio. Weight was measured using electronic balance, whereas volume
was calculated from the dimension of the specimens.
The pellets were sintered at different sintering temperatures ranging from 700 to
1400 °C. The samples were heated from room temperature to 600 oC at a rate 2 oC/min
followed by a soaking at 600 oC for 1 h for binder burnout. Thereafter, the samples were

38
1 wt.% PVA addition
Mixing for 15 min
Brown Ash or
White Ash or
Silica Gel
Grinding for 24 h Using zirconia ball in aqueous medium
Silica Powder
Granulation
Pellet pressing: 250 MPa
Sintering at 700-1400 oC for 2 h
heated at a rate 3 °C/min to final sintering temperature and sintered for 2 h. Then the
specimens were cooled naturally to room temperature within the furnace.
Fig. 3.4 Flow diagram for the preparation of silica-based ceramics by powder compaction
method and its characterization.
3.2.2 Characterization of Silica Powders and Ceramics 3.2.2.1 Particle Size Distribution of BA, WA and SG Powders A laser diffraction method with a multiple scattering technique was used to determine the
particle size distribution of the BA, WA and SG powders using computer-controlled
Characterization: Apparent porosity and
Bulk density Phase Analysis FTIR Compressive strength Microstructural analysis In vitro bioactivity In vitro biodegradability test
Characterization: Particle size distribution

39
particle size analyzer (Malvern, Mastersizer 2000, UK). The instrument correlates
between the intensity and the angle of light scattered from the particle, and the particle
size is calculated based on the Miescattering theory.
In order to capture scattered light signals over range of angles, the equipment
utilizes a number of high-angle and back-scatter detectors, together with a short
wavelength blue LED laser. As the particle size becomes smaller, the scattered light
signal shifts to the side and rear with respect to the light source. Shorter wavelength
detects the smaller particle size. The scattered light can be measured by a series of photo
detectors placed on the opposite side of source at different angles. As the instrument
measures clouds of particles rather than individual ones, it is known as an "ensemble"
technique, with the advantage that at smaller sizes (e.g. 1 μm), the system measure
literally millions of particles which gives some statistical significance to the measured
results.
Powdered samples were well dispersed in water using Triton X-100 (Merck,
India) as dispersant. A well-dispersed and agglomerate-free suspension was obtained
using ultrasonic treatment (Sidilu Ultrasonics, India). The density of the powders was
determined by pycnometer using water as medium.
3.2.2.2 Phase Analysis and Rietveld Quantitative Phase Analysis
Different phases of sintered specimen were analyzed by using XRD and functional
radical groups were analyzed by FTIR techniques. The details of working principle and
method of these techniques have been discussed earlier. For these purpose, the sintered
specimens were ground thoroughly to get powders using agate mortar.
A Rietveld refinement procedure was used to analyze quantitative phase content
using MAUDWEB [1] (version 2.031) software. The Rietveld method is a powerful
technique to extract detailed structural information from powder diffraction data. In
contrast to the conventional profile fitting, this method does not use integrated intensities
of reflections but employs the entire powder diffraction pattern. In this method, each data
point in the digitized intensity versus 2 curve is an independent observation and during
refinement, structure parameters, background parameters, scale factor and profile
parameters are varied in a least squares procedure until the simulated pattern matches

40
well with observed pattern for the proposed structure model [2]. Scale parameters provide
the quantitative amount of different phases used in refinement.
The quantity minimized in the least square refinement is the residual Sy [2]:
Sy = 2cii )Y-(YiW
(3.1)
Where, Yi is observed intensity at the ith Step, and Yic is calculated intensity at the ith Step
and Wi = 1/Yi. Initially, the positions of the peaks were corrected by successive
refinements of zero-shift error. Considering the integrated intensity of the peaks as a
function of structural parameters only, the Marquardt least-squares procedures were
adopted to minimize the difference between the observed and simulated patterns.
Rietveld refinement process will adjust the refineable parameters until the residual
(equation 3.2) is minimized with some sense. The users of the Rietveld method have
developed several “Ra” values that are now commonly used [2].
Rp ( “Ra” pattern) =
)(
)]()([
obsY
calcYobsY
i
ii (3.2)
Rwp ( “Ra” weighted pattern) = 2/1
2))((
))]()(([
obsYW
calcYobsYW
ii
2iii (3.3)
Rwp is the most meaningful of these Ra’s because the numerator is the residual being
minimized. Another useful numerical criterion is the “goodness of fit”, G.
G = [Sy/ (T-P)]1/2 (3.4)
Where, T is the number of observations (e.g. the number of Yi’s used) and P is the
number of parameters adjusted. A G value of 1.3 or less is usually considered to be quite
satisfactory. The Rietveld refinement was carried out for BA ceramics for quantitative
phase analysis in sintered ceramics.
3.2.2.3 Density and Porosity of Sintered Specimen Bulk densities and apparent porosities of sintered pellets were measured by
“Archimedes” principle. The specimens were weighted in their dry state. Samples were
immersed in water and kept under a vacuum of 4 mm of mercury for 12 h to ensure that

41
water filled up the open pores completely. Then, soaked and suspended weights were
measured. The apparent porosity and bulk density were calculated as follows:
Dry weight of the sample = Wd, Soaked weight of the sample = Ws, Suspended weight
of the sample = Wa
(3.5)
(3.6)
3.2.2.4 Mechanical Property
The determination of the biaxial flexural strength is frequently necessary as part of the
design of structural ceramics to provide information necessary to design an engineering
structure. It is the ability of a cylinder, bar or slab to resist failure in compression. The
compressive strength is expressed in MPa.
Six samples were taken from each variety (BA, WA and SG) to determine the
compressive strength of sintered samples at each test and the average values have been
reported. The strength was measured on cylindrical samples in a material testing machine
(Hounsfiled H10KT, UK) by Brazilian disc methods. The samples were kept between
two compressive fixtures and were broken at a cross head speed of 0.5 mm/min. The
strength was calculated from the following formula as per ASTM spec [3]:
Dt
Pstrengthflexuralbiaxial
2 (3.7)
where, “P” is the breaking load, “D” is the diameter of the pellet and “t” is the thickness
of the pellet.
3.2.2.5 In vitro Bioactivity
In vitro bioactivity investigation of silica ceramics was carried out by using SBF. SBF
was prepared as proposed by Tass [4]. Merck-grade NaCl (99.5%), NaHCO3 (99%), KCl
(99.0%), MgCl2.6H2O (99%), Na2HPO4.2H2O (99.5%), CaCl2.2H2O (99%),Na2SO4
(99.5%), TRIS buffer (99.5%) and HCl were used in the preparation of SBF in this
study.
SBF was prepared following the Tass [4] protocol. The polyethylene bottle of
1000 mL capacity was cleaned thoroughly with dilute hydrochloric acid solution and
then, with de-ionized water. 700 mL of de-ionized water was poured into the bottle, then
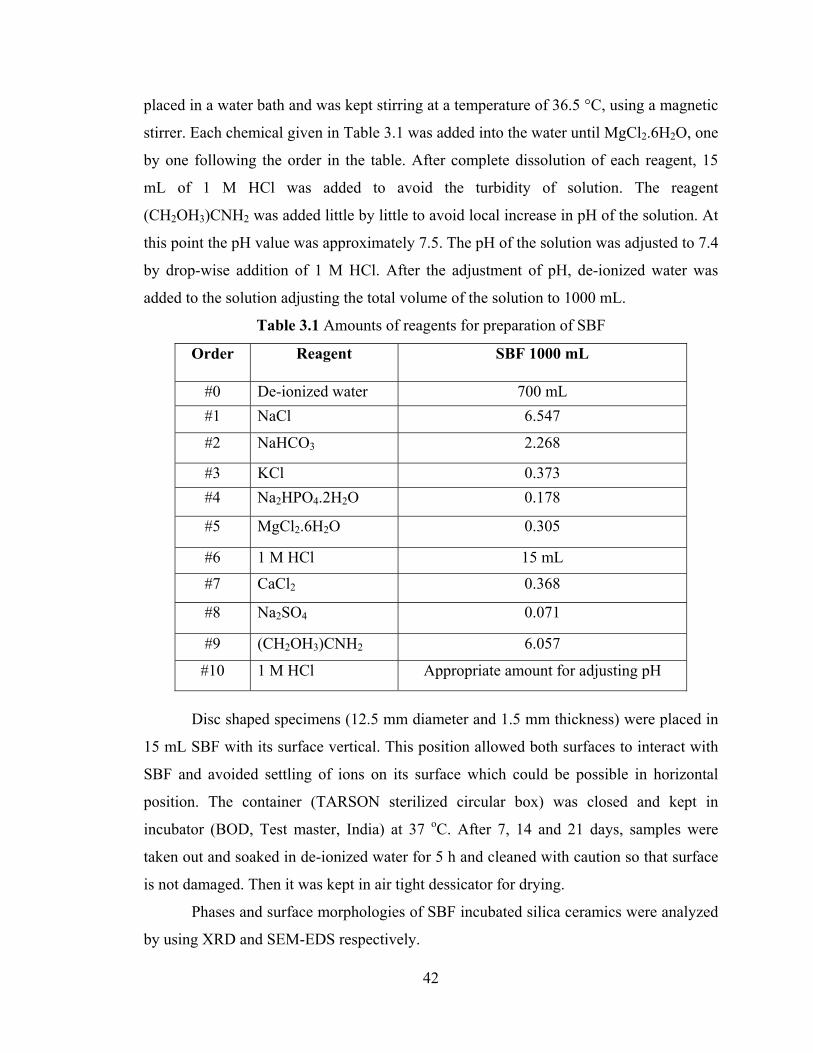
42
placed in a water bath and was kept stirring at a temperature of 36.5 °C, using a magnetic
stirrer. Each chemical given in Table 3.1 was added into the water until MgCl2.6H2O, one
by one following the order in the table. After complete dissolution of each reagent, 15
mL of 1 M HCl was added to avoid the turbidity of solution. The reagent
(CH2OH3)CNH2 was added little by little to avoid local increase in pH of the solution. At
this point the pH value was approximately 7.5. The pH of the solution was adjusted to 7.4
by drop-wise addition of 1 M HCl. After the adjustment of pH, de-ionized water was
added to the solution adjusting the total volume of the solution to 1000 mL.
Table 3.1 Amounts of reagents for preparation of SBF
Order Reagent SBF 1000 mL
#0 De-ionized water 700 mL
#1 NaCl 6.547
#2 NaHCO3 2.268
#3 KCl 0.373
#4 Na2HPO4.2H2O 0.178
#5 MgCl2.6H2O 0.305
#6 1 M HCl 15 mL
#7 CaCl2 0.368
#8 Na2SO4 0.071
#9 (CH2OH3)CNH2 6.057
#10 1 M HCl Appropriate amount for adjusting pH
Disc shaped specimens (12.5 mm diameter and 1.5 mm thickness) were placed in
15 mL SBF with its surface vertical. This position allowed both surfaces to interact with
SBF and avoided settling of ions on its surface which could be possible in horizontal
position. The container (TARSON sterilized circular box) was closed and kept in
incubator (BOD, Test master, India) at 37 oC. After 7, 14 and 21 days, samples were
taken out and soaked in de-ionized water for 5 h and cleaned with caution so that surface
is not damaged. Then it was kept in air tight dessicator for drying.
Phases and surface morphologies of SBF incubated silica ceramics were analyzed
by using XRD and SEM-EDS respectively.

43
3.2.2.6 In vitro Biodegradability
The dissolution feature of silica ceramics was evaluated in TRIS buffer solution because,
TRIS is the plain buffering agent used in most SBF preparations. TRIS solutions do not
contain ions and thus represent maximum solubility and minimum reprecipitation activity
for a bioactive material [5].
Pure TRIS buffer (99.5%, Merck grade) was dissolved in deionized water with a
concentration of 6.1 gm/lit [6]. The solution pH was lowered to 8 using 1 M HCl
solution. Analyte was made from fine powder of silica specimen. About 300 mg powders
were stirred (60 rpm) in 200 mL TRIS solution at 37 oC for different time periods. pH of
TRIS solution was measured after each soaking interval. Dissolved Si concentration was
estimated through molybdenum blue complex absorbance at 820 nm [7] using Perkin
Elmer Lambda 35 visible spectrophotometer. The detailed experimental procedure for the
spectrophotometric determination of silicon was as follows:
Preparation of Standard solutions:
All the standard solutions were prepared for this purpose according to the protocol of
Grimaldi et al [8]. All reagents were of analytical grade (Merck, India) and stored in
polyethylene containers prior to use.
(i) 1 N HCl solution.
(ii) Ammonium molybdate standard: 2.0 gm ammonium molybdate
[(NH4)6Mo7O24.4H2O] was dissolved in 100 mL water. There was no sign of
precipitation.
(iii) Silicate standard: 204.05 mg sodium metasilicate (Na2SiO3.9H2O; M.W. 284.216)
was dissolved in 100 mL distilled water. Prior to dispensing, the sodium
metasilicate was stored over a perchlorate desiccant.
(iv) Stannous Chloride standard: 5 gm of stannous chloride dihydrate was dissolved in
10 mL of hot hydrochloric acid, and diluted to 100 mL with water.
Preparation of Calibration Chart:
Standard calibration line as shown in Fig. 3.5 was plotted for variation of silicon
concentration. For this purpose, different concentration of silicate solutions was taken out

44
from the standard silicate solution, prepared by using sodium metasilicate as silicon
source. Whole measurements were made using 40 mm path length cuvette.
0.0 0.2 0.4 0.6 0.8 1.00.0
0.5
1.0
1.5
2.0
2.5
3.0
3.5
4.0
4.5
5.0
5.5
y = 5.28234 x + 0.08041
Abs
orba
nce
at 8
20 n
m
Si concentration (g/L)
Fig. 3.5 Absorbance at 820 nm as a function of concentration of silicon.
A portion of the analyte was pipetted into a 50 mL separating funnel and the clear analyte
collected. 1 mL of clear analyte was transferred to a polyethylene test tube; 0.1 mL
concentrated HCl was added followed by 2.0 mL of the molybdate reagent (standard
solution). Test sample was allowed to stand for 5 minutes at room temperature,
permitting formation of silicomolybdic acid, which imparts a yellow color to the solution.
1 mL of the stannous chloride reductant solution (standard solution) is then added, and
the contents of the tubes mixed by swirling, resulting in an intense blue coloration. Then
the spectrophotometric determination of Si was performed at 820 nm using UV/VIS
spectrophotometer. Baseline correction was done every time following the above
procedure by using standard solutions before starting the experiment. The silicon present
in the analyte was then determined by comparing results with a standard curve, as shown
in Fig. 3.5. Mean value of six experimental data for each formulation were analyzed to
determine statistical significance. All the standard solutions were prepared immediately
before the start of the experiment.

45
3.3 Silica-based scaffolds prepared by sponge replication technique
3.3.1 Preparation of Silica Scaffolds
Three types of silica precursors namely BA, WA and SG were used in this work. All
precursors were wet milled thoroughly in a pot mill individually for 24 h to get fine
powders. Particle size distributions of each were analyzed. The ζ-potentials and
sedimentation behaviours of silica particles were evaluated.
For slurry preparation, PVA (5 wt.% aqueous solution) was used as a binder. The
40 wt.% solid loaded slurry was prepared by milling for 15 h. The rheological behavior
of the slurry was measured. Then, the slurry was de-aired and impregnated in poly
urethane (PU) sponge templates. Impregnated sponge cubes were dried at room
temperature. The dried sponges were sintered at different temperatures ranging from 800
to 1400 oC with a 2 h of dwelling at 550 oC for burn out of PU foam. The schematic flow
diagram for the preparation and characterization of amorphous silica scaffolds is
illustrated in Fig. 3.6.
Fig. 3.6 Flow diagram for the preparation of silica scaffolds.
Drying at room temperature for 72 h
PU sponge impregnation with
De-airing of slurry under vacuum, at 25 oC
Ceramic slurry (pH 10): (40 wt.% powder: 5 wt.% PVA: H2O) milled for 15 h
Brown Ash / White Ash / Silica Gel
Grinding for 24 h Using zirconia ball in aqueous medium
Silica Powder
Sintering at 800-1400 oC for 2 h with dwelling 2 h at 550 oC
Characterization: Total porosity Phase Analysis Compressive strength In vitro bioactivity
Characterization: Particle size
distribution Zeta-potential
Characterization: Slurry

46
3.3.2 Characterization of Silica powders and Scaffolds 3.3.2.1 Zeta-potential (ζ)
Ceramic particles are generally charged particles due to the presence of surface broken
bonds. When a ceramic particle is suspended in liquid, ions of an opposite charge will be
attracted to the surface of the particle. The development of a net charge at the particle
surface affects the distribution of ions in the surrounding interfacial region, resulting in
an increased concentration of counter ions (ions of opposite charge to that of the particle)
close to the surface. Thus an “electrical double layer” exists around each particle.
The liquid layer surrounding the particle exists as two parts; an “inner” region,
called the “stern layer”, where the ions are strongly bound and an outer, diffuse, region
where they are less firmly attached. Within the diffuse layer there is a notational
boundary inside which the ions and particles form a stable entity. When a particle moves
(e.g. due to gravity), ions within the boundary move with it, but any ions beyond the
boundary do not travel with the particle. This boundary is called the surface of
hydrodynamic shear or “slipping plane”. The potential that exists at this boundary is
known as the “Zeta-potential”. Fig. 3.7 shows the schematic representation of zeta-
potential [9].
Fig. 3.7 Schematic representation of electrical double layer and zeta-potential [9].

47
The most important factor that affects zeta-potential is pH. Imagine a particle in
suspension with a negative zeta-potential. If more alkali is added to this suspension then
the particles will tend to aquire a more negative charge. If acid is then added to this
suspension a point will be reached where the negative charge is neutralized. Any further
addition of acid can cause a buildup of positive charge. The point where the surface has
zero zeta-potential is called the “Isoelectric point”. It is normally the point where the
colloidal system is least stable.
Zeta potentials of silica precursors were measured using Zetasizer (Model No.
3000 HSA, Malvern, UK) on dilute suspensions of 0.01 gm of silica powder in 100 mL
deionized water. The powders were dispersed in deionized water. Then the pH was
adjusted to different values ranging from 2 to 12 using HCl or NH4OH solutions, and
then sonicated for 15 minutes. At each pH value, the ζ-potential was measured at least 5
times.
3.3.2.2 Sedimentation Test
The sedimentation behaviour of the 20 wt.% solid loaded silica suspensions was studied
at different pH values (2-12). The suspension of each silica powder was prepared by
sonicating the powder in aqueous medium for 30 minutes. Immediately after sonication,
the suspensions were filled in graduated measuring cylinder with 25 mm inner diameter
and 25 cm height. Suspensions were allowed to stand un-disturbed for 24 h. The heights
of the interfaces between the clear, turbid and sedimentation section were recorded from
the bottom of the cylinder.
3.3.2.3 Slurry Rheology
Rheology is the study of deformation and flow of substances. In other words, rheology is
the study of the physical quantities such as yield stress (the minimum force required for a
slurry to flow), viscosity (how 'runny' a slurry will be at a given laminar flow-rate),
hysteresis (the changes in plastic viscosity and/or yield stress which are due, usually, to
particle attrition or settling). The rheological behavior was measured using rheometer
(Anton Paar, Physica MCR300, Austria) with a concentric-cylinder with 1.33 mm gap

48
between the inner and outer cylinder walls. Rheological tests were performed at a shear
rate in the range 0-700 s-1, with frequency of 1 Hz and strain amplitude of 1% at 25 oC.
3.3.2.4 Fabrication of reticulated porous body
Commercial polyurethane sponge with cell size of ≈45 pores per inch was used in this
study. Fig. 3.8 (a) and (b) shows the optical and SEM photograph of raw sponge material.
Fig. 3.8 (a) Optical photograph, and (b) SEM of raw sponge.
The sponges for impregnation were cut into ≈25×25×25 mm3. After the slurry
was de-aired, the polyurethane sponges were immersed in it and were compressed while
submerged in order to fill all of the pores. After one minute, the impregnated sponge was
removed from the slurry and excess slurry squeezed out from the sponge by means of
pressing between two parallel plates to a constant gap width. After removal of the excess
slurry, the samples were dried at room temperature for 24 h. The samples were then
placed in a drying oven at 100 °C for 12 h.
3.3.2.5 Sintering of Reticulated Porous Body
The dried impregnated sponge cubes were sintered at different temperatures ranging from
800 to 1400 oC with a heating rate of 1 °C min-1 from room temperature to 600 °C,
followed by holding at 600 oC for 2 h to burn out the polyurethane support. Subsequently,
heating at 2 °C min-1 to final temperature and holding for 2 h. The samples were cooled
naturally to room temperature within the furnace.
(a) (b) (a) (b)

49
3.3.2.6 Density and Porosity of Sintered Specimen
The porosity of reticulated porous ceramics (RPC) was calculated on the basis of their
apparent density (ρ) and true density (ρo) according to the following equation:
Porosity (%) = (1- ρ/ρo) × 100 (3.8)
Apparent density was measured from RPC on the basis of their dimensions and weights.
True densities of RPC were measured on powder by pycnometric method using water as
liquid medium.
W1= Weight of Empty Bottle; W2= Weight of (Powder + Bottle)
W3= Weight of (Powder + Bottle + Fluid); W4= Weight of (Bottle + Fluid)
True density (ρo) = {[(W2 – W1)]/[(W4 – W1) - (W3 – W2)]}×Fluid density (3.9)
3.3.2.7 Mechanical Property
Compressive strength is the ability of a cube or slab to resist failure in compression.
Compressive strength of six cubical RPCs from each variety (BA, WA and SG) was
measured at each point and the average values have been reported for the point. The
measurement was carried out by the material testing machine (Hounsfiled H10KT, UK).
The cubes were kept between two compressive fixtures and were broken at a cross head
speed of 0.2 mm/min. The strength of RPC body was calculated using following
equation;
σ = F/A (3.10)
where, F = the force at each data point and A = area of cross section.
3.3.2.8 In vitro Bioactivity
Bioactivity of porous silica ceramics was tested in SBF solution. The details of the
experiment have been described in section 3.3.2.5. Porous bodies were incubated in SBF
solution for 8 weeks. Nature of phases formed and surface morphologies of SBF
incubated scaffold were analyzed by using XRD and SEM-EDS respectively.

50
3.4 Silica-Based Ceramics Prepared by Gelcasting Method 3.4.1 Preparation of Gelcasted Body Silica gel (SG) powder was used as silica precursor in this study. SG was prepared
utilizing RHA produced by a local rice mill as a waste in boiler heating plant. SG was
ground into fine powder and particle size distribution was measured. Zeta potential and
sedimentation behaviour of SG powder were measured. Ceramic slurry for gelcasting was
prepared by milling solid with monomer and cross-linker solution. Milled slurry was de-
aired; initiator and catalyst were added. The final slurry was poured (casted) into a non
porous mold. After monomer-cross-linker polymerized, the green bodies were demolded
and dried at room temperature with controlled humidity. Finally, the green bodies were
preheated at 150 oC for 6 h and machined into different shapes. The machined bodies
were sintered. The schematic flow diagram for the preparation of silica ceramics by
gelcasting technique is illustrated in Fig. 3.9.
3.4.2 Characterization Gelcasted Body 3.4.2.1 Slurry Preparation
Homogeneous slurry with good fluidity is required for the gelcasting. Particle size, zeta-
potential and sedimentation behaviour of SG powder were measured. Both zeta potential
and sedimentation behaviour were measured using suspension in 1:30 premix solution.
Premix solution was prepared by using the reactive organic monomer system (15 wt.% of
powder basis) of monofunctional acrylamide, C2H3CONH2 (AM), difunctional N,N'-
methylene-bisacrylamide (C2H3CONH2)2CH2 (MBAM), and deionized water. SG slurry
with 42 vol.% solid loading was prepared by mixing the powder in 1:30 premix solution.
Ammonium hydroxide solution was used to maintain the pH at 10. The suspension was
milled for 15 h in a plastic bottle with zirconia ball as grinding media to get
homogeneous slurry. Fluidity of SG slurry was characterized by analyzing the slurry
rheology.

51
Fig. 3.9 Flow diagram for preparation of silica ceramics using gelcasting techniques.
Silica gel powder (42 vol.%)
De-airing of slurry under vaccum, at 25 oC
Casting into non porous molds
Gelation
Demoulding
Drying in controlled atmosphere
Machining and finishing
Sintering at 900-1200 oC for 2 h
Characterization: Particle size distribution Zeta-potential Sedimentation
Mixing
Ceramic slurry (pH 10), milled for 15 h
Acrylamide (AM) Distilled water
Clear solution Methylene Bisacrylamide
(MBAM)
Mixing
Premix solution: [water: (monomer:cross-linker), 45:5.5:0.2 in mass ratio] (monomer:cross-linker, 15 wt.% of powder)
Initiator (APS):Catalyst (TEMED) (1:1)
Characterization: Thermo gravimetric analysis Differential scanning
calorimetric analysis
Characterization: Total porosity Phase Analysis Compressive strength In vitro bioactivity
Characterization: Slurry rheology

52
3.4.2.2 Fabrication of Gelcasted body
Slurry was de-aired and mixed with ammonium persulfate (APS) as initiator and
tetramethyl ethylenediamine (TEMED) as catalyst in the ratio of 1:1 (0.15 wt.% on
powder basis). Afterwards, the slurry was cast into nonporous mold (PVC pipe and glass
beaker). All the above operations were carried out at room temperature and ambient
atmosphere. After gelation of slurry, solid bodies were demolded and dried at room
temperature (27 oC) under controlled humidity (75% RH) to avoid cracking and non-
uniform shrinkage due to rapid drying. Finally, the green bodies were dried at 110oC for
12 h and machined into pellet like and other different shapes.
Fig. 3.10 shows the gel casted products. Fig. 3.10 (a); (I) is the slurry in a beaker
before gelling, (II) demolding of casted body from the beaker, (III) green gel casted body,
and (IV) dried cylindrical gelcated body. Similarly, Fig. 3.10 (b) shows rod shaped
demolded gel casted body along with PVC pipe used for moulding purpose and
cylindrical disk-shaped green bodies machined out from the green rod.
(a)
(b)
Fig. 3. 10 (a); (I) is the slurry in a beaker before gelling, (II) demolding of casted body
from the beaker, (III) green gel casted body, (IV) dried cylindrical gelcated body, and (b)
rod shaped demolded gel casted body along with PVC pipe and machined disk-shaped
green bodies.
(I) (IV) (III) (II)

53
3.4.2.3 Thermal Decomposition Behaviour of Gelcast Body
Thermal decomposition behaviour of green gelcasted body was characterized by thermo
gravimetric analysis (TGA) and differential scanning calorimetric analysis (DSC) using
NETZSCH STA, Jupitor (Model No 449C), in N2 atmosphere with the heating rate of 10 oC/min.
When a material undergoes physical or chemical change it absorbs or releases
thermal energy. The temperature difference of the sample with respect to the reference
inert material (α-Al2O3) during heating or cooling is plotted in a DSC curve as the
deviation from zero base line. Exothermic or endothermic changes are shown in opposite
directions of the baseline. TGA is a simple analytical technique that measures the weight
loss (or weight gain) of a material as a function of temperature.
3.4.2.4 Sintering and Mechanical Property of Gelcast Body
The green gelcasted bodies were sintered at different temperatures, ranging from 900 to
1200 oC with a heating rate of 1 °C min-1 from room temperature to 600 °C, followed by
a holding at 600 oC for 2 h to burn out the organic ingredients. Subsequently, sintering
was carried out at final temperature with 2 h holding. The samples were cooled naturally
to room temperature within the furnace.
Porosity and bulk density of the sintered gelcasted body (pellets) were calculated
by “Archimedes” principle. Compressive strength of sintered gelcasted specimens was
measured by the same procedure and calculations as described in section 3.2.2.4 with
cross head speed of 0.2 mm/min. Six number of pellets were tested to determine the mean
average compressive strength value at each point.
3.4.2.5 In vitro Bioactivity
Bioactivity of gelcasted sintered specimen was tested in SBF solution. The specimen was
incubated in SBF for 28 days. Formation and growth of apatite on the surface of
incubated specimen was analyzed through its phase analysis and surface morphologies
respectively.

54
3.5 Sol-gel synthesis of glass-ceramics 3.5.1 Preparation of Glass-Ceramics Glass-ceramics (GC), intended for bio-application, was prepared by sol-gel route using
RHA as silica source. The flow diagram for this preparation is illustrated in Fig. 3.11.
The glass-ceramics with composition (mol %) 50 SiO2, 25 Na2O and 25 CaO, was
synthesized through sol-gel process. Sodium silicate solution (containing required
stoichiometric ratio of SiO2:Na2O) and Ca(NO3)2·4H2O (Merck, India) were used as
precursors. Sodium silicate solution was prepared by boiling RHA (SiO2≥99.87%, ±0.01)
in 1 M NaOH solution. Calcium nitrate was dissolved in concentrated nitric acid to make
the solution highly acidic. Silicate solution was then added drop wise into that highly
acidic Ca(NO3)2 solution under constant stirring condition to avoid gel precipitation, as
the gel was precipitated immediately when Ca(NO3)2 solution was added to sodium
silicate solution. Final pH of the sol was 3. The sol turned into gel within 30 min at room
temperature. The gel was aged for 3 days at 70 °C followed by drying at 150 °C for 48 h.
Dried gel was crushed and ground into fine powder. Gel powder was calcined and then
ground. Fine powders were compacted to form pellets followed by sintering for further
characterization.
3.5.2 Characterization of Gel powder and Glass-Ceramics
3.5.2.1 Thermal Analysis of Gel Powder
Thermal decomposition behaviour of gel powder was determined by DSC/TGA analysis.
The gel powder was heated from room temperature to 1000 oC with a heating rate of 10 oC/min. Gel powder was calcined at different temperatures up to 700 °C for 2 h to
evaluate phase formation and crystallization behavior. Calcined powders (glass-ceramic
powder) were analyzed for their crystalline phase content using XRD.
3.5.2.2 Sintering and Phase Analysis of Glass-Ceramics
The final glass-ceramics (GC) powder (calcined at 700 oC) was ground thoroughly.
Particle size of GC powder was measured. The powder was pressed uniaxially at 250
MPa for 2 minutes to make pellets of 15 mm diameter and 3.5 mm thickness. Pellets were

55
sintered at 900, 950, 1000 and 1050 oC for 2 h with a heating rate of 2 °C min-1 from
room temperature to final sintering temperature and were cooled naturally within the
furnace. Phases of sintered specimen were analyzed by using XRD.
Fig. 3.11 Flow diagram of the procedure to prepare glass-ceramics.
Characterization: Phase Analysis Compressive strength In vitro bioactivity In vitro biodegradability
Characterization:
TGA/DSC
Phase analysis
Characterization: Phase analysis
Alkali treatment
Keeping at room temperature
Drop wise addition
White Ash
Sodium Silicate Sol.
Calcium nitrate solution (Mixing in stirring condition)
Sol
Gel
Ageing: 3 days at 70 oC
Drying: 2 days at 150 oC
Gel powder
Characterization: Phase analysis
Calcination
Grinding & pellet pressing
Sintering: 900 to 1050 oC for 2 h

56
3.5.2.3 Mechanical Properties of Glass-Ceramics
Mechanical strength was measured by compression test in an UTM using “Brazilian
Disc” methods with a cross head speed of 0.5 mm min-1. Six numbers of samples were
tested to determine the mean average compressive strength value at each test. Surface
morphologies were also investigated by SEM.
3.5.2.4 In vitro Bioactivity of Glass-Ceramics
The bioactivity of sintered pellets was examined by incubating the specimens in SBF
solution. The change of apatite growth with incubation time periods and effect of
sintering temperature on the bioactivity of sintered specimens were investigated. The
surfaces of incubated specimen were investigated for phase analysis, morphology and
elemental analysis by XRD, SEM and EDS respectively.
3.5.2.5 In vitro Biodegradability of Glass-Ceramics In order to study the dissolution features of glass-ceramics, a TRIS buffer solution was
chosen as dissolution medium. Pure TRIS was dissolved in deionized water with a
concentration of 6.1 gm/lit. The solution pH was lowered to 8 using 1 M HCl solution.
Sintered pellets were immersed in TRIS solution and incubated at 37 oC for different time
periods upto 7 days. After each soaking experiment, pH of TRIS solution and water
absorption capacity of specimen was measured.
3.6 Preparation of Aerogel by Ambient Pressure drying Method
3.6.1 Preparation of Silica Aerogel
Silica aerogel was prepared by ambient pressure drying technique using RHA as silica
source. The detailed procedure of preparation is illustrated schematically in Fig. 3.12. All
the chemicals used in this process were from Merck, India (GR grade with 99.9% purity).
Silica gel was synthesized by neutralizing sodium silicate solution using 1 mol/L Nitric
acid (HNO3) solution; as per the procedure mentioned in section 3.1.3. The prepared gel
was aged at room temperature for 24 h under sealed condition. The aged gel was washed
using de-ionized water to remove sodium nitrate. The extent of Na removal was
measured by analyzing Na-content of dried gel using EDS analysis. Subsequently, the

57
silica gel was soaked in a solution of 20 vol % H2O/ethanol for 24 h at 50 °C followed by
aging with ethanol at same condition. The ethanol treated gel was aged in a solution of 70
vol % Tetraethylorthosilicate (TEOS)/Ethanol for 24 h at 70 °C. The gel was washed
with n-heptane for several times to remove TEOS/Ethanol solution from the gel. Then, it
was aged in n-heptane at 50 °C for 24 h with 4 times renewal of fresh n-heptane. Finally,
modified gels were aged for another 24 h in n-heptane at room temperature before air
drying with partially covered condition. The gel was dried in 24 h interval at 50, 90, 120
and 150 oC with partially covered condition.
3.6.2 Characterization of Aerogel 3.6.2.1 Density, Apparent Porosity, Microstructure and FTIR Analysis Bulk density and apparent porosity of silica aerogel was determined by “Archimedes”
principle. The specimen was cut into rectangular shape and weighted in dry state. Sample
was immersed in kerosene and kept under a vacuum of 4mm of mercury for 5 h to ensure
that kerosene filled up the open pores completely. Then, soaked and suspended weights
were measured. The apparent porosity and bulk density was calculated by using the
formula mentioned in section 3.2.2.3. Surface morphology of aerogel specimen was
analyzed by using SEM-EDS. On heating, different functional groups associated with
aerogel sample were investigated through FTIR analysis.
3.6.2.2 Surface Area and Pore Size Distribution
Surface area and pore size distribution were measured by the nitrogen
adsorption/desorption isotherm technique. BET (Brunauer, Emmet and Teller after the
developers of the basic calculations) method was used for adsorption isotherm
measurement using Quantachrome Autosorb (Model No: Nova 1200 BET).
The adsorption isotherm depends on the molar quantity of nitrogen (or it standard
volume, Va) adsorbed by the solid surface as a function of gas pressure. Plots of Va
against the reduced gas pressure, P/Po, (Po is the vapor pressure of nitrogen at 77K) reveal
much about the pores of the adsorbing material simply by its shape and the hysteresis
between the adsorption and desorption curves.

58
Fig. 3.12 Flow diagram of the procedure used to prepare silica aerogel by ambient
pressure drying technique using WA as silica source.
Characterization: Apparent porosity and
Bulk density Microstructural analysis FTIR Specific surface area BET- Isotherm Pore size distribution TGA/DSC In vitro bioactivity test In vitro biodegradability test
Washing with water
Ageing in concealed chamber for 24 h at 25 oC
White Ash
Alkali treatment
Sodium Silicate Sol.
Acid neutralization
Wet silica gel
Soaking in 20 vol% H2O/ethanol, for 24 h at 50 °C
Aging: 70 vol% TEOS/ethanol, for 24 h at 70 °C
Removal of TEOS/ethanol solution: by exchanging n-heptane
Ageing with n-heptane at 50 °C for 24 h
Aging for 24 h with n-heptane at ambient pressure and room temperature
Air drying in partially covered condition
Dried silica Aerogel

59
The theory of BET enables the calculation of the specific surface area of the adsorbence,
its pore size and volume from the adsorption/desorption data. This theory is based on the
Langmuir monolayer adsorption on the solid theory. Brunauer, Emmett and Teller
suggested a multilayer adsorption mechanism. The BET theory is based on the
assumption that the forces active in the condensation of gases are also responsible for the
binding energy in multi-molecular adsorption. By equating the rate of condensation of
gas molecules onto an already adsorbed layer to the rate of evaporation from that layer
and summing for an infinite number of layers, the following expression can be obtained:
(3.11)
C is the constant, resulting from the difference between the enthalpy of adsorption of the
first layer and enthalpy of condensation of nitrogen. The values of Vm and C may be
obtained from a straight-line plot of vs. . The volume of the monolayer, Vm
having been determined, allows the surface area of the sample to be determined using the
area occupied by a single nitrogen molecule (16.2 Å at 77K).
This method was successfully applied to determine the specific surface area and
pores size distribution of silica aerogel. About 0.05 gm of sample was taken in the
sample cell and degassed at 150 oC in vacuum up to a maximum of 3 mbar. The sample
holder mouth was closed by a stopper. Sample was cooled and the cell was placed in
liquid nitrogen bath. The equipment measured the amount of gas adsorbed on the surface
of the sample and the specific surface area was calculated.
3.6.2.3 In vitro Bioactivity and Biodegradability of Aerogel
Bioactivity of aerogel was checked by incubating the aerogel specimen in SBF for 7, 14
and 21 days at 37 oC. After being soaked, samples were rinsed with distilled water and
dried in dessicator at room temperature. SBF incubated sample surface was then
investigated by XRD for phase analysis, SEM for morphology and EDS for elemental
analysis. The dissolution feature of aerogel sample was evaluated in TRIS buffer
solution; the detail procedure about biodegradability of silica-based ceramics has been
mentioned in section 3.2.2.5.

60
References
[1] H. M. Rietveld, J. Appl. Cryst. 2 (1969) 65.
[2] R. A. Young, Rietveld Method, International Union of Crystallography, Oxford
University Press (1996).
[3] A.T. Procopio, A. Zavaliangos, J.C. Cunningham, J. Mater. Sc. 38 (2003) 3629-
3639.
[4] A. Cuneyt Tas, Biomaterials 21 (2000) 1429.
[5] M.G. Cerruti, D. Greenspan, K. Powers, Biomater. 26 (2005) 4903.
[6] A. Nieto, S. Areva, T. Wilson, R. Viitala, M. Vallet-Regi, Acta Biomater. 5(9)
(2009) 3478.
[7] O.G. Koch, G.A. Koch-Dedic (1974) In: Handbuch der Spurenanalyse Silicon
molybdanblau-Verfahren. Springer-Verlag, Berlin.
[8] H. Levine, J.J. Rowe, F.S. Grimaldi, 27 (1955) 258.
[9] www.malvern.com

61
Chapter 4
Results & Discussion

61
4.1 Preparation and Characterization of Amorphous Silica Precursors
4.1.1. Introduction
Three types of amorphous silica powders were prepared using rice husk. They are brown
ash (BA), white ash (WA) and silica gel (SG). BA was prepared by burning husk at 700 oC. WA was prepared by burning acid washed husk. The SG was prepared from BA
through alkaline extraction of silica and acid neutralization processes. All these silica
precursors were characterized for their phase analysis, chemical composition and FTIR
analysis.
4.1.2. Results and Discussion
4.1.2.1 Phase Analysis
Fig. 4.1 shows the X-ray diffraction patterns of WA, BA along with raw and cleaned
husk. In all cases broad peak zone centered near 2θ=22o, signifies the amorphous nature
of silica based materials. A sharp crystalline peak in raw husks at 2θ=26.86o was due to
the presence of impurities sand particles as the peak was identified to match with quartz.
There was no quartz peak in cleaned husk. BA and WA shows typical amorphous pattern
of silica. They were prepared by burning the husk at 700 oC, as it is known that silica of
husk remains amorphous upto about 850 oC [1]. There was no visible residual un-burnt
carbon in BA and WA.
15 20 25 30 35 40
WA
BA
Cleaned husk
Raw husk
Inte
nsiti
es (
a.u.
)
Degree (2) Fig. 4.1 X-ray diffraction patterns for WA, BA, cleaned husk and raw husk.

62
SG was prepared by acid neutralization of sodium silicate solution derived from BA. HCl
was used for the neutralization. Fig. 4.2 shows the XRD patterns of SG as-prepared
(unwashed) and after thorough washing. Unwashed SG exhibits presence of NaCl and
Na2SiO3, as shown in Fig. 4.2 (a). These compounds were found because the sodium
silicate was neutralized by HCl, as stated above. However, those crystalline peaks are
absent in washed gel (Fig. 4.2 (b)). Washed SG is completely amorphous in nature.
15 20 25 30 35 40 45 50 55 60
Na2SiO
3
NaCl
Inte
nsiti
es (
a.u.
)
2 (Degree)
Fig. 4.2 X-ray diffraction patterns for (a) Unwashed and (b) Washed Silica gel (SG).
Presence of sodium based compound in unwashed SG was also confirmed by analyzing
its surface microstructure (Fig. 4.3 (a)). Unwashed SG shows a granular morphology.
EDS spectra shows Na and Cl peaks due to the presence of NaCl on the surface. During
the drying of unwashed gel, dissolved NaCl comes to the surface along with water and
dries into granular form. Those granules are absent in washed gel (Fig. 4.3 (b)).
Corresponding EDS also shows no peaks for Na and Cl. It can be concluded that the
washing procedure applied for the preparation of SG was efficient to remove all NaCl
from silica hydrogel.
(a)
(b)

63
Fig. 4.3 SEM and EDS photographs of (a) Unwashed and (b) Washed silica gel.
4.1.2.2 Chemical Analysis
Chemical analysis of raw husk, BA, WA and SG was carried out using XRF. Table 4.1
shows the chemical composition (oxide basis) of three silica precursors. BA contains
approximately 96% SiO2 and the rest 4% are oxides of potassium, calcium, iron, zinc,
and manganese. Except SiO2, all other oxides may be considered as impurities. The
brown colour of BA is attributed to the presence of these impurities. WA contains nearly
pure SiO2 (99.87%). It was prepared from the husk which was thoroughly acid leached.
The acid leaching was effective to remove most of the impurities those stated above for
BA. Silica content of SG is about 99.78%. The SG was prepared through alkali extraction
of amorphous silica of BA, and then by acid neutralization of silicate solution to form
gels. The impurities were low in SG compared to BA, because they were partially
removed during the processing of gel.
(a)
(b)

64
Table 4.1 Chemical analysis of silica precursors (mass %)
Oxides Raw Husk Brown Ash Silica Gel White ash
Organic Matter 75.6
SiO2 17.26 96.01 99.79 99.87
K2O 0.28 0.86 - -
CaO 1.11 2.22 0.13 -
Fe2O3 2.86 0.57 0.03 0.13
Al2O3 1.37
ZnO 0.67 0.06 0.05 -
Na2O 0.84
Mn2O3 0.11 0.28 - -
4.1.2.3 FTIR Analysis
FTIR spectra of BA, WA and SG are shown in Fig. 4.4. Spectra for BA and WA are
almost same. The broad band at 3410-3470 cm-1 is due to the stretching vibration of the
O-H bond from the silanol groups (Si-OH) and is due to the adsorbed water molecules on
the silica surface. The band at 2344 cm-1 is due to the carbonate which is absorbed in the
sample from atmosphere during sample preparation. The band at 1090 cm-1 is due to the
Si-O-Si asymmetric stretching vibration, while the band at 801 cm-1 has been assigned to
the network Si-O-Si symmetric bond stretching vibration. The band at 470 cm-1 is
associated with a network O-Si-O bond bending modes. The same IR peaks were
obtained for SG, as stated above for BA and WA. Apart from these, the band at 1654 cm-
1 is due to bending H-OH bond of adsorbed water molecules on SG and the band at 959
cm-1 is due to the stretching mode Si-OH typical of gel structure. It has been mentioned
by several researchers that surface -OH can easily be formed when the silica gel is
exposed to the atmosphere [2, 3].
4.1.3 Summary
Three different varieties of amorphous silica; namely, brown ash (BA), white ash (WA)
and silica gel (SG) were prepared from rice husk. All were completely amorphous with
some differences in purity or silica content. BA, prepared by burning husk, contains

65
about ~ 96 wt.% SiO2 (by mass) and the rest 4 wt.% impurities like CaO, Fe2O3, K2O,
ZnO, and Mn2O3. WA, prepared by burning acid-leached husk, contains almost pure
silica (99.87 wt.%). SG was prepared from BA through the alkaline extraction of silica
from ash followed by acid neutralization. Silica content of SG was ~ 99.79 wt.%. SG was
very prone to form surface -OH group due to it’s gel structure. These raw materials have
been used for the preparation of amorphous silica-based bioactive ceramics.
4000 3500 3000 2500 2000 1500 1000 500
0
20
40
60
80
100
120
1098
471
801
3440
Tra
nsm
ittan
ce (
%)
Wave number (cm-1)
4000 3500 3000 2500 2000 1500 1000 500
0
20
40
60
80
100
120
470
801
1090
3460
Tra
nsm
ittan
ce (
%)
Wave number (cm-1)
4000 3500 3000 2500 2000 1500 1000 500
10
20
30
40
50
60
Tra
nsm
ittan
ce (
%)
Wave number (cm-1)
668
799
959
1090
1654
2344
3448
Fig. 4.4 FTIR spectra of (a) BA, (b) WA and (c) SG powders.
(a) (b)
(c)
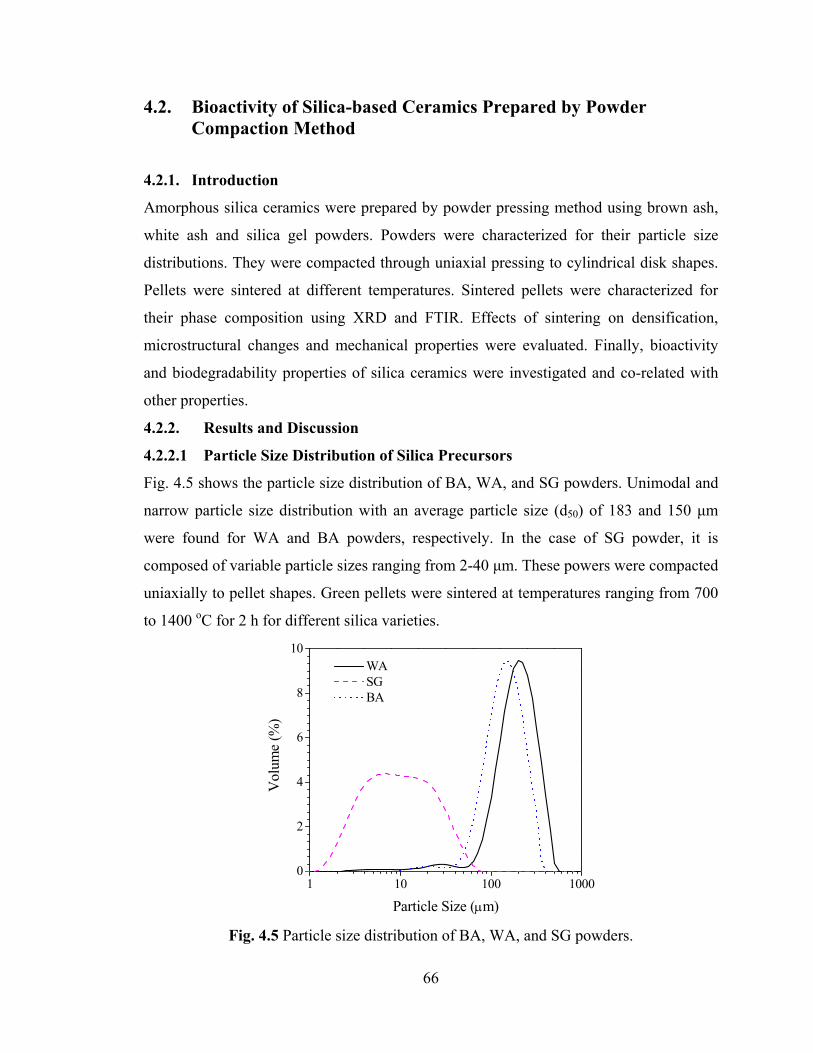
66
4.2. Bioactivity of Silica-based Ceramics Prepared by Powder Compaction Method
4.2.1. Introduction
Amorphous silica ceramics were prepared by powder pressing method using brown ash,
white ash and silica gel powders. Powders were characterized for their particle size
distributions. They were compacted through uniaxial pressing to cylindrical disk shapes.
Pellets were sintered at different temperatures. Sintered pellets were characterized for
their phase composition using XRD and FTIR. Effects of sintering on densification,
microstructural changes and mechanical properties were evaluated. Finally, bioactivity
and biodegradability properties of silica ceramics were investigated and co-related with
other properties.
4.2.2. Results and Discussion
4.2.2.1 Particle Size Distribution of Silica Precursors
Fig. 4.5 shows the particle size distribution of BA, WA, and SG powders. Unimodal and
narrow particle size distribution with an average particle size (d50) of 183 and 150 μm
were found for WA and BA powders, respectively. In the case of SG powder, it is
composed of variable particle sizes ranging from 2-40 μm. These powers were compacted
uniaxially to pellet shapes. Green pellets were sintered at temperatures ranging from 700
to 1400 oC for 2 h for different silica varieties.
1 10 100 10000
2
4
6
8
10
Vol
ume
(%)
Particle Size (m)
WA SG BA
Fig. 4.5 Particle size distribution of BA, WA, and SG powders.

67
4.2.2.2 Phase Analysis
Effect of sintering on amorphous phase retention and crystalline phase formation of
different silica specimen were investigated. Fig. 4.6 shows the XRD patterns of BA, WA
and SG specimen heat treated at two different temperatures corresponding to amorphous
phase retention and crystallization respectively. BA was amorphous up to 900 oC and it
transformed into crystalline silica at 1000 oC. XRD patterns of SG and WA were very
similar to BA patterns. It was found that WA and SG transformed into crystalline phases
from amorphous states at 1300 and 1200 oC, respectively. The results indicate that
crystallization temperature was different for different types of silica.
20 30 40 50 60
900oC
1000oC
Tridymite
Cristobalite
Inte
nsiti
es (
a.u.
)
Degree (2)
(a)
20 30 40 50 60
1200oC
1100oC
Inte
nsiti
es (
a.u.
)
Degree (2)
(b)
TridymiteCristobalite
20 30 40 50 60
1300oC
1200oCInte
nsity
(a.
u.)
Degree (2)
(c)
TridymiteCristobalite
Fig. 4.6 Amorphous and crystalline XRD patterns of sintered specimen made of (a) BA,
(b) SG, and (c) WA. Sintering temperature and crystalline phases are indicated.

68
The crystallization temperature in BA was lowest among three, due to the presence of
highest amount of impurities (~4 wt.%) in it. The chemical compositions of powders
have been presented in Section 4.1.2.2. Briefly, WA contains nearly pure SiO2 (99.87
wt.%), SG ~ 99.78 wt.% and BA contains ~96 wt.% silica. The crystallization
temperature of WA was highest among all due to its lowest impurity content (~0.13
wt.%). The crystallization temperature for SG was intermediate between WA and BA. It
is reported that impurities and water vapor play a role in the phase transformation of SiO2
[4]. Alkalis like K2O and Na2O accelerate the transformation of amorphous SiO2 to
cristobalite or tridymite in RHA [5]. Similar accelerated transformation behaviour has
been established for silica ceramics.
It is well established that RHA constitutes amorphous silica. To investigate the
structural features of this amorphous material, Rietveld structure refinement was
performed on each material. Fig. 4.7 shows the typical Rietveld plots after final
refinement for BA pellets sintered at 900 and 1000 oC. Refinement R-factors and
Goodness-of-fit (σ) are shown in the figure. For amorphous pattern refinement, silica
glass (cubic, space group P213) and low cristobalite (tetragonal, space group P41212)
were fitted in separate refinements. It was interesting to note that fitting with low
cristobalite yielded lower R-factor and better σ compared to silica glass. So, the
amorphous silica in ash may be considered structurally more similar to low cristobalite.
Many authors also proposed similar low cristobalite structure for amorphous silica in ash
[6, 7].
For crystalline specimen BA-1000 oC, a three-phase refinement was carried out
considering low cristobalite (P41212), tridymite (P63/mmc), and low quartz (trigonal,
P2334). Rietveld quantitative estimation shows about 62 wt.% low cristobalite, 30 wt.%
tridymite, and 8 wt.% quartz. Since amorphous ash is more similar to low cristobalite, the
formation of low cristobalite from amorphous material is justified. The specimen was
heated at 1000 oC, which is the thermodynamic stability range for tridymite. For that
reason, tridymite phase also crystallizes during heat treatment. The phase-transform
anomaly in silica is a well-known phenomenon. Some amount of quartz also crystallizes
may be due to this anomaly. Similar phase-formation behavior was also found in the case
of SG and WA specimens.

69
Fig. 4.7 Rietveld refinement output for quantitative phase estimation of BA.
4.2.2.3 FTIR Analysis
The presence of water vapor has been considered to play a role in the phase
transformation of SiO2. FTIR analysis was performed to study the crystallization
behavior and nature of bound water in the silica specimen. Fig. 4.8 shows the IR spectra
of three specimens at their amorphous state and after crystallization. In all silica
specimens, the broad band around 3410-3470 cm-1 is due to the stretching vibration of the
O-H bond from the silanol groups (Si-OH) and the HO-H vibration of adsorbed water
molecules. The small band at 1635 cm-1 is attributed to the bending H-OH bond of
adsorbed water molecules. These bands were present even in sintered samples because
water molecules were unable to escape from the silica matrix [8]. The band at 1100 cm-1
is due to the Si-O-Si asymmetric stretching vibration, while the band at 800 cm-1 has been
assigned to a network Si-O-Si symmetric bond stretching vibration [9]. The band at 477
cm-1 is associated with a network O-Si-O bond bending modes [10]. In the case of
crystalline SiO2 (BA-1000 oC, SG-1200 oC, and WA-1300 oC), the new band at 622 cm-1

70
is attributed to the polymerized structure of framework crystalline silica [10, 11]. This is
described as structure-dependent Si-O-Si symmetrical stretching vibrations [11] of
cristobalite phase. This characteristics band of cristobalite has also been reported by Ying
et al. [12].
4000 3500 3000 2500 2000 1500 1000 500
900oC
1000oC
BA
Wave number (cm-1)
Tra
nsm
ittan
ce (
a.u.
)
4000 3500 3000 2500 2000 1500 1000 500
1100oC
1200oC
Tra
nsm
ittan
ce (
a.u.
)
SG
Wave number (cm-1)
4000 3500 3000 2500 2000 1500 1000 500
1100
466
800
622
1200oC
1300oC
Tra
nsm
itta
nce
(a.u
.)
Wave number (cm-1)
WA
3464
Fig. 4.8 FTIR spectra of BA, SG, and WA specimens. Sintering temperature is presented
with each spectra.
4.2.2.4 Density and Apparent Porosity
Fig. 4.9 shows the bulk density and apparent porosity in terms of water absorption of
different sintered specimens. Bulk density of BA increases slowly up to 800 oC followed
by a rapid increase up to 1000 oC. Above 1000 oC, the densification rate was very slow
and it shows approximately 20% water absorption. Densification rate of WA was slow up

71
to 1000 oC followed by an increased rate up to 1300 oC, with water absorption of
approximately 1%. However, the densification rate of SG was rapid in the range of 700-
900 oC, moderate in the range 900-1200 oC and slow above 1200 oC, with approximately
1% water absorption. Results show that the SG and WA can be sintered to nearly fully
dense at 1200 and 1300 oC respectively. SG was easiest to sinter among all the silica.
The most important driving force for sintering is the curvature of the particle
surface. Finer the particles, higher will be the curvature and better will be the
sinterability. SG has much finer particle size (5-11 μm) than the other two ashes (~183
μm for WA and ~150 μm for BA). For that reason, SG has highest sinterability.
However, the green density of SG (~ 0.87 gm.cc-1) was lowest among all. Green density
for WA and BA was ~1.09 and ~1.19 gm.cc-1 respectively. Finer particles are more prone
to agglomeration, so the green density of SG is lower than others with coarser particles.
700 800 900 1000 1100 1200 1300 1400
1.0
1.2
1.4
1.6
1.8
2.0
2.2
Bul
k de
nsity
(g/
cc)
TemperatureoC
SG WA BA
(a)
700 800 900 1000 1100 1200 1300 1400
0
10
20
30
40
50
60 WA SG BA
Wat
er a
bsor
ptio
n (%
)
Temperature (oC)
(b)
Fig. 4.9 Variation of (a) bulk density and (b) water absorption of specimen with sintering temperature.
Initial slow densification of BA and WA may be due to the particle
rearrangement. Intermediate increased densification, as well as the initial densification of
SG, is due to the viscous flow of amorphous material into the pores. Sintering process in
amorphous material refers to viscous sintering where matter transport occurs
predominantly by viscous flow [13]. Viscosity decreases with increasing sintering
temperatures as well as with increasing impurities. For this reason, densification
increased with increasing sintering temperature. The rapid densification stage in BA

72
starts from 800 oC compared to that of WA at 1000 oC. The possible reason may be the
decreased viscosity of BA as it contains nearly 4 wt% impurities. The initial increased
densification of SG may be due to its decreased viscosity as the material is gel. There was
a marked change in the densification slope at 900 oC in SG. This may be due to the
differential densification behavior of bimodal particle size distribution in SG, where finer
particles and associated small pores favor rapid sintering.
The final stage of densification where there was very slow increase in bulk
density started from 1000, 1200, and 1300 oC for BA, SG, and WA, respectively. The
rate of densification and pore removal was very slow in BA above 1000 oC may be due to
the transformation of amorphous materials into crystalline phase. It has been stated in
Section 4.2.2.2, that crystallization of BA takes place at 1000 oC. The crystalline phase
has considerably lower amount of defects than amorphous phase and thus densification
decreased. The density of BA was lowest among all due to the early crystallization in the
body. Densification of SG and WA were virtually stopped above 1200 and 1300 oC,
respectively, due to the same crystallization phenomenon. Crystalline silica has about
49% co-valent bond which does not permit its easy densification. These are the typical
examples of viscous sintering with crystallization [13]. From the results, it may be
concluded that the most favorable processing strategy for amorphous silica is the
achievement of full density prior to crystallization.
4.2.2.5 Mechanical Property and Microstructure
Fig. 4.10 shows the compressive strength of BA, WA, and SG with different sintering
temperatures. The strength increases with sintering temperature, mainly due to the
increase in bulk density for all ceramics. However, there was an anomaly; that is the fall
in strength for each ceramic at a specific sintering temperature. These specific sintering
temperatures were 1200, 1300, and 1400 oC for SG, WA, and BA, respectively. To
investigate the reason for this strength anomaly, the microstructural investigation was
performed on sintered pellets. Fig. 4.11, Fig. 4.12 and Fig. 4.13 shows the surface
microstructure of the three ceramics that were sintered at specific temperatures where
anomaly takes place. All ceramics show the formation of crack.
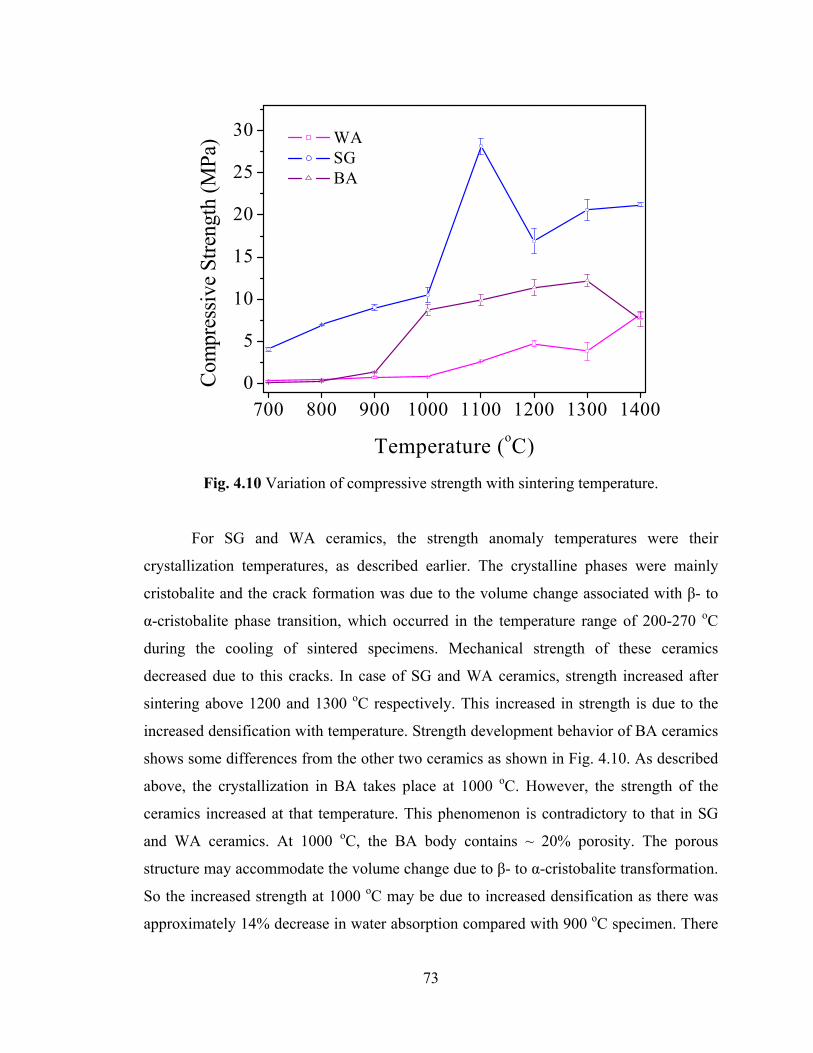
73
700 800 900 1000 1100 1200 1300 14000
5
10
15
20
25
30 WA SG BA
Com
pres
sive
Str
engt
h (M
Pa)
Temperature (oC)
Fig. 4.10 Variation of compressive strength with sintering temperature.
For SG and WA ceramics, the strength anomaly temperatures were their
crystallization temperatures, as described earlier. The crystalline phases were mainly
cristobalite and the crack formation was due to the volume change associated with β- to
α-cristobalite phase transition, which occurred in the temperature range of 200-270 oC
during the cooling of sintered specimens. Mechanical strength of these ceramics
decreased due to this cracks. In case of SG and WA ceramics, strength increased after
sintering above 1200 and 1300 oC respectively. This increased in strength is due to the
increased densification with temperature. Strength development behavior of BA ceramics
shows some differences from the other two ceramics as shown in Fig. 4.10. As described
above, the crystallization in BA takes place at 1000 oC. However, the strength of the
ceramics increased at that temperature. This phenomenon is contradictory to that in SG
and WA ceramics. At 1000 oC, the BA body contains ~ 20% porosity. The porous
structure may accommodate the volume change due to β- to α-cristobalite transformation.
So the increased strength at 1000 oC may be due to increased densification as there was
approximately 14% decrease in water absorption compared with 900 oC specimen. There

74
was very slow strength development from 1000 to 1300 oC due to slow densification. The
decrease in strength at 1400 oC may be due to the formation of increased amount of
cristobalite and prominence of crack, as shown in Fig. 4.11. Similar types of cracks were
generated in 1200 and 1300 oC sintered SG and WA specimens respectively (Fig. 4.12
and Fig. 4.13).
Fig. 4.11 Surface microstructure of BA specimen sintered at different temperatures.
1400oC 1300oC
1200oC 1100oC
900oC 1000oC

75
Fig. 4.12 Surface microstructure of SG specimen sintered at different temperatures.
900oC 1000oC
1100oC 1200oC
1300oC 1400oC

76
Fig. 4.13 Surface microstructure of WA specimen sintered at different temperatures.
900oC 1000oC
1100oC 1200oC
1300oC 1400oC

77
4.2.2.6 In vitro Bioactivity
4.2.2.6.1 Phase Analysis
Fig. 4.14 shows the X-ray diffraction patterns of amorphous BA, SG and WA ceramic
surfaces after SBF immersion for 7, 14 and 21 days. Amorphous ceramics used were
sintered at 900, 1100 and 1200 oC for BA, SG and WA respectively. 7 days BA specimen
shows calcium hydrogen phosphate hydrate; Ca8(HPO4)2(PO4)4 (H2O)5 phase (Fig. 4.14
(a)). Whereas, 14 and 21 days BA specimen show HAp; Ca10(PO4)6(OH)2 phase on their
surfaces. SG specimen shows similar behavior of hydrated calcium phosphate
precipitation in 7 days and conversion of phosphate phase into HAp in 14 days and above
(Fig. 4.14(b)). In case of WA (Fig. 4.14 (c)), hydrated calcium phosphate phase appears
only in 14 days and HAp appeared in 21 days. The results indicate that BA and SG
ceramics are more bioactive than WA ceramics.
10 20 30 40 50 60
(a)Ca
10(PO
4)
6(OH)
2*
Ca8 (HPO
4)
2(PO
4)
4 (H
2O)
5
21 days
14 days
7 days
**
* *
Inte
nsiti
es (
coun
ts)
Degree (2)
10 20 30 40 50 60
Ca8 (HPO
4)
2(PO
4)
4 (H
2O)
5
(b)
14 days
21 days
Ca10
(PO4)
6(OH)
2** *
**
7 days
Inte
nsiti
es (
coun
ts)
Degree (2)
10 20 30 40 50 60
21 days
14 days
7 days
(c)
* *
Inte
nsiti
es (
coun
ts)
Degree (2)
Ca10
(PO4)
6(OH)
2*
Ca8 (HPO
4)
2(PO
4)
4 (H
2O)
5
Fig. 4.14 XRD patterns of the silica ceramics after SBF incubation for different days; (a)
BA (sintered at 900 oC), (b) SG (sintered at 1100 oC) and (c) WA (sintered at 1200 oC).

78
The mechanisms of apatite formation in silica-based bioceramics are more or less similar
with minor differences to that of glass and glass-ceramics [14, 15]. The accepted
mechanism for glass is the dissolution of Na+ and Ca+2 ions from glassy matrix by
exchange with protons from the solution. Whereas, the mechanism for amorphous silica
is believed to be the formation of Si-OH functional group on the surface due to the
hydration and dissolution of silica network. Hydrolysis of silica network leads to the
release of soluble Si(OH)4 into the body fluid. Simultaneously, Si-OH groups are formed
at the solid-fluid interface. This group provides favorable sites for apatite nucleation [16].
Once nucleated, the apatite can grow spontaneously as the body fluid is highly
supersaturated with respect to apatite under normal condition. The mechanism of apatite
formation on silica ceramics has been shown schematically in Fig. 4.15 following the
model proposed by Vallet-Regi et al [17].
Fig. 4.15 Schematic diagram representing the events take place at the interface between amorphous silica ceramics and SBF [17].
The greater bioactivity of BA and SG may be correlated with their easy
hydrolysis. BA has about 4% impurities cations like Ca+2 and K+, which act as network
modifiers in amorphous silica. In case of SG, the hydrolysis may be easier due to its
inherent gel history. Gel material has surface silanol groups, which cannot be removed
completely by heat treatment of gel below 1200 oC [18]. SG has been sintered at 1100 oC.

79
So the surface silanol group may be present in sintered SG specimen, which facilitates its
hydrolysis. Slow response of WA may be due to its very low impurity content and high
temperature heat treatment (1200 oC) of the ceramics.
4.2.2.6.2 Microstructural Analysis
Fig. 4.16 shows the microstructure and energy dispersive spectroscopy of the BA, SG and
WA ceramics surface after immersion in SBF for 14 and 21 days. Deposited HAp layer
shows typical cauliflower like microstructure in all cases. All 21 days specimens (Fig.
4.16 (b, d & f)) show higher surface area coverage with HAp compared to 14 days (Fig.
4.16 (a, c & e)). EDS spectra shows lower amount of Si in 21 days specimen compared to
that in 14 days specimen for all cases. This is due to the deposition of higher amount of
HAp in 21 days. EDS spectra for all also show the presence of Na, Mg and Cl, because
these ions were present in the body fluid.
Fig. 4.16 SEM images and EDS spectra of BA (a-b), SG (c-d) and WA (e-f) surfaces
after incubation in SBF for 14 and 21 days respectively.
(a) (b)
(c) (d)
(f) (e)
WA
SG
BA
21 days 14 days

80
4.2.2.7 In vitro Biodegradability
Degradation of bioceramics in body fluid is another important characteristic for its
practical clinical applications. Fig. 4.17 (a) and (b) shows the change in Si concentration
and pH in TRIS buffer solution respectively with incubation time. Si concentration
increases as well as pH decreases with increasing time. It is known that silica dissolves
into body fluids as silicic acid. For that reason, pH decreases. Silica network dissolution
was rapid up to about 6 hours. After which, the rate decreased due to the saturation of
medium with respect to silicic acid. BA ceramics shows a faster dissolution than other
two ceramics due to its higher impurity content as stated earlier. Presence of other cations
inside silica network facilitates the hydrolysis of silica. Network modifier cations
dissolve quickly and thus open up silica network for its dissolution. Silica dissolution of
WA was lowest due to its lower impurity content.
0 10 20 30 40 50 60 700.0
0.2
0.4
0.6
0.8
1.0
1.2
1.4
1.6(a)
Si c
once
ntra
tion
(g/
L)
Time (hrs)
WA SG BA
0 10 20 30 40 50 60 706.9
7.0
7.1
7.2
7.3
7.4 (b)
pH
Time (hrs)
WA SG BA
Fig. 4.17 (a) Change of silicon concentration and (b) pH in TRIS medium with incubation time.

81
4.2.3. Summary
In summary, amorphous silica ceramics were prepared using rice husk ash as a raw
material. The effects of sintering temperature on the phase formation of silica and
mechanical properties of the ceramics were investigated. During sintering, amorphous
silica transformed mainly into cristobalite phase at 1000, 1200, and 1300 oC, respectively,
for BA, SG, and WA ceramics. The phase transformation temperatures were different due
to their differences in impurity content. The lowest temperature for BA was due to its
highest impurity content. Densification rate of all specimens decreased above
crystallization temperature. An anomaly in the increase in strength with sintering
temperature was found, showing a fall in strength as and when amorphous silica
transformed to cristobalite. Microstructural investigation revealed that the fall in strength
was due to the crack formation by the high-low displacive phase transformation of
cristobalite.
In vitro bioactivity test showed the formation of apatite layer on silica specimen
surface. Biodegradability test showed a substantial dissolution of silica network within
six hours. The rate of silica network dissolution and apatite phase formation was
dependent on impurity cation content in amorphous silica which was inherited from husk
composition. Among all these silica ceramics, SG showed highest mechanical strength
along with good in vitro bioactivity and biodegradability characteristics. All these results
suggest that the rice husk ash and/or silica gel prepared from rice husk are promising low
cost raw material for the preparation of bioactive amorphous silica ceramics.

82
4.3. Silica-based Scaffold Prepared by Sponge Replication Technique
4.3.1. Introduction
Highly porous amorphous silica scaffolds were prepared using brown ash, white ash and
silica gel powders through polymer sponge replication technique. Before slurry
preparation, each powder was characterized for its particle size distribution. Zeta-
potential and sedimentation behaviour of powders were also measured. Slurries with 40
wt.% solid loading were prepared using PVA binder in aqueous solution. Rheological
properties of slurries were evaluated before impregnating it into sponge template.
Impregnated sponge cubes were dried at room temperature and sintered at different
temperatures. Sintered reticulated porous ceramics (RPCs) were characterized for their
porosity, mechanical properties and bioactivity.
4.3.2. Results and Discussion
4.3.2.1 Particle Size Distribution
Fig. 4.18 shows the particle size distribution of BA, WA, and SG powders which was
used for scaffold preparation. Powders show unimodal particle size distribution with an
average size (d50) of 13, 11 and 8 m for BA, WA and SG respectively. These powders
were used to make slurry for sponge impregnation.
0.1 1 10 100 10000
1
2
3
4
5
6
7
8
Vol
ume
(%)
Particle size (m)
BA WA SG
Fig. 4.18 Particle size distribution of different silica powders.

83
4.3.2.2 Zeta-potential
Zeta (ζ)-potential becomes important for understanding the dispersability of ceramic
particles in water medium. The change of ζ-potential with pH is presented in Fig. 4. 19.
All particles develop negative surface charges in the pH range >2 to 12. The isoelectric
point is around pH 2. This behaviour is in accord with that reported by Sacks [19] for
silica suspensions. When silica powder is dispersed in water, the surface layer of silica is
hydrated to form silanols (Si-OH). Since silanols are relatively acidic, they undergo base
reaction upon increasing pH resulting in the development of negative surface charges as
per reaction:
Si-OH + OH- --------- Si-O- + H2O (4.1)
On increasing pH, the particles develop higher surface charges due to the formation of
more Si-O- groups and hence, ζ-potential increases.
2 4 6 8 10 12
-40
-30
-20
-10
0
10
IEP
SGWABA
Zet
apot
entia
l/mV
pH
Fig. 4.19 Zeta potential of different silica powders with respect to pH.
4.3.2.3 Sedimentation Behaviour
The sedimentation behaviour of different powders as a function of pH is plotted in Fig.
4.20. Sedimentation height of each suspension decreased with increasing pH. The
dispersion is more stabilized against sedimentation with increase in pH. Stabilization
occurred due to the increase in electrical double layer thickness of particles with

84
increasing pH. Near pH 2, the sedimentation amount of BA was higher than others. This
may be due to the presence of cationic impurities in BA [20]. The cationic impurities
have significant impact on the coagulation behaviour of silica [21]. Sedimentation heights
of all were minimum around pH 10. This is due to the maximum ζ-potential around pH
10 as shown in Fig. 4.19. Thus, high stabilization of silica dispersion around pH 10 is
attributed to the increased ζ-potential. All the slurries for sponge impregnation were
prepared at pH 10.
2 4 6 8 10 12
1.3
1.4
1.5
1.6
1.7
1.8
1.9
2.0
Sedi
men
t hei
ght (
cm)
pH
BA WA SG
Fig. 4.20 Sedimentation heights as a function of pH for silica powders.
4.3.2.4 Slurry Rheology
Slurry rheology is very important for easy filling into pores of template and its retention
inside the pores. Fig. 4.21 shows the response of slurry viscosity and shear stress with
changes of shear rate. In each case, viscosity decreased with increasing shear rate and
vice versa as shown in Fig. 4.21 (a). The slurries exhibit a thixotropic behaviour as
evidenced by a hysteresis between the ascending and descending curves. Fig. 4.21 (b)
illustrates these shear thinning behaviour [22] of the slurries. The slurry used for
polymeric sponge impregnation should be fluid enough to enter, fill and coat the sponge
webs and then must be thick enough to be retained inside. This kind of characteristics is
provided by the thixotropic slurry. So, these slurries were used for impregnating the

85
sponge cubes. Fig. 4.22 shows the BA-slurry impregnated dry sponge cube and Fig. 4.23
shows SG-slurry impregnated green and fired cube.
0 100 200 300 400 500 600 7000.0
0.5
1.0
1.5
2.0
2.5
3.0(a)
Vis
cosi
ty (
Pa.s
)
Shear rate (S-1)
WA SG BA
0 100 200 300 400 500 600 700
0
50
100
150
200
Shea
r st
ress
(Pa
)
Shear rate (s-1)
BAWASG
(b)
Fig. 4.21 Rheological behaviors of different silica slurries; (a) shear rate vs. viscosity (b)
shear rate vs. shear stress.

86
Fig. 4.22 BA-slurry impregnated dry sponge cubes.
Fig. 4.23 SG-slurry green and sintered sponge cubes.
4.3.2.5 Thermal Decomposition Behavior of Impregnated Sponge
Pyrolysis of sponge polymer material is very important during thermal processing in this
method. Sufficient time should be given for the polymer burnout before the sintering of
ceramics to avoid cracks. TGA was used to determine the temperature at which the
complete burnout of the polyurethane foam occurred. Fig. 4.24 shows the weight change
of impregnated sponge with temperature. It shows that the weight losses are complete
within 550 oC. Thus, to allow ample time for the complete burnout of the polymer during
thermal processing, the initial heating rate was 1 oC/min up to 600 oC with a dwell time
of 2 h at 600 oC and then sintering was carried out at different temperatures.

87
100 200 300 400 500 600 700 800 900 1000
-20
0
20
40
60
80
100
Wei
ght l
oss
(%)
Temperature (oC)
Fig. 4.24 Weight losses as a function of temperature (heating rate@10 oC/min) for
impregnated sponge.
4.3.2.6 Mechanical Property
Fig. 4.25 shows the effect of sintering temperature on porosity of different RPCs. It
shows that porosity decreases with increasing sintering temperature. It is quite obvious
that on increasing sintering temperature, porosity decreases. The porosity of sintered
body varies from 85 to 93% for BA, 86 to 90% for WA and 76 to 81% for SG based
RPC. Porosity decreases due to classical sintering phenomena, which is discussed in
details in section 4.2.2.4.
800 900 1000 1100 1200 1300 1400
76
80
84
88
92
Poro
sity
(%
)
Temperature (oC)
BA WA SG
Fig. 4.25 Effect of sintering temperature on porosity of different RPCs.

88
Room temperature compressive strengths of specimen sintered at different temperatures
are shown in Fig. 4.26. Compressive strength increased upto a specific sintering
temperature for each case. These specific sintering temperatures were 1100, 1200, and
1300 oC for SG, WA, and BA respectively. At a particular temperature, strength of all
silica body decreased due to the crack formation as described in section 4.2.2.5 in details.
At this particular temperature, crack is formed in the body due to high-low displacive
phase transformation of cristobalite during cooling of sintered body. The compressive
strength of SG RPC was higher compared to other two, apparently due to its lower
porosity. Details about the increased strength of SG material have been discussed in
section 4.2.2.5.
800 900 1000 1100 1200 1300 1400
0.0
0.2
0.4
0.6
0.8
1.0
1.2
1.4
1.6
Com
pres
sive
Str
engt
h (M
Pa)
Temperature (oC)
BA WA SG
Fig. 4.26 Effect of sintering temperature on compressive strength of the RPCs.
The stress-strain behavior of porous SG ceramics (in compression) is shown in
Fig. 4.27. The specimen was sintered at 1100 oC and was having 76 % porosity. It
showed a compressive strength of 1.47 ± 0.1MPa. The stresses and strains were
calculated from the initial cross-sectional area and length. The response showed a linear
elastic behavior during the initial compression, followed by a decrease in stress, possibly
due to the fracture of some struts in the solid network. The peaks and valleys in the curve
may be related to progressive breaking of the solid particulate network. As the strain

89
increased, the additional struts were fractured. Finally, the failure occurred due to the
propagation of crack. Such kind of stress-strain behaviour of RPC was also reported by
Gibson et al [23] and Fu et al [24].
Fig. 4.27 Compressive stress-strain curve of the SG based RPC.
4.3.2.7 In vitro Bioactivity
4.3.2.7.1 Phase Analysis
SG scaffold, sintered at 1100 oC was used for bioactivity test as the scaffold showed best
mechanical strength among all. Fig. 4.28 shows the X-ray diffraction patterns of SG
scaffold surface with and without SBF incubation. The halo, centered at ~22o (2θ) was
due to the nature of amorphous silica based material (Fig. 4.28 (a)). SBF incubated
specimen (Fig. 4.28 (b)) shows two extra peaks at 26 and 32o (2θ). These peaks were
identified to match with hydroxycarbonate apatite; HCA, Ca10(PO4)3(CO3)3(OH)2 phase.
HCA was formed in the specimen after incubation in SBF for 8 weeks.
The mechanism of apatite formation in amorphous silica is believed to be the
formation of Si-OH functional group on the surface due to the hydration and dissolution
of silica network. Hydrolysis of silica network leads to the release of soluble Si(OH)4 into
Load (KN)
Displacement (mm)

90
the body fluid. Simultaneously, Si-OH groups are formed at the solid-fluid interface. This
group provides favorable sites for apatite nucleation and the phenomena have been
discussed in earlier section 4.2.2.6.
10 20 30 40 50 60
(b)
(a)
*Ca10
(PO4)
3(CO
3)
3(OH)
2
**
Inte
nsiti
es (
a.u.
)
Degree (2)
Fig. 4.28 XRD patterns of SG scaffold (a) without and (b) with SBF treatment.
4.3.2.7.2 Microstructural Analysis
Fig. 4.29 shows the microstructure and EDS spectra of SG scaffold after incubation in
SBF for 8 weeks. The microstructure (Fig. 4.29 (a)) of the SG scaffold shows open and
interconnected pores with well thickened struts. Carbonated hydroxyl apatite grows over
the strut boundary and also on the concave surface of the scaffold (Fig. 4.29 (b)). The
deposited apatite morphology shows sponge-wig type structure (Fig. 4.26 (c, d and e)).
Corresponding EDS confirmed the deposition is carbonated hydroxyapatite. EDS also
shows the presence of Na, Mg and Cl, because these ions were present in the body fluid.

91
Fig. 4.29 SEM micrographs and EDS graph of SG scaffold with (a) open and inter
connected pores and (b, c, d, e) deposited carbonated HAp on strut boundary with
sponge-wig like structure.
(a) (b)
(c) (d)
(e)

92
4.3.3. Summary
Amorphous silica based scaffold was prepared using rice husk ash and silica gel powder.
Scaffolds were fabricated by slurry impregnation process using polymeric sponge as the
replica. The aqueous slurry with 40 wt.% solid loading showed a thixotropic behaviour in
presence of PVA binder. The sintering temperature showed a strong effect on the porosity
and mechanical strength development of scaffolds. The strength of scaffold decreased
above a sintering temperature where the amorphous silica transformed into cristobalite.
The SG scaffold, with a porosity of 76.0 %, showed good mechanical strength of 1.47 ±
0.1MPa. In vitro bioactivity test in SBF showed the formation of apatite layer on silica
scaffold surface. All these results suggest that the rice husk ash is a promising low cost
raw material for the preparation of amorphous silica scaffold.

93
4.4. Porous Silica Ceramics Prepared by Gelcasting
4.4.1. Introduction
Silica gel powder was prepared utilizing rice husk ash produced as a waste in boiler
heating plant of a local rice mill. The gel powder was used to fabricate porous ceramics
through gelcasting technique. Slurry for gel casting was prepared with 42 vol.% solid
loading in Acrylamide (AM) monomer and Methylene-Bisacrylamide (MBAM) cross-
linker premix solution. Gelation time of the slurry was optimized by using different ratio
of MBAM:AM premix solutions. Gel powder dispersed in premix solution was
characterized for its zeta-potential and sedimentation behaviour. Rheological property of
the slurry was studied. Gelcasting process was carried out at room temperature and
cylindrical shapes of specimens were gelcasted without any damage of their shapes.
Different complex shapes were machined out from green body. Thermal decomposition
and sintering behaviour of the specimen were studied. Sintered shapes were analyzed for
their phase formation, porosity, mechanical strength and bioactivity.
4.4.2. Results and Discussion
4.4.2.1 Zeta-potential
Before slurry preparation, zeta-potential (ζ) of SG powder has been re-checked in the
presence of the monomer: cross-linker. Fig. 4.30 shows the particle size distribution of
SG powder which was used for gel-casting study. Unimodal and narrow particle size
distribution with an average particle size of 9 m was found for SG powder.
1 10 1000
1
2
3
4
5
6
7
8
Vol
ume
(%)
Particle size (m)
Fig. 4.30 Particle size distribution of silica gel powder.

94
ζ-potential of SG was measured by dispersing it in 1:30 premix solution. 1:30 premix
solution was used for this measurement because this ratio of the monomer:cross-linker
has been reported as optimum for many gelcasting system [25, 26]. The change of ζ-
potential with pH is presented in Fig. 4.31. SG particles develop negative surface charges
in the pH range >2 to 12 as described above. Maximum negative ζ-potential was obtained
at pH 10. Results revealed that ζ-potential of SG show no changes in premix solution as
compared to water suspension. As stated earlier, the surface layer of silica is hydrated to
form silanols (Si-OH). Since, silanols are relatively acidic; it reacts with OH- to form Si-
O- negative surface charges. This increased surface charge will help to stabilize the slurry
with higher solid loading.
2 4 6 8 10 12-45
-40
-35
-30
-25
-20
-15
-10
-5
0
Zet
a po
tent
ial (
mV
)
pH
Fig. 4.31 Zeta potential of silica gel powder with pH measured in 1:30 premix solution.
4.4.2.2 Sedimentation
The sedimentation behaviour of SG particle was measured using a 20 wt.% solid loading
in 1:30 premix solution. Fig. 4.32 shows the sedimentation heights measured as a
function of pH. The height decreases with increasing pH up to around 10 and then
slightly increases at pH 12. As described in section 4.3.2.3, the variation in sedimentation
with pH is due to the different extents of agglomeration. Agglomeration decreases due to

95
the increase in electrical double layer thickness of particles with increasing pH.
Sedimentation height was minimum around pH 10; this is due to the maximum ζ-
potential, as shown in Fig. 4.31. So, SG slurry should be prepared at pH 10.
Fig. 4.32 Sedimentation behaviour measured after 72 h of SG particles at different pH
when dispersed in 1:30 premix solution.
4.4.2.3 Gelation Time
The gelation process is one of the key steps of gelcasting. The gelation rate depends on
polymerization rate of the organic monomer in the suspension. Generally, polymerization
rate is related to the amount of initiator, concentration of monomer and temperature. Fig.
4.33 shows the variation of gelation time with initiator concentration for different
monomer system. Gelling time of each monomer system (15 wt.% of powder) decreases
with increasing initiator concentration. 1:6 ratio monomer system takes too little time for
gelation compared to the other monomer system. 1:70 monomer system takes
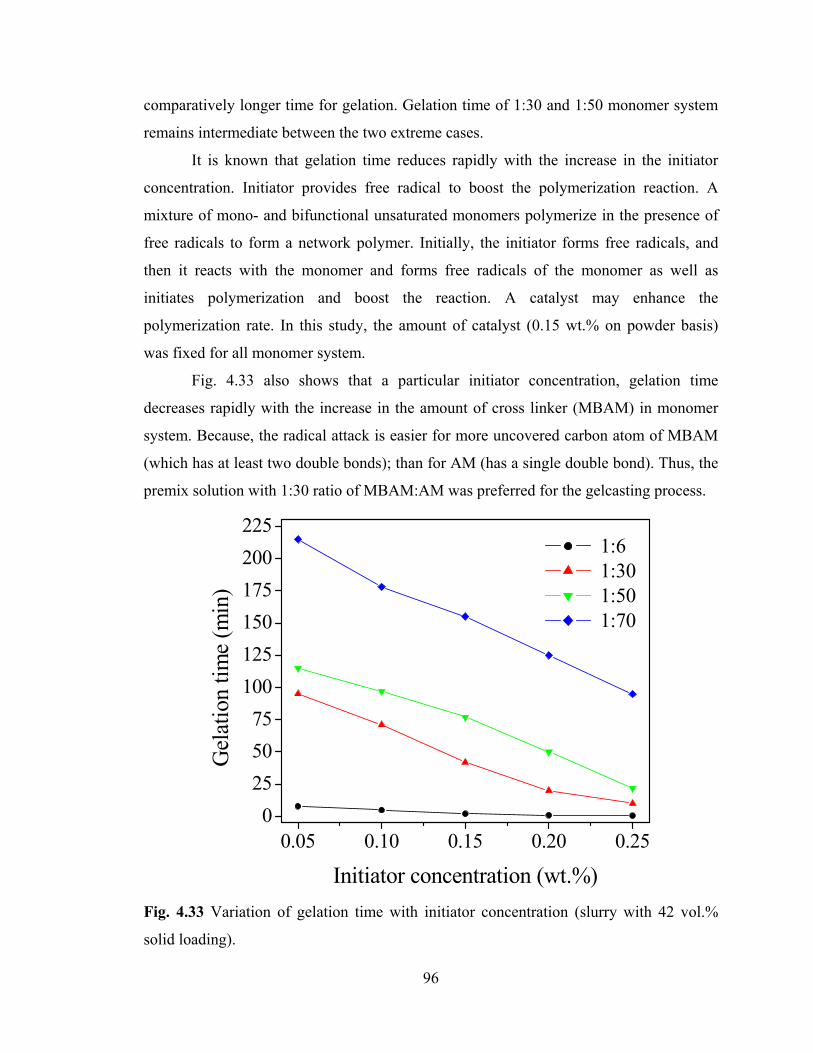
96
comparatively longer time for gelation. Gelation time of 1:30 and 1:50 monomer system
remains intermediate between the two extreme cases.
It is known that gelation time reduces rapidly with the increase in the initiator
concentration. Initiator provides free radical to boost the polymerization reaction. A
mixture of mono- and bifunctional unsaturated monomers polymerize in the presence of
free radicals to form a network polymer. Initially, the initiator forms free radicals, and
then it reacts with the monomer and forms free radicals of the monomer as well as
initiates polymerization and boost the reaction. A catalyst may enhance the
polymerization rate. In this study, the amount of catalyst (0.15 wt.% on powder basis)
was fixed for all monomer system.
Fig. 4.33 also shows that a particular initiator concentration, gelation time
decreases rapidly with the increase in the amount of cross linker (MBAM) in monomer
system. Because, the radical attack is easier for more uncovered carbon atom of MBAM
(which has at least two double bonds); than for AM (has a single double bond). Thus, the
premix solution with 1:30 ratio of MBAM:AM was preferred for the gelcasting process.
0.05 0.10 0.15 0.20 0.250
25
50
75
100
125
150
175
200
225
Gel
atio
n tim
e (m
in)
Initiator concentration (wt.%)
1:6 1:30 1:50 1:70
Fig. 4.33 Variation of gelation time with initiator concentration (slurry with 42 vol.%
solid loading).

97
4.4.2.4 Slurry Rheology
Slurry with high solid loading and excellent fluidity is essential for gel casting process.
Fig. 4.34 shows the optimized SG slurry that was used for gel casting. The slurry was
prepared at pH 10 with 42 vol.% solid content in 1:30 premix solution. The rheological
behaviour of the slurry is shown in Fig. 4.35. It is suggested that the slurry must have the
thixotropic or shear thinning behaviour. The slurry exhibits such kind of thixotropic
behaviour as evidenced by a hysteresis between the ascending and descending curves in
Fig. 4.35.
Fig. 4.34 Optimized silica gel slurry after preparation.
0 100 200 300 400 500 600 7000
20
40
60
80
100
120
0.0
0.5
1.0
1.5
2.0
2.5
Vis
cosi
ty (
Pa.s
)
Shea
r St
ress
(Pa
)
Shear Rate (S-1)
Shear stressShear stress
Viscosity
Fig. 4.35 Rheological behavior of the optimized slurry.

98
4.4.2.5 Thermal Decomposition Behaviour of gelcasted Body
Before a ceramic part can be sintered, the organic aids that are incorporated in the body
during fabrication must be removed. Binder burn-out of green body was studied through
TGA/DSC. Fig. 4.36 shows the TGA/DSC curve of gelcast body. The TGA curve shows
a steady weight loss up to the temperature of 110 °C with an endotherm at ~100 oC in
DSC due to the evaporation of physisorbed water. The major weight loss was observed in
the temperature range 200-600 °C. This loss can be attributed due to the burning of
polymer network of gel body. Two endotherms in DSC at ~280 and ~380 oC were due to
the two stage decomposition of organic precursors. The weight loss occurs from the
sample even after 600 oC onwards as shown in TGA curve, may be due to the removal of
chemically bonded OH- group remaining in the gel matrix [18]. Total weight loss was
about 30%, out of which, ~ 5 wt.% was in the temperature range of 30 to 110 oC and ~ 20
wt.% was in 110 to 600 oC; and the rest 5% was from 600 oC onwards. Depending on this
decomposition results, the gel-casted bodies were sintered with the heating schedule;
from room temperature to 600 oC at a rate 1 oC/min followed by a soaking at 600 oC for 2hrs
for organic burnout. Thereafter, the samples were heated at a rate 2°C/min to final sintering
temperature 900-1200 °C with a soaking time of 2 h.
200 400 600 800 100065
70
75
80
85
90
95
100
-2
-1
0
1
2
3
4
5
Heat flow
(mW
/mg)W
eigh
t los
s (%
)
Temperature (oC)
Exo
Fig. 4.36 TGA-DSC curves of gelcast body at a heating rate of 10 oC/min.

99
4.4.2.6 Mechanical Property
Fig. 4.37 shows the different shapes prepared by machining gel-casted SG bodies and
after sintering. Fig. 4.38 shows the change of porosities and compressive strengths of
specimen with sintering temperatures. The samples were sintered at temperatures ranging
from 900 to 1200 oC. Porosity decreases gradually with increase in sintering temperature.
It is evident that the strength increases significantly with the sintering temperature and
reaches a maximum at 1100 oC showing the mechanical strength of ~ 27.5 MPa even
though the body was having ~ 25% porosity. The strength decreased when the body was
sintered at 1200 oC. Decreased strength above 1100 oC is due to the formation of cracks.
Crack formation was due to the high to low displacive phase transformation of
cristobalite and has been discussed earlier in section 4.2.2.5. Fig. 4.39 shows the XRD
patterns of SG bodies sintered at 1100 and 1200 oC. As found earlier, the SG was
amorphous at 1100 oC and crystalline cristobalite at 1200 oC. The details of phase
transformations for amorphous silica of SG have been discussed in section 4.2.2.2. Fig.
4.40 shows the SEM microstructure of sintered specimen surfaces. 1200 oC specimen
(Fig. 4.39) shows the presence of continuous cracks as stated above.
Fig. 4.37 Different sintered shapes prepared by machining gelcasted ingot.

100
Fig. 4.38 Variation of porosity and compressive strength of gelcasted specimen with
sintering temperature.
20 30 40 50 60
1200oC
1100oCInte
nsiti
es (
a.u.
)
Degree (2)
TridymiteCristobalite
Fig. 4.39 XRD pattern of gelcasted SG-body after sintering at 1100 and 1200 oC.

101
Fig. 4.40 Surface microstructure of a gelcasted SG pellet after sintering at (a) 1100, and
(b) 1200 oC.
4.4.2.7 In vitro Bioactivity
4.4.2.7.1 Phase Analysis
Fig. 4.41 shows the X-ray diffraction patterns of sintered SG surface with and without
SBF incubation. Fig. 4.41 (a) shows that the sintered SG is amorphous in nature. SBF
incubated specimen (Fig. 4.41 (b)) shows extra peaks at 26 and 32o (2θ). These peaks
were identified to match with hydroxylcarbonate apatite; HCA, Ca10(PO4)3(CO3)3(OH)2
phase. This indicates, HCA was formed on the specimen surface during incubation in
SBF for 4 weeks.
15 20 25 30 35 40 45 50 55 60
Inte
nsiti
es (
a.u.
)
Degree (2)
(b)
(a)
Ca10
(PO4)
3(CO
3)
3(OH)
2
Fig. 4.41 XRD patterns of SG scaffold (a) without, and (b) with SBF incubation.
(a) (b)

102
4.4.2.7.2 Microstructural Analysis
Bioactivity of gelcasted SG specimen was also evaluated by analyzing surface
microstructure. Fig. 4.42 shows SEM micrographs and EDS graph of SG specimen after
SBF incubation for 4 weeks. Deposited HAp has cauliflower like microstructure. EDS
image shows typical Ca, P and Si, peaks along with C indicating carbonated HAp
formation.
Fig. 4.42 SEM and EDS of SG surface after 28 days SBF incubation.
4.4.3. Summary
Amorphous silica-based porous bioactive ceramics was successfully prepared by gel
casting method using silica gel powder derived from industrial rice husk ash. The slurry
with 42 vol.% solid loading in 1:30 (MBAM:AM) monomer cross-linker solution,
showed good thixotropic behaviour and generated a good casting. Casted body also
showed good machinability. Sintered gel-casted body having ~25% porosity showed a
mechanical strength of 27.5 ± 0.2 MPa. In vitro bioactivity experiment showed the
formation of apatite layer on silica body. All these results suggest that the gel-casted SG-
body can be used as bioceramics for different clinical applications.

103
4.5. Sol-gel Bioglass-Ceramics
4.5.1. Introduction
Soda-lime-silicate based glass-ceramics was synthesized through sol-gel route using
RHA as silica precursor. The decomposition behavior of gel was evaluated. Gel powder
was calcined to form glass-ceramics phases. Glass-ceramics powder was compacted to
disk shape through uniaxial pressing. Disks were sintered at different temperatures
ranging from 900 to 1050 oC. Mechanical properties of sintered specimen were measured
and correlated with microstructural features. Both in vitro bioactivity and
biodegradability of sintered material were investigated by incubating in simulated body
fluid and TRIS buffer solution, respectively. Scanning electron microscopy, energy
dispersive spectroscopy and X-ray diffraction were used to investigate the surface
deposition after body fluid incubation.
4.5.2. Results and Discussion
4.5.2.1 Thermal Decomposition of Gel Powder
The thermal decomposition behavior of gel precursor was evaluated using TGA/DSC.
Fig. 4.43 shows TGA/DSC curves of gel precursor. The decomposition may be divided
into four different zones as shown in the figure. Zone I, extending up to ~150 °C, shows
∼12% weight loss with a broad endothermic peak at 120 °C. Zone II (150-520 °C) shows
an endothermic peak at 227 °C and a small weight loss (5%). Zone III (520-730 °C)
shows a major weight loss of ∼35% and four endothermic peaks at 580, 650, 690 and 720
°C respectively. There is very small or no weight loss in zone IV (730-1000 °C).
The decomposition behavior of gel precursor is used for the optimal synthesis of
glass-ceramics. The gel is associated with two types of water namely physically and
chemically bonded water. About 12% weight loss and associated endotherm at 120 °C
(zone I, Fig. 4.43) are attributed to the loss of physically absorbed water from gel. A
small weight loss in the zone II (150 to 520 °C) might be due to the loss of remaining
portion of physically absorbed water. This zone shows an endothermic peak at 227 °C
under which there is no weight loss. This may be due to the eutectic melting of NaNO3-
Ca(NO3)2 content of gel. Similar eutectic melting endotherm has been reported [27] for
NaNO3-Ca(NO3)2 at 232 °C. The major weight loss of 35% in zone III is due to the

104
decomposition of sodium and calcium nitrate as well as by the removal of chemically
bonded water. The endothermic peaks at 580, 650, 690 and 720 °C may be attributed to
the decomposition of Ca(NO3)2 [28] and NaNO3 [29], which releases O2, NO and N2
gases during their decomposition. Decomposition of gel is further explained with the help
of phase formation during heat treatment.
100 200 300 400 500 600 700 800 900 100040
50
60
70
80
90
100
-1.0
-0.5
0.0
0.5
1.0
1.5
2.0
Heat Flow
(mW
/mg)
Temperature (oC)
Wei
ght l
oss
(%)
IVIIIIII
Exo
Fig. 4.43 DSC-TGA plot of soda-lime-silicate gel powder.
4.5.2.2 Phase Analysis
The phase formation behaviour during thermal decomposition and heat treatment of
glass-ceramics precursors were investigated by XRD. Fig. 4.44 shows the XRD patterns
of precursors after calcining at different temperatures. As prepared gel is completely
amorphous (Fig. 4.44 (a)). However, NaNO3 phase crystallizes upon heating the gel. Fig.
4.44 (b) shows well crystallized NaNO3 phase on the specimen after heat treatment at 300 oC. The intensity of the NaNO3 peaks decreases upon heat treatment above 500 oC (Fig.
4.44 (c)). Sodium calcium silicate phases were crystallized at and above 700 oC. Two
phases; combeite-I, Na6Ca3Si6O18 (JCPDS 77-2189) and Na2Ca2Si2O7 (JCPDS 10-0016)
are crystallized initially (Fig. 4.44 (d)). Finally, the major phase is combeite-I. Some
amount of combeite-II, Na4Ca4Si6O18 was also detected in the specimen that was heat
treated at 900 oC (Fig. 4.44 (e)).

105
Fig. 4.44 XRD patterns of gel powder; (a) as prepared, and after calcination at (b) 300 (c) 500 (d) 700 and (e) 900 oC.
Decomposition of gel should be correlated with phase formation to optimize the
processing parameters of glass-ceramics. By nature, the gel is amorphous. Gel contains a
continuous network of solid and water. Upon heat treatment, crystallization of NaNO3
occurs in the gel (Fig. 4.44 (b)). Similar crystallization has been reported in sol-gel glass
upon heating above room temperature [30]. Then the amount of NaNO3 decreases (Fig.
4.44 (c)), due to its partial decomposition at 500 oC. Dynamic decomposition of nitrates
starts at around 530 oC (Fig. 4.43). Since the calcination was carried out in static
condition at 500 oC for 2 h, some decomposition takes place. Nitrate decomposition
completes upon calcination at 700 oC for 2 h (Fig. 4.44 (d)). Simultaneously, calcium and
sodium react with silica to form different sodium calcium silicate phases. The major
phase is Na6Ca3Si6O18, because, NaO:CaO:SiO2 in the precursor is in ratio of 3 (Na2O):3
(CaO):6 (SiO2). Crystallinity of these ceramic phases increases when fired at 900 oC (Fig.
4.44 (e)) due to growth phenomena. It is evident that the crystallization of ceramic phases
occurs mainly in zone IV of Fig. 4.43; in which the DSC curve shifts towards positive,
that is, exothermic direction due to this crystallization.

106
The phase-formation behavior during sintering of glass-ceramics was also
investigated. Fig. 4.45 shows the XRD patterns of pellets sintered at different
temperatures along with pure and calcined gel powder. As mentioned above, as prepared
gel is completely amorphous and combeite-I, and Na2Ca2Si2O7 are crystallized during
calcinations at 700 oC (Fig. 4.45 (b)). Similarly, BGC900 specimen shows combeite-I and
combeite- II phases (Fig. 4.45 (c)). It has been found that the combeite phase transforms
into devrite; Na2Ca3Si6O16 (JCPDS 77- 0386), upon heat treatment above 900 oC. Semi-
quantitative phase estimation shows about 58% devrite phase in BGC950 (Fig. 4.45 (d)).
The devrite phase increases to74% in BGC1050 (Fig. 4.45 (f)). Remaining crystalline
phases were combeite-I and II. It is to be noted that the diffraction patterns of combeite
and devrite phases are very similar.
20 30 40 50 60
(f)
(e)
(d)
(c)
(b)
(a)
Inte
nsiti
es (
a.u.
)
Degree (2)
Na2Ca
2Si
2O
7
Na4Ca
4Si
6O
18Na
2Ca
3Si
6O
16
Na6Ca
3Si
6O
18
Fig. 4.45 XRD patterns of glass-ceramics; (a) as prepared (b) powder calcined at 700 oC, and pellet sintered at (c) 900, (d) 950, (e) 1000, (f) 1050 oC.
4.5.2.3 Particle Size Distribution of Glass-Ceramics Powder
After calcination, glass-ceramic powder was ground into fine particles. Fig. 4.46 shows
the particle size distribution of glass-ceramic powder. A unimodal size distribution with
average particle size (d50) of 4.5 μm was obtained. The relatively small size of particles of

107
the glass-ceramic was due to its processing through sol-gel route. This powder was used
for the preparation of glass-ceramic pellets through uniaxial compaction.
0.1 1 10 100
1
2
3
4
Vol
ume
(%)
Particle size (m)
Fig. 4.46 Particle size distribution of glass-ceramics powder.
4.5.2.4 Mechanical and Microstructural Properties
Fig. 4.47 shows the bulk density, porosity and compressive strength of glass-ceramics
specimen sintered at different temperatures. As expected, bulk density increases and
porosity decreases with sintering temperature. Compressive strength increases with
increasing sintering temperature up to 1000 oC followed by the decrease in strength at
1050 oC. Although, a substantial increase in bulk density and decrease in porosity were
observed at this particular temperature. The increase in strength with sintering
temperature is due to the classical sintering phenomena; where particle rearrangement,
mass diffusion to pores and grain growth takes place.
To analyze the fall in strength at 1050 oC, microstructures of sintered specimens
were investigated. Fig. 4.48 shows the surface microstructures of glass-ceramics sintered
at different temperatures. The glass-ceramics has porous structure up to about 1000 oC.
The precipitated ceramic phase shows (Fig. 4.48 (a)) acicular shapes. Fig. 4.48 (b) and(c)
shows a low magnification view of porous structure.

108
Fig. 4.47 Change of bulk density, porosity and compressive strength of glass-ceramics
with sintering temperatures.
The partial melting of glass-ceramics can be observed at 1050 oC (Fig. 4.48 (d)) and it
has faceted grains in monolithic pore free body. The porosity of the specimen was about
1% as shown in Fig. 4.47. Moreover, the BGC1050 microstructure shows many cracks in
its surface. Formation of cracks may be due to the thermal expansion mismatch between
ceramic and glassy matrix. Thus, the mechanical strength of BGC1050 was low due to
the presence of cracks.
4.5.2.5 In vitro Bioactivity
4.5.2.5.1 Phase and Microstructural Analysis
The bioactivity of sintered (900 oC) glass-ceramics was assessed in vitro using SBF
solution. Fig. 4.49 shows the XRD pattern of glass-ceramics surface incubated for
different period of time in SBF along with untreated sample. The specimen without SBF
treatment (zero days) shows typical sodium-calcium-silicate phases as described above.
These crystalline phases are absent in 3-days SBF incubated specimen. 3-days specimen
shows the presence of amorphous glassy phase and some amount of crystalline calcium-
phosphate based phases.

109
Fig. 4.48 Surface microstructures of glass-ceramics sintered at (a) 900, (b) 950, (c) 1000
and (d) 1050 oC.
Carbonated hydroxy apatite and hydrated calcium phosphate phases are identified in the
specimen. The amount of these two phases increases in 14 and 21 days specimen. The
amorphous glassy phase seems to increase in 14 days specimen. Formation of bone like
apatite layer during bioactivity experiments was also evaluated by investigating the
change of surface morphology.
Fig. 4.50 shows the surface morphology of glass-ceramics specimen; those
incubated in SBF with different time periods along with EDS elemental analysis.
Untreated glass-ceramics surface has acicular structured morphology (Fig. 4.50 (a)) with
typical EDS spectra showing Si, Ca and Na. The surface morphology changes with
incubation periods. 3-days surface shows the formation of individual apatite grains with
size ~1 μm (Fig. 4.50 (b)). With increasing incubation periods, apatite grains grow into
spherical shapes with an average diameter of ~1.5 μm size in 14-days (Fig. 4.50 (c)). 21-
days surface (Fig. 4.50 (d)) shows ~ 5 μm size clusters with cauliflower like morphlogy

110
covering entire surface. The EDS spectra of these grain/clusters show the presence of P
and C in addition to Na, Ca and Si; which indicates the formation of carbonated calcium
phosphate hydrated phases.
Fig. 4.49 XRD patterns of glass-ceramic surface after incubation in SBF for different
time periods.
Fig. 4.50 SEM image and EDS spectra of glass-ceramics; (a) as prepared, and after
incubation in SBF for (b) 3 (c) 14, and (d) 21 days.
(a)
(d) (c)
(b)

111
The in vitro bioactivity was evaluated by checking the ability of bone like apatite phase
formation on the surface of material in simulated body fluid. The glass-ceramics showed
a good bioactivity in vitro. Hydrated calcium phosphate phase was formed within 3-days
of incubation (Fig. 4.49). Sodium-calcium-silicate phases of glass-ceramics were
completely dissolved in SBF within 3 days, due to the release of Na+ and Ca2+ ions into
the solution. Dissolution of surface ions leaves a glassy matrix on the surface. Glassy
matrix increased in 14 days specimen; might be due to some structural changes in the
matrix.
The apatite formation upon bioglass-ceramics is speculated to proceed by the
following mechanism [31]: the glass-ceramic releases Ca2+, Na+ ions from its network via
an exchange with the H+ and H3O+ ions in SBF to form Si–OH groups on the surface.
The Si–OH groups formed induce apatite nucleation through the formation of amorphous
calcium silicate and calcium phosphate. Once nucleated, the apatite grows spontaneously
as the body fluid is highly supersaturated with respect to apatite under normal condition.
Released Ca2+, Na+ ions of glass-ceramics also accelerate apatite nucleation by increasing
the ionic activity product of apatite in the fluid. It may be concluded that the glass-
ceramics prepared in the present investigation, show a good bioactivity in 3 days and
comparable to that of apatite-wollastonite (A-W) glass-ceramics [32, 33]. Good
bioactivity of the glass-ceramics is due to its sol–gel origin during synthesis which
provide abundant amount of Si-OH functional group on their surfaces [34] for apatite
nucleation.
Acicular morphology of glass-ceramics is due to the precipitation of ceramics in
glassy matrix (Fig.4.50 (a)). XRD analysis reveals that, ceramic dissolves in SBF within
3-days of incubation. The surface morphology also supports this as there are no acicular
grains in 3-days surface (Fig. 4.50 (b)). Calcium hydrated phosphate phases are detected
in 3, 14 and 21 days specimen. So, the grains and clusters shown by these surfaces (Fig.
4.50 (b-d)) are attributed to the formation of phosphate phases. Similar changes in apatite
morphologies have been reported for sol-gel derived glasses and glass-ceramics [35].
4.5.2.5.2 Effect of Sintering on Bioactivity

112
Effect of sintering temperature on bioactivity of BGC was assessed in vitro using SBF
solution. Fig. 4.51 shows the XRD pattern of different sintered glass-ceramic surface
with those incubated for 3-days in SBF along with untreated sample. The specimen,
without SBF treatment (zero days) shows typical sodium-calcium-silicate phase as
described above. As observed previously, these crystalline phases are almost absent in
BGC900 (Fig. 4.51 (b)). This is due to the dissolution of crystalline phases in SBF.
Carbonated hydroxy apatite (Ca10(PO4)3(CO3)3(OH)2) and hydrated calcium phosphate
(CaHPO4(H2O)2) phases could be identified in the specimen. Crystalline peak of glass-
ceramics sintered at higher temperature seems to be less affected by SBF incubation.
These crystalline phases may be less soluble in SBF when sintered at higher temperature.
20 30 40 50
CaHPO4(H
2O)
2Ca
10(PO
4)
3(CO
3)
3(OH)
2
(e)
(d)
(c)
(b)
(a)
Inte
nsiti
es (
a.u.
)
Degree (2) Fig. 4.51 XRD patterns of glass-ceramics specimen, (a) sintered at 900 oC; and the patterns after 3-days SBF incubation of specimen those sintered at (b) 900, (c) 950, (d) 1000, and (e) 1050 oC.
Fig. 4.52 shows the surface morphology and EDS graph of different sintered
specimen which were incubated in SBF for 3days. EDS graphs show the presence of P
and C in addition to Na, Ca and Si. This indicates the formation of carbonated calcium
phosphate hydrate phases as described above. The spectra shows that the relative
intensities of P and Ca compared to Si decrease with increasing sintering temperature.
That is the apatite deposition decreases and it was lowest in BGC1050. The results show

113
that the apatite formation decreases in the order
BGC900>BGC950>BGC1000>BGCl050. Heating of the glass-ceramics can modulate its
structure and thus have an influence on apatite formation. Higher the sintering
temperature, the material will have more crystalline phases and less glassy matrix. XRD
analysis also showed the change in the types of crystalline phases with increasing
temperature, which may influence the dissolution characteristics of glass-ceramics.
Fig. 4.52 SEM image and EDS spectra of 3-days SBF incubated glass-ceramic specimen sintered at (a) 900, (b) 950 (c) 1000, and (d) 1050 oC respectively.

114
4.5.2.6 In vitro Biodegradability
Biodegradability characteristic of bioceramics in body fluid is another important aspect
of bioactivity for its practical clinical applications. Fig. 4.53 (a) and (b) shows the change
in pH of TRIS buffer solution and water absorption capacity respectively with incubation
time. Both water absorption capacity and pH of TRIS medium increased with increasing
time. Both the phenomena were rapid up to about 1 day, moderate up to about 2 days and
slow thereafter. The increment of pH and water absorption was highest for BGC900,
intermediate for BGC1000 and lowest for BGC1050, respectively. This indicates that the
biodegradability also decreases with increasing sintering temperature.
0 1 2 3 4 5 6 78.0
8.2
8.4
8.6
8.8
9.0
9.2
9.4
9.6
pH
Incubation time (days)
BGC 900oC
BGC 1000oC
BGC 1050oC
(a)
0 1 2 3 4 5 6 7
16.0
16.5
17.0
17.5
18.0
Wat
er a
bsor
ptio
n (%
)
Incubation time (days)
BGC 900oC
BGC 1000oC
BGC 1050oC
(b)
Fig. 4.53 Dissolution kinetics of glass-ceramic sintered at different temperatures; (a) Change in pH of TRIS medium, and (b) water absorption capacity of specimen with incubation period.

115
The dissolution of glass-ceramics depends on the presence of Ca2+ and Na+ within it [36,
37]. During dissolution, these ions were leached out from the glass-ceramic matrix, hence
the pH of the medium increased. To compensate the leached out material of glass-
ceramic, equivalent amount of water molecule diffused into the specimen and filled the
void space created by the leached material; hence water absorption increased [38]. The
rate of dissolution as well as the pH increment decreased after about 2 to 4 days due to
the decrease in surface Ca2+ and Na+ ionic concentration.
It may be concluded that the biodegradability order is BGC900 > BGC1000 >
BGCl050. Higher the sintering temperature, more will be the crystalinity of the material.
That is the material will have more crystalline phase rather than glassy amorphous phase.
It is known that biodegradability of amorphous material is higher than crystalline
material. In addition, apparent porosity decreases with increasing sintering temperature as
shown in Fig. 4.47. So, higher the sintered temperature, less permeable is the glass-
ceramic to SBF solution and less will be the effective contact area between solid and
liquid for dissolution.
4.5.2.7 Physical Model
Based on the study, a physical model similar to that proposed by Kokubo [39] may be
used to explain these results. Fig. 4.54 shows the schematic model for bioactivity of
glass-ceramics, which was presented by Kokubo et al for Na2O-SiO2 glass [40]. As per
the model, ceramic combeite phases are considered to be embedded in glassy matrix and
Ca, Na and silicate ions are dissolved from both the combite and the glassy matrix. pH of
the medium increases due to high basicity of Na+ ion. The rate of dissolution as well as
pH increment decreases after 3 to 4 days due to the decrease in the dissolving ions at the
surface. The model also proposed that the dissolution of Ca2+ ion increases the degree of
super saturation of surrounding fluid with respect to apatite and the dissolution of silicate
ions provides favorable sites for nucleation of the apatite on the surface of glass-ceramic.
The present sol-gel glass-ceramic material shows good bioactivity and bio-
dissolution within 3 days. It is well established that sol-gel bioglasses have higher
bioactivity than melt driven bioglasses [41]. This is because the sol-gel processing has the
advantage with respect to the control of material’s surface chemistry which directly
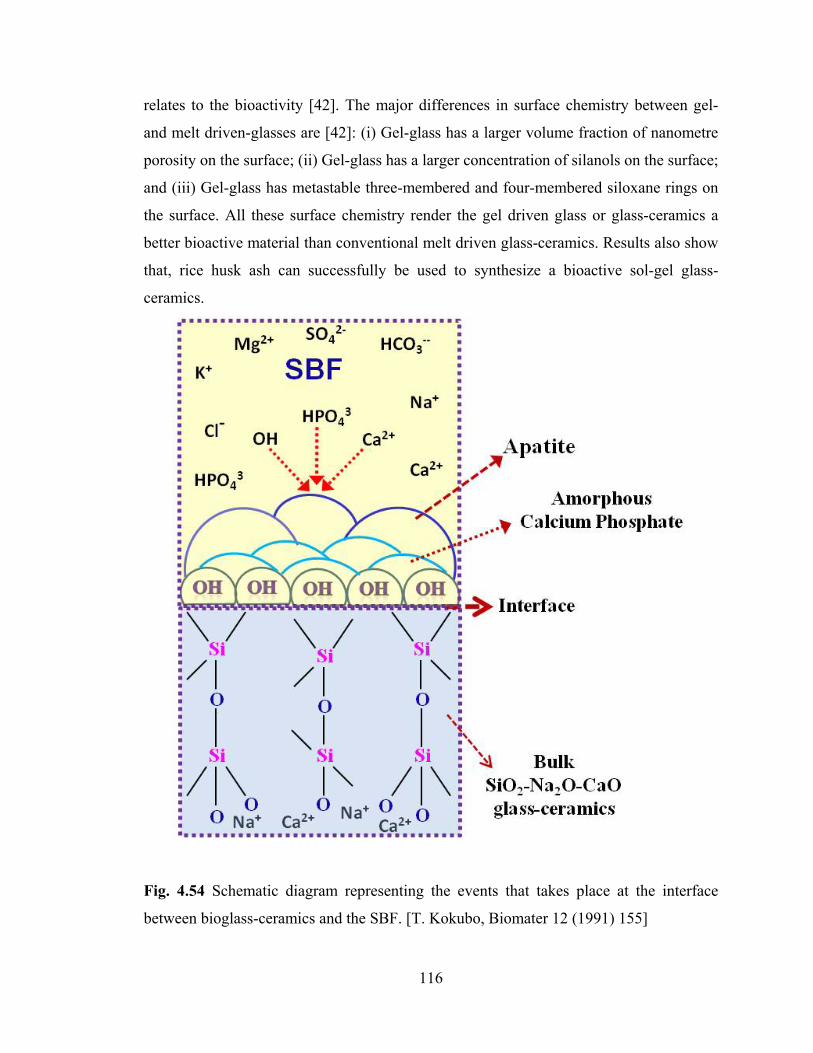
116
relates to the bioactivity [42]. The major differences in surface chemistry between gel-
and melt driven-glasses are [42]: (i) Gel-glass has a larger volume fraction of nanometre
porosity on the surface; (ii) Gel-glass has a larger concentration of silanols on the surface;
and (iii) Gel-glass has metastable three-membered and four-membered siloxane rings on
the surface. All these surface chemistry render the gel driven glass or glass-ceramics a
better bioactive material than conventional melt driven glass-ceramics. Results also show
that, rice husk ash can successfully be used to synthesize a bioactive sol-gel glass-
ceramics.
Fig. 4.54 Schematic diagram representing the events that takes place at the interface
between bioglass-ceramics and the SBF. [T. Kokubo, Biomater 12 (1991) 155]

117
4.5.3. Summary
Soda-lime-silica based bioglass-ceramic was synthesized via sol-gel route utilizing
sodium silicate, derived from rice husk ash. Gel powder was calcined at 700 oC for 2 h to
get a reactive glass-ceramic powder. The calcined powder mainly contains combeite-I
(Na6Ca3Si6O18) crystalline phase dispersed in amorphous glass matrix. Glass-ceramic
specimens were sintered at different temperatures and better mechanical property was
obtained with 1000 oC sintered glass-ceramics. Sintered pellets were tested for bio-
activity and biodegradability. Crystalline combeite phase of the glass-ceramics was found
to dissolve easily in SBF and TRIS buffer solution. Carbonated hydroxyapatite was
formed on the surface of the glass-ceramics within 3 days of incubation in SBF. On
increasing sintering temperature, both bioactivity and biodegradability of BGC specimens
decreased. Finally, it may be concluded that rice husk ash may be a low cost raw material
for the preparation of bioglass-ceramic materials through simple sol-gel route. The
bioglass-ceramics should be heat treated at 1000 oC, to get better mechanical strength.

118
4.6. Silica Aerogel prepared by Ambient Pressure drying
4.6.1. Introduction
Silica aerogel was prepared from rice husk ash by sol-gel process followed by ambient
pressure drying. Silica was extracted from ash as sodium silicate by boiling it in sodium
hydroxide solution. Sodium silicate was neutralized with nitric acid to form silica gel. To
prepare aerogel, first the pore water of the gel was exchanged by ethanol and then surface
modification was done by aging alcogel in tetraethylorthosilicate (TEOS)/ethanol
solution. Before drying, TEOS/ethanol solvent was exchanged with n-heptane. The
nature of surface modification and thermal stability of the aerogel was studied by FTIR
and DSC/TGA respectively. In vitro bioactivity of the aerogel was carried out by soaking
in simulated body fluid. Surface deposition behaviour was characterized by X-ray
diffraction, scanning electron microscopy and energy dispersive spectroscopy.
4.6.2. Results and Discussion
4.6.2.1 Ambient Pressure Drying Mechanism
The strength and stiffness of the wet silica gel was enhanced by aging it in TEOS/ethanol
solution. Prior to this aging, the gel was thoroughly washed with ethanol. The strength
and stiffness of gel may also increase by ethanol washing due to dissolution of silica from
the particles and re-precipitation into the necks between the particles [43, 44]. However,
it has been reported that the increase in strength and stiffness by such washing was not
sufficient to avoid shrinkage during drying and hence, further aging in TEOS solution
was necessary [45]. TEOS aging causes silica to precipitate from the aging solution onto
the silica network. Precipitation of silica results in an increase in the density of the wet
gel and corresponding strengthening and stiffening of the gel network [45]. During aging,
hydrolysis of TEOS and condensation of silica gel occurs. The two reactions are stated
below as reaction (4.2) and (4.3), respectively. Residual pore water and water by-product
of condensation reaction (4.3) may be responsible for hydrolysis of TEOS. TEOS can
also take part in condensation reaction with Si-OH group of gel structure (reaction- 4.4);

119
Hydrolysis :
Si(OC2H5)4 + 4H2O Si(OH)4 + 4C2H5OH (4.2)
Condensation :
Si(OH)4 + (OH)4Si (OH)3Si–O–Si(OH)3 + H2O (4.3)
≡Si(OC2H5) + HO–Si≡ ≡Si–O–Si≡ + C2H5–OH (4.4)
After surface modification, TEOS/alcohol solution was replaced by n-heptane to
prohibit crack formation during drying of the gel. Capillary stresses and associated drying
shrinkage of gel were reduced due to the low surface tension of n-heptane.
4.6.2.2 Aerogel and its Characterization
The silica aerogel prepared from rice husk ash was a light, semi-translucent porous solid
with an appearance as shown in Fig. 4.55. Bulk density and apparent porosity of the
aerogel were 0.67 g.cm-3 and 80% respectively.
Fig. 4.55 Photographs of silica aerogel (a) strengthened by TEOS, (b) dried monolithic
translucent piece.
SEM and EDS micrographs of the dried aerogel specimen are shown in Fig. 4.56.
The aerogel exhibits a sponge-like highly porous microstructure. The corresponding EDS
spectra shows Si, O and very small amount of Na. Na was present in the gel matrix as
sodium silicate solution was used for the preparation of aerogel.
(a) (b)

120
Fig. 4.56 SEM and EDS photographs of silica aerogel.
Thermal Behaviour of Aerogel:
Fig. 4.57 shows the DSC/TGA curves of silica aerogel. A similar result of the weight loss
for aerogel was observed by Folgar et al [46]. There is a sharp weight loss up to a
temperature of 150 oC due to the evaporation of residual water from the aerogel. Further,
the significant weight loss observed in the temperature range of 300-700 oC can be
attributed to the progressive poly-condensation and dehydration of aerogel as stated
above.
200 400 600 800 1000
96
97
98
99
100
0.0
0.2
0.4
0.6
0.8
1.0
1.2
1.4
1.6
1.8
Heat Flow
(mW
)
Wei
ght (
%)
Temperature (oC)
Exo
Fig. 4.57 DSC/TGA curves of air-dried silica aerogel.

121
FTIR Analysis:
Fig. 4.58 shows FTIR spectra of the aerogel heated at different temperatures. There are
characteristic bands of silica aerogel at ~ 1098, ~ 804 and ~ 471 cm-1. The ~ 1098 cm-1
which is associated with the Si-O-Si asymmetric bond stretching vibration [47]; while,
the band at ~ 804 cm-1 is assigned to a network Si-O-Si symmetric bond stretching
vibration. The bands at ~ 471 cm-1 are associated with a network Si-O-Si bond bending
vibration. The bands at ~ 960 cm-1 are associated with stretching mode Si-OH typical of
gel structure. The intensity of this band decreased with increasing temperature due to
polycondensation and dehydroxylation of gel [48]. The bands at ~ 3440 and ~ 1630 cm-1
are associated with the -OH absorption band which is caused by physically adsorbed
water [49]. The intensity of these bands decreased with increasing temperature. The small
absorption peaks at ~ 2927 and ~ 2856 cm-1 may be associated with -OC2H5 terminal
group [50]. These peaks were absent in the aerogel which were heat treated above 400 oC.
4000 3500 3000 2500 2000 1500 1000 500
471
804960
1098
1630
28562927
3440
800oC
600oC
400oC
200oC
raw
Tra
nsm
itta
nce
(a.u
.)
Wavenumber (cm-1)
Fig. 4.58 FTIR spectra of silica aerogel after heating at different temperatures.

122
Surface Area and Pore Size Distribution:
Fig. 4.59 shows the nitrogen adsorption-desorption isotherm of silica aerogel. BET
surface area and total pore volume of the aerogel were 273 m2.g-1 and 3.1 cm3.g-1
respectively. The aerogel exhibited type-IV adsorption isotherm, which indicates the
presence of mesopores [49]. Pore size distribution of the aerogel is shown in Fig. 4.60.
The pores were in the range of 10-40 nm, i.e. in the mesoporous range.
0.0 0.2 0.4 0.6 0.8 1.00
500
1000
1500
2000
Desorption
Adsorption
N2 V
olum
e ad
sorb
ed (
cm3 /g
)
p/po
Fig. 4.59 Nitrogen adsorption-desorption isotherm of silica aerogel.
5 10 15 20 25 30 35 40 450
2
4
6
8
10
12
14
16
DV(r
) (c
c/nm
/g)
Diameter (nm)
Fig. 4.60 Pore size distribution of silica aerogel.

123
4.6.2.3 In vitro Bioactivity
Fig. 4.61 represents SEM images and EDS spectra of aerogel surface after incubation in
SBF for 7, 14 and 21 days. Apatite layer formed on the surface of aerogel specimen (Fig.
4.61 (a)). As the incubation days increases, the deposition of sponge-wig shaped
hydroxyapatite (HAp) layer on the surface increased and the entire surface was almost
covered in 21 days (Fig. 4.61 (c)). The corresponding EDS spectra for each micrograph
show the intensities for Si, Ca and P along with C, which confirmed the carbonated
hydroxyapatite deposition over aerogel. As incubation periods increased, intensities of
both P and Ca increased due to more apatite formation with time. EDS also shows the
presence of Na, Mg and Cl, because these ions were present in the body fluid.
Fig. 4.61 SEM images and EDS spectra of aerogel after incubation in SBF for (a) 7 (b)
14 and (c) 21 days.

124
Fig. 4.62 displays the XRD pattern of the aerogel specimens without and with soaking in
SBF for 21 days. The characteristic diffraction peaks of HAp were identified and were
very similar to that reported pattern [51]. This confirms the bioactivity of the aerogel.
The mechanism for apatite nucleation and growth on the surface of silica aerogel
is believed to be the formation of Si-OH functional group on the surface due to the
hydration and dissolution of silica network. Hydrolysis of silica network leads to the
release of soluble Si(OH)4 into the body fluid. Simultaneously, Si-OH groups are formed
at the solid-fluid interface. This group provides favorable sites for apatite nucleation [16].
Once nucleated, the apatite can grow spontaneously as the body fluid is highly
supersaturated with respect to apatite under normal condition. Presence of large volume
of porosity and high surface area of aerogel accelerate the formation of silanols and
apatite in it.
16 18 20 22 24 26 28 30 32 34 36 38 40
(b)
(a)
o
ooo
Int
ensi
ties
(a.u
.)
Degree (2)
o Hydroxyapatite
Fig. 4.62 XRD pattern of aerogel specimen (a) without, and (b) after 21-days incubation
in SBF.
4.6.2.4 In vitro Biodegradability Study
Degradation of biomaterials in body fluid is another important characteristic.
Biodegradability of aerogel specimen was carried out in TRIS medium. Fig. 4.63 shows
the change in Si concentration and pH in TRIS buffer solution with incubation time
during dissolution experiment. Si concentration increases as well as pH decreases with
increasing time. Silica dissolves into body fluids as silicic acid. For that reason, pH
decreases. Silica network dissolution was rapid up to about 6 h after which the rate

125
decreased due to the saturation of medium with respect to silicic acid. The rate of Si
dissolution from the gel matrix was higher than the other silica ceramics which were
studied in earlier section. This is due to the presence of nanometer range pores within the
gel matrix with higher surface area. From the dissolution test, it may be concluded that
the silica aerogel prepared using RHA as silica source and through ambient pressure
drying method is degradable in biological environment.
0 10 20 30 40 50 60 70
0.4
0.6
0.8
1.0
1.2
1.4
1.6
6.8
6.9
7.0
7.1
7.2
7.3
7.4
Si c
once
ntra
tion
(g/
L)
Time (hrs)
pH
Si concentration
pH
Fig. 4.63 Change of silicon concentration and pH in TRIS medium with incubation time for aerogel during biodegradation.
4.6.3. Summary
Using the sol-gel route and ambient pressure drying technique, it was possible to obtain
the monolithic silica aerogel with low density (0.67 g.cm-3), high porosity (80%) and a
specific surface area of 273 m2 g-1. The process of aerogel production from rice husk ash
by ambient pressure drying method is very important from the industrial point of view
and it will significantly widen the commercial exploitation of the silica aerogel. The
aerogel was tested for its bio-activity and degradability. Carbonated HAp was formed on
aerogel surface within 7 days of incubation in SBF. Biodegradability of aerogel in TRIS
buffer solution showed quick release of silicic acid. Quick dissolution of silica could be
the reason for quick deposition of HAp during SBF incubation. Hence, the aerogel can be
used as novel low cost biomaterial for different clinical applications like; biosensor, drug
delivery, and protein encapsulations etc.

126
References
[1] W. Panpa, S. Jinawath, Appl. Catalysis B: Environ. 90 (2009) 389.
[2] J. H. Anderson, G. A. Parks, J. Phy. Chem. (1968) 3662.
[3] D. W. Sindorf , G. E. Maciel, J. Am. Chem. Soc. 103 (1981) 4263.
[4] W.A. Deer, R.A. Howie, J. Zussmaan, Rock Forming Minerals, Longmans,
London (1963).
[5] W. Panpa, S. Jinawath, Appl. Catal.B: Environ. 90 (2009) 389.
[6] T-H. Liou, Mater. Sci. Eng. 364A (2004) 313.
[7] S. Chandrasekhar, K.G. Satyanarayana, P.N. Pramada, P. Raghavan, T.N. Gupta,
J. Mater. Sci. 38 (2003) 3159.
[8] F. Adam, J-H. Chua, J. Colloid Interface Sci. 280 (2004) 55.
[9] X A. Bertoluzza, C. Fagnano, M.A. Morelli, J. Non-Cryst. Solids 48 (1982) 117.
[10] K.S. Finnie, J.G. Thompson, R.L. Withers, J. Phys. Chem. Solids 55 (1994) 23.
[11] I.P. Swainson, M.T. Dove, D.C. Palmer, Phys. Chem. Miner. 30 (2003) 353.
[12] J.Y. Ying, J.B. Benziger, Nanostruct. Mater. 1 (1992) 149.
[13] M.N. Rahaman, Ceramic Processing and Sintering. CRC Press (2nd Edition)
Taylor & Francis Group (2003).
[14] T. Kokubo, H. Kushitani, S. Sakka, T. Kitsugi, T. Yamamuro, J. Biomed. Mater.
Res. 24 (1990) 721.
[15] D. Arcos, D.C. Greenspan, M. Vallet-Regi, J.Biomed.Mater.Res. 65A (2003) 344.
[16] A.V. Lluch, G. Ferrer, M. Pradas, Polymer 50 (2009) 2874.
[17] D. Arcos, I. Izquierdo-Barba, M. Vallet-Regi, J. Mater Sci:Mater Medecine 20
(2009) 447.
[18] L.T. Zhuravlev, Colloids and Surf. (A) 173 (2000) 1.
[19] M.D. Sacks, Am. Ceram. Soc. Bull. 63 (1984) 1510.
[20] Q.Z. Chen, I.D. Thompson, A.R. Boccaccini, Biomater. 27 (2006) 2414.
[21] H.Y. Zhao, J. Long, J.H. Masliyah, Z. Xu, Ind. Eng. Chem. Res. 45(2) (2006)
7482.
[22] M.J. Crimp, R.E. Johnson, J.W. Halloran, D.L. Feke, Colloidal behavior of silicon
carbide and silicon nitride, Wiley, New York (1986).

127
[23] L.J. Giibson, M.F. Ashby, Cellular solids: structure and properties. 2nd ed.
Pergamon, Oxford (1999).
[24] Q. Fu, M.N. Rahaman, B.S. Bal, R.F. Brown, D.E. Day, Acta Biomater. 4 (2008)
1854.
[25] H. Yichen, W. Zhongjian, L. Jianying, J. Non-Cryst. Solids 354 (2008) 1285.
[26] D. Kong, H. Yang, S. Wei, D. Li, J. Wang, Cerm. Intl. 33 (2007) 133.
[27] E.A. Dancy, P. Nguyen-Duy, Thermo. Acta 42 (1980) 59.
[28] C. Ettarh, A.K. Galwey, Thermochimica Acta 288 (1996) 203–219.
[29] Y. Hoshino, T. Utsunomiya, O. Abe, Bull. Chem. Soc. Jpn 54 (1981) 1385.
[30] J. Phalippou, M. Prassas, J. Zarzycki, J. Non-Cryst. Solids 48 (1982) 17.
[31] O. Peital, E.D. Zanotto, L.L. Hench, J. Non-Cryst. Solids 292 (2001) 115.
[32] T. Kokubo, H. Takadama, Biomater 27 (2006) 2907.
[33] T. Kokubo, Biomater 12 (1991) 155.
[34] T. Kokubo, S. Ito, T. Huang, T. Hayashi, S. Sakka, T. Kitsugi, J. Biomed. Mater.
Res. 24 (1990) 331.
[35] M. Mami, A. Lucas-Girot, H. Oudadesse, R. Dorbez-Sridi, F. Mezahi, E. Dietrich,
Appl. Surf. Sci. 254 (2008) 7386.
[36] M.G. Cerruti, D. Greenspan, K. Powers, Biomater 26 (2005) 4903.
[37] D.A. Cortes, A. Medina, J.C. Escobedo, S. Escobedo, M.A. Lopez, J. Biomed.
Mater. Res. A 70 (2004) 341.
[38] B.C. Bunker, J. Non-Cryst. Solids 179 (1994) 300.
[39] T. Kokubo, Biomater 12 (1991) 155.
[40] T. Kokubo, Materials Science and Engineering C 25 (2005) 97.
[41] L.L. Hench, R.J. Splinter, W.C. Allen, T.K. Greenlee, J. Biomed. Mater. Res. 5
(1972) 117.
[42] W. Cao, L.L. Hench, Ceram. Int. 22 (1996) 493.
[43] S. Haereid, E. Nilsen, V. Ranum, M. A. Einarsrud, J. Sol-Gel Sci.Tech. 8 (1997)
153.
[44] S. Haereid, J. Anderson, M. A. Einarsrud, D. W. Hua, D. M. Smith, J. Non-Cryst.
Solids 185 (1995) 221.
[45] S. Haereid, E. Nilsen, M. A. Einarsrud, J. Non-Cryst. Solids, 204 (1996) 228.

128
[46] C. Folgar, D. Folz, C. Suchicital, D. Clarck, J. Non-Cryst. Solids 353 (2007)
1483.
[47] A. E. Ahmed, F. Adam, Micropor. Mesopor. Mater. 103 (2007), 284.
[48] Bertoluzza, C. Fagnano, M. A. Morelli, V. Gottardi, M. Guglielmi, J. Non-Cryst.
Solids 48 (1982) 117.
[49] F. Shi, L. Wang, J. Liu, Mater. Lett. 60 (2006) 3718.
[50] H. Yokogawa, M. Yokoyama, J. Non-Cryst. Solids 186 (1995) 23.
[51] J.A. Toledo-Fernandez, R. Mendoza-Serna, V. Morales, N. Rosa-Fox, M. Pinero,
A. Santos, L. Esquivias, J Mater Sci: Mater. Med. 19 (2008) 2207.

129
Chapter 5
Epilogue

129
5.1 Conclusions
(a) Amorphous silica precursor powders of 96, 99.79, and 99.87% purity were
successfully prepared from waste material rice husk or rice husk ash through
different processing route.
(b) Amorphous silica was found to transform into cristobalite phase upon heat
treatment in the range 1000 to 1300 oC. The crystallization temperature was
highly dependent on impurity content in the order higher the impurities lower the
transformation temperature.
(c) The mechanical strength of sintered amorphous silica body was found to decrease
as and when silica transformed from amorphous to crystalline. Decreased strength
was due to the crack formation in sintered body by high to low displacive phase
transformation of cristobalite.
(d) Amorphous silica ceramics were found to be bioactive in vitro. The bioactivity
decreased with increase in sintering temperature as well as decreasing impurity
content.
(e) Similarly, all ceramics showed a good biodegradability, which decreased with
increase in sintering temperature as well as decreasing impurity content.
(f) Amorphous silica-based bioactive ceramics were successfully fabricated through
conventional pressing, polymeric sponge replication and gelcasting method.
(g) Ceramics made of silica gel powder showed better mechanical strength than
others.
(h) Ceramics fabricated through (i) conventional pressing had a dense body (less than
5% porosity), (ii) sponge replication had 80 % porosity (~ 550 µm pore size) and
(iii) gelcasting had ~ 25% porosity.
(i) Amorphous silica ceramics made through gelcasting of silica gel powder showed
better mechanical strength than other fabrication methods.

130
(j) SiO2-Na2O-CaO based bioglass-ceramics was prepared successfully by sol-gel
technique using rice husk ash as silica source. Glass-ceramics showed best
bioactivity among all silica-based ceramics studied. The material showed HAp
formation within 3-days of SBF incubation.
(k) Bioactive silica aerogel was prepared through cost effective ambient pressure
drying technique using rice husk ash as silica source. Mesoporous (85% porosity,
~ 20 nm pore size), translucent, monolithic aerogel was successfully fabricated. A
good in vitro bioactivity and biodegradability characteristics was observed in the
aerogel, which promises for its drug delivery applications.
5.2 Scope for Future Work
In vivo bioactivity characterization, cytotoxicity characterization of all three types
of amorphous silica-based ceramics.
Preparation of scaffold through polymeric sponge replication method using
bioglass-ceramics powder synthesized using RHA and its in vivo characterization.
Preparation and characterization of encapsulated monolithic silica aerogel beads-
for drug delivery application.
Commercializing the above biomaterials.

131
Publications Resulting from the Ph. D. Work
1) J.P. Nayak, J. Bera, “Preparation of silica aerogel form rice husk ash by ambient
pressure drying process using rice husk ash as raw material”; Transaction of
Indian Ceramic Society, 68 (2009) 1-4.
2) J.P. Nayak, J. Bera, “Effect of sintering temperature on phase-formation behavior
and mechanical properties of silica ceramics prepared from rice husk ash”; Phase
Transitions, 82 (2009) 879-888.
3) J.P. Nayak, S. Kumar, J. Bera, “Sol-gel synthesis of bioglass-ceramics using rice
husk ash as a source for silica and its characterization”; Journal of Non-
Crystalline Solids, 356 (2010) 1447-1451.
4) J.P. Nayak, J. Bera, “Effect of sintering temperature on mechanical behaviour and
bioactivity of sol-gel synthesized bioglass-ceramics using rice husk ash as a silica
source”, Applied Surface Science, 257 (2010) 458-462.
5) J.P. Nayak, J. Bera, “In vitro bioactivity of amorphous silica ceramics derived from
rice husk ash”, Silicon, DOI 10.1007/s12633-010-9058-3.
6) J.P. Nayak, J. Bera, “In vitro characterization of mesoporous silica aerogel
monoliths prepared by ambient pressure drying process using rice husk ash”,
(under review-J of Non-Crystalline Solids).
7) J.P. Nayak, J. Bera, “Mechanical and in vitro performance of amorphous silica
based scaffolds prepared by polymer sponge replication technique”, (under review-
J of Porous Materials).
8) J.P. Nayak, J. Bera, “Mechanical properties of amorphous Silica-based Ceramics
fabricated through gelcasting method”; (to be communicated).
Publications not Related to the Ph. D. Work
1) J.P. Nayak, J. Bera; “A simple method for production of humidity indicating silica
gel from rice husk ash”; J. of Metals, Materials and Minerals; 19 (2009) 15-19.
2) J.P. Nayak, J. Bera; “Preparation of an efficient humidity indicating silica gel from
rice husk ash”; (under review-Bulletin of Materials Science).

132
Curriculum Vitae Jyoti Prakash Nayak S/O Mr. Aruna Kumar Nayak Village & PO-Bancho, Dist-Keonjhar, Odisha-758022 Phone No: +91 6612464208, +91 9437655102 E-mail: [email protected]
Date of Birth: 02.06.1975 Education: Ph. D. (Submitting), M. Tech. (Chemical Engg.), B.E. (Chemical Engg.) Research Interest: Rice Husk, Amorphous Nano Silica, Sol-Gel, Gelcasting,
Porous Ceramics, Bioceramics, Technical Exposure: Publication: 9, Conference: 07
Work Experience: (i) A Dissertation submitted in partial fulfillment of the requirements for the degree of Master of Technology “Effect of Fluidizing velocity in Tapered Fluidized Bed”.
(ii) Teaching faculty in Chemical Engineering Department, GIET Gunupur, Odisha.
Publications:
1) J.P. Nayak, J. Bera; “A simple method for production of humidity indicating silica gel from rice husk ash”; J. of Metals, Materials and Minerals; 19 (2009) 15-19.
2) J.P. Nayak, J. Bera; “Preparation of silica aerogel form rice husk ash by ambient pressure drying process using rice husk ash as raw material”; Trans. Ind. Ceram. Soc.; 68 (2009) 1-4.
3) J.P. Nayak, J. Bera; “Effect of sintering temperature on phase-formation behavior and mechanical properties of silica ceramics prepared from rice husk ash”; Phase Transitions; 82 (2009) 879-888.
4) J.P. Nayak, S. Kumar, J. Bera; “Sol-gel synthesis of bioglass-ceramics using rice husk ash as a source for silica and its characterization”; J. Non-Cryst. Solids; 356 (2010) 1447-1451.
5) J.P. Nayak, J. Bera; “Effect of sintering temperature on mechanical behaviour and bioactivity of sol-gel synthesized bioglass-ceramics using rice husk ash as a silica source”; Applied Surface Science, 257 (2010) 458-462.
6) J.P. Nayak, J. Bera; “In vitro bioactivity of amorphous silica ceramics derived from rice husk ash”; Silicon, DOI 10.1007/s12633-010-9058-3.
7) J.P. Nayak, J. Bera; “In vitro characterization of mesoporous silica aerogel monoliths prepared by ambient pressure drying process using rice husk ash”; (under review).
8) J.P. Nayak, J. Bera; “Mechanical and in vitro performance of amorphous silica based scaffolds prepared by polymer sponge replication technique”; (under review).
9) J.P. Nayak, J. Bera; “Low cost silica based porous bioceramics by gelcasting technique”; (Communicated).
Professional Membership: • Associate Membership: Indian Institute of Chemical Engineers (IIChE) [AM-5069].