DOCt NEST - ERIC · final sample consisted of 269 ... the wheel, and six hours of in-car...
111
,
Transcript of DOCt NEST - ERIC · final sample consisted of 269 ... the wheel, and six hours of in-car...

,

DOCt NEST REStED 032 973 RC 003 717
-By -Hall. CarrollA Study of the Effectiveness of Two Teaching Techniques in Driver Education Considering Ethnicity.Socioeconomic Status. and Sex as Contributing Sources of Variation.
Pub Date Sep 69Note -110p-EDRS Price MF-$0.50 HC-$5.60Descriptors -An9lo Americans. Comparative Analysis. *Driver Education, Educational Ouality. 'Ethnic Croliping.Instructional Programs. *Laboratory Procedures, Mexican Americans. Secondary School Students. SexDifferences. *Socioeconomic Status. *Teaching Methods
The use of 2 techniques for teaching the laboratory phase of a driver educationprogram is compared and analyzed with respect to the ethnic background (MexicanAmerican and Anglo). socioeconomic status. and sex differences of the students. Thefinal sample consisted of 269 students from 7 secondary schools in El Paso. Texas.The basic difference in the instructional methods used for comparison was theinclusion of a driver simulator in one method opposed to no simulator in the othermethod. The results of this study imply that there is no apparent difference in thequality of instruction between the teaching techniques. nor is there any advantage ofone treatment over the other when applied to a specific population. (Author/DB)
' ,

DEP1211411 Of WITH. Ca AMIN MKOffICI Of CLC!t2OI
DOCUIIII FIS IN TAPPODLIED EMILY IS InalYID HON la
MON 02 016INIZATICX POINTS Of YIIW ON OPINE
MID DO NOT 'Lassen' PIPITISINT Ofncut OINK: Of COWIN
POSITION OR POLICY.
A STUDY OF THE EFFECTIVENESS OF TWO TEACHING TECHNIQUES
IN DRIVER EDUCATION CONSIDERING ETHNICITY,
SOCIOECONOMIC STATUS, AND SEX AS
CONTRIBUTING SOURCES
OF VARIATION
BY
CARROLL HALL, B.S., M.A.
A Dissertation submitted to the Graduate School
in partial fulfillment of the requirements
for the Degree
Doctor of Education
Major Subject: Educational Research
Minor Subject: Statistics
New Mexico State University
Las Cruces, New Mexico
September 1969
i*CtD

"A Study of the Effectiveness of Two Teaching Techniques in Driver
Education Considering Ethnicity, Socioeconomic Status, and Sex As
Contributing Sources of Variation," a dissertation written by
Carroll Hall in partial fulfillment of the requirements for the
degree Doctor of Education, has been approved and accepted by the
fallowing:
Dean of the Graduate School
Chairman of the Examining committee
2 October 1969
Date

ACKNOWLEDGMENTS
The writer wishes to extend his sincere appreciation to the
entire graduate committee for their advice, assistance, and interest
throughout the preparation of this paper. Members of the committee
were: Dr. Everett Edington, advisor; Dr. Lloyd Cooper; Dr. Mcrris
Finkner; Dr. Donald Ferguson; Dr. Wesley Handy; and Dr. John Uxer.
The author is especially indebted to Dr. James D. McComas and
Dr. Darrell S. Willey for their encouragement in the pursuit of this
degree.
Appreciation is also extended to Mr. Marvin Reese, the Region
XIX Education Service Center Staff, and the Driver Education instruc-
tors in the El Paso Public Schools for their assistance in gathering
the data.
Special recognition is given to Mr. Richard Glaze for his help
in processing the data through the computer center, to Dr. Finkner
for his advice on the statistical design, and to Mrs. Marian E.
Baker for typing the manuscript.
The-most sincere gratitude is extended to my wife, Barbara,
for her patience, understanding, and encouragement, without which
this study would not have been possible.

VITA
David Carroll Hall, son of Everett and Oma Lee Hall, was born
November 1, 1933, in Amarillo, Texas. He attended Alanreed and
McLean, Texas, public schools and graduated from McLean High School
in 1951.
Mr. Hall was employed by the Santa Fe Railroad, Amarillo,
Texas, from 1951 through 1952. He then joined the United States
Navy and was released from active duty in September 1954.
He entered West Texas State University in 1954 and was gradu-
ated with a Bachelor of Science degree in Mathematics and Physics
in 1957.
He received his Master of Arts degree in Educational Adminis-
tration from New Mexico State University in 1967.
In 1957 he was employed by the Physical Science Laboratory,
New Mexico State University, as a physicist and computer programmer.
In 1966 he transferred to the Department of Educational Administra-
tion as Assistant Director, ERIC Clearing House on Rural Education
and Small Schools, the position he holds at the present time.
Mr. Hall was married on September 1, 1957, to Barbara Sue'
Fleming. They have three daughters, Lisa, Marcy, and Jill.
ABSTRACT
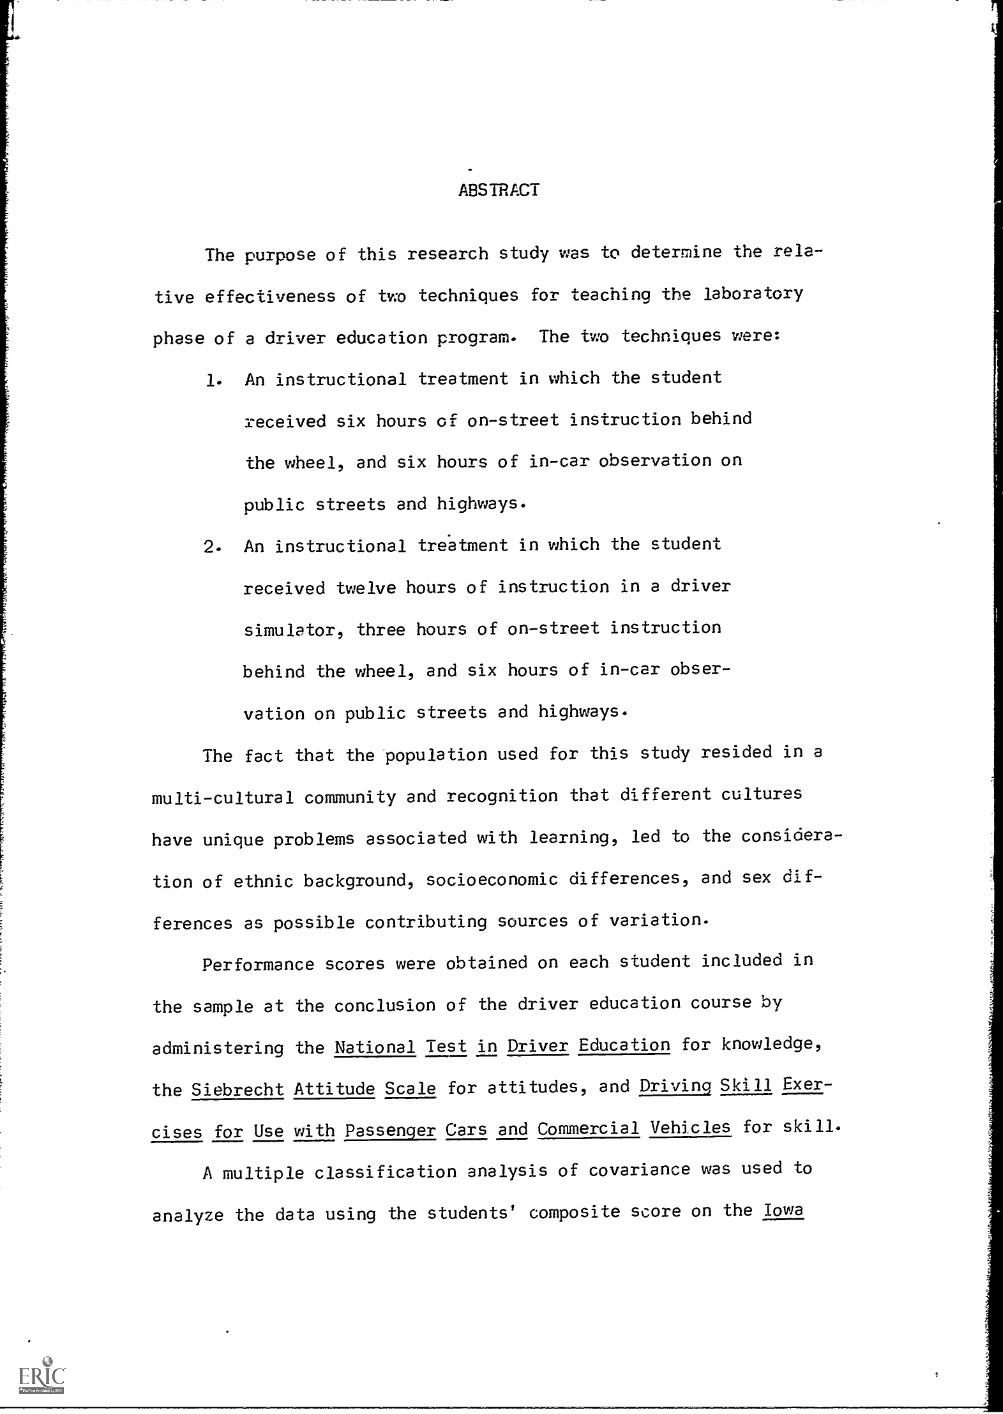
The purpose of this research study was to determine the rela-
tive effectiveness of two techniques for teaching the laboratory
phase of a driver education program. The two techniques were:
1. An instructional treatment in which the student
received six hours of on-street instruction behind
the wheel, and six hours of in-car observation on
public streets and highways.
2. An instructional treatment in which the student
received twelve hours of instruction in a driver
simulator, three hours of on-street instruction
behind the wheel, and six hours of in-car obser-
vation on public streets and highways.
The fact that the population used for this study resided in a
multi-cultural community and recognition that different cultures
have unique problems associated with learning, led to the considera-
tion of ethnic background, socioeconomic differences, and sex dif-
ferences as possible contributing sources of variation.
Performance scores were obtained on each student included in
the sample at the conclusion of the driver education course by
administering the National Test in Driver Education for knowledge,
the Siebrecht Attitude Scale for attitudes, and Driving Skill Exer-
cises for Use with Passenger Cars and Commercial Vehicles for skill.
A multiple classification analysis of covariance was used to
analyze the data using the students' composite score on the Iowa

Test of Educational Develocment as the covariate. The design of
the study was such that not only could the effects of each variable
(technique, ethnicity, socioeconomic status, and sex) be measured
directly, but interactions in all possible combinations could be
isolated.
Specific hypotheses to be tested were as follows:
1. There is no significant difference in mean scores
for post-course driver education performance, as
measured by knowledge, attitude, and skill scores,
between students taught by a simulator centered
course and students taught by a dual-control
car centered course after initial differences
between the two groups have been adjusted by
their composite score on the Iowa Test of Educa-
tiona 1 Development.
2. There is no significant difference in mean scores
for post-course driver education performance, as
measured by knowledge, attitude, and skill scores,
between Mexican-American and Anglo-American students
after initial differences between the two groups
have been adjusted by their composite score on the
Iowa Test of Educational Development.
3. There is no significant difference in mean scores
for post-course driver education performance, as
measured by knowledge, attitude, and skill scores

between male and female students after initial
differences between the two groups have been
adjusted by their composite score on the Iowa
Test of Educational Development.
4. There is no significant difference in mean scores
for post-course driver education performance, as
measured by knowledge, attitude, and skill scores,
between nondisadvantaged and disadvantaged students
after initial differences between the two groups
have been adjusted by their composite score on
the Iowa Test of Educational Development.
5. There is no significant first-order interaction
between method of instruction and sex, ethnicity,
and/or socioeconomic status with respect to driving
knowledge, attitude, and skill mean scores.
6. There is no significant first-order interaction
among all possible combinations of sex, ethnicity,
and socioeconomic status with respect to driving
knowledge, attitude, and skill mean scores.
The findings of the study indicated that:
1. There was no significant difference in the mean scores of
the students as measured by knowledge, attitude, and skill scores
for any of the independent variables (method of instruction,
ethnicity, socioeconomic status, or sex).

-......-=.....Mitgpr.eIMIN,
2. There was no significant interaction of the independent
variables, with the exception of the treatment by socioeconomic
combination for the attitude criterion. This interaction was
found to be significant at the 0.05 level but not at the 0.01
level.
The results of this study imply that there is no apparent
difference in the quality of instruction between the two teaching
techniques, nor is there any advantage of one treatment over the
other when applied to specific populations.

TABLE OF CONTENTS
CHAPTER PAGE
I. THE PROBLEM AND DEFINITIONS OF TERMS USED 1
The Problem 1
Statement of the problem 1
Purpose of the study 2
Objectives of the study 2
Assumptions . 4
Limitations 5
Definitions of Terms Used 6
Driver education, 6; Classroom instruction, 6;
Laboratory phase, 6; Driving simulator, 7;
Dual-control car centered course, 7; Simulator
centered course, 7; Treatment I, 7; Treat-
ment II, 7; Treatment III, 7; Disadvantaged, 8;
Nondisadvantaged, 8
Organization of the Study 8
II. REVIEW OF LITERATURE 9
Results of Related Research . .,., OOOOOO 9
Potential Sources of Variation 17
Ethnicity As a Source of Variation 18
Socioeconomic Status As a Source of Variation . 22
Sex As a Source of Variation 23
Summary 25
III. DESIGN OF THE STUDY 26
The Treatments 26
Testing Instruments 29

TABLE OF CONTENTS (continued)
CHAPTERPAGE
National Test in Driver Education 30
Siebrecht Attitude Scale30
Driving Skill Exercises for Use with Passenger
31Cars and Commercial Vehicles
The Sample32
Data Collection33
Hypotheses To Be Tested36
Statistical Treatment of the Data 37
IV. ANALYSIS AND INTERPRETATION OF THE DATA 42
Testing of Assumptions42
Discussion with Regard to Hypotheses Tested . 56
V. SUMMARY, CONCLUSIONS, AND RECOMMENDATIONS 70
Summary70
Conclusions74
Recommendations77
BIBLIOGRAPHY79
APPENDIX A. Ethnicity Questionnaire85
APPENDIX B. Testing Instruments87
APPENDIX C. Raw Score Means and Adjusted Means for
Criterion Variables91

LIST OF TABLES
TABLE PAGE
T. Sample Size and Treatment Assignment by School . . . 34
II. Analysis of Variance for Differences Among
Treatments on the Covariate: ITED Score 49
III. "F" Ratios for Homogeneity of Regression Test . . 50
IV. Significant "F" Values for Homogeneity of Variance
Test Using Hartley's Maximum "F" Test 55
V. Analysis of Variance on Variable No. 1 - Knowledge 58
VI. Analysis of Variance on Variable No. 2 - Attitude 59
VII. Analysis of Variance on Variable No. 3 Skill . 60
VIII. Analysis of Covariance on Variable No. 1
Knowledge Utilizing the ITED Composite Score as
a Covariate 62
IX. Analysis of Covariance on Variable No. 2 - Attitude
Utilizing the ITED Composite Score as a
Covariate 63
X. Analysis of Covariance on Variable No. 3 Skill
Utilizing the ITED Composite Score as a
Covariate 64
XI. Individual Comparison of Treatment by Socioeconomic
Status Means for Attitude Scores, Using Duncan's
Modified Multiple Range Test 66
XII. Raw Score Means and Least Squares Estimate of
Adjusted Means for Knowledge Criterion 92

LIST OF TABLES (continued)
TABLE
XIII. Raw Score Means and Least Squares Estimate of
Adjusted Means for Attitude Criterion
XIV. Raw Score Means and Least Squares Estimate of
Adjusted Means for Skill Criterion
XV. Raw Score Means and Least Squares Estimate of
Adjusted Means for Knowledge Criterion
XVI. Raw Score Means and Least Squares Estimate of
Adjusted Means for Attitude Criterion
XVII. Raw Score Means and Least Squares Estimate of
Adjusted Means for Skills Criterion
PAGE
93
94
95
96
97

LIST OF FIGURES
FIGUREPAGE
1. Frequency Table: Knowledge vs. ITED 44
2. Frequency Table: Attitude vs. ITED 45
3. Frequency Table: Skill vs. ITED 46
4. Frequency Chart of Knowledge Scores 52
5. Frequency Chart of Attitude Scores 53
6. Frequency Chart of Skill Scores 54

CHAPTER I
THE PROBLEM AND DEFINITIONS OF TERMS USED
I. THE PROBLEM
In attempting to provide equal educational opportunities for
all students, the school administrator must explore every possi-
bility for improving educational opportunities. Utilization of
most appropriate teaching techniques is one area in which improve-
ment may be gained. Evaluation of the relative effectiveness of
different teaching techniques in specific courses enables the
administrator to more rationally choose the technique best suited
for the population under study. The evaluation process should
take into consideration the possibility of extraneous variables
contributing to and/or interacting in such a manner as to obscure
the true effects of the treatments under study.
Statement of the problem. It has been found that driver and
traffic safety education courses can meet a special need of society
and at the same time assist the secondary school systems in meeting
their general objectives. It is believed that
. . effective driver education courses will develop
the essential knowledge, correct habits, fundamental
skills, proper attitudes and sound understanding neces-
sary for the safe use of our highway transportation
system.1
'Association of Casualty and Surety Companies,
vention Department, What Everyone Should Know About
Driver Education (New York: The Association, 1959),
AccidentSchool
3.

School administrators, when faced with a shortage of qualified
instructors, increased operational costs, and tighter budgets, look
toward innovative instructional techniques that will attempt to
alleviate these problems and concurrently maintain quality instruc-
tion. Prior to adoption of any new technique, however, an exhaus-
tive study must be made of the relative effectiveness of the
proposed technique as compared with the technique currently in use.
This study was conducted to help determine if there were dif-
ferences between two separate teaching methods presently used in
the El Paso, Texas, Public School System for teaching the laboratory
phase of the driver education program. Included in the evaluation
was the determination of the effects of cultural, sociological, and
sex differences when considered as possible factors contributing to
variations in achievement.
Purpose of the study. The purpose of this study was to deter-
mine the relative effectiveness of a simulator centered teaching
technique and a dual-control car centered teaching technique used
in the laboratory phase of driver education programs as measured
by knowledge, attitude, and skill scores. Ethnicity, sex, and
socioeconomic status were considered as additional contributing
sources of variation.
Objectives of the study. The major objective of this study
was to determine if a simulator centered technique for teaching
the laboratory phase of a driver education program was significantly

3
different from the traditional method currently in use in the El
Paso Public Schools. In order to adequately evaluate the tm
methods, the following specific questions had to be answered:
1. Will the driving knowledge, attitudes, and skills
of students taught by a simulator centered course
differ significantly from the driving knowledge,
attitudes, and skills of students taught by a dual-
control car centered course?
2. Will the driving knowledge, attitudes, and skills
of Mexican-American students differ significantly
from the driving knowledge, attitudes, and skills
of Anglo-American students?
3. Will the driving knowledge, attitudes, and skills
of male students differ significantly from the
driving knowledge, attitudes, and skills of female
students?
4. Will the driving knowledge, attitudes, and skills
of nondisadvantaged students differ significantly
from the driving knowledge, attitudes, and skills
of disadvantaged students?
5. Will the method of instruction indicate significant
first-order interactions with sex, ethnicity, and/or
socioeconomic status with respect to driving knowl-
edge; attitudes, and skills?

4
6. Will sex, ethnicity, and socioeconomic status, in
all combinations, indicate significant first-order
interactions with respect to driving knowledge,
attitudes, and skills?
7. Will the driving knowledge, attitudes, and skills
of Mexican-American students taught by a simulator
centered course in Spanish differ significantly from
the driving knowledge, attitudes, and skills of
Mexican-American students taught by a simulator
centered course in English?
Assumptions. In the course of this investigation the follow-
ing assumptions were made:
1. It was possible to identify the ethnicity of the
student by a combination of surname, identification
by the instructor, and response to a questionnaire.
2. The translation of the narration that accompanies
the instructional films used in the driver simulator
from English to Spanish was in a form and style fully
understood by the sample to whom it was administered.
3. The socioeconomic classification of disadvantaged or
nondisadvantaged could be determined by analysis of
the records of the school counselor in conjunction
with the judgment of the counselor.
4. The Iowa Test of Educational Development is a valid
measure of student achievement, is highly correlated

5
with the dependent variables knowledge, attitudes,
and skills, and is not affected by the treatment
factors.
5. The National Test in Driver Education, the Seibrecht
Attitude Scale, and Driving Skill Exercises for Use
with Passenger Cars and Commercial Vehicles are valid
measures of knowledge, attitudes, and skills respec-
tively of the driving task.
6. The students enrolled in the driver education pro-
gram for the spring semester, 1969, were representative
of the students who will enroll in the course in the
future.
7. The samples selected from Austin and Coronado high
schools, although not "randomly" assigned to instruc-
tional methods, would not seriously depart from the
assumption of random selection necessary for the
analysis.
Limitations. This study was limited to the following secon-
dary schools in the El Paso, Texas, Public School System: Austin,
Bowie, Coronado, El Paso High, El Paso Technical, Irvin, and Jef-
ferson. Any inferences drawn from the results of this study should
be confined to the population from which the sample was taken and
other populations with similar characteristics.
The possibility of differences in achievement due to differ-
ences in order of presentation of classroom instruction and the

6
laboratory phase is recognized as a limitation that could affect
the results of the experiment. McIntosh found, however, that
order of presentation does not significantly affect performance
in high school driver education courses.2
II. DEFINITIONS OF TERMS
The following definitions are applicable to this study:
Driver education. This term refers only to those aspects
of driver and traffic safety education formally taught as a
regular part of the scheduled driver education classes. This
consists of two parts--classroom instruction and a laboratory
phase for practice driving.
Classroom instruction. This refers to that part of the
driver education program that is conducted in the high school
classroom. Instruction covers such content areas as character-
istics of drivers, traffic citizenship, laws and regulations,
physical laws, and use of the automobile.
Laboratory phase. This refers to that part of the driver
education program in which the student receives training in real
and/or simulated automobiles. This phase of the course is designed
to develop skill in the manipulation of an automobile, as well as
2Edward Roy McIntosh, "A Study of the Efficiency and Effec-tiveness of Four Different Modes of Instruction in ProvidingLearning Experiences for High School Driver Education Students"
(unpublished Doctoral dissertation, Michigan State University,
East Lansing, 1967), p. 90.

7
to increase the student's knowledge and develop proper attitudes
toward traffic safety.
Driving simulator. This is an electro-mechanical device
designed to represent the driver's side of an automobile. The
student operates the device as he would a real car, reacting to
varying traffic situations that are projected on a screen at the
front of the classroom by means of full-color motion pictures
complete with sound.
Dual-control car centered course. This refers to an instruc-
tional treatment consisting of (1) thirty hours of classroom
instruction, and (2) six hours of on-street instruction behind-
the-wheel, plus six hours of in-car observation.
Simulator centered course. This instructional treatment con-
sists of (1) thirty hours of classroom instruction; (2) twelve
hours of instruction in a driver simulator; and (3) three hours of
on-street instruction behind-the-wheel, plus six hours of in-car
observation.
Treatment I. This refers to the laboratory phase only of the
dual-control car centered course in the teaching of driver educa-
tion.
Treatment II. This refers to the laboratory phase only of the
simulator centered course in the teaching of driver education.
Treatment III. This refers to the laboratory phase of the
simulator centered course that has been modified to the extent that
the narration accompanying the instructional films used in conjunc-
tion with the simulator has been translated into Spanish.

Disadvantaged. This term refers to those students from
families whose combined annual income does not exceed $3,000.3
Nondisadvantaged. This refers to those students who do not
meet the criteria for classification disadvantaged as deiined
previously.
III. ORGANIZATION OF THE STUDY
Chapter II contains a review of related literature and research.
Chapter III consists of the design of the study, hypotheses to be
tested, description of the treatments administered, methods of sam-
pling, measuring instruments and the statistical treatment applied
to the data. The findings of the study, including presentation and
analysis, are presented in Chapter IV. Chapter V contains a summary
of the study, interpretations and conclusions drawn from the analyses,
and recommendations for further research.
3John F. Hughes (director), Title I Program Guide No. 36,
United States Department of Health. Education and Welfare, Division
of Compensatory Education (Washington: Government Printing Office
1968), p. 2.
8

9
CHAPTER II
REVIEW OF LITERATURE
This chapter is divided into two sections. The first section
is concerned with the results of previous research and a rationale
for conducting the study. Section two justifies the consideration
of additional variables as possible contributing sources of varia-
tion.
I. RESULTS OF RELATED RESEARCH
Numerous studies to investigate the usefulness of driver
instruction have been carried on by schools, universities, insur-
ance companies, and traffic enforcement agencies. Evidence con-
tained in a report by the National Commission on Safety Education
emphasized the extreme difficulty of scientifically measuring so
complex and complicated a phenomenon as driving behavior. It did
point out, however, that indulging in a traffic safety program
does reduce accidents.1
Results of a study by Doss indicated that
students who take driver education are more informed about driving
practices and principles and seem to possess a more favorable atti-
tude toward safe driving practices.2
The most convincing proof of
1National Commission on Safety Education, A Critical Analysis
of Driver Education Research (Washington: National Education Asso-
ciation, 1957), p. 56.
2James Karl Doss, "A Study of the Value of Driver Education"
(unpublished Doctoral dissertation, Oklahoma State University,
Stillwater, 1964).

10
the effectiveness of driver education programs has come from the
insurance companies, most of which grant discounts to drivers,
fifteen to twenty years old, who have passed a driver education
course meeting national standards.3
Sthool systems, in which driver education has been accepted
as meeting a special need of the student while assisting in attain-
ing the overall general objectives of the school, are faced with
many problems. Increased enrollment, shortage of qualified instruc-
tors, high per-pupil cost of instruction, scheduling difficulties,
and individual differences in student characteristics, have forced
the school administrator to seek new solutions to alleviate these
problems and still provide assurance of quality instruction in the
area of driver education.
The "one-car-one-teacher" approach in the traditional labora-
tory phase of the driver education program has proved to be success-
ful in small schools and in larger schools with limited enrollment,
but has intensified the previously stated problems in schools in
which the demand for participation in the course exceeds the capa-
bilities of the school system. As a result, school administrators
are considering the use of different teaching techniques, such as
driver simulators, as solutions to the problems associated with the
laboratory phase.
3Paul W. Kearney, Why Driver Education Is a Must (Reader's
Digest reprint, "Why Driver Education Is a Must," October, 1964,
from Parents' Magazine. Pleasantville, New York: Reader's Digest
Association, Inc., 1964).

Simulation is a technique for studying and actively partici-
pating in complex, real-life phenomena in a controlled environment.
The technique consists of designing a representative model of the
subject of interest, manipulating various aspects and variables of
the model according to some predetermined plan, and evaluating the
outcome according to predetermined criteria. A basic assumption
is that the knowledge and experience gained will be applicable to
the real-life situation.
The driver education simulator is an electro-mechanical device,
designed to represent as closely as possiblo the driver's side of
an automobile. This device provides practice situations under test
conditions which can be used to develop among students those abili-
ties that are considered essential to safe and responsible driving.
In principle these devices are similar to those used to train
pilots and more recently those used to train astronauts. The stu-
dent operates the device just as he would a real car on the highway.
Realistic traffic situations are projected on a wide screen film
and the student's reactions to these situations are electronically
measured and evaluated. Manual skills can be taught without films
such as starting the engine, shifting gears, and so forth. These
simulator units can either be placed in a classroom or in a van to
be transported from school to school.
The value of film demonstration as an auxiliary teaching device
has been well documented. Allen, in reviewing film research, con-
cluded that learner participation during a film and immediate
11

12
knowledge of results facilitate learning.4
Fletcher, in a study
concerning the effectiveness of film demonstrations, concluded
that film demonstration could be substituted for the live demon-
stration in the development of driving skills without disadvantage
to the student.5
It should be emphasized that the simulator-based method of
instruction in driver education is an integrated course. Both
verbal and nonverbal means of communication are utilized. Certain
kinds of devices are more effective than others in teaching cer-
tain subject matter under certain conditions. For example, the
Educational Policies Commission pointed out that film was frequently
better for teaching material that involved demonstrations, while
printed or verbal descriptions were more efficient for presenting
6concepts. A logical conclusion is that a variety of methods may
be more effective than a single method.
Several advantages have been stated as being the direct result
of utilizing synthetic training devices in driver education.7
4William H. Allen, "Audio-Visual Communication,' Encycicpediaof Educational Research (3rd ed. New York: The Macmillan Company,
1960), p. 125.
5Harry David Fletcher, "Instruction by Film Demonstrations andLive Demonstrations in the Teaching of Selected Automobile DrivingSkills" (unpublished Doctoral dissertation, Pennsylvania State Uni-versity, University Park, 1965).
6Educational Policies Commission, Mass Communication and Edu-cation (Washington: National Education Association, 1958), p. 91.
7James H. Fox, Driver Education and Driving Simulators,National Commission of Safety Education, National Education Asso-ciation (Washington: National Education Association, 1960), p. 1.

13
Among these are:
1. A larger number of students can receive the benefits
of the program than is possible when the devices are
not used.
2. The per-pupil cost of instruction can be substantially
reduced.
3. Fewer teachers are needed.
4. Students can learn the necessary complex skills as
effectively as in the dual-control car.
5. Students can develop better attitudes.
6. Students can learn appropriate responses to emergency
situations without the attendant hazards of actually
being in a car on the road.
7. Electric scoring devices can provide for the imme-
diate detection of student errors by the teacher.
Boyer concluded that the greatest value of a simulator is
that it is a catalyst to both classroom instruction and practice,
driving. It offers the student the opportunity to analyze, prac-
tice, and interpret.8
Perhaps the most appealing aspect of utilizing simulation
techniques in the training of driver education classes is the
reduction in per-pupil cost of the laboratory phase of the pro-
gram. Many claims have been made of tremendous savings when
8Richard Boyer, "Simulator Presents, Student Responds, andInstructor Evaluates," Traffic Digest and Review (reprint. Evan-
stan, Illinois: Northwestern University, February, 1964).

14
utilizing simulators, but in a given school system there are many
factors which determine the actual cost. Differences in teacher
salaries, insurance rates, leasing arrangements for equipment,
capacity of equipment, etc. are all factors that contribute to
the cost of the overall program. Studies conducted at Cedar
Falls, Iowa,9Los Angeles, California,
10Houston, Texas,
11and
El Paso,. Texas,12
all indicate significant savings but varying
in the per-pupil amount.
The reported advantages of utilizing simulation as a training
technique have not led to universal acceptance at this time. More
research is needed concerning the quality of this instructional
device.
Previous research has considered, for the most part, only the
evaluation of the treatments under study with very little effort
made to control for other possible sources of variation. Many of
9Gordon J. Rhum, Bertram J. Woodcock, and Tom A. Lemke, TheEffectiveness of the Aetna Drivotrainer in Driver Education (CedarFalls, Iowa: Iowa State Teachers College, July, 1956).
10Los Angeles City Schools, An Evaluation of the TeachingEffectiveness of the Aetna Drivotrainer (Los Angeles: Los AngelesCity Schools, 1955) -
11Everett J. Lanik, "Cost Analysis of Driver Education Pro-grams Conducted in the Houston Independent School District for theSchool Year 1967-1968, Summer 1968" (Houston, Texas: Houston Inde-pendent School District, 1968). (Mimeographed.)
12David C. Hall, "A Cost Analysis of a Driver Education Pro-gram" (paper prepared for the Region XIX Education Service Center,El Paso, Texas, February, 1969).

15
these studies have resulted in "no significant differences found
in treatment means."
When substituting nine hours on the simulator for three hours
behind-the-wheel instruction, Curtis found no significant differ-
ences between performances, as measured by knowledge, skill, and
attitude, of the experimental group and a similar group receiving
the traditional six hours behind the wheel.13
Two studies con-
ducted at Michigan State University were of a slightly different
design- Gustafson compared the effectiveness of a program using
a simulator plus the range with a program utilizing the range
alone. la Nolan compared the teaching effectiveness of the multiple-
car range with that of the simulator.15
While each drew a number of
conclusions, in general the differences in the performance of the
groups were not significant.
Bishop, in substituting twelve hours of simulator training
for three of the six hours behind the wheel, found a significant
increase in driving knowledge in favor of the simulator, but no
significant differences in attitude scores or skill scores. He
13Carroll A. Curtis and Robert B. Hayes, "Immediate LearningReinforcement in a Complex Mental-Motor Skill," Driver TrainingUsing Motion Pictures, Phase III (final report. Harrisburg, Penn-
sylvania: Department of Public Instruction, March, 1967).
14Robert E. Gustafson, "A Study to Compare the Effectivenessof Instruction in the Allstate Good Driver Trainer and in the
Multiple-Car Off-Street Driving Range "(unpublished Doctoral dis-
sertation, Michigan State University, East Lansing, 1965).
15R. O. Nolan, "A Comparative Study of the Teaching Effective-ness of the Multiple-Car Off-Street Range and the Aetna Drivotrainer"
(unpublished Doctoral dissertation, Michigan State University, East
Lansing, 1965).

16
concluded that the simulator centered course compared favorably
with the traditional course. 16
In 1966, Seals reported significant differences were found
when comparing a four-phase program consisting of classroom
instruction, simulation, driving range, and in-car experience
with a similar program excluding the simulation phase.17
Sig-
nificant differences were also detected by Board in a longitudinal
study conducted in the Houston Independent School District in
which comparisons were made between the traditional program and
a program composed of thirty hours classroom instruction, twelve
hours simulation, and three hours behind the wheel.18
The conclusion of "no significant differences" found in most
studies prior to 1966 may be explained by the lack of control in
the experimental design, or the instruments used for testing these
differences may have been too weak to properly identify existing
differences. It is interesting to note that as the designs become
16Richard W. Bishop, Evaluating Simulator Instruction forAccomplishing Driver Education Objectives (Tallahassee, Florida:Florida Institute for Continuing University Studies, 1963).
17Thomas A. Seals, "An Evaluation of Selected Driver and Traf-fic Safety Education Courses" (unpublished Doctoral dissertation,Florida State University, Tallahassee, 1966).
18Donald M. Board, "Fall Term, 1965-1966" (Report No. 1 ofDriver Education Research Project, Houston Independent SchoolDistrict, 1966); "Final Report of Instructional Program" (ReportNo. 2 of Driver Education Research Project, Houston IndependentSchool District, 1966); and "Driver Performance Analysis" (ReportNo. 3 of Driver Education Research Project, Houston IndependentSchool District, 1967).

17
more sophisticated, more significant relationships are noted that
tend to show strengths and weaknesses in specific component-areas
of the driving task. As more variables are identified and con-
trolled in analyzing the performance, a better judgment can be
made by the administrator as to where and what form of instruction
will produce results commensurate with the objectives of the pro-
gram. A note of caution was injected by Bishop, however, when
he stated:
The potential of simulator instruction with respectto knowledge and skill (including perceptual skill andjudgment) appears highly promising. The word "potential"is emphasized since regardless of teaching method, theteacher is still the key to effectiveness. This state-ment applies to either simulator or behind-the-wheelinstruction.19
II. POTENTIAL SOURCES OF VARIATION
The fact that the population used for this study resided in
a multi-cultural community and the recognition that different cul-
tures have unique problems associated with learning led to the
consideration of other variables as sources of variation in this
evaluation. Ethnic background, socioeconomic differences, and sex
differences which have been shown to be correlated with achieve-
ment were considered as possible additional sources of variation.
It is understood that the possibility exists of other variables
affecting performance, but it was felt that these three were the
most relevant to the problem at hand.
19Bishop, 22. cit., p. 14.

18
Ethnicity As a Source of Variation
Administrative decisions to include, omit, or modify innova-
tive instructional techniques in school systems in which a diverse
ethnic school population is enrolled are often complicated by the
fact that the assessment of such techniques does not take problems
inherent with ethnic minority groups into consideration. Differ- .
ences in language ability, economic level, and cultural values
tend to intensify the problem of communication.20
It has been
suggested by the Educational Policies Commission of the National
Education Association that educational programs that are specifi-
cally directed at better use of communication techniques could
sharply improve the total intellectual growth of the student.21
Upshur alluded to the need for developing measures of non-
linguistic communication and interaction and the need for a theory
of the processes underlying effective communication in a foreign
culture. However, any teaching materials must be presented within
an educational pattern familiar or at least understandable to the
reader, while employing verbal or visual devices necessary to make
comprehensible the concepts selected for teaching. The illustra-
tions, examples, and vocabulary utilized must be understood in
20Hershel T. Manuel, Spanish-Speaking Children of the South-
west (Austin: University of Texas Press, 1965), p. 187.
21Educational Policies Commission, Mass Communication and
Education (Washington: National Education Association, 1958),
p. 85.

the student's real experience. The implication is that learning
becomes a meaningful experience only when communication, both
22
verbal and nonverbal, is complete.
Of the minority ethnic groups in the United States, one of
the largest is the Spanish-speaking group, with approximately 80
per cent residing in the Southwest.23 Although points of origin
are distinctly different for the Mexican-American and Spanish-
American, these are considered as one category. A similarity of
language and culture permits a generalization despite the tendency
to overgeneralize either the educational program or the Mexican-
American. Attention must be focused on specific programs for
specific groups of Mexican-Americansbecause the wide range of
residency in the United States and the diversity in acculturation
result in great differences in the value systems of specific
groups.
In 1965 the National Education Association Survey Team found
that "the most acute educational problem in the Southwest is that
which involves Mexican-American children."24
The survey included
22j. A. Upshur, "Cross-CulturalTesting--What to Test,"
Language Learning, A Journal of Applied Linguistics, 16(3-4):183,
1966.
23James G. Anderson and William H. Johnson, "Sociocultural
Determinates of Achievement Among Mexican-American Students" (An
Interim Report of the Mathematics Education Program Prepared for
the National Conference of Educational Opportunities for Mexican-
Americans. Austin, Texas, April 25-26, 1968), p. 1.
24National Education Association, The Invisible Minority
(Report of the NEA Tucson Survey on the Teaching of Spanish to the
Spanish-Speaking. Washington: National Education Association, 1966),
p. 5.
19

20
approximately 1.75 million children with Spanish surnames in the
elementary and secondary schools of five states. Since Mexican-
Americans, like most minority jroups, tend to live in clusters,
it is not uncommon to find schools which are predominately of one
ethnic background, especially noticeable in border towns and
cities, such as El Paso, Texas.25
Recognition of the problems
associated with the education of these children has resulted in
teachers' workshops, institutes, and special local programs.26
It is apparent that an educational gap does exist between
Mexican-Americans and Anglo-Americans, especially at the high
school level, according to Grebler. He reported that some progress
has been made in decreasing this gap at the lower levels, but that
27the gap becomes increasingly wider at secondary levels. Chil-
dren enter school and immediately encounter a language barrier;
they spend all their efforts learning the language rather than
the subject matter; they have no dominant cultural values; and
their vocabulary is small and localized.28
Coleman found that
the Mexican-American performs consistently lower in both verbal
25Anderson and Johnson, loc. cit.
26National Education Association, 22 cit., p. 26.
27Leo 3rebler, The Schooling Gap: Signs of Progress (Advance
Report No. 7 of the Mexican-American Study Project, Graduate School
of Business Administration, University of California, Los Angeles,
1967).
28Dr. John M. Sharp, Professor of Modern Languages at theUniversity of Texas at El Paso, personal interview, May, 1969,
at the University of Texas at El Paso.

21
and nonverbal scores than the Anglo-American and that the differ-
ence is greater at grade twelve than at the first grade, thus
supporting Grebler's thesis that the educational gap increases by
levels.29
Use of simulator instruction in drier and safety education
has been subject to considerable investigation.30
It appears,
however, that information is lacking on the effect of this par-
ticular instructional technique on students from a minority ethnic
background. New methods of instruction, including driver educa-
tion simulator techniques, are, of course, not confined to utiliza-
tion by a single cultural or ethnic group; this has been the case
in the past and will continue so in the future. Yet, by focusing
upon possible differences between Mexican-American and Anglo-
American student performances in driver education programs, this
study may provide educators with insights and information that will
permit decisions to be made about the initiation and modification
of differing teaching techniques in a more rational manner.
29James S. Coleman et al., Equality of Educational Opportunity,United States Department of Health, Education and Welfare (Washing-ton: Government Printing Office, 1966)-, p. 20.
Thames H. Fox, Driver Education and Driving Simulators,National Commission of Safety Education, National Education Asso-ciation (Washington: National Education Association, 1960);David C. Hall, "A Cost Analysis of a Driver Education Program"(paper prepared for the Region XIX Education Service Center, ElPaso, Texas, February, 1969); Richard W. Bishop, Evaluating Simula-tor Instruction for Accomplishing Driver Education Objectives (Talla-hassee: Florida Institute for Continuing University Studies, 1963);and Thome.; A. Seals, "An Evaluation of Selected Driver and TrafficSafety Education Courses" (unpublished Doctoral dissertation, FloridaS tate University, Tallahassee, 1966).

Socioeconomic Status As a Source of Variation
Differences in socioeconomic status have long been known to
contribute to variability in academic performance. Studies by Noll,
Knief and Stroud,32
and Friedhofr33 have all shown socioeconomic,
status to be directly related to academic performance. Lavin
stated, "SES is a significant variable in the study of performance
because it summarizes systematic variations in attitudes, motiva-
tions, and value systems that are related to such performance..34
Students from different socioeconomic backgrounds face dif-
ferent kinds of life situations and may develop different altitudes
and values toward curriculum offerings. For example, their atti-
tude toward the use of an automobile in the home situation may
affect motives for achievement in the driving task.
Little research has been done considering socioeconomic status
as a contributing variable in driver education achievement. Mariani
found no significant relationships between driver education
31Victor H. Noll, "Relation of Scores on Davis -Fells Games
to Socioeconomic Status, Intelligence Test Results, and School
Achievement," Educational and Psychological Measurement, 20(1):
119-29, 1960.
32Lotus M. Knief and James B. Stroud, "Intercorrelations Among
Various Intelligence, Achievement and Social Class Scores," Journal
of Educational Psychology, 50(3):117-20, 1959.
33W. H. Friedhoff, "Relationships Among Various Measures of
Socioeconomic Status, Social Class Identification, Intelligence and
School Achievement," Dissertation Abstracts, 15;2098, 1955.
34David E. Lavin, The Prediction of Academic Performance (New
York: Russell Sage Foundation, 1965), p. 128.
22
31

21
performance and home location--a measure of socioeconomic status.35
Gutshall showed that socioeconomic status is useful in predicting
the habits of future drivers. In this study it was found that
socioeconomic status tended to predict the number of violations a
person would receive for speeding.36
These studies do not, however, consider the effect of socio-
economic status when interacting with other variables, such as
different methods of instruction, ethnicity, and sex. The present
study was designed to investigate these relationships.
Sex As a Source of Variation
There is a significant amount of reliable research about sex
differences, as they affect one's learning and achievement, avail-
able to the educator.37
Grambs and Waltjen, in reviewing this
research, stated: "It makes a significant difference whether the
person we are teaching is a boy pupil or a girl pupil and . .
instructional provisions should be made accordingly." 38
35Thomas J. Mariani, "The Effectiveness of Three Methods ofPractice Driving Instruction in Driver Education," DissertationAbstracts, 25:3439, 1965.
36Robert William Gutshall, "An Exploratory Study of the Inter-relations Among Driving Ability9 Driving Exposure and SocioeconomicStatus of Low, Average and High Intelligence Males" (unpublished
Doctoral dissertation, Michigan State University, East Lansing,
1967).
37Eleanor Maccoby (ed.), The Development of Sex Differences(Stanford, California: Stanford University Press, 1966), pp. 25-55.
38Jean D. Grambs and Walter B. Waltjen, "Being Equally Dif-
ferent: A New Right for Boys and Girls," National ElementaryPrincipal, 46(2):60, November, 1966.

24
Studies conducted on performance in driver education programs
between boys and girls are not conclusive. Board found that boys
outperformed girls in all areas of the driving task.39
Nolan
found that boys outperformed girls in knowledge and skills but
that there was no difference in attitudes.40
Rhum, Woodcock, and Lemke found, however, that performance on
the test instruments for measuring knowledge, attitudes, and skills
was not related to sex. They did indicate that additional research
should be made before their findings could be generalized.41
Lam-
kin implied that the need exists for greater understanding of the
nature of sex differences.42
Interviews by this investigator with driver educatiOn instruc-
tors in the El Paso Public School System revealed that in their
opinion female Mexican-Americans were superior to male Mexican-
Americans in driving skills after training. This would indicate
3 °-Donald M. Board, "Final Report of Instructional Program"
(Report No. 2 of Driver Education Research Project, Houston Inde-
pendent School District, 1966), pp. 3-4.
40R. O. Nolan, "A Comparative Study of the Teaching Effective-
ness of the Multiple-Car Off-Street Range and the Aetna Drivotrainer"
(unpublished Doctoral dissertation, Michigan State University, East
Lansing, 1965), p. 209-
41Gordon J. Rhum, Bertram J. Woodcock, and Tom A. Lamke, The
Effectiveness of the Aetna Drivotrainer in Driver Education (Cedar
Falls, Iowa: Iowa State Teachers College, July, 1956), p. 17.
42F. D. Lamkin, "A Personality Variable of Pre-adolescent
Youth in Relation to the Elementary School Program" (Final Report,
Virginia University, Charlottesville, School of Education, 1967),
p. 3.

25
that more research is needed concerning the effect of sex in driver
education programs when correlated with the ethnicity of the stu-
dent.
This study was designed to determine if sex differences do in
fact contribute to achievement performance variability within the
population under study for the psycho-motor task of driving.
III. SUMMARY
The need for evaluating different teaching techniques in the
area of driver education in order to decrease costs, increase effi-
ciency, and maintain quality instruction is quite clear. The possi-
bility that extraneous variables such as ethnicity, socioeconomic
status, and sex may seriously affect the evaluation process has
been mentioned. The design of this study was such that not only
could the effects of each variable be measured directly but inter-
actions in all possible combinations of the variables could be
isolated. This study was also unique in that the statistical
approach controlled for initial differences statistically rather
than experimentally. An actual classroom was the setting for the
study. By combining the results of this study with previous research,
administrators in school systems with similar characteristics will
have a more rational basis to make decisions upon in selecting and/or
modifying driver education curricula.

26
CHAPTER III
DESIGN OF THE STUDY
The purpose of this study was to compare the relative effec-
tiveness of differing techniques for teaching the laboratory phase
of a driver education program. In this chapter are described the
treatments used, hypotheses to be tested, instruments used to
obtain data, the sample, procedures used in collecting the data,
and the statistical tools utilized in analyzing the data.
I. THE TREATMENTS
This study was based upon a comparison of an experimental pro-
gram for teaching the laboratory phase of a driver education program
conducted by the Region XIX Education Service Center, El Paso, Texas,
in cooperation with the El Paso Public School Officials and a tradi-
tional,approach to teaching the laboratory phase conducted by the
regular school staff. The approaches differed in that one utilized
an automated innovation which altered the amount of time spent with
the student by the instructor on a one-to-one basis. These programs
are described below.
Treatment I was the traditional approach which has been referred
to as the "dual-control car centered course." As stated previously,
the laboratory phase is designed to develop skill in the manipula-
tion of an automobile, as well as to increase the student's knowledge
and develop proper attitudes towards traffic safety. Standards for

27
an approved Course in Driver Education, following the traditional
approach, consist of the following:
Thirty clock hours of classroom instruction inaddition to laboratory experience consisting of: sixclock hours of in-car instruction on public streets andhighways, and six clock hours in-car observation on pub-lic streets and highways.
Treatment II was the experimental program conducted by the
Region XIX Education Service Center, El Paso, Texas. Under a grant
from the Texas Education Agency, the Center purchased a 16-place
Link Driving Simulator housed in a mobile trailer. The simulator
was operated by staff from the Service Center and was moved from
school to school as the schedule permitted. Utilization of simu-
lation equipment in the teaching of the laboratory phase of driver
education programs has been approved by the Texas State Board of
Education. Specific guidelines for curricular offerings are out-
lined in Standards for an Approved Course in Driver Education for
Texas Schools. These are:
. . Thirty clock hours of classroom instruction inaddition to laboratory experience consisting of: twelveclock hours of in-car instruction, and six clock hours ofin-car observation. (Simulator systems must meet thespecifications for "State of Texas Automobile Simulatorand Trailer Specifications. ")2
Treatment III was to have been an extension of treatment II
in that a comparison was to be made between two differing methods
'Texas Education Agency, Standards for an Approved Course in
Driver Education for Texas Schools (Bulletin 615. Austin: TheAgency, 1961), p. 2.
2lbid., p. 4.

28
of teaching the laboratory phase of the driver education program;
both utilizing the driving simulator with one major difference.
One class was to receive instruction with the instructional films
that are used with the simulator having been translated into
Spanish, the other group receiving the instruction in English.
The translation was made by a simulator instructor on the Educa-
tion Service Center staff. The staff member was a native of El
Paso and consequently the translation was in a form understandable
to the sample under study. This treatment was applied to a sample
of students from two high schools, the majority of whom were
Spanish-speaking. Some difficulty was experienced early in the
program in that the instructor using the Spanish version of the
films felt that the students were not benefiting from the instruc-
tion as they should due to the inability of some to hear the trans-
lation. This problem was alleviated somewhat by rearranging the
speakers in the simulator van. A check by this writer some two
weeks later revealed that the instructor had reverted to the English
version the week after rearranging the speakers. In the instructor's
opinion, the students were still having difficulty in understanding
the narration because of the quality of the equipment. There was
no alternative but to discard this phase of the study. This would
indicate that, if a further study were to be made using this approach,
the translation should be accomplished in a more professional manner
and pilot tested before implementation.

29
TT. TESTING INSTRUMENTS
Effective driver education courses are believed to be useful
for developing the essential knowledge, fundamental skills, and
proper attitudes necessary for the safe use of automobiles on the
streets and highways. The selection of instruments to measure per-
formance in each of these component areas is of utmost importance.
The selection of instruments for this study was based on the find-
ings of Long.3
This study was designed to select the instruments
most applicable -co driver education programs in the state of Texas.
Validity, reliability, objectivity, areas of competencies, time
needed to administer the test, and the feasibility of administering
the tests were among the factors considered before recommending
specific tests. Recommended tests were National Test in Driver
Education4to evaluate student competencies regarding knowledge;
Siebrecht Attitude Scale5
for evaluating student competencies regard-
ing attitudes; Driving Skill Exercises for Use with Passenger Cars
and Commercial Vehicles6 to evaluate competencies regarding driving
skills.
3Teresa Lozano Long, "Development of Instruments for the Evalua-
tion of Driver Education" (unpublished Doctoral dissertation, Univer-
sity of Texas, Austin, 1965).
4Center for Safety Education, National Test in Driver Education
(New York: New York University, 1963).
5E. B. Siebrecht, Siebrecht Attitude Scale (New York: Center for
Safety Education, New York University, 1941).
6Amos E. Neyhart, Driving Skill Exercises for Use with Passenger
Cars and Commercial Vehicles (Washington: American Automobile Associa-
tion, 1961).

30
National Test in Driver Education. This standardized knowl-
edge test consists of sixty items divided into two parts. Part I
contains thirty-five true-false statements while Part II has twenty-
five multiple choice statements. The test is designed to measure
knowledge and information about safe driving practices, traffic
signs, rules of the road, and other aspects of driver education
and traffic safety. Each question is assumed to be equally weighted.
Scoring is accomplished by totaling the number of correct responses.
Siebrecht Attitude Scale. This scale was developed in 1941 at
New York University as a doctoral dissertation and is still the most
widely used of the attitude scales in the area of driver education.
The scale contains forty items, each a complete statement about
specific factors considered to be important in safe driving. These
factors are: (1) passing on curves and hills, (2) driving as a
privilege, (3) enforcement of traffic regulations, (4) condition of
the automobile, (5) responsibility, (6) speeding, (7) cooperation,
(8) examination for drivers' licenses, (9) violations, (10) condi-
tion of drivers (11) courtesy, concern, and (12) knowledge and
7skills. The individual indicates his reaction toward the statement
in terms of a five-point scale ranging from "strongly agree" to
"strongly dis-agree." There are no right or wrong answers as such.
7CenterforSafety Education, Revised Scoring Method for theSiebrecht Attitude Scale (New York: Division of General Education,New York University, 1958), p. 2.

31.
The scale is scored by summing the values of the positions checked.
Values from one to five have been assigned the positions for each of
the statements.
A standard score was obtained from the standard responses of one
hundred twenty-five traffic experts.8
A standard score amounts to
173 points. By the split-half method a coefficient of reliability.
of .81 has been secured on a group of 100 students enrolled in driver-
training courses. The validity of the scale rests upon the following
bases:
1. The judgments of experts in traffic safety and atti-
tude measurement were utilized to determine the factors which
were believed to be important in the safe driving of the auto-
mobile and to evaluate the statement of opinion which comprised
the preliminary form of the scale.
2. In the final form of the scale have been included only
those statements which differentiated significantly between
the mean scores of high- and low-scoring groups of students;
a 20 per cent segment of the extremes was used. For none of
the statements is the critical ratio of the difference between
the means of the 20 per cent segments less than 3.00. The
average ratio is 6.234.
3. The scale seems actually to differentiate between
groups presumed to possess a difference of attitude toward
the issue of safe driving. The greatest differences occur
between the groups presumed to possess the greatest differ-
ence in attitude . . ..9
Driving Skill Exercises for Use with Passenger Cars and Com-
mercial Vehicles. This standardized skill test was developed by
8Ibid., p. 3.
9New York University, Manual of Directions, Siebrecht Attitude
Scale (New York: The University, n.d.).

Amos E. Neyhart, Director Emeritus and Consultant to the Institute
of Public Safety, Pennsylvania State University. The exercises in
the test were designed to measure and improve a driver's skill in
handling a vehicle. The test consists of the following six exer-
cises: (1) driving in a straight line, (2) steering in close limits,
(3) stopping smoothly from 20 mph, (4) determining front and rear
limits, (5) parallel parking, and (6) measuring reaction and braking
distance. A competent judge administers the test to each student
and assigns a letter grade for each exercise. The letter grades are
converted to an interval scale and summed to obtain an overall score
for the test. The six areas are considered to be of equal value in
determining the performance skill of a student.
Although the knowledge and skill tests selected have no stated
reliability or validity, they are both standardized tests and were
selected over tests with stated reliability and validity. For this
reason, it was assumed that the tests could be scored with a rela-
tively high degree of objectivity.
III. THE SAMPLE
The sample for this study consisted of the students enrolled in
the driver education program for the spring semester 1969 at the fol-
lowing secondary schools in the El Paso, Texas, Public School System:
(1) Austin, (2) Bowie, (3) Coronado, (4) El Paso High, (5) El Paso
Technical, (6) Irvin, and (7) Jefferson. The students from Irvin
High School were randomly assigned to instructional treatment by
drawing names from a hat and being assigned alternately to treatments
32

I and II. The students from Austin and Coronado high schools were
assigned to treatment I until the limit for the class had been met,
and the remainder received treatment II. There were no established
criteria for the assignments. Students were assigned as they regis-
tered for the course. Due to the scheduling of the simulator and
limited enrollment, there was no possibility for both treatments to
be applied at El Paso High, El Paso Technical, Jefferson High, or
Bowie High. The initial sample consisted of 400 students from all
seven schools. Due to absences on days the tests were administered
and incomplete data in the cumulative folders, 131 samples were dis-
carded. The number of students from each school and the treatments
they received are listed in Table I.
The nonrandom selection of the students to participate in the
study presents a problem as to the limit of generalization. Gen-
eralizations of the findings of the study cannot be made to the
student population as a whole, but it is felt that students who
elect to take the driver education program will be similar in char-
acteristics to the population under study at the present time and
therefore inferences will be directed to this population only.
IV. DATA COLLECTION
Class rolls were obtained from each of the driver education
instructors in the seven schools. From these lists, it was possible
to go to the student personnel files and obtain the necessary back-
ground information. This consisted of each student's score on the

34
TABLE I
SPMPLE SIZE AND TREATMENT ASSIGNMENT BY SCHOOL
School Sample SizeTreatment I Treatment II
Austin 23 66
Bowie 0 23
Coronado 23 31
El Paso High 21 0
El Paso Technical 19 0
Irvin 23 21
Jefferson 0 19
Total 109 160

35
Iowa Test of Educational Develotment and information regarding the
parents' occupations to be used in determining the socioeconomic
status of the student.
Ethnic membership of the student was determined by using the
responses to four separate questions (see Appendix A) regarding
the respondent's name, ancestry (Spanish- or Mexican-American, or
Anglo), language used in various social situations, and parents'
birthplaces. If a student indicated he was of Spanish- or Mexican-
American descent, his surname was compared to those generally judged
as indicative of that heritage. As a final check, the instructor
gave his opinion based on physical characteristics. This method
of identification parallels that used by the United States Bureau
of the Census.10
The socioeconomic status of the samples was determined by con-
sultation with the school counselors. With the use of the coun-
selors' records and personal knowledge, students were classified as
either disadvantaged or not disadvantaged. The criterion for dis-
advantaged classification was that the student be from a family
whose combined annual income did not exceed $3,000.11
10United States Bureau of the Census, U.S. Census of Popula-
tion: 1960. Subjects' Reports, Persons of Spanish Surnames. Final
Report PC(2) -1B (Washington: Government Printing Office, 1963),
pp. vi-xii.
11John F. Hughes (director), Title I Program Guide No. 36,
Division of Compensatory Education, United States Department of
Health, Education and Welfare (Washington: Government Printing
Office, 1968), p. 2.

3.
Each student was posttested with the appropriate instrument
for measuring knowledge, attitudes, and skills relevant to the
driving task. The tests were hand scored; correlated with back-
ground information for each student which included identification
as to sex, ethnicity, socioeconomic status, and the composite score
on the Iowa Test of Educational Development; and then keypunched
for computer analysis.
V. HYPOTHESES TO BE TESTED
In the course of this investigation, the following specific
hypotheses were tested:
1 There is no significant difference in mean scores...
for post-course driver education performances, as
measured by knowledge, attitude, and skill scones,
between students taught by a simulator centered
course and students taught by a dual-control car
centered course after initial differences between
the two groups have been adjusted by their composite
score on the Iowa Test of Educational Development.
2. There is no significant difference in mean scores
for post course driver education performance, as
measured by knowledge, attitude, and skill scores,
between Mexican-American and Anglo-American students
after initial differences between the two groups have
been adjusted by their composite score on the Iowa Test
of Educational Development.

37
3. There are no significant differences in mean scones
for post-course driver education performance, as
measured oy knowledge, attitude, and skill scores,
between male and female students after initial dif-
ferences between the tm grous have been adjusted
by their composite score on the Iowa Test of Educa-
tional Development.
4. There are no significant differences in mean scores
for post-course driver education performance, as
measured by knowledge, attitude, and skill scores,
between nondisadvantaged and disadvantaged students
after initial differences between the two groups have
been adjusted by their composite score on the Iowa
Test of Educational Development.
5. There are no significant first-order interactions
between method of instruction and sex, ethnicity,
and/Or socioeconomic status with respect to driving
knowledge, attitude, and skill mean scores.
6. There are no significant first-order interactions
among all possible combinations of sex, ethnicity,
and socioeconomic status with respect tc, driving
knowledge, attitude, and skill mean scores.
VI. STATISTICAL TREATMENT OF THE DATA
A multiple classification analysis of covariance was used to
test the hypotheses of no significant differences between the means

of the criterion measures of performance achievement in driver educa-
tion for treatment factors and ;.he classification factors cf ethnicity,
sex, and socioeconomic status. The classification factors are the
experimental units into classes which are homogeneous with respect to
what is being classified. In contrast, treatmenl factors define the
experimental conditions applied to an experimental unit. The effects
of the treatment factors are of primary interest, whereas classifica-
tion factors are included to reduce the experimental error, clarify
interpretations of the effects of the treatment factors, and determine
effects of treatment and classification factor interactions. The vari-
ables used in the analysis are defined as follows:
Independent -- Treatment, ethnic identity, sex, and socio-
economic status
Dependent or Criterion -- Knowledge scores--As measured by
National Test in
Driver Education
Attitude scores --As measured by
Siebrecht Attitude
Scale
Skill scores --As measured by Driving
Skill Exercises for Use
with Passenger Cars and
Commercial Vehicles
Control--Composite achievement score on Iowa Test of Educational
Development

39
By utilizing the analysis of covariance, the usual tests can
be made for group differences between the independent or main-effect
variables, as well as for significant interactions between them, just
as if an analysis of variance was being made. In addition, the
researcher can statistically equate the independent variables with
respect to one or more variables which are relevant to the dependent
variable.12
The students' composite score on the Iowa Test of Educational
Development was used as the control variable. It was logical to
assume that there would be variability within the sample population
considering achievement levels and intellectual ability. Normally,
a measure of the students' IQ is used in studies of this nature;
however, this information was not readily available for this study.
The Iowa Test of Educational Development, however, was administered
throughout the El Paso Public School System for all ninth grade stu-
dents. With the exception of transfer students, this information
was available for each student included in the sample. When utiliz-
ing a covariate, it is not necessary for it to be measured on the
same scale as the dependent variable, nor does it need to be a direct
causal agent of the dependent variable. It may merely reflect some
characteristic of the environment that also influences the criterion.13
12James W. Popham, Educational Statistics: Use and Interpreta-
tion (New York: Harper and Rows 1967), p. 223.
13William G. Cochran, "Analysis of Covariance: Its Nature and
Uses," Biometrics, l3(3):263 -64, September, 1957.

The mathematical model used in the analysis of the data was a
x 2 x 2 x 2 factorial, completely random model, as follows:
Yij-- kl-m = µ + Ti + E. + Sk+ + (TE)ij + (TS)ik + (TD). + (ES)ik
40
+ (ED). . + (SD)1(.0
+ (TES).. + (TED).. + (TSD)ikk
+ (ESD).ijk 1.).0
+ e- -k- + . X) + e.. ,
1..) ijkia
where
= population mean
Ti = effect due to instructional method
E4 effect due to ethnicity
Sk
= effect due to sex
--
(TE)ij = method x ethnicity interaction
(TS)ik = method x sex interaction
(TD).6 = method x SES interaction
(ES) ethnicity x sex interaction
(ED)jz ethnicity x SES interaction
(SD)ic sex x SES interaction
(TES)iik _ method x ethnicity x sex interaction
(TED)iji, = method x ethnicity x SES interaction
(TSD)ikie; = method x sex x SES interaction
(ESD)jkl, = ethnicity x sex x SES interaction
eijkx = all third order interactions.
These will be assumed to equal 0 and all
numerical values will be due to random
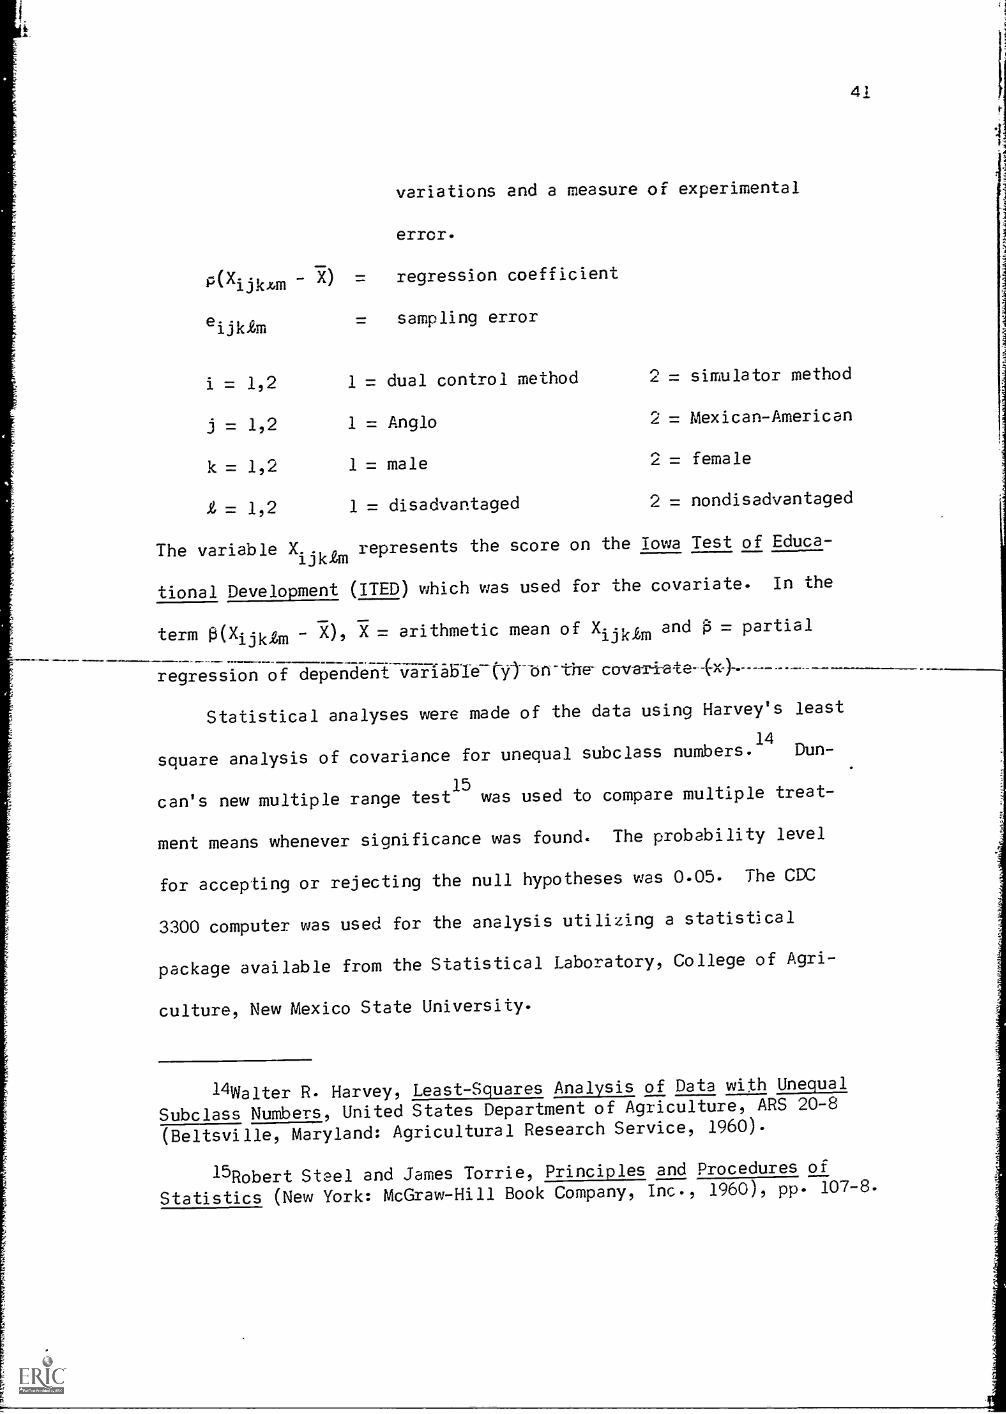
P(Xijkzm 70
eijkim
variations and a measure of experimental
error.
= regression coefficient
= sampling error
41
i = 1,2 1 = dual control method 2 = simulator method
j = 1,2 1 = Anglo 2 = Mexican-American
k = 1,2 1 = male 2 = female
-= 1,2 1 = disadvantaged 2 = nondisadvantaged
The variable Xijklm represents the score on the Iowa Test of Educa-
tional Development (ITED) which was used for the covariate. In the
term 0(Xijk2m - X), X = arithmetic mean of Xijkla and 0 = partial
regression of dependent va-ria51-e-tyt-on-the--co-v-a-r-late---04.- -
Statistical analyses were made of the data using Harvey's least
square analysis of covariance for unequal subclass numbers.14
Dun-
can's new multiple range test15
was used to compare multiple treat-
ment means whenever significance was found. The probability level
for accepting or rejecting the null hypotheses was 0.05. The CDC
3300 computer was used for the analysis utilizing a statistical
package available from the Statistical Laboratory, College of Agri-
culture, New Mexico State University.
14Walter R. Harvey, Least-Squares Analysis of Data with Unequal
Subclass Numbers, United States Department of Agriculture, ARS 20-8
(Beltsville, Maryland: Agricultural Research Service, 1960).
15Robert Steel and James Torrie, Principles and Procedures of
Statistics (New York: McGraw-Hill Book Company, Inc., 1960), pp. 107-8.

42
CHAPTER IV
ANALYSIS AND INTERPRETATION OF THE DATA
The purpose of this chapter is to present and interpret the
results of the statistical treatments applied to the data. The
requisite assumptions for applying the analysis of covariance and
the methods and results of testing the validity of these assump-
tions are discussed in the first section. The results obtained in
the analysis in relation to each hypothesis tested are discussed
in section two.
-The a nal/sIs -ef
adjust treatment means of the dependent variables for initial dif-
ferences in subjects' performance that would otherwise adversely
affect the interpretation of the statistical findings. The covari-
ance adjustment has the effect of decreasing the experimental error,
statistically rather than experimentally, and consequently increases
the precision of the experiment. For example, in this study, if
scores on the control variable were correlated with scores on the
dependent variable, knowledge, a portion of the experimental error
for knowledge could be the result of differences in the Iowa Test
of Education,1 Development (ITED) scores. By use of the covariance
analysis, the contribution to the experimental error for each of
the dependent variables by the differences in ITED scores was com-
puted and eliminated from the experimental error for each of these
variables.
I. TESTING OF ASSUMPTIONS

43
A first step in the analysis was to run a correlation between
the control variable, the composite score on the ITED, and the three
criterion variables, knowledge, attitude, and skills. By computing
a product-moment correlation coefficient, the magnitude and direc-
tion of the relationship between the control variables and each of
the criterion variables was ascertaine:i. The product-moment coeffi-
cient (r) was computed by the following formula:1
where
x
Y
r =Exy
Aix2) (Ey2)
= deviation of control variable score from its mean
= deviation of corresponding criterion variable from
is mean
The results of the computations for this study are as follows:
Criterion Correlation Coefficient
Knowledge 0.54*
Attitude 0.47*
Skill 0.15*
*df = 267 r at 0.05 = 0.14
An examination of Figures 1, 2, and 3 shows graphically that
there is indeed a relationship, positive in nature, and the rela-
tionship appears to be linear.
'James W. Popham, Educational Statistics: Use and Interpre-tation (New York: Harper and Row, 1967), p. 70.

coI-UCC0co
44
ITED SCORES
54-56
0 -2 3-5 6-8 9-11.12-14 15-17 18-20121-23
..
.. -.
24-26
..
27-30
..
. -
51-53.
.
...
.. - ..- .
..-
.-
48-50._
.-. -..
. . .
.. .. .
.
45-47..
..
.. -
.. .
. .. . .
.-.
..
42-44 ..
. .
.. .- .
- -
-.
..---
.. . . .
-..
..
..
____
39-41I
- .
. .
.'....
.
.
.
36-38 .-.
.- .
33-35 ..
-.
.. .
30-32
27-29
24-26
FIGURE 1
FREQUENCY TABLE: KNOWLEDGE VS. ITED


ITED SCCFYc.
18C-1 9
C- ...,-1 =-- i r
C- c. 9-11 :.14 15-17 1E-0 "L ---- .- 27-2C
.
.
.
... .. .
1
170-179
,
..
.
.
.
. .
- .
.
..
.
.
1E0-1E9. .
- .
.
..
_.. .
.
. .
-
.
.
. .
-
.
.
.
. .
.
150-159. - -
.
.
. .
. -
.
.
.
.
..
140-149 .
- ..
- .
...
..
.
..-.
Ia
..
1
130-139 ..
a. la
A
.
. .
a
.
Is
..
120-129 ..
.
110-119
100-109
1
..,90-9 o
FIGURE 2
FREQUENCY TABLE: ATTITUDE VS. ITED

4
I TED SCORES
29-30
0-23-5_ E- 9-!1J12-14115-17!1&-2C _ ...-- 22124- a 27-30
. . .- .1
. .e
27-26 ..
* a
.
25-26. .
.at
a
. . . .
23-446
4 . '. ..
01,
-
21-22 .
it
0. A
. - .. . . - -.-
a
19-20 .. . .
17 18 .e
.
15-16 - 4,
13-14 ..
I
11-121
9-10.
. t
FIGURE 3
FREQUENCY TABLE: SKI LL VS. I TED

47
Combining the results of the computation of r which quanti-
fiably provides a measure cf the strength and dire:tion of the
relationship and of the visual relationshir shown in F :gures 1,
2, and 3, it is concluded that the ITED score is correlated with
each of the criterion variables at the 0.05 level of probability
and is justifiable for use as a covariate.
The analysis of covariance, being a combination of linear
regression and analysis of variance techniques, must satisfy
assumptions applicable to each. Denoting the covariate as X and
the dependent or criterion variable as Y, the following assumptions
are necessary for the valid use of covariance:2
1. The X's are fixed and measured without error.
2. The regression of Y on X is linear and independent
of treatments.
3. The residuals are normally and independently dis-
tributed with zero mean and common variance.
Assumption one implies that there should not be any systematic
variation in X across treatment groups. Meyers pointed out that
"if X is an integral part of the treatment, adjustment for variation
in X should not be undertaken."3
Steel and Torrie, on the other
hand, stated that ". in situations where real differences among
treatments for the control variable do occur but are not the direct
2Ro b ert Steel cnd James Torrie, Principles and Procedures of
Statistics (New York: McGraw-Hill Book Company, Inc., 1960), p. 309.
3Jerome L. Meyers, Fundamentals of Experimental Design (Boston:
Allyn and Bacon, 1966), p. 323.

effect of the treatments, adjustment is warranted."4 For this
study, the covariate was not affected by the treatments, as the
measure of the covariate was taken before the treatments were
applied. An analysis of variance was run on the covariate to
determine if real differences did exist. The results of this
analysis are summarized in Table II. Significant differences
were noted only for the classification of ethnicity. This dif-
ference was to be expected. As stated previously in Chapter 11,
according to Grebler, an educational gap does exist between Anglo-
Americans and Mexican-Americans, especially at the high school
level.' The mean scores on the covariate for each of the ethnic
groups bear out this fact. These are: Mexican-Americans, 10.64;
Anglo-Americans, 14.22.
Assumption two states that a common regression coefficient
can be used for the entire experiment. This implies that the
regression coefficients for each treatment breakdown are relatively
homogeneous. The method proposed by Steel and Torrie was used to
test the homogeneity of regression.6
Table III summarizes the
results of this test. This assumption proved tenable for all
treatment breakdowns with the exception of the main effect sex
4Steel and Torrie, op cit., p. 308.
5Leo Grebler, The Schooling Gap: Signs of Progress (Advance
Report No. 7 of the Mexican-American Study Project, Graduate School
of Business Administration, University of California, Los Angeles,
1967).
6Steel and Torrie, E. cit., p. 319.

TAELE II
ANALYSIS OF VARIANCE F7A DIFFERENCES AMCNG TREATMENTSON THE COVARIATE: ITED SCORE
Source of Variation
Degreesof
FretAom
MeanSquares "F" -atio
Treatment 1 15.t12 <1
Ethnicity 1 101.5C7 5.E4*
Sex I 10.127 <1
Socioeconomic Status 1 1.047 <1
Error 254 17.377
*df = 1/254 "F" at 0.05 = 3. BE. "F" at 0-01 = 6.74

TABLE In
"F" RATIOS FOR HOMOGENEITY OF REGRESSION TEST
Dependen' VariablesDegrees
ofFreedom
RejectionLevel
Source of Variation Knowledge Attitude Skill x= 0.05 a=0.01
Treatment <1 <1 <1 1 265 3.84 6.63
Ethnicity <1 3.16 <1 1 265 3.84 6-63
Sex <1 <1 6.11 1 265 3.84 6.63
Socioeconomic Status <1 <1 <1 1 265 3.84 6.63
Treatment by Ethnicity 1.48 1.60 <1 3 261 2.60 3.78
Treatment. by Sex <1 <I 3.17 3 261 2.60 3.78
Treatment by SocioeconomicStatus <1 <1 <1 3 261 2.60 3.78
Ethnicity by Sex <1 1.26 1.21 3 261 2.60 3=78
Ethnicity by SocioeconomicStatus <1 1.22 1.68 3 261 2.60 3.78
Sex by SocioeconomicStatus <1 <1 3.17 3 261 2.60 3.78
Treatment by Ethnicityby Sex <1 <1 1.00 7 255 2.01 2.64
Treatment by Ethnicityby Socioeconomic Status 1.36 1.00 <I 7 255 2.01 2.64
Treatment by Sex bySocioeconomic Status <1 1.17 7 255 2.01 2.64
Ethnicity by Sex bySocioeconomic Status <1 <1 <1 7 255 2.01 2.64

and first-order interactions for treatment by sex and sex by socio-
economic status only for the dependent variable skill. The hypoth-
esis of homogeneity of regression coefficients VMS rejected at the
0.05 level but could be acce;.ted at oe= 0.01. As shown Freviously,
the control variaole correlated least with the dependent variable
skill. As a result of the previous test, the -.es t for signIficant
differences for the classifications sex, treatment by sex, and sex
by socioeconomic status interactions will be made the unadjusted
means.
Assumption three refers to the usual assumptions associated
with the analysis of variance. The assumption of normality can be
sati5fied by observing Figures 4, 5, and f. Although the distribu-
tions are not perfectly bell-shaped as a normal distribution should
be, they are reasonably symmetric and are accepted as such.
The assumption of equal variances was tested by means of
7Hartley's Maximum-F test. The results of this test are summarized
in Table IV. No significant differences were found for the cri-
terion variables knowledge and attitude nor for the main effects of
the skill variable. Significant differences were found for all
first and second-order interactions for the criterion variable
skill with the following exceptions: ethnicity by sex, sex by
socioeconomic status, and ethnicity by sex by socioeconomic status.
Each of the interactions that showed significance was observed to
7H. C. Fryer, Concepts and Methods of Experimental Statistics(Boston: Allyn and Bacon, Inc., 1966), pp. 246-47.

65
60
55
50
CO A4+
P-0LOU)z2 40U)ELI
fx 35iii0>,300z11-1 25cY111
ff, 20
15
10
5
i aV
I
52
I 1
24-26 27-29 30-32 33-35 36-36 39-41 42-44 45-47 48-50 51-53 54-56 57-59
KNOWLEDGE SCORE RANGES
FIGURE 4
FREQUENCY CHART OF KNOWLEDGE SCORES

75
70
65
60
55
cf) 50wcnz0 45aU)Illa 40Li,0 35>-.U.6 30aU.1a 25Li,
20
15
10
5
0I 190-99 100-09 110-19 120-29 130-39 140-49 150-59 1f.0-69 170-79 180-89 190-99
ATTITUDE SCORE RANGES
FIGURE 5
FREQUENCY CHART OF ATTITUDE SCORES

60
55
50
45
40
35
30
25
20
15
10
5
0
1
1
54
9-10 11-12 3.3-14 15-16 17-18 19-20 21-22 23-24 25-26 26-27 27-28 29-30
SKILL SCORE RANGES
FIGURE 6
FREQUENCY CHART OF SKILL SCORES

55
TABLE IV
SIGNIFICANT 'F' VALUES FOR HOMOGENEITY OF VARIANCE TESTUSING HARTLEY'S MAXIMUM "F" TESTC
VariableSource of Variation Knowledge Attitude Skill k v a=.05 a=.01
Treatment 1.27 1.08 1.59 2 135 1.65 1.95
Ethnicity 1.01 1.13 1.21 2 135 1.65 1.95
Sex 1.27 1.02 1.49 2 135 1.65 1.95
Socioeconomic Status 1.14 1.20 1.03 2 135 1.65 1.95
Treatment by Ethnicity 1.50 1.46 2.44 4 67 1.95 2.20
Treatment by Sex 1.67 1.20 2.11 4 67 1.95 2.20
Treatment bySocioeconomic Status 1.37 1.65 2.58 4 67 1.95 2.20
Ethnicity by Sex 1.29 1.21 1.66 4 67 1.95 2.20
Ethnicity bySocioeconomic Status 1.60 1.24 2.91 4 6. 1-95 2.20
Sex by SocioeconomicStatus 1.57 1.20 1.84 4 67 1.95 2.20
Treatment by Ethnicityby Sex 1.89 1.64 4.50 8 34 3.00 3.63
Treatment by Ethnicityby SocioeconomicStatus 1.87 2.07 4.51 8 34 3.00 3.63
Treatment by Sex bySocioeconomic Status 2.20 1.91 3.93 8 34 3.00 3.63
Ethnicity by Sex bySocioeconomic Status 1.72 1.25 2.82 8 34 3.00 3.63
aFmax = (Largest s2) /(Smallest s2) for k samples from normal
populations, each providing v degrees of freedom for s2. Where the
number of degrees of freedom for each sample are unequal, v = the
average degrees of freedom [H. C. Fryer, Concepts and Methods ofExperimental Statistics (Boston: Allyn and Bacon, Inc., 1966), p. 246 3-

have at least one cell in the treatment partition to be dispropor-
tionate to the other cells with regard to the numbei of cell entries.
There is also considerable discussion among statisticians as to the
necessity for all assumptions to be rigorously met in the analysis
of variance models. With regard to the usual tests for homogeneity
of error variance, Box said, "To make the preliminary tests on vari-
ances is rather like putting to sea in a rowing boat to find out
whether conditions are sufficiently calm for an ocean liner to leave
port."8 The work of Box has shown that the distribution of the "F"
ratio in the analysis of variance is affected very little by in-
equalities in the variances which are pooled into the experimental
error.
II. DISCUSSION WITH REGARD TO HYPOTHESES TESTED
Based on the assumption that an analysis of covariance was the
appropriate statistical technique for this study and due to unequal
samples in the treatments, Harvey's least squares analysis of covari-
ance for unequal subclass numbers was used in the analysis.9
This
technique computes unbiased estimates of sums of squares that would
have occurred had the sample sizes been equal.
8G. E. P. Box, "Non-Normality and Tests on Variance," Biometrika,
40:333, 1953.
9Walter R. Harvey, Least-Squares Analysis of Data with Unequal
Subclass Numbers, United States Department of Agriculture, ARS 20-8,
(Beltsville, Maryland: Agricultural Research Service, 1960).
56

Before making the analysis of covariance, a straight analysis
of variance was made to determine the effects of the covariance
adjustment. The results of this analysis are summarized in Tables V,
VI, and VII. No significant dIfferences were found for any treat-
ment effects or interactions for the criterion variables knowledge
or skill. Significant differences at the 0.05 level were observed
for the criterion variable attitude for the main effect ethnicity
and first-order interactions treatment by ethnicity and treatment
by socioeconomic status. No interpretations were made until after
the covariance adjustment.
As was stated previously, for the criterion variable skill,
differences due to sex, treatment by sex, and sex by socioeconomic
status would be analyzed on the unadjusted means due to the hetero-
geneity of regression coefficients and the marginal use of the ITED
score as a covariate. For these classifications, no significant
differences were noted. Therefore, the null hypotheses of no sig-
nificant differences between the means of the skill scores for male
and female students are accepted at the 0.05 level of probability.
The null hypotheses of no significant interactions for treatment by
sex and sex by socioeconomic status are accepted at
of probability.
41AV4,- 0.05 level
57

TP3LE V
ANALYSIS OF VARIZCE C2 VARIP3LE D. 1- KNOWL:MGE
Source of Variation
Degreesof
FreedomMean
Squares "F" Ratio
Treatments 1 6.725 <1
Ethnicity 1 86.301 2.90
Sex 1 7.981 <1
Socioeconomic Status 1 13.965 <1
Treatment by Ethnicity 1 30.488 1.02
Treatment by Sex 1 33.376 1.12
Treatment by Socioeconomic Status 1 0.876 <1
Ethnicity by Sex 1 6.554 <1
Ethnicity by Socioeconomic Status 1 12.642 <1
Sex by Socioeconomic Status 1 0.394 <1
Treatment by Ethnicity by Sex 1 12.476 <1
Treatment by Ethnicity bySocioeconomic Status 1 0.360 <1
Treatment by Sex by SocioeconomicStatus 1 17.282
Ethnicity by Sex by SocioeconomicStatus 1 66.584 2.24
Error 254 29.777
df = 1/254 "F" at 0.05 = 3.88

59
TABLE VI
ANALYSIS OF YARIPNCE ON VARIABLE O. 2 ATTITUDE
Source of VariaLion
Degreesof
FreedomMean
Squares "F" Ratio
Treatments 1 730.924 3.23
Ethnicity 1 1333.1E6 5.89*
Sex 1 298.800 1.32
Socioeconomic Status 1 240.936 1.C6
Treatment by Ethnicity 1 1064.881 4.71*
Treatment by Sex 1 516.125 2.28
Treatment by Socioeconomic Status 1 919.981 4.07*
Ethnicity by Sex 1 42.887 <1
Ethnicity by Socioeconomic Status 1 157.669 <1
Sex by Socioeconomic Status 1 66.533 <1
Treatment by Ethnicity by Sex 1 7E.781 <1
Treatment by Ethnicity bySocioeconomic Status 1 341.820 1.51
Treatment by Sex by SocioeconomicStatus 1 142.914 <1
Ethnicity by Sex by SocioeconomicStatus 1 140.911 <1
Error 254 226.310
*df = 1/254 "F" at 0.05 = 3.88 "F" at 0.01 = 6.74

TABLE VII
ANALYSIS OF VARIANCE CN VARIABLE ND. 3 SKILL
Source of Variation
Degreesof
FreedomMean
Squares "F" Ratio
Treatments 1 1C.58'6 <1
Ethnicity 1 2.873 <1
Sex 1 31.255 1.71
Socioeconomic Status 1 1.588 <1
Treatment by Ethnicity 1 1.106 <1
Treatment by Sex 1 0.085 <1
Treatment by Socioeconomic Status 1 5.972 <1
Ethnicity by Sex 1 22.627 1.24
Ethnicity by Socioeconomic Status 1 0.172 <1
Sex by Socioeconomic Status 0.011 <1
Treatment by Ethnicity by Sex 1 12.229 <1
Treatment by Ethnicity bySocioeconomic Status 1 2.738 <1
Treatment by Sex by SocioeconomicStatus 1 0.423
Ethnicity by Sex by SocioeconomicStatus 1 2.132 <1
Error 254 18.270
df = 1/254 "F" at 0.05 = 3.88

61
The results of the analysis of covariance are summarized in
Tables VIII, IX, and X. The significant "F" value obtained for
the regression on ITED reemphasizes the validity of the ITED score
used as the covariate. When comparing the analysis of variance
error mean square with the analysis of covariance error mean square,
it is readily apparent that one objective of the covariance approach
has been reached, i.e., reducing the error variance and thereby
increasing the precision of the experiment.
The significant difference in attitudes between Mexican-American
and Anglo students disappeared after the covariate adjustment. This
indicates that most of the observable variation in attitudes could
be attributed to variation in the mean ITED scores for the two ethnic
groups. The significant difference in attitudes for the treatment by
ethnicity interaction was also eliminated after the covariance adjust-
ment.
However, the significant difference observed for attitudes in
the treatment by socioeconomic status interaction while lowered some-
what, remained significant at the 0.05 level after the covariate
adjustment. This indicates that the factors treatment and socio-
economic status are not independent of one another. Either the treat-
ment effect is not the same for each level of socioeconomic status or
the socioeconomic status effect is not the same for each level of
treatment. A look at the adjusted means (Table XVI, Appendix C) will
shed additional light on the nature of the differences. Kramer's
adaptation of Duncan's New Multiple Range Test for unequal sample

TABLE VIII
ANALYSIS OF COVARIANCE ON VARIABLE NO. 1 KNOWLEDGE UTILIZINGTHE ITED COMPOSITE SCORE AS A COVARIATE
Source of Variation
Degreesof
FreedomMean
Squares "F" Ratio
Treatment 1 0.018 <1
Ethnicity 1 5.538 <1
Sex 1 25.019 1.15
Socioeconomic Status 1 19.697 <1
Treatment by Ethnicity 1 3.849 <1
Treatment by Sex 1 12.834 <1
Treatment by Socioeconomic Status 1 0.264 <1
Ethnicity by Sex 1 16.236 <1
Ethnicity by Socioeconomic Status 1 14.414 <1
Sex by Socioeconomic Status 1 0.274 <1
Treatment by Ethnicity by Sex 1 0.025 <1
Treatment by Ethnicity bySocioeconomic Status 1 0.768 <1
Treatment by Sex by SocioeconomicStatus 1 28.124 1e30
Ethnicity by Sex by SocioeconomicStatus 1 55.547 2.56
Regression on ITED 1 2076.021 95.72**
Error 253 21.689
**df = 1/253 "F" at 0.05 = 3.88 "F" at 0.01 = 6.74
62

63
TABLE IX
ANALYSIS OF COVARIANCE ON VARIABLE NO 2-ATTITUDE UTILIZINGTHE ITED COMPOSITE SCORE AS A COVARIATE./.
Source of Variation
Degreesof
FreedomMean
Squares "F" Ratio
Treatments1 440.371 2.35
Ethnicity1 442.574 2.36
Sex1 487.198 2.60
Socioeconomic Status 1 291.294 1.56
Treatment by Ethnicity 1 611.184 3.26
Treatment by Sex 1 319.259 1.70
Treatment by Socioeconomic Status 1 735.505 3.93*
Ethnicity by Sex 1 95.808 <1
Ethnicity by Socioeconomic Status 1 171.287 <1
Sex by Socioeconomic Status 1 31.558 <1
Treatment by Ethnicity by Sex 1 264.770 1.41
Treatment by Ethnicity bySocioeconomic Status 1 231.737 1.24
Treatment by Sex by SocioeconomicStatus
1 88.756 <1
Ethnicity by Sex by SocioeconomicStatus 1 106.349 <1
Regression on ITED 1 10092.497 53.88**
Error 253 187.313
*df = 1/253 "F" at 0.05 = 3.88
**df = 1/253 "F" at 0.01 = 6.74

64
TABLE X
ANALYSIS OF COVARIANCE ON VARIABLE NO. 3-SKILL UTILIZINGTHE ITED COMPOSITE SCORE AS A COVARIATE
Source of Variation
Degreesof
FreedomMean
Squares "F" Ratio
Treatments 1 21.230 1.18
Ethnicity 1 0.010 <1
Sex 1 26.524 1.47
Socioeconomic Status 1 1.255 <1
Treatment by Ethnicity 1 3.077 <1
Treatment by Sex 1 0.529 <1
Treatment by Socioeconomic Status 1 7.459 <1
Ethnicity by Sex 1 25.473 1.41
Ethnicity by Socioeconomic Status 1 13.439 <1
Sex by Socioeconomic Status 1 0.016 <1
Treatment by Ethnicity by Sex 1 17.285 <1
Treatment by Ethnicity bySocioeconomic Status 1 3.795 <1
Treatment by Sex by SocioeconomicStatus 1 0.772 <1
Ethnicity by Sex by SocioeconomicStatus 1 1.740 <1
Regression on ITED 1 82.311 4.57*
Error 253 18.017
*df = 1/253 "F" at 0.05 = 3.88 "F" at 0.01 = 6.74

65
sizes was run to make the comparison of nonindependent means.10
The results of this analysis are summarized in Table XI. There
are no significant differences indicated between the mean scores
of treatment one by nondisadvantaged, treatment two by disadvan-
taged, or treatment two by nondisadvantaged. The mean score of
the classification treatment one by disadvantaged was signifi-
cantly different from each of the other three means. This indicates
that the particular combination of traditional treatment with the
classification of disadvantaged students results in mean scores
significantly different from other classifications in the treat-
ment by socioeconomic subpopulation. As mentioned in Chapter III,
the standard score from a. group of traffic experts was 173 points on
the attitude scale. It is interesting to note that the mean score
that was causing the significant differences was closest to this
standard score.
Specific hypotheses to be tested were stated in the null form
to facilitate the statistical procedures. to be used. The results
of each hypothesis tested are as follows:
Hypothesis 1. There is no significant difference in
mean scores for post-course driver education per-
formance, as measured by knowledge, attitude, and
skill scores, between students taught by a simula-
tor centered course and students taught by a dual
10H. C. Fryer, Concepts and Methods of Experimental Statistics(Boston: Allyn and Bacon, Inc., 1966), pp. 274-75.

66
TABLE XI
INDIVIDUAL COMPARISON OF TREATMENT BY SOCIOECONOMIC STATUS MEANSFOR ATTITUDE SCORES, USING DUNCAN'S MODIFIED MULTIPLE RANGE TEST
Means:
Treatment 1 by Treatment 1 by Treatment 2 by Treatment 2 byDisadvantaged Nondisadvantaged Disadvantaged Nondisadvantaged169.37 n = 24 154.31 n = 85 154.32 n = 37 156.34 n = 123
s2 = 187.31 df = 253
P = 2 3 4
Significant Studentized Ranges (SSR) 2.92 3.07 3.15
1 2 3 4
Ranked Means 154.31 154.32 156.34 169.37
Least Significant Range = S'MSSR)
siTe =11 1 1 S 2
k2) ni n2
LSR, 4-1 = 7.02 Actual, 4-1 = 15.06
4-2 = 7.80 4-2 = 15.05
3-1 = 4.18 3-1 = 2.03
2-1 = 5.55 2-1 = 0.01
3-2 = 5.29 3-2 = 2.02
4-3 = 6.31 4-3 = 13.03
154.31 154.32 156.34, 169.37
aAny two means not underscored by the same line are signifi-cantly different. Any two means underscored by the same line arenot significantly different.

control car centered course after initial differences
between the two groups have been adjusted by their
composite score on the Iowa Test of Educational
Development.
The results of the analysis of covariance indicate that no
significant differences exist between the means of the performance
scores for the two instructional methods based on the data at hand.
The null hypothesis was accepted at the 0.05 level.
Hypothesis 2. There is no significant difference in
mean scores for post-course driver education per-
formance, as measured by knowledge, attitude, and
skill scores, between Mexican-American and Anglo-
American students after initial differences between
the two groups have been adjusted by their composite
score on the Iowa Test of Educational Development.
The results of the analysis of covariance indicate that no
significant differences exist between the means of the performance
scores of Mexican-American and Anglo-American students on the cri-
terion variables based on the data at hand. The null hypothesis
was accepted at the 0.05 level.
Hypothesis 3. There is no significant difference in
mean scores for post-course driver education per-
formance, as measured by knowledge, attitude, and
skill scores, between male and female students
67

68
after initial differences between the two groups
have been adjusted by their composite score on
the Iowa Test of Educational Development.
The results of the analysis of covariance indicate that no
significant differences exist between the means of the performance
scores of male and female students on the criterion variables used.
based on the data at hand. The null hypothesis was accepted at the
0.05 level.
Hypothesis 4. There is no significant difference in
mean scores for post-course driver education per-
formance, as measured by knowledge, attitude, and
skill scores, between nondisadvantaged and disad-
vantaged students after initial differences between
the two groups have been adjusted by their composite
score on the Iowa Test of Educational Development.
The results of the analysis of covariance indicate that no
significant differences exist between the means of the performance
scores of disadvantaged and nondisadvantaged students on the cri-
terion variables used based on the data at hand. The null hypothesis
was accepted at the 0.05 level.
Hypothesis 5. There is no significant first-order
interaction between method of instruction and
sex, ethnicity, and/Or socioeconomic status with
respect to driving knowledge, attitude, and skill
mean scores.

69
The results of the analysis of covariance indicate that no
significant first-order interactions exist for the classifications
treatment by sex and treatment by ethnicity for all three criterion
variables. However, a sianificant interaction was detected at the
0.05 level for treatment by socioeconomic status for the criterion
variable, attitude. This interaction was not significant for treat-
ment by sex and treatment by ethnicity combinations.
Hypothesis 6. There is no significant first-order inter-
action among all possible combinations of sex, ethnicity,
and socioeconomic status with respect to driving knowl-
edge, attitude, and skill mean scores.
The results of the analysis of covariance indicate that no sig-
nificant interactions exist for any combination of sex, ethnicity,
and socioeconomic status in relation to the three criterion variables
based on the data at hand. The null hypothesis was accepted at the
0.05 level.

CHAPTER V
SUMMARY, CONCLUSIONS, AND RECCMMENDATIONS
The purrose of this chapter is to present a summary of the
study, conclLsions reached based on the findings, and recommenda-
tions for further research. Included in the summary are the pur-
pose of the study, specific questions to be answered, the procedures
used in the analysis, and a synopsis of the findings.
I. SUMMARY
The major purpose of this study was to determine the relative
effectiveness of a simulator centered teaching technique and a dual-
control car centered teaching technique used in the laboratory phase
of driver education programs as measured by knowledge, attitude, and
skill scores. Ethnicity, sex, and socioeconomic status were con-
sidered as additional contributing sources of variation.
In order to evaluate the two teaching methods, the following
specific questions had to be answered:
1. Will the driving knowledge, attitudes, and skills
of students taught by a simulator centered course
differ significantly from the driving knowledge,
attitudes, and skills of students taught by a dual-
control car centered course?
2. Will the driving knowledge, attitudes, and skills
of Mexican-American students differ significantly
70

71
frJm the driving knoedtsdge, attitudes, and skills
of Anglo-American students?
3. Will the driving knowledge, attitudes, and skills
of male students differ significantly from the
driving knowledge, attitudes, and skills of female
students?
4. Will the driving knowledge, attitudes, and skills
of nondisadvantaged students differ significantly
from the driving knowledge, attitudes, and skills
of disadvantaged students?
5. Will the method of instruction indicate significant
first-order interactions with sex, ethnicity, and/O1
socioeconomic status with respect to driving knowl-
edge, attitudes, and skills?
6. Will sex, ethnicity, and socioeconomic status, in
all two-way combinations, indicate significant first-
order interactions with respect to driving knowledge,
attitudes, and skills?
A secondary purpose of this study involved the use of the
simulator as a major teaching device, but utilized two apFroaches
for the instruction. In order to evaluate these two ar+roaches,
the following question was to be answered:
7. Will the driving knowledge, attitudes, and skills
of Mexican-American students taught by a simulator
centered course in Spanish differ significantly from
the driving knowledge, attitudes, and skills of

72
Vexican-American students taught by a simulator
centered course in English?
A complication arose, however, concerning this question almost imme-
diately after instruction began. A staff member of the Region XIX
Education Sevfice Center translated the narration accompanying the
instructional films from English to Spanish and recorded it on a
tape recorder. After a trial period in which different arrangements
were made as to speaker placement, it was the opinion of the instruc-
tor that the quality of the equipment was such that the students were
not able to fully understand the instructions. He subsequently
changed to the English version. There was no alternative but to
discard this phase of the study.
Data for this experiment were obtained from seven high schools
in the El Paso, Texas, Public School System during the spring semester
1969. Simulator instruction was given by personnel from the Region
XIX Education Service Center, El Paso, Texas. The samples for the
traditional method of instruction were obtained from the regularly
scheduled driver education classes at the various high schools. Com-
plete data were obtained for 269 students, of whom 109 received in-
struction via the traditional method and 160 received instruction
on the simulator.
Background data on each of the students included in the sample
were obtained by questionnaire and personal consultation with the
school counselor at each of the schools. These data were used to
determine the ethnicity and sex of the student and also a dichoto-
mous measure of his socioeconomic status. A disadvantaged student

73
was defined as coming from a home where the combined family income
did not exceed $3,000 per year. Information regarding the ITED
scores of the students was obtained from the cumulative records at
each school.
Performance scores for measuring competency in driving knowl-
edge, attitudes, and skills were obtained by administering the
National Test in Driver Education for knowledge, the Siebrecht
Attitude Scale for attitudes, and Driving Skill Exercises for Use
with Passenger Cars and Commercial Vehicles for skill. These tests
were administered at the conclusion of the treatments.
In order to analyze the data statistically, the questions to
be answered were restated in hypothesis form, as was indicated in
Chapter III. A multiple classification analysis of covariance was
used to analyze the data. The student's composite score on the
Iowa Test of Educational Development was used as the covariate in
order to account for variation in performance due to individual
differences that could be identified and tabulated. The use of
analysis of covariance, if applicable, increases the precision of
the experiment by reducing the experimental error. Criterion vari-
ables for this experiment were the scores on the knowledge, attitude,
and skill tests. Independent variables were method of instruction,
ethnicity, sex, and socioeconomic status.
No significant differences were found to exist between the
mean performance scores on the criterion variables for any of the
main effects treatment, sex, ethnicity, or socioeconomic status.

No significant first-order interactions were found to exist
for any combination of the main effect variables with the excep-
tion of the treatment by socioeconomic interaction for attitude
scores only. This interaction was significant at the 0.05 level,
but not at the 0.01 level. The combination of disadvantaged stu-
dents taught by the traditional method was determined to be respon-
sible for the significant difference noted.
II. CONCLUSIONS
The conclusions reached are the result of the analysis of the
findings of this study and as such are limited in scope by the
limitations and assumptions as stated in Chapter I. Any inferences
drawn apply to the population under study and other populations with
similar characteristics.
Conclusions reached on the basis of hypothesis testing are as
follows:
1. Since no significant differences were found between
the mean scores after adjustment for ITED scores, on
the criterion variable tests of the two treatments, it
is concluded that the substitution of twelve hours
simulator instruction for three of the six hours of
behind-the-wheel instruction is not detrimental to the
driver education program. In view of the fact that a
considerable financial saving can be realized utiliz-
ing the simulator approach, and that the quality of
74

,
75
the product is apparently maintained, school dis-
tricts with similar populations should be encouraged
to investigate the possibility of the simulator
approach.
2. Since no significant differences were found between the
mean scores after adjustment for the ITED scores on
the criterion variable tests of the groups when
classified by sex, ethnicity, or socioeconomic status,
it is concluded that the methodof instruction is
equally effective for each of the classification
breakdowns. It is recognized that differences do
exist in performance levels of ethnic groups but when
differences in achievement are controlled statistically
in the analysis of the data, there is no difference in
performance due to the method of instruction.
3. The existence of a significant first-order inter-
action on the attitude criterion test for the treat-
ment by socioeconomic combination and the subsequent
identification of the subclass of disadvantaged
student taught by the traditional method as the major
contributor to the significant differences indicate a
more mature attitude is transferred to the disadvantaged
student through a more personal contact with the instruc-
tor than by the rather impersonal simulator technique.
the basis for judging the responses to be of a more

mature attitude toward safe driving practices was
that this group scored some thirteen points closer
to the standard score established by a group of
traffic experts than the other three groups. This
attitude is probably due to the utilitarianism of
the vehicle as perceived by the disadvantaged stu-
dent rather than as a means of pleasure.
4. Since no significant first-order interactions were
observed for any of the other main effect combina-
tions, it is concluded that no combination of the
main effect variables interacts in such a manner as
to produce a significant advantage or disadvantage
on performance scores for any subpopulation within
the combination.
III. RECOMMENDATIONS
76
The results of a cost study conducted in January 1969 on the
El Paso Public School Driver Education Program indicated that there
would be a considerable savings in per-pupil expenditure utilizing
the simulator to replace part of the behind-the-wheel instruction.
The results of this study imply that there is no apparent differ-
ence in the quality of instruction between the two teaching tech-
niques, nor is there any advantage of one treatment over the other
when applied to specific populations. Therefore, it is recommended
that the administrators in the El Paso Public School System adopt

77
the simulator approach to teaching the laboratory phase of the
driver education program. In so doing they will be enabled to
decrease the cost of per-pupil expenditure, increase the effi-
ciency of the operation, and be assured of maintaining quality
instruction in the program.
The following recommendations for further research on driver
education programs are made:
1. That further studies be made on the simulator
approach to teaching the laboratory phase of
the driver education program with varying ratios
of simulator time to behind-the-wheel instruction
time. The present ratio of 4:1 has been tested
and supported but not in comparison with other
ratios.
2. That further studies be made of the simulator
approach with additional classifications of the
student such as age, academic classification, and
previous driving experience be included in the
analysis to determine if interactions are masking
the true effects of the treatments under study.
3. That a procedure be developed to compare the
effectiveness of driver training programs in
terms of accident and traffic law violation
records.

78
4. That reliable pretest measures be developed for
measuring driving skill.
5. That more reliable data be obtained to adjust
for initial differences in the students which
may affect their performance on the criterion
variables.

J ./1,1, lor PO, Jrr 71 nr41., vo 4.1.01,111.,,,,,r,

80
A. BOOKS
Fryer, H. C. Concepts and Methods of Experimental Statistics.Boston: Allyn and Bacon, Inc., 1966.
Meyers, Jercme L. Fundamentals of Experimental Design. Boston:
Allyn and Bacon, 1966.
Popham, James W. Educational Statistics: Use and Interpretation.
New York: Harper and Row, 1967.
Steel, Robert, and James Torrie. Principles and Procedures of
Statistics. New York: McGraw-Hill Book Company, Inc., 1960.
B. PERIODICALS
Allen, William H. "Audio-Visual Communication," Encyclopedia of
Educational Research, pp. 115-37. 3rd ed. New York: The
Macmillan Company, 1960.
Box, G. E. P. "Non-Normality and Tests on Variance," Biometrika,
40:318-335, 1953.
Cochran, William G. "Analysis of Covariance: Its Nature and
Uses," Biometrics, 13(3):261-81, September, 1957.
Friedhoff, W. H. "Relationships Among Various Measures ofSocioeconomic Status, Social Class Identification, Intelli-gence and School Achievement," Dissertation Abstracts,
15:2098, 1955.
Grambs, Jean D., and Walter B. Waltjen. "Being Equally Different:
A New Right for Boys and Girls," National Elementary Principal,46(2):59-67, November, 1966.
Knief, Lotus M., and James B. Stroud. "Intercorrelations AmongVarious Intelligence, Achievement and Social Class Scores,"
Journal of Educational Psychology, 50(3):117-20, 1959.
Mariani, Thomas J. "The Effectiveness of Three Methods of Prac-tice Driving Instruction in Driver Education," DissertationAbstracts, 25:3439, 1965.

81
Noll, Victor H. "Relation Qf Scores cn Davis-Eells Games toSocioeconomic Status, Intelligence Test Results, and School
Achievement," Educational and Psychological Measurement,
20(1):119-29, 19EG.
Upshur, J. A. "Cross-Cultural TestingWhat to Test," Language
Learning, A Journal of Aorlied Linguistics, 16(3-4):1E3-496,
196E.
C. PUBLICATIONS OF THE GOVERNMENT, LEARNED SOCIETIES,AND OTHER ORGANIZATIONS
Association of Casualty and Surety Companies, Accident PreventionDepartment. What Everyone Should Know About High School
Driver Education. New York: The Association, 1959.
Bishop, Richard W. Evaluating Simulator Instruction for Accom-
plishing Driver Education Objectives. Tallahassee, Florida:
Florida Institute for Continuing University Studies, 1963.
Boyer, Richard. Simulator Presents, Student Resconds, and
Instructor Evaluates. Reprint from Traffic Digest and Review.
Evanston, Illinois: Northwestern University, February, 1964.
Center for Safety Education. National Test in Driver Education.
New York: New York University, 1963.
. Revised Scoring Method for the Siebrecht Attitude Scale.New York: Division of General Education, Nevi York University,
1958.
Coleman, James S., et al. Equality of Educational Opcortunity.United States Department of Health, Education and Welfare.
Washington: Government Printing Office, 1966.
Curtis, Carroll A., and Robert B. Hayes. "Immediate Learning
Reinforcement in a Complex Mental-Motor Skill," DriverTraining Using Motion Pictures, Phase III. Final Report.
Harrisburg, Pennsylvania: Department of Public Instruction,
March, 1967.
Educational Policies Commission. Mass Communication and Education.
Washington: National Education Association, 1958.
Fox, James H. Driver Education and Driving Simulators. National
Commission of Safety Education, National Education Association.
Washington: National Education Association, 1960.

82
Grebler, Leo. The Schooling Gap: Signs of Progress. AdvanceReport No. 7 of the Mexican-American Study Project, GraduateSchool of Business Administration, University of California.Los Angeles: University of California, 1967.
Harvey, Walter R. Least-Squares Analysis of Data with UnequalSubclass Numbers. United States Department of Agriculture,ARS 20-8. Beltsville, Maryland: Agricultural Research Ser-vice, 1960.
Hughes, John F. (director). Title I Program Guide No. 36Division of Compensatory Education, United States Departmentof Health, Education and Welfare. Washington: GovernmentPrinting Office, 1968.
Kearney, Paul W. Why Driver Education Is a Must. Reader's Digestreprint, "Why Driver Education Is a Must," October, 1964, fromParents' Magazine. Pleasantville, New York: Reader's DigestAssociation, Inc., 1964.
Lavin, David E. The Prediction of Academic Performance. NewYork: Russell Sage Foundation, 1965.
Los Angeles City Schools. An Evaluation of the Teaching Effective-ness of the Aetna Drivotrainer. Los Angeles: Los Angeles CitySchools, 1955.
Maccoby, Eleanor (ed.). The Development of Sex Differences. Stan-ford, California: Stanford University Press, 1966.
Manuel. Hershel T. Spanish-Speaking Children of the Southwest.Austin: University of Texas Press, 1965.
National Commission on Safety Education. A Critical Analysis ofDriver Education Research. Washington: National EducationAssociation, 1957.
National Education Association. The Invisible Minority. Reportof the National Education Association Tucson Survey on theTeaching of Spanish to the Spanish-Speaking. Washington:National Education Association, 1966.
New York University. Manual of Directions, Siebrecht AttitudeScale. New York: New York University, n.d.
Neyhart, Amos E. Driving Skill Exercises for Use with PassengerCars and Commercial Vehicles. Washington: American AutomobileAssociation, 1961.

83
Rhum, Gordon J., B,rtram J. Woodcock, and Tom A. Lemke. The Effec-
tiveness of the Aetna Drivotrainer in Driver Education. CedarFalls, Icma: Iowa State Teachers College, July, 1956.
Siebrecht, E. B. Siebrecht Attitude Scale. New York: Center forSafety Education, New York University, 1941.
Texas Education Agency. Standards for an APproved Course in DriverEducation for Texas Schools. Bulletin 615. Austin: The
Agency, 1961.
United States Bureau of the Census. U.S. Census of Population:
1960. Subjects' Reports, Persons of Spanish Surnames. Final
Report PC(2)-1B. Washington: Government Printing Office, 1963.
D. UNPUBLISHED MATERIALS
Anderson, James G., and William H. Johnson. "Sociocultural Deter-minates of Achievement Among Mexican-American Students." An
Interim Report of the Mathematics Education Program Preparedfor the National Conference of Educational Opportunities for
Mexican-Americans. Austin, Texas, April 25-26, 1968.
Board, Donald M. "Fall Term, 1965-1966." Report No. 1 of DriverEducation Research Project, Houston Independent School Dis-
trict, 1966.
. "Final Report of Instructional Program." Report No. 2
of Driver Education Research Project, Houston IndependentSchool District, 1966.
. "Driver Performance Analysis." Report No. 3 of DriverEducation Research Project, Houston Independent School Dis-
trict, 1967.
Doss, James Karl. "A Study of the Value of Driver Education."Unpublished Doctoral dissertation, Oklahoma State University,Stillwater, 1964.
Fletcher, Harry David. "Instruction by Film Demonstrations andLive Demonstrations in the Teaching of Selected AutomobileDriving Skills." Unpublished Doctoral dissertation, Pennsyl-vania State University, University Park, 1965.
Gustafson, Robert E. "A Study to Compare the Effectiveness of Instruc-tion in the Allstate Good Driver Trainer and in the Multiple-CarOff-Street Driving Range." Unpublished Doctoral dissertation,Michigan State University, East Lansing, 1965.

84
Gutshall, Robert William. "An Exploratory Study of the Inter-
relations Among Driving Ability, Driving Exposure and Socio-
economic Status of Low, Average and High Intelligence Males."
Unpublished Doctoral dissertation, Michigan State University,
East Lansing, 1967.
Hall, David C. "A Cost Analysis of a Driver Education Program."
Paper prepared for the Region XIX Education Service Center,
El Paso, Texas, February, 1969.
Lamkin, F. D. "A Personality Variable of Pre-adolescent Youth in
Relation to the Elementary School Program." Final Report,
Virginia University, Charlottesville, School of Education,
1967.
Lanik, Everett J. "Cost Analysis of Driver Education Programs
Conducted in the Houston Independent School District for the
School Year 1967-1968, Summer 1968." Houston, Texas: Houston
Independent School District, 1968. (Mimeographed.)
Long, Teresa Lozano. "Development of Instruments for the Evalua-
tion of Driver Education." Unpublished Doctoral dissertation,
University of Texas, Austin, 1965.
McIntosh, Edward Roy. "A Study of the Efficiency and Effective-
ness of Four Different Modes of Instruction in Providing
Learning Experiences for High School Driver Education Stu-
dents." Unpublished Doctoral dissertation, Michigan State
University, East Lansing, 1967.
Nolan, R. 0. "A Comparative Study of the Teaching Effectiveness
of the Multiple-Car Off-Street Range and Aetna Drivotrainer."
Unpublished Doctoral dissertation, Michigan State University,
East Lansing, 1965.
Seals, Thomas A. "An Evaluation of Selected Driver and Traffic
Safety Education Courses." Unpublished Doctoral dissertation,
Florida State University, Tallahassee, 1966.

E5
APPENDIX A
ETHNICITY QUESTIONNAIRE
1s
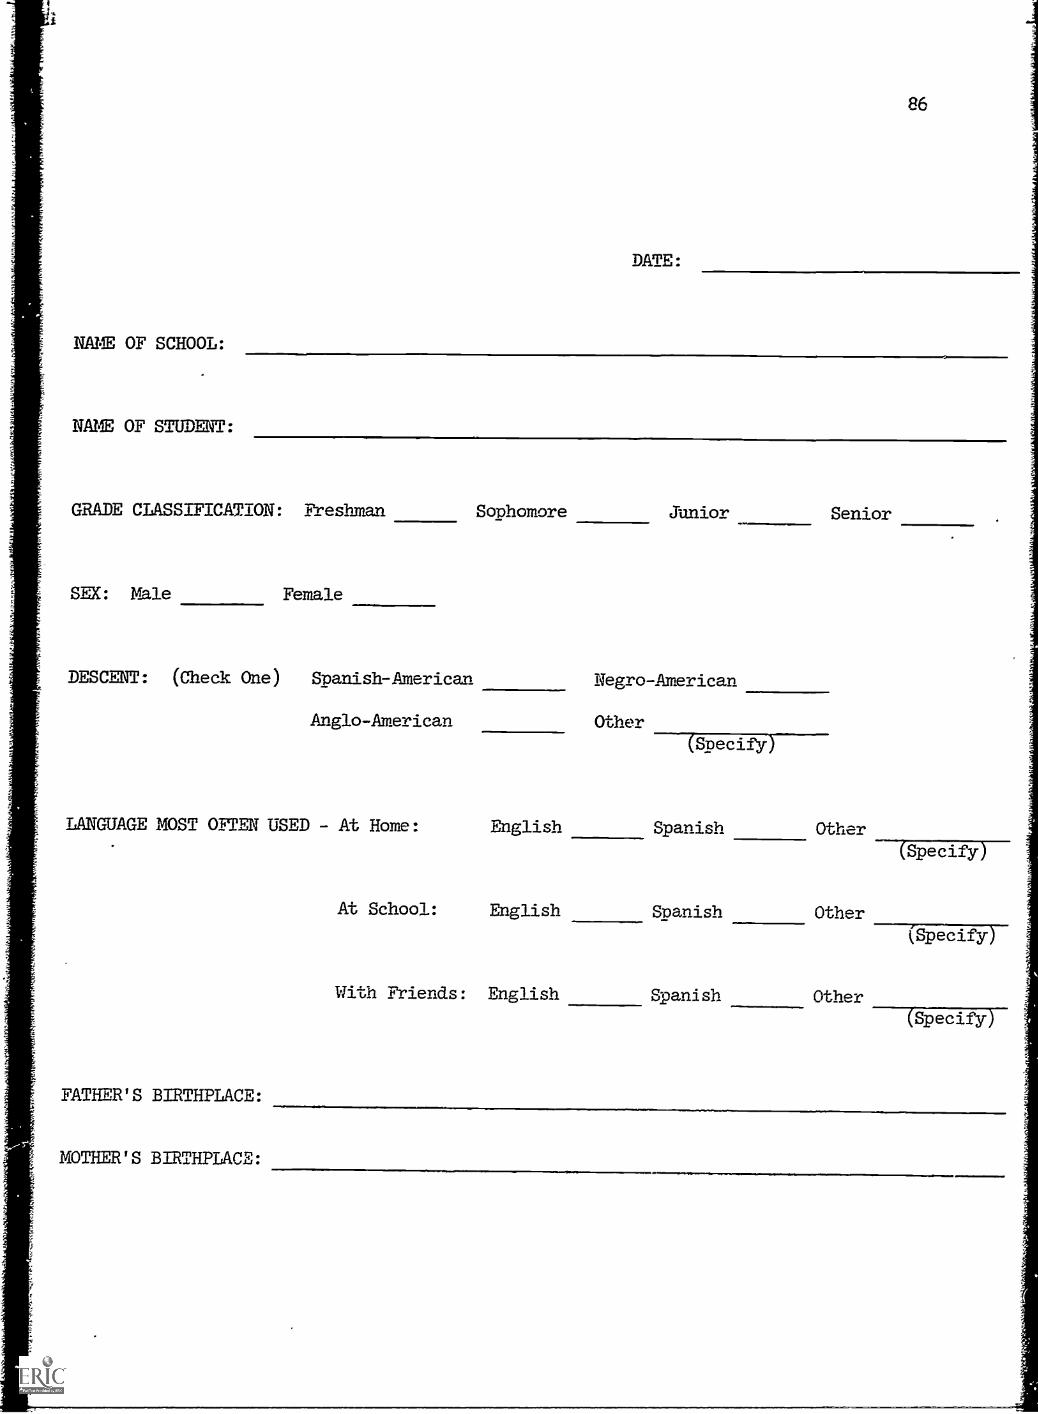
NAME OF SCHOOL:
NAME OF STUDENT:
GRADE CLASSIFICATION: Freshman
DATE:
86
Sophomore Junior Senior
SEX: Male Female
DESCENT: (Check One) Spanish-American Negro-American
Anglo-American Other
(Specify)
LANGUAGE MOST OFTEN USED - At Home: English Spanish Other
(Specify)
At School: English Spanish Other
(Specify)
With Friends: English Spanish Other(Specify)
FATHER'S BIRTHPLACE:
MOTHER'S BIRTHPLACE:

87
APPENDIX B
TESTING INSTRUMENTS

Testing Instruments for:
Knowledge
"National Test in Driver Education." Center
For Safety Education, Division of General
Education, New York University.
Attitude
"Siebrecht Attitude Scale." Elmer B. Siebrecht.
Center For Safety, School of Continuing Education
and Extension Services, New York University.
Skills
"Driving Skill Exercises for Use with Passenger
Cars and Commercial Vehicles." Amos E. Neyhart.
institute of Public Safety, The Pennsylvania State
University.
88/90

APPENDIX C
RAW SCORE MEANS AND ADJUSTED MEANS
FOP. CRITERION VARIABLES

TABLE XII
RAW SCORE MEANS AND LEAST SQUARES ESTIMATE OF ADJUSTED
MEANS FOR KNOWLEDGE CRITERION
Main Effect
Mean
Unadjusted Adjusteda
Treatment I 45.52 46.09 109
Treatment II 45.33 46.13 160
Anglo 46.39 46.56 121
Mexican-American 44.61 45.66 148
Male 45.27 45.33 137
Female 45.55 46.89 132
Disadvantaged 45.10 46.96 61
Nondisadvantaged 45.50 45.26 208
aAdjusted for covariate, composite score on ITED.
92

93
TABLE XIII
RAW SCORE MaN3 Aviv LbAST SQUARES ESTIMATE OF AMSTEDMEANS FOR ATTITUDE CRITERION
Main Effect
Mean
NUnadjusted Adjusteda
Treatment I 155.85 161.85 109
Treatment II 155.73 155.33 160
Anglo 160.53 162.64 121
Mexican-American 151.90 154.55 148
Male 152.82 155.14 137Female 158.86 162.04 132
Disadvartaged 153.41 161.85 61
Nondisadvantaged 156.48 155.33 208
aAdjusted for covariate, composite score on ITED.

TABLE XIV
RAW SCORE MEANS AND LEAST SQUARES ESTIMATE OF ADJUSTEDMEANS FOR SKILL CRITERION
Main Effect
Mean
Unadjusted Adjusteda
Treatment I 22.48 21.94 109
Treatment II 23.28 23.36 160
Anglo 23.35 22.71 121
Mexican-American 22.63 22.59 148
Male 23.91 23.46 137
Female 21.95 21.84 132
Disadvantaged 22.77 22.44 61
Nondisadvantaged 23.00 22.86 208
aAdjusted for covariate, composite score on ITED.
94

TABLE XV
RAW SCORE MEANS AND LEAST SQUARES ESTIMATE OF ADJUSTEDMEANS FOR KNOWLEDGE CRITERION
Interaction EffectMean
NUnadjusted Adjusteda
Treatment I by Anglo 47.73 46.64 44Treatment I by Mexican-American 44.03 45.34 65Treatment II by Anglo 45.62 46.28 77Treatment II by Mexican-American 45.06 45.98 83
Treatment I by Male 44.20 45.00 49Treatment I by Female 46.60 47-16 60Treatment II by Male 45.66 45.66 88Treatment II by Female 44.68 46.60 72
Treatment I by Disadvantaged 44.42 46.86 24Treatment I by Nondisadvantaged 45.84 45.32 85Treatment II by Disadvantaged 45.54 47.06 37Treatment II by Nondisadvantaged 45.27 45.20 123
Anglo by Male 46.69 45.15 54Anglo by Female 46.15 47.97 67Mexican-American by Male 44.35 45.51 83Mexican-American by Female 44.94 45.81 65
Anglo by Disadvantaged 46.86 48.14 7Anglo by Nondisadvantaged 46.36 44.98 114Mexican-American by Disadvantaged 44.87 45.78 54Mexican-American by Nondisadvantaged 44.46 45.54 94
Male by Disadvantaged 46.00 46.10 39Male by Nondisadvantaged 44.98 44.56 98Female by Disadvantaged 43.50 47.82 22Female by Nondisadvantaged 45.96 45.96 110
aAdjusted for covariate, composite score on ITED.
95

TABLE XVI
RAW SCORE MEANS AND LEAST SQUARES ESTIMATE OF ADJUSTED
MEANS FOR ATTITUDE CRITERION
Interaction Effect
Mean
Unadjusted Adjusteda
Treatment I by Anglo 163.98 169.67 44
Treatment I by Mexican-American 150.35 154.03 65
Treatment II by Anglo 158.56 155.61 77
Treatment II by Mexican-American 153.11 155.05 83
Treatment I by Male 150.63 156.85 49
Treatment I by Female 160.12 163.59 60
Treatment II by Male 154.03 153.43 88
Treatment II by Female 157.81 157.23 72
Treatment I by Disadvantaged 154.58 169.37 24
Treatment I by Nondisadvantaged 156.21 154.31 85
Treatment II by Disadvantaged 152.65 154.32 37
Treatment II by Nondisadvantaged 156.66 156.34 123
Anglo by Male 157.35 157.67 54
Anglo by Female 163.09 167.61 67
Mexican-American by Male 149.87 152.61 83
Mexican-American by Female 154.49 156.47 65
Anglo by Disadvantaged 157.71 168.41 7
Anglo by Nondisadvantaged 160.70 148.77 114
Mexican-American by Disadvantaged 152.85 163.39 54
Mexican-American by Nondisadvantaged 151.35 153.79 94
Male by Disadvantaged 154.72 159.27 39
Male by Nondisadvantaged 152.06 151.01 98
Female by Disadvantaged 151.09 164.43 22
Female by Nondisadvantaged 160.41 159.65 110
aAdjusted for covariate, composite score on ITED.
96

97
TART== XVII
RAW SCORE MEANS AND LEAST SQUARES ESTIMATE OF ADJUSTEDMEANS FOR SKILLS CRITERION
Interaction Effect
Mean
Unadjusted Adjusteda
Treatment I by Anglo 23.09 21.73 44Treatment I 1-:y Mexican-American 22.06 22.15 65Treatment II by Anglo 23.49 23.15 77Treatment II by Mexican-American 23.07 23.57 83
Treatment I by Male 23.55 22.80 49Treatment I by Female 21.60 21.08 60Treatment II by Male 24.11 24.10 88Treatment II by Female 22.25 22.62 72
Treatment I by Disadvantaged 21.83 21.92 24Treatment I by Nondisadvantaged =2.66 22.58 85Treatment II by Disadvantaged 23.38 23.58 37Treatment II by Nondisadvantaged 23.24 23.14 123
Anglo by Male 23.81 22.74 54Anglo by Female 22.97 22.68 67Mexican-American by Male 23.98 24.18 83Mexican-American by Female 20.91 21.00 65
Anglo by Disadvantaged 23.71 22.43 7Anglo by Nondisadvantaged 23.32 22.99 114Mexican-American by Disadvantaged 22.65 22.45 54Mexican-American by Nondisadvantaged 22.62 22.73 94
Male by Disadvantaged 24.03 23.23 39Male by Nondisadvantaged 23.87 23.69 98Female by Disadvantaged 20.54 21.65 22Female by Nondisadvantaged 22.23 22.03 110
aAdjusted for covariate, composite score on ITED.