Audience Atlas Victoria - Home | Creative...
21
Audience Atlas Victoria Appendix 3: Comparisons to the 2011 National Audience Atlas April 2014
Transcript of Audience Atlas Victoria - Home | Creative...

Audience Atlas VictoriaAppendix 3:Comparisons to the 2011 National Audience Atlas
April 2014
2 Audience Atlas Victoria – Appendix 3: 2011 comparisons
The Australian culture market is largeThe current Australian market for arts and culture is significant, with approximately 9 in 10 adults stating that they have been to at least one cultural event or place within the past 3 years.Overall, 87% of adult Australians (16 and over) which equates to 13.73 million people are in the current market for arts, culture and heritage.
This compares with 95% of adults in theNew Zealand market and 85% of adults in theUnited Kingdom market.
State market size ranges from a high of 93% of the adult population in Australian Capital Territory, who have taken part in at least one cultural activity within the past three years, to 84% of the adult population in South Australia.
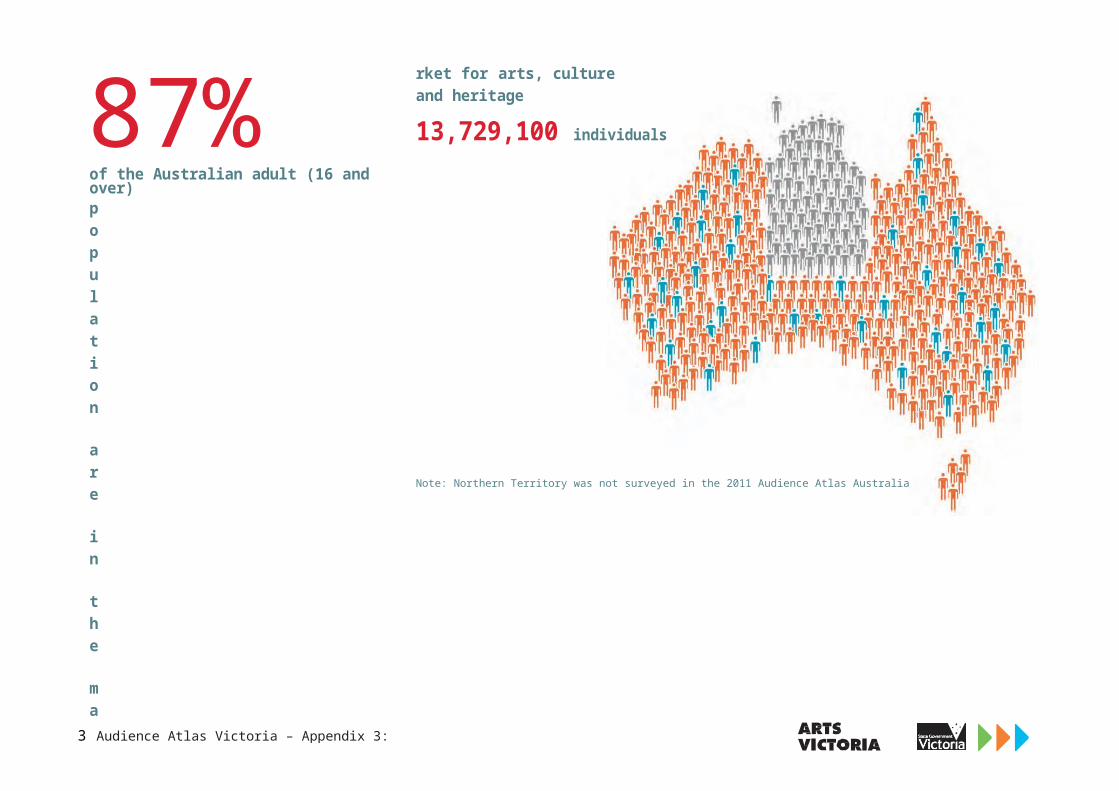
87%of the Australian adult (16 and over)population are in the market for arts, culture and heritage
13,729,100 individuals
Note: Northern Territory was not surveyed in the 2011 Audience Atlas Australia
3 Audience Atlas Victoria – Appendix 3: 2011 comparisons
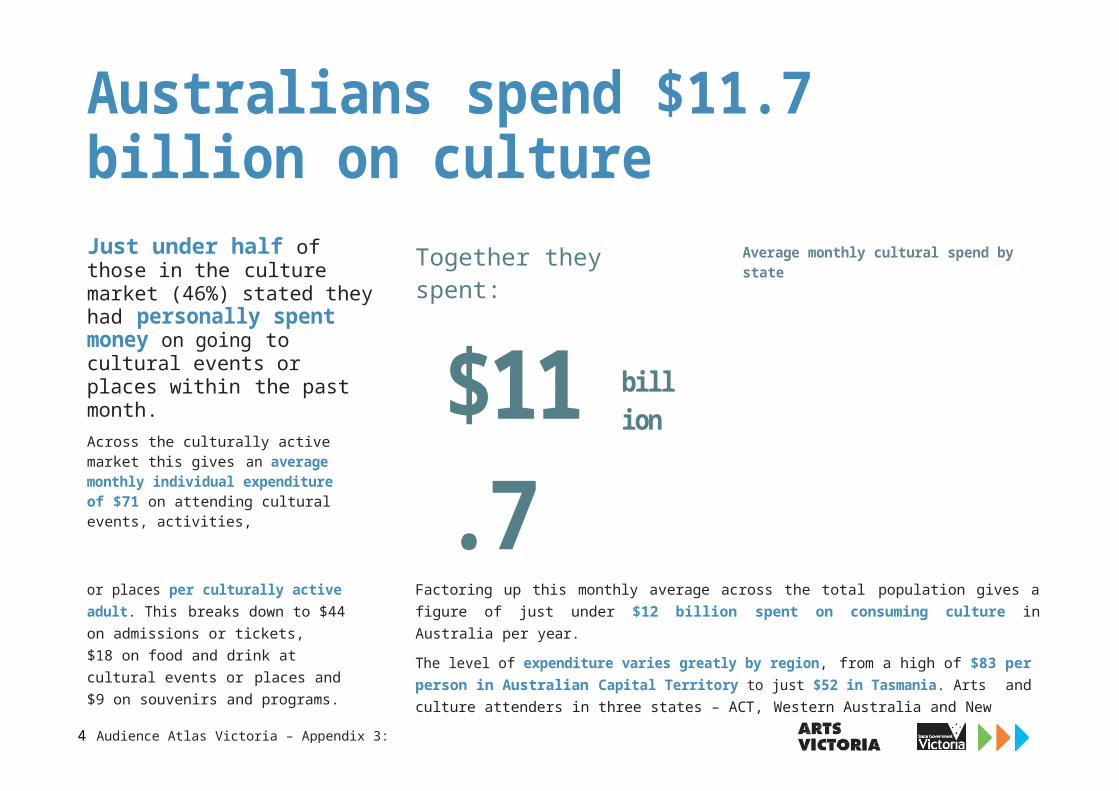
Australians spend $11.7 billion on cultureJust under half of those in the culture market (46%) stated they had personally spent money on going to cultural events or places within the past month.Across the culturally active market this gives an average monthly individual expenditure of $71 on attending cultural events, activities,
Together they spent:
$11.7
billion
Average monthly cultural spend by state
or places per culturally active adult. This breaks down to $44 on admissions or tickets,$18 on food and drink at cultural events or places and $9 on souvenirs and programs.
Factoring up this monthly average across the total population gives a figure of just under $12 billion spent on consuming culture in Australia per year.
The level of expenditure varies greatly by region, from a high of $83 per person in Australian Capital Territory to just $52 in Tasmania. Arts and culture attenders in three states – ACT, Western Australia and New
South Wales – spent more than the national monthly average of$71, while arts and culture attenders in Victoria spent $70, just under the national average.
Western Australia $81
New South Wales $75
Victoria $70
Queensland $67
South Australia $58
Tasmania $52
4 Audience Atlas Victoria – Appendix 3: 2011 comparisons
On arts, culture and heritagein the past 12 months
Admission Food & drink Shopping
Western Australia $81
New South Wales $75
Victoria $70
Queensland $67
South Australia $58
Tasmania $52

5 Audience Atlas Victoria – Appendix 3: 2011 comparisons
National support for the arts is significant67% of the culture market donates to arts and cultural organisations. 12% are regular donors and 55% occasionally donate. 33% of the culture market have never donated to an arts and cultural organisation.Market support for the arts takes a number of forms. Support ranges from purely transactional expenditure and membership, through to giving money and time.
More information about the ways that different people donate their time and money can be found in the Culture Segments pen portraits. The following charts and tables outline the proportion of the culture market that support the arts ineach way at a national and regional level.
Taken together the charts demonstrate that support for the arts is significant across the cultural market at a national level, and that there are some interesting differences in support for the arts at a state and city level.
Frequency of donation to the arts by state
State Regularly Occasionally Never
Western Australia 17% 52% 31%
ACT 15% 60% 25%
New South Wales 12% 55% 33%
Tasmania 12% 60% 27%
Queensland 12% 57% 31%
South Australia 11% 51% 38%
Victoria 10% 53% 36%
People are most likely to donate regularly to arts and cultural organisations in Western Australia and Australian Capital Territory, and least likely in South Australia and Victoria.
6 Audience Atlas Victoria – Appendix 3: 2011 comparisons
10%10%
7%
9%New Zealandculture market
26%
12%
10% 17%
14% 9%
12%
13%United Kingdomculture market11%
11%
17%12%
26% of the culture market are ExpressionThe national Culture Segment profile at the time of the Audience Atlas Australia survey in 2011, showed
Culture Segment profile of the Australian culture market compared to the New Zealand and UK culture market segment profiles
that 70% of the culture market were in the four most culturally active segments; Expression,
10%
5%739k
8%1044k
10%1437k
Essence, Stimulation and Affirmation.More than 1 in 4 adult Australians (15+) in the current market for culture are in the highly culturally-active Expression segment, making it an important segment for most arts, cultural and heritage organisations.
The Culture Segment profile for the culture market in Australia is broadly similar to New Zealand, but there are significant differences between Australia and New Zealand and the UK segment profile. In particular the Expression segment is proportionally more than double the UK in both Australia and New Zealand.
It is heartening for arts organisations in Australia that the segment profile of arts
attenders in Australia is more culturally acti
ve and less risk
averse compared to the UK market as a whole.
1337K
14%1931k
7%951K

7 Audience Atlas Victoria – Appendix 3: 2011 comparisons
Australian culture market
20%2711k
Essence Expression Affirmation Enrichment Stimulation Release Perspective Entertainment
26%3577k
Base [5468]
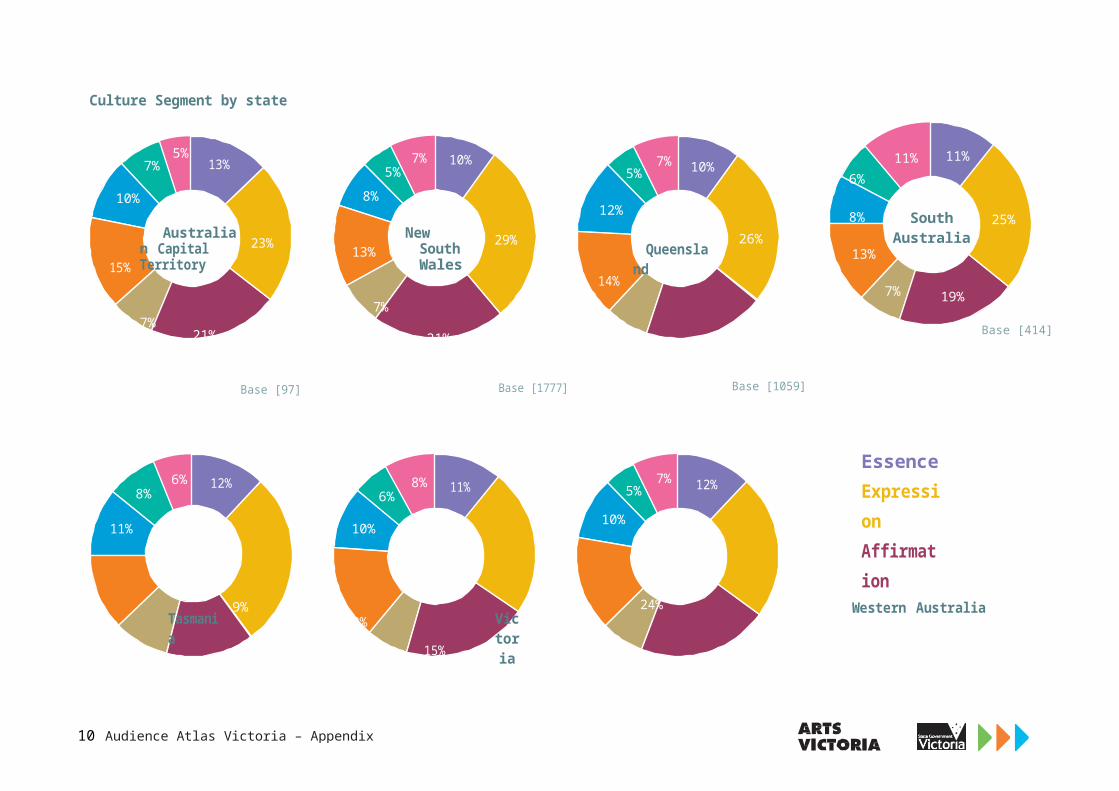
The charts on the following p
age are the individual state Culture Segment profiles which highlights some interesting differences across the states.
Unsurprisingly, the states with the smallest populations (Australian Capital Territ
ory and Tasmania) exhibit the most
significant differences to the national profile.

11% 11%
6%
8% SouthAustralia
25%
13%
7% 19%
Base [414]
8 Audience Atlas Victoria – Appendix 3: 2011 comparisons
Culture Segment by state
5%7%
10%
13% 7%
10%5%
8%
7%5%
12%
10%
15%
Australian Capital Territory
7%21%
23% 13%
7%
New South Wales
21%
29%
14%
Queensland
7% 19%
26%
Base [97] Base [1777] Base [1059]
6%8%
11%
12% 8%6%
10%
11% 7%5%
10%
12%Essence Expression Affirmation
12%
Tasmania
9% 14%
28%
15%
Victoria
7% 20%
24%
15%
Western Australia
7%21%
23% EnrichmentStimulation Release Perspective Entertainment
Base [135] Base [1420] Base [565]

9 Audience Atlas Victoria – Appendix 3: 2011 comparisons
Changes to the Victorian culture marketThe Victorian culture market has changed slightly over the past two years. Most likely due to changes to the demographic profile of the population; both the mean age and education levels have increased.
However the largest segments remain the most culturally active: Essence, Expression, Affirmation and Stimulation.
Stimulation is now the second-largest segment in the Victorian culture marketIn the 2011 Audience Atlas report, the segment profile of Victoria was broadly in line with the national average. Expression was the largest segment, accounting for around a quarter of the market (24%), followed by Affirmation at 20% for both Victoria and Australia as a whole.
Over the past two years, the proportion of the culture market accounted for by these two groups
2011 and 2013 Culture Segment breakdown for Victoria
has fallen slightly, with Expression dropping three percentage points to 21% and Affirmation experiencing the most significant change bydropping five percentage points to 15%. As a result there are very small changes to the other segment proportions; Stimulation is now the second largest segment in Victoria proportionally, rising to 16%, while Perspective and Enrichment both grew to become the fifth-equal largest segments at 9%.
There has also been an increase in cultural engagement with the proportion of people in the currentmarket for culture up 4% since 2011.
8% 11%6%
Compared to 2011 culture market in Victoria (percentage point difference)
Essence
Expression
8% 13%9%
10% -5 Affirmation
15%
Victoria 2011
24% Enrichment +2
Stimulation +1
9%Victoria
201321%
7% 20%
Base [1420] -1
P
erspe
ctive
Entertainment
Release
0
+
-
+
10 Audience Atlas Victoria – Appendix 3: 2011 comparisons
16%
9%
B[3841]
11 Audience Atlas Victoria – Appendix 3: 2011 comparisons
Average monthly cultural expenditure by the Victorian culture market
Although it isn’t clear what factors have contributed to these shifts in segment sizes, when we compare the demographic data from 2011 to 2013, we see slight changes in age and employment status that indicate that the 2013 Victorian culture market is older, more highly educated, and have higher incomes.
Specifically, the 2011 data showed that the broad age cohort profile of Victoria was identical to Australia as a whole, with 37% in the 16–34 age bracket and 47% in the 35–64 age bracket. In the 2013 data, this former group has decreased in size to 32% while the latter has risen to 54%.
Building on this, we have also seen an increase in people with higher educational qualifications and those in part-time or full-time employment, coupled with a fall in the proportion of students, which may likely be contributing factors to the changes in Victoria’s Culture Segment breakdown.
More than half of all cultural expenditure is on admissionThe average monthly spend within the Victorian culture market was $104.85, with nearly half this
amount being spent on admission and a quarter on food and drink.
Across the Culture Segments, total expenditure varied significantly. The highest spenders were Expression and Essence, whose monthly expenditure was in excess of $150, while Entertainment and Enrichment spent the least ($42.85 and $45.64 respectively).
Although the overall amount spent varied between segments, the proportion of the total spent on
different components was broadly similar. The proportion spent on admission, for instance, ranged from 44% (Expression) to 52% (Perspective and Enrichment). All segments spent the largest amount on admission, followed by food and drink, transport, and souvenirs in that order. It would therefore be inaccurate to think of any segmentas only attending free events or events close to home, although there may be tendencies towards this. For more detailed information regardingthe segments’ attitudes, preferences, needs and
Admission Food and drink Transport Souvenirs and programs
Total
Culture Market $50.36 $24.65 $19.88 $9.96 $104.85
Essence $73.37 $33.95 $32.91 $12.55 $152.78
Expression $69.01 $36.98 $32.05 $19.03 $157.07
Affirmation $54.09 $26.64 $16.33 $8.60 $105.99
Enrichment $23.53 $9.10 $8.00 $5.01 $45.64
Stimulation $58.79 $28.23 $20.24 $10.48 $117.74
Release $28.14 $15.94 $10.18 $4.35 $58.61
Perspective $30.19 $11.80 $11.15 $4.43 $57.57
Entertainment $21.85 $10.19 $8.28 $2.53 $42.85

12 Audience Atlas Victoria – Appendix 3: 2011 comparisons
Intended expenditure on arts and culture over the next 12 months
behaviours please refer to Appendix 2: Culture Segments Victoria.
While the 2011 survey produced data on average monthly spend for Australia, this excluded the travel component. It did show, however, that the$70 monthly cultural spend of the Victoria arts and culture market was the nearest of any state or territory to the national average ($71). The proportions spent on the different components by the Victoria arts and culture market in 2013 has increased slightly to $84.97 (excluding transport). The figures suggest that Victorians may spend a higher proportion on food and drink and slightly less on admission and souvenirs.
The two segments who spend the most– Essence and Expression – are more likely to spend more in the coming yearJust under half of the Victorian culture market said they would spend a similar amount on arts and culture in the next 12 months compared to the previous 12 months, with 19% saying they would spend less and 17% anticipating a higher spend.
Essence and Expression were the two segments most likely to anticipate spending more in the
I’m likely to spend less
I’m likely to spend more
I’m likely to spend the same amount
Don’t know
Culture Market 19% 17% 47% 17%
Essence 11% 27% 51% 11%
Expression 16% 27% 46% 12%
Affirmation 21% 18% 46% 16%
Enrichment 17% 9% 47% 28%
Stimulation 19% 19% 50% 12%
Release 24% 11% 39% 27%
Perspective 22% 5% 49% 24%
Entertainment 27% 4% 45% 24%

13 Audience Atlas Victoria – Appendix 3: 2011 comparisons
next 12 months, whi
le the segments least likely to anticipate spending more (Entertainment,Perspective, Enrichment and Release) did not necessarily anticipate spending less, but were less certain about future spending than other groups.

14 Audience Atlas Victoria – Appendix 3: 2011 comparisons
Over half of the culture market donate money to the artsAround 8% of the culture market donate regularly to arts and culture, either by standing order
Donation behaviour of the culture market in Victoria
By standing order2% of the culture marketdonate by standing order 7%
Never
Always7% of the culture market donate money every time they visit a gallery, museum, exhibition or heritage site
or whenever they visit a cultural site. A further 51% reported donating occasionally, with the remaining 42% never donating. These figures suggest that tendency to donate has declined since the 2011 study, where 10% gave regularly and a further 53% occasionally. Although national figures are unavailable for 2013, the 2011 study showed that Victorians were the Australians least likely to donate regularly, and among the most likely never to do so.
The segments most likely to donate money regularly were Expression (14%) and
42% never donate money to arts and culture
Rarely25% rarely donate money when they visit a gallery, museum, exhibition or heritage site
42%How often
do you donate to arts and culture?
25%
26%
[Base 3841]
Sometimes26% sometimes donate money when they visit a gallery, museum, exhibition or heritage site
Essence (11%). These two segments were also the least likely never to give.
Nearly a third of the culture market are likely to volunteer for an arts and culture organisation in the next yearAround one in six respondents (17%) had volunteered their time to help arts or
culture at some time in the past, with 6% having done so in the previous 12 months. Almost a third of respondents (32%) said they would be either very or quite likely to volunteer at some time in the future.
Expression and Essence were the segments most likely to have volunteered, with around a quarter having done so at some time previously (Essence 25%, Expression 28%). They were also the most
2
15 Audience Atlas Victoria – Appendix 3: 2011 comparisons
likely to anticipate volunteering in the next 12 months and the least likely to rule it out altogether.