DOC 09b IEA T40 Wood chip study 2012 05 30 final...
24
Transcript of DOC 09b IEA T40 Wood chip study 2012 05 30 final...
Authors
Patrick Lamers
Martin Junginger Copernicus Institute www.uu.nl/geo/copernicus
Didier Marchal Wallon Agricultural Research Centre
www.cra.wallonie.be
Peter Paul Schouwenberg RWE Essent
www.essent.eu
Maurizio Cocchi Etaflorence Renewable Energies www.etaflorence.it
Published in June 2012
Global wood chip trade for energy
Patrick Lamers*, Didier Marchal#, Peter-Paul
Schouwenberg§, Maurizio Cocchi°, Martin
Junginger*
* Copernicus Institute, Utrecht University # Wallon Agricultural Research Centre
§ RWE Essent
° Etaflorence Renewable Energies
Version 2.4 | May 30th
2012
Commissioned by:
IEA Bioenergy Task 40 Sustainable International Bioenergy
Trade
Available at: www.bioenergytrade.org
Table of contents
1. Background and aim ................................................................................................... 1
2. Methodology ............................................................................................................... 2
3. Classifications .............................................................................................................. 3
3.1. Commodity codes and definitions ...................................................................... 3
3.2. Industry standards .............................................................................................. 4
4. Dimensioning global wood chip trade ........................................................................ 5
5. Global wood chip trade ............................................................................................... 8
5.1. Europe ................................................................................................................. 8
5.1.1. Virgin wood chips ............................................................................................ 8
5.1.2. Wood chips from tertiary residues ................................................................. 9
5.2. Rest of the world ............................................................................................... 11
6. Phytosanitary measures ............................................................................................ 13
6.1. Historic wood chip bans .................................................................................... 13
6.2. The European Commission Standing Committee on Plant Health ................... 13
6.3. Recent US developments on eradicating nematodes in wood chips ............... 14
7. Summary and conclusions ........................................................................................ 15
References ........................................................................................................................ 17
Appendix ........................................................................................................................... 20
Disclaimer
This report was prepared by members of the IEA Bioenergy Task 40 on Sustainable
Bioenergy Trade. While utmost care has been taken when compiling the report, the
authors do not take any responsibility or legal liability upon the accuracy or
completeness of any information contained herein, or any consequences resulting
from actions taken based on the information presented in this report.
Global wood chip trade for energy – IEA Bioenergy Task 40
1
1. Background and aim Bioenergy currently contributes roughly 10% (around 50 EJ) to total global primary
energy supply [1]. While the majority of this share is for traditional cooking and
heating applications, 38% are regarded as ‘modern’ usage i.e. with higher conversion
efficiency and for the production of high temperature heating, power, or road
transportation [1-5]. Current policy frameworks, e.g. for GHG emission reduction or
the diversification of energy supply, imply a trend towards an increased utilization of
modern bioenergy. This includes a further replacement of traditional with modern
bioenergy usage. An increasing use of modern bioenergy will inevitably be
intertwined with large-scale international trading activities of bioenergy
commodities. A recent global review by Lamers et al. [6] on international solid
biofuel trade showed that net global solid biofuel trade grew sixfold from 56.5 PJ (3.5
Mtonnes) to 300 PJ (18 Mtonnes) between 2000 and 2010. Over this period, wood
pellets have clearly become the dominant solid biofuel commodity on international
markets [7]; whereas trade streams of wood waste, roundwood, and wood chips for
energy have been significantly smaller and practically limited to Europe [6]. Europe
remains the key region for international solid biofuel trade, covering around two
thirds of global net solid biofuel trade by 2010 [6].
Task 40 under the IEA Bioenergy Agreement1 contributes to the development of
sustainable biofuel markets on short and long term and on different scale levels. It
has published several studies on international biofuel trade in the past, among
others, a review of global pellet markets (see [7]).2 Wood chips are yet another
relevant global commodity for energy (see e.g. [6]), but their trade flows are heavily
interwoven with streams for other purposes (mainly pulp and paper production) and
little understood. Nevertheless, wood chips, given their diverse origin (pulp wood,
inferior wood, wood waste, etc.), range second to wood pellets in terms of total
volumes traded for energy.
This report has been commissioned to identify and present global data on wood chip
trade, to analyze the underlying trade patterns, and to conclude upon their
interactions with bioenergy policies. At the centre of the analysis is direct trade of
wood chips for modern bioenergy use in markets where respective policies are in
place. Whereas associated trade flows where the initial reason is not directly related
to energy usage, e.g., wood chips for pulp and paper of which a fraction ends up as
black liquor and is used for energy (see [8] for a distinction in the case of Finland) are
outlined to put the energy related trade into perspective, but not investigated in
detail.
1 http://www.ieabioenergy.com/
2 See http://www.bioenergytrade.org/ for more details

Global wood chip trade for energy – IEA Bioenergy Task 40
2
2. Methodology To dimension energy related wood chip trade, an upper limit was derived via
international commodity databases of the UN (COMTRADE [9]) and the EU
(EUROSTAT [10]) since they allow differentiations by trade code. FAO statistics [11]
are not categorized by trade codes. So only code-similar data could serve as a
benchmark to e.g. UN [9] statistics. Trade flow declarations on the import and export
side often vary within and across databases. Hence, for the upper limit the
respective maximum values (in any given year) were taken. International trade codes
(up to digit-8-level) so far do not allow a differentiation by end-use. Reported
volumes include energy related as well as other streams, e.g. for material purposes
in the case of wood chips, and are therefore generally considered as a (often largely
theoretical) upper limit of possible biofuel trade volumes. To obtain solely bioenergy
related production and trade streams, we relied on anecdotal evidence via
conference presentations, speeches, and/or interviews of internationally recognized
experts in the field from academia, consulting, and private market parties.
It is important to highlight that international trade codes are so far only harmonized
until digit-6-level. Hence, global trade volumes reported by international databases
can only cover this level of detail. Regional differentiations can be made at a higher
code level but were limited to the European Union (EU) since is covers the majority
of energy related international wood chip trade (see [6]).
Global wood chip trade for energy – IEA Bioenergy Task 40
3
3. Classifications
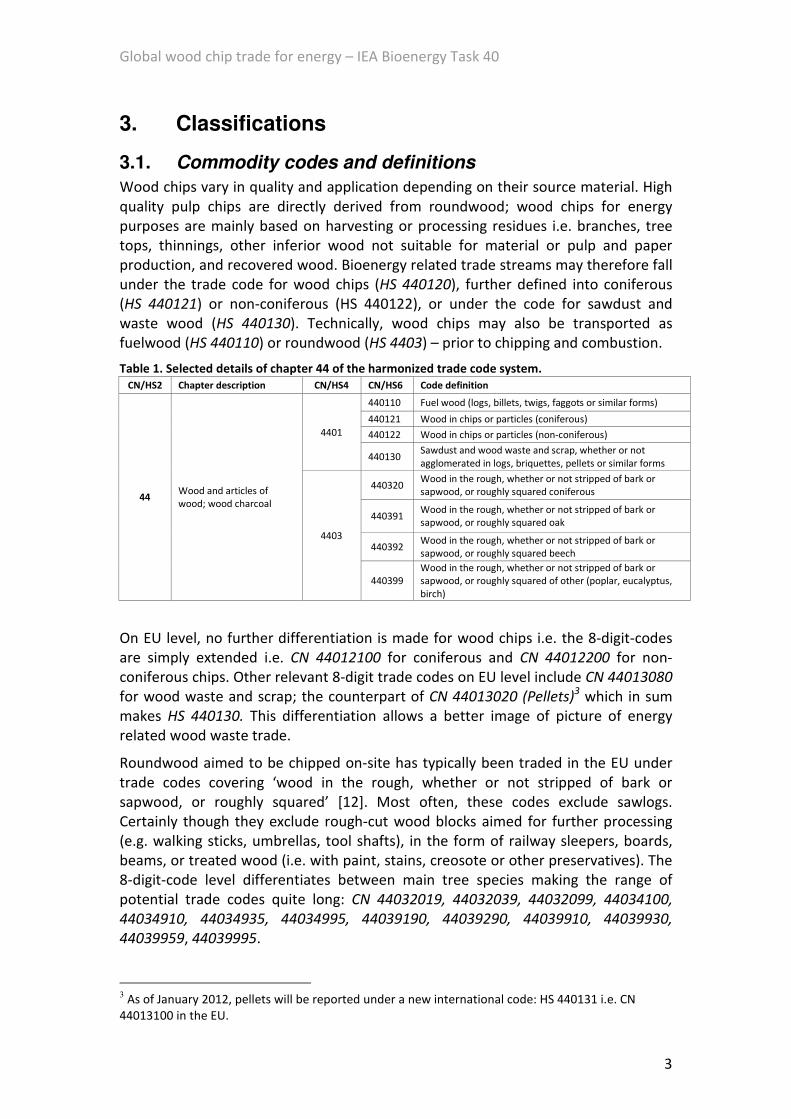
3.1. Commodity codes and definitions
Wood chips vary in quality and application depending on their source material. High
quality pulp chips are directly derived from roundwood; wood chips for energy
purposes are mainly based on harvesting or processing residues i.e. branches, tree
tops, thinnings, other inferior wood not suitable for material or pulp and paper
production, and recovered wood. Bioenergy related trade streams may therefore fall
under the trade code for wood chips (HS 440120), further defined into coniferous
(HS 440121) or non-coniferous (HS 440122), or under the code for sawdust and
waste wood (HS 440130). Technically, wood chips may also be transported as
fuelwood (HS 440110) or roundwood (HS 4403) – prior to chipping and combustion.
Table 1. Selected details of chapter 44 of the harmonized trade code system.
CN/HS2 Chapter description CN/HS4 CN/HS6 Code definition
44 Wood and articles of
wood; wood charcoal
4401
440110 Fuel wood (logs, billets, twigs, faggots or similar forms)
440121 Wood in chips or particles (coniferous)
440122 Wood in chips or particles (non-coniferous)
440130 Sawdust and wood waste and scrap, whether or not
agglomerated in logs, briquettes, pellets or similar forms
4403
440320 Wood in the rough, whether or not stripped of bark or
sapwood, or roughly squared coniferous
440391 Wood in the rough, whether or not stripped of bark or
sapwood, or roughly squared oak
440392 Wood in the rough, whether or not stripped of bark or
sapwood, or roughly squared beech
440399
Wood in the rough, whether or not stripped of bark or
sapwood, or roughly squared of other (poplar, eucalyptus,
birch)
On EU level, no further differentiation is made for wood chips i.e. the 8-digit-codes
are simply extended i.e. CN 44012100 for coniferous and CN 44012200 for non-
coniferous chips. Other relevant 8-digit trade codes on EU level include CN 44013080
for wood waste and scrap; the counterpart of CN 44013020 (Pellets)3 which in sum
makes HS 440130. This differentiation allows a better image of picture of energy
related wood waste trade.
Roundwood aimed to be chipped on-site has typically been traded in the EU under
trade codes covering ‘wood in the rough, whether or not stripped of bark or
sapwood, or roughly squared’ [12]. Most often, these codes exclude sawlogs.
Certainly though they exclude rough-cut wood blocks aimed for further processing
(e.g. walking sticks, umbrellas, tool shafts), in the form of railway sleepers, boards,
beams, or treated wood (i.e. with paint, stains, creosote or other preservatives). The
8-digit-code level differentiates between main tree species making the range of
potential trade codes quite long: CN 44032019, 44032039, 44032099, 44034100,
44034910, 44034935, 44034995, 44039190, 44039290, 44039910, 44039930,
44039959, 44039995.
3 As of January 2012, pellets will be reported under a new international code: HS 440131 i.e. CN
44013100 in the EU.
Global wood chip trade for energy – IEA Bioenergy Task 40
4
3.2. Industry standards
The European Committee for Standardization (CEN), under technical committee
TC335, has published 27 technical specifications (pre-standards) for solid biofuels
during 2003 – 2006 [13]. The next step is to upgrade these technical specifications to
full European standards. When European standards are in force, the national
standards have to be adapted to these standards. Wood chips can be specified
according to standard EN 14961-1 for general use. Demolition wood is not included
in the scope of the EN 14961-1, but in the scope of EN 14588 (used wood arising
from demolition of buildings or civil engineering installations). The EN 14961-1
includes also wood waste, if it is not containing halogenated organic compounds or
heavy metals as a result of treatment with wood preservatives or coating. The
following characteristics are described for specification of wood chips, in the frame
of EU 14961-1: origin (forest, plantation and other virgin wood; by-products and
residues from wood processing industry; used wood; blends and mixtures),
dimensions, moisture, ash content, nitrogen, chlorine, net calorific value, bulk
density, ash melting behaviour.
Global wood chip trade for energy – IEA Bioenergy Task 40
5
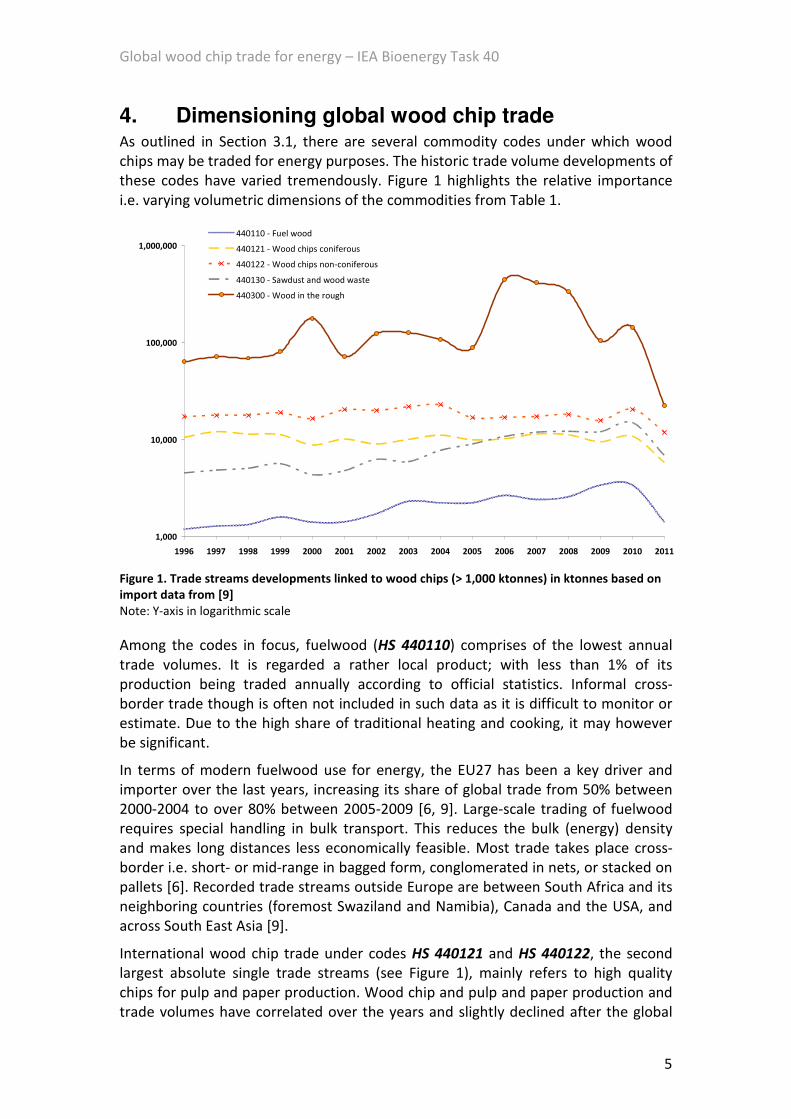
4. Dimensioning global wood chip trade As outlined in Section 3.1, there are several commodity codes under which wood
chips may be traded for energy purposes. The historic trade volume developments of
these codes have varied tremendously. Figure 1 highlights the relative importance
i.e. varying volumetric dimensions of the commodities from Table 1.
1,000
10,000
100,000
1,000,000
1996 1997 1998 1999 2000 2001 2002 2003 2004 2005 2006 2007 2008 2009 2010 2011
440110 - Fuel wood
440121 - Wood chips coniferous
440122 - Wood chips non-coniferous
440130 - Sawdust and wood waste
440300 - Wood in the rough
Figure 1. Trade streams developments linked to wood chips (> 1,000 ktonnes) in ktonnes based on
import data from [9]
Note: Y-axis in logarithmic scale
Among the codes in focus, fuelwood (HS 440110) comprises of the lowest annual
trade volumes. It is regarded a rather local product; with less than 1% of its
production being traded annually according to official statistics. Informal cross-
border trade though is often not included in such data as it is difficult to monitor or
estimate. Due to the high share of traditional heating and cooking, it may however
be significant.
In terms of modern fuelwood use for energy, the EU27 has been a key driver and
importer over the last years, increasing its share of global trade from 50% between
2000-2004 to over 80% between 2005-2009 [6, 9]. Large-scale trading of fuelwood
requires special handling in bulk transport. This reduces the bulk (energy) density
and makes long distances less economically feasible. Most trade takes place cross-
border i.e. short- or mid-range in bagged form, conglomerated in nets, or stacked on
pallets [6]. Recorded trade streams outside Europe are between South Africa and its
neighboring countries (foremost Swaziland and Namibia), Canada and the USA, and
across South East Asia [9].
International wood chip trade under codes HS 440121 and HS 440122, the second
largest absolute single trade streams (see Figure 1), mainly refers to high quality
chips for pulp and paper production. Wood chip and pulp and paper production and
trade volumes have correlated over the years and slightly declined after the global
Global wood chip trade for energy – IEA Bioenergy Task 40
6
financial crisis in 2008/2009 [6]. The top wood chip producing nations over the last
decade include Canada (37%), Australia (8%), Sweden (7%), Russia (6%), and
China/Finland (each 5%) [11]. All countries are also large pulp and paper producers.
A clear pulp and paper industry trend is the shift in production from the Northern to
the Southern hemisphere. The upcoming top wood chip producing nations will be
found in South America (e.g. Brazil) and South East Asia (e.g. Vietnam).
Pulp and paper related wood chip trade has been partly cross-border, e.g. within
Scandinavia, Finland-Russia, Canada-USA, but is increasingly driven by net wood
importing nations. In some years across the past decade, Japan has attracted over
50% of all globally traded wood chips [9]. Shares of aforementioned countries
(Canada, Sweden, Finland) are an order of magnitude smaller (i.e. below 5% of global
trade on average across 2000-2009) [9]. China is most likely going to become an even
large wood chip importer than Japan over the coming years.
The EU has also been a net importer of wood chips; sourcing mostly from Russia,
Uruguay, Brazil, and Canada [10]. Extra-EU trade streams have been largely directed
to Austria and Italy [9]. Sweden and Finland, two other major importers source
largely from within the EU or their border countries [10]. Top EU-exporters have
been Germany, Latvia, and Estonia [10]. The majority of European wood chip trade is
covered by high quality pulp chips. Bioenergy related trade though is believed to
rank second [12, 14, 15].
The trade category HS 440130 Sawdust and wood waste and scrap covers a large
variety of woody residues. As stated earlier, the majority of energy related trade is
linked to sawdust (and other processing residues) in the form of wood pellets. The
second largest fraction though ‘waste wood and scrap’, which technically can be in
the form of wood chips, has no standard definition (see Section 3.2). Thus, trade
data might include a variety of streams from harvesting and processing residues,
inferior (small diameter/low quality) roundwood to recycling/recovered wood [16].
Large scale international shipments of recycled wood for energy purposes are still
rare but have been known to occur. The majority of wood waste though appears to
have been landfilled, combusted locally, or traded short distances, mainly cross-
border. The key region for international wood waste trade is currently Europe;
primarily due to its differences in legal and bioenergy policy frameworks across the
individual Member States (see [6] for a review). Wood waste is generally not chipped
but rather crushed (at least partly) to minimize transportation costs [17].
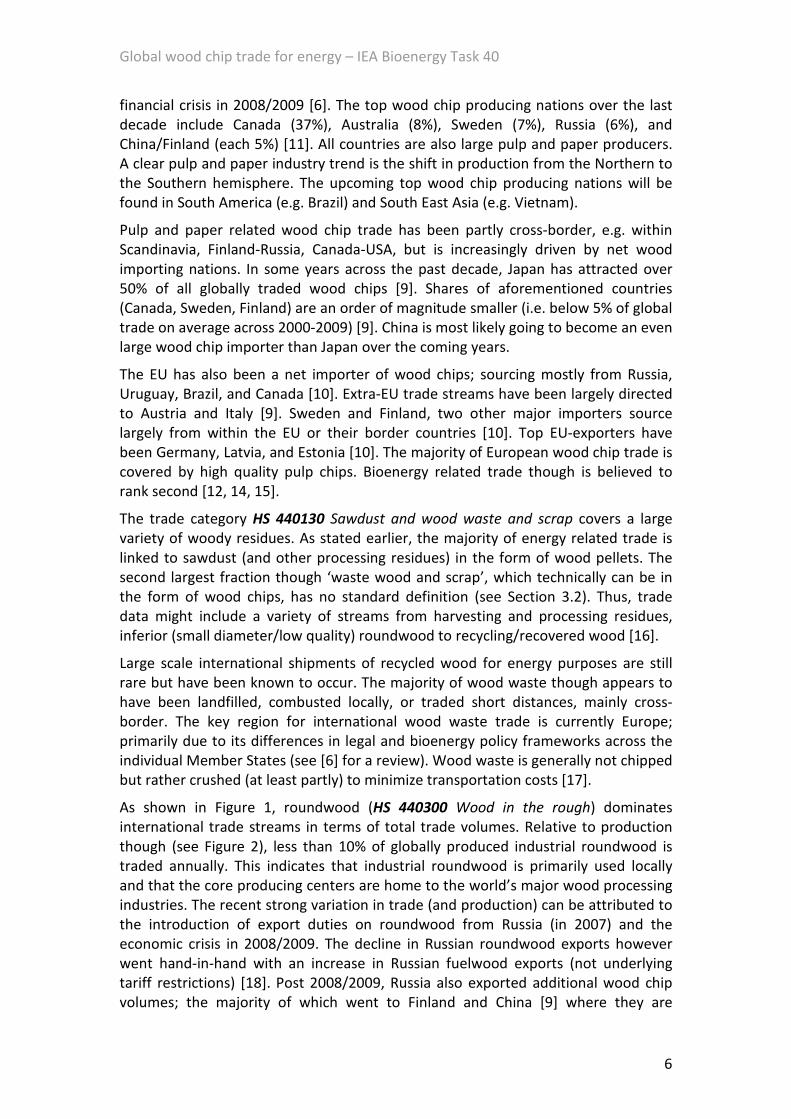
As shown in Figure 1, roundwood (HS 440300 Wood in the rough) dominates
international trade streams in terms of total trade volumes. Relative to production
though (see Figure 2), less than 10% of globally produced industrial roundwood is
traded annually. This indicates that industrial roundwood is primarily used locally
and that the core producing centers are home to the world’s major wood processing
industries. The recent strong variation in trade (and production) can be attributed to
the introduction of export duties on roundwood from Russia (in 2007) and the
economic crisis in 2008/2009. The decline in Russian roundwood exports however
went hand-in-hand with an increase in Russian fuelwood exports (not underlying
tariff restrictions) [18]. Post 2008/2009, Russia also exported additional wood chip
volumes; the majority of which went to Finland and China [9] where they are
Global wood chip trade for energy – IEA Bioenergy Task 40
7
exclusively used in pulp and paper production [19]. The majority of global
roundwood production and trade is not connected to wood chip trade for energy.
Nevertheless, there is a large amount of associated trade in the form of wood
processing residues (scraps, shavings) [8, 19].
Global solid biomass production [Mtonnes]
1,2831,217 1,244 1,280 1,327 1,383 1,341 1,352
1,2561,147
1,230
514
2322 23
2630
3938 41
39
3739
4645
5055
5963 64 66
64
6367
497493 497 500
502507
510 511
512
511
0
500
1,000
1,500
2,000
2,500
2000 2001 2002 2003 2004 2005 2006 2007 2008 2009 2010
Wood chips
Wood residues
Wood fuel
Industrial roundwood
Figure 2. World production of selected solid biomass types in Mtonnes (Data: [11])
Global wood chip trade for energy – IEA Bioenergy Task 40
8
5. Global wood chip trade
5.1. Europe
Largely due to recent energy policies, but also price competitiveness of wood fuels in
some regions, and a strong forestry sector, Europe has been the prime market for
energy related biomass trade over the past decade. Trade in wood waste,
roundwood, and wood chips for energy is practically limited to Europe [6].
5.1.1. Virgin wood chips
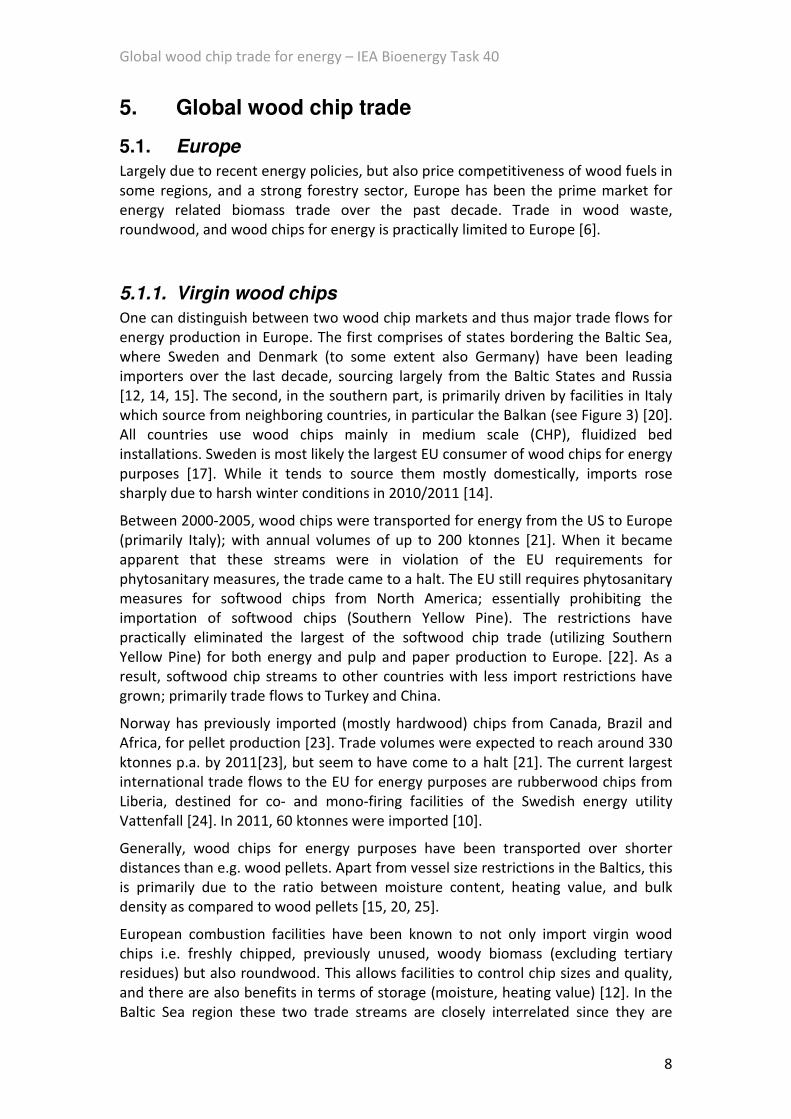
One can distinguish between two wood chip markets and thus major trade flows for
energy production in Europe. The first comprises of states bordering the Baltic Sea,
where Sweden and Denmark (to some extent also Germany) have been leading
importers over the last decade, sourcing largely from the Baltic States and Russia
[12, 14, 15]. The second, in the southern part, is primarily driven by facilities in Italy
which source from neighboring countries, in particular the Balkan (see Figure 3) [20].
All countries use wood chips mainly in medium scale (CHP), fluidized bed
installations. Sweden is most likely the largest EU consumer of wood chips for energy
purposes [17]. While it tends to source them mostly domestically, imports rose
sharply due to harsh winter conditions in 2010/2011 [14].
Between 2000-2005, wood chips were transported for energy from the US to Europe
(primarily Italy); with annual volumes of up to 200 ktonnes [21]. When it became
apparent that these streams were in violation of the EU requirements for
phytosanitary measures, the trade came to a halt. The EU still requires phytosanitary
measures for softwood chips from North America; essentially prohibiting the
importation of softwood chips (Southern Yellow Pine). The restrictions have
practically eliminated the largest of the softwood chip trade (utilizing Southern
Yellow Pine) for both energy and pulp and paper production to Europe. [22]. As a
result, softwood chip streams to other countries with less import restrictions have
grown; primarily trade flows to Turkey and China.
Norway has previously imported (mostly hardwood) chips from Canada, Brazil and
Africa, for pellet production [23]. Trade volumes were expected to reach around 330
ktonnes p.a. by 2011[23], but seem to have come to a halt [21]. The current largest
international trade flows to the EU for energy purposes are rubberwood chips from
Liberia, destined for co- and mono-firing facilities of the Swedish energy utility
Vattenfall [24]. In 2011, 60 ktonnes were imported [10].
Generally, wood chips for energy purposes have been transported over shorter
distances than e.g. wood pellets. Apart from vessel size restrictions in the Baltics, this
is primarily due to the ratio between moisture content, heating value, and bulk
density as compared to wood pellets [15, 20, 25].
European combustion facilities have been known to not only import virgin wood
chips i.e. freshly chipped, previously unused, woody biomass (excluding tertiary
residues) but also roundwood. This allows facilities to control chip sizes and quality,
and there are also benefits in terms of storage (moisture, heating value) [12]. In the
Baltic Sea region these two trade streams are closely interrelated since they are
Global wood chip trade for energy – IEA Bioenergy Task 40
9
often traded/transported on the same vessel [17, 26]; apart from ending up in
similar conversion facilities. Cold winters in Baltic Sea harbors though often lead to
ice build up, reducing the capability of northern harbors to receive or export woody
biomass. In some years this has led to increasing imports from Southern Europe to
Denmark and Sweden [12]. So far though, no extra-EU imports of roundwood for
energy purposes are known.
Wood chip and roundwood trade in Europe usually takes place directly between
supplier and consumer. Combustion plants taking wood chips are often located close
to waterways, allowing for a relatively economic transport of the comparatively
moist biofuel. Low water levels – especially in Baltic harbors – do not allow the
landing of large open-sea going vessels and therefore limit trade options primarily to
short-sea shipping (3-10 ktonnes) [17, 20, 26].
Figure 3. Dimensions of bioenergy related wood chip trade patterns in Europe based on [6, 9, 10,
14, 15, 17, 20, 23, 26]
Note: Trade streams towards Denmark, Germany and Sweden are also indicators for roundwood
trade volumes and routes.
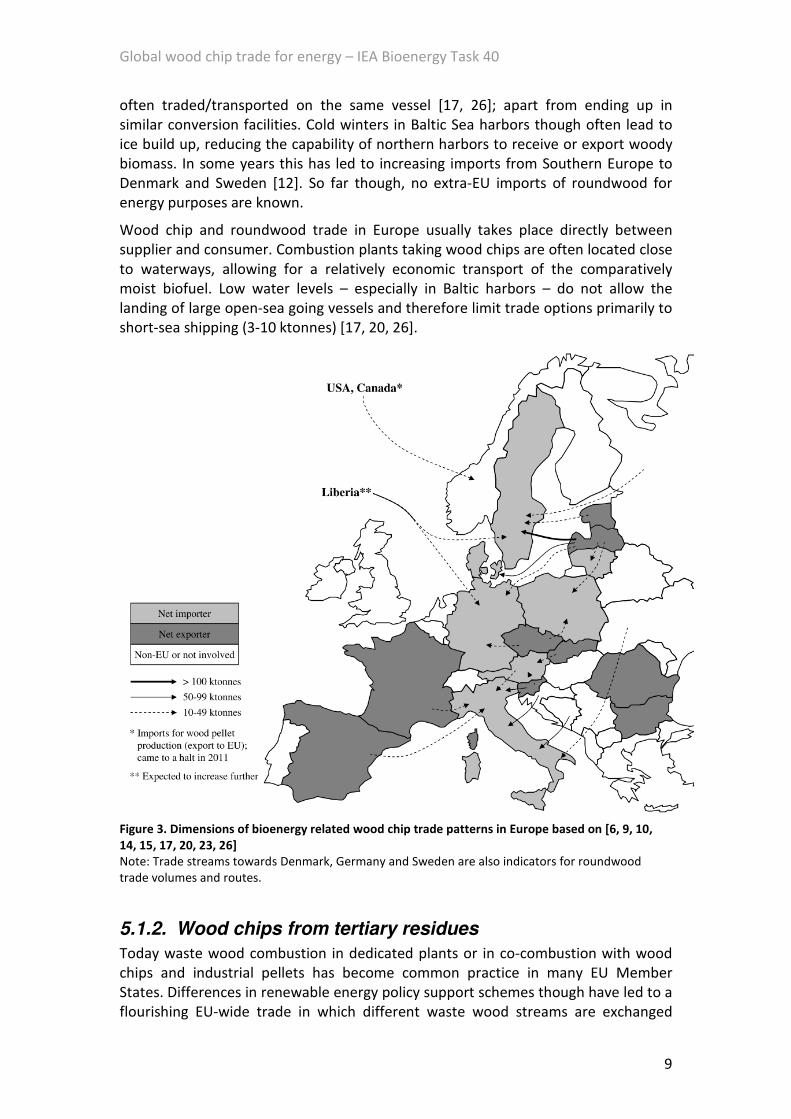
5.1.2. Wood chips from tertiary residues
Today waste wood combustion in dedicated plants or in co-combustion with wood
chips and industrial pellets has become common practice in many EU Member
States. Differences in renewable energy policy support schemes though have led to a
flourishing EU-wide trade in which different waste wood streams are exchanged
Global wood chip trade for energy – IEA Bioenergy Task 40
10
between the Member States (see Figure 4). Historically, Sweden was among the first
states to attract large amounts of wood waste (see [6] for a review). Today, trade to
other Member States is far larger. Top importing nations include Germany, Italy, and
Belgium; the major exporters are clearly the Netherlands and the UK (see Table 2
and Figure 4).
The relatively balanced import-export relation of Belgium and Germany is largely
related to national policy schemes which favor different streams of waste wood. The
German renewable electricity feed-in scheme e.g. has provided strong incentives for
the combustion of clean (non-treated) waste wood. Whereas, in the past, more
contaminated waste wood had e.g. attracted higher subsidies in the Netherlands
[27]. As a result, Germany imported eligible and exported non-eligible wood waste
streams.
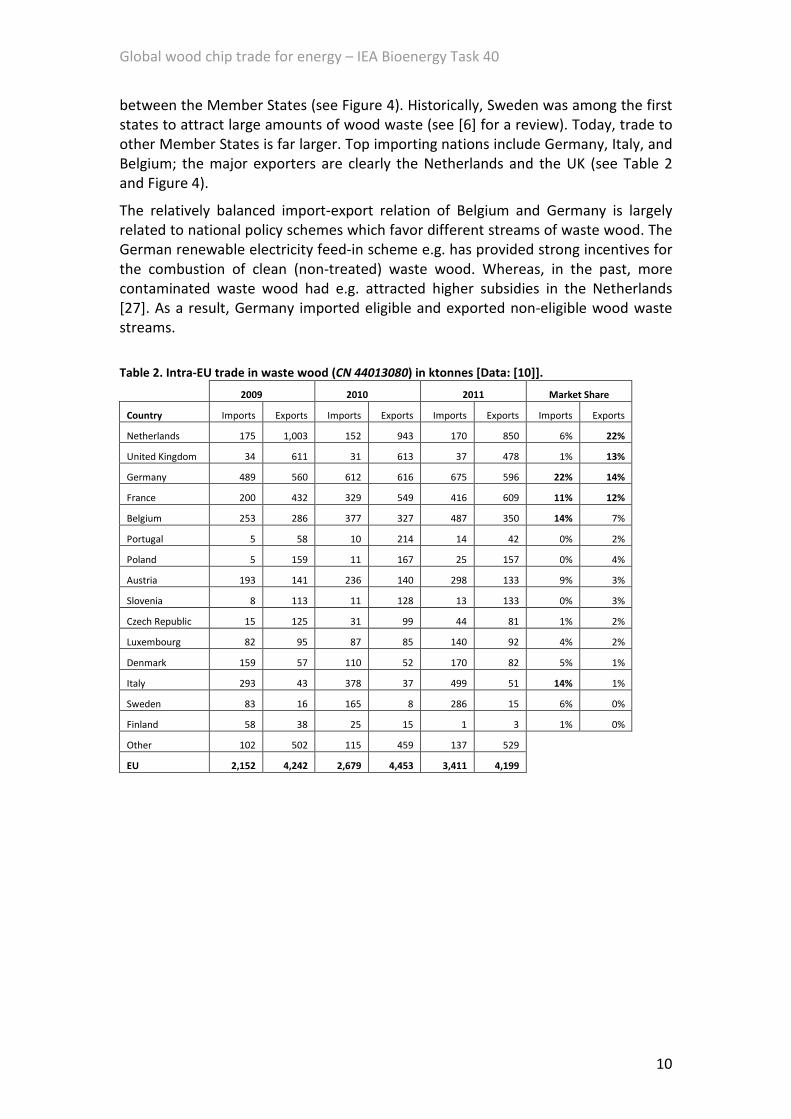
Table 2. Intra-EU trade in waste wood (CN 44013080) in ktonnes [Data: [10]].
2009 2010 2011 Market Share
Country Imports Exports Imports Exports Imports Exports Imports Exports
Netherlands 175 1,003 152 943 170 850 6% 22%
United Kingdom 34 611 31 613 37 478 1% 13%
Germany 489 560 612 616 675 596 22% 14%
France 200 432 329 549 416 609 11% 12%
Belgium 253 286 377 327 487 350 14% 7%
Portugal 5 58 10 214 14 42 0% 2%
Poland 5 159 11 167 25 157 0% 4%
Austria 193 141 236 140 298 133 9% 3%
Slovenia 8 113 11 128 13 133 0% 3%
Czech Republic 15 125 31 99 44 81 1% 2%
Luxembourg 82 95 87 85 140 92 4% 2%
Denmark 159 57 110 52 170 82 5% 1%
Italy 293 43 378 37 499 51 14% 1%
Sweden 83 16 165 8 286 15 6% 0%
Finland 58 38 25 15 1 3 1% 0%
Other 102 502 115 459 137 529
EU 2,152 4,242 2,679 4,453 3,411 4,199
Global wood chip trade for energy – IEA Bioenergy Task 40
11
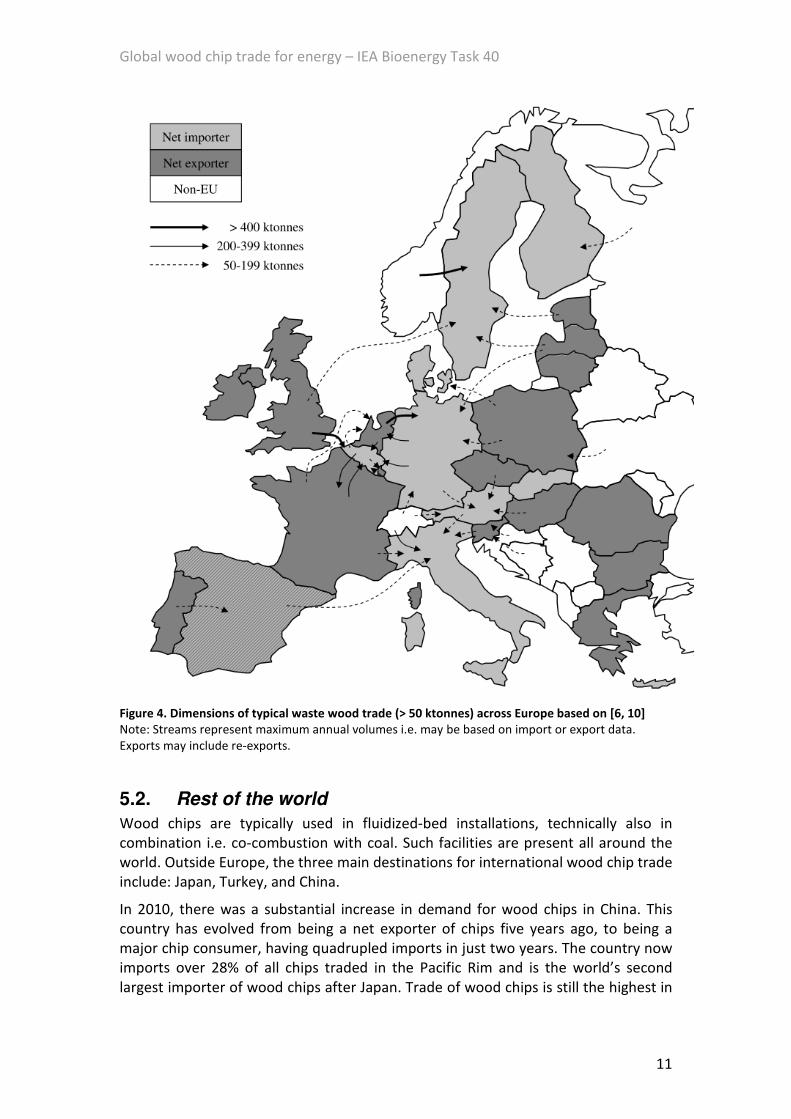
Figure 4. Dimensions of typical waste wood trade (> 50 ktonnes) across Europe based on [6, 10]
Note: Streams represent maximum annual volumes i.e. may be based on import or export data.
Exports may include re-exports.
5.2. Rest of the world
Wood chips are typically used in fluidized-bed installations, technically also in
combination i.e. co-combustion with coal. Such facilities are present all around the
world. Outside Europe, the three main destinations for international wood chip trade
include: Japan, Turkey, and China.
In 2010, there was a substantial increase in demand for wood chips in China. This
country has evolved from being a net exporter of chips five years ago, to being a
major chip consumer, having quadrupled imports in just two years. The country now
imports over 28% of all chips traded in the Pacific Rim and is the world’s second
largest importer of wood chips after Japan. Trade of wood chips is still the highest in
Global wood chip trade for energy – IEA Bioenergy Task 40
12
the Pacific Rim, accounting for almost 60% of the total global trade and over 95% of
water-born trade.
So far, little is known about exact volumes entering China for energy purposes.
Clearly though they are able to reach very large dimensions in the near future. Trade
flows to China originate primarily in the Asian region. Potential, large wood chip
supply countries include Australia, Vietnam, and Russia.
Japan has previously sourced wood chips from Canada. The current IEA Task 40
country report on Japan [28] notes that 300 ktonnes of wood chips for energy were
imported in 2011; all by one single power plant (Chubu Electric). Previously (see [6,
29]), it was expected that wood chips for energy production would be solely derived
from domestic demolition wood and that Japanese wood chip imports cover pulp
chips exclusively.
In Europe, Turkey has been – and remains – the key destination for international
softwood chip imports. As it does not apply strict import requirements, and does not
form part of the European Union, it can and has imported large volumes of softwood
chips from North America.
Over the past few years there has been a rapid, worldwide expansion in the
consumption of renewable energy by the pulp and paper industry [30]. Numerous
plants have made the strategic decision to invest in equipment needed to switch
from fossil fuels to woody biomass. The annual consumption of biomass for energy
generation by the global pulp industry in 2009 was an estimated 75 million tonnes.
While the biggest increases have occurred in Latin America, Asia and Oceania, mills
in North America and Europe are still the largest users of biomass, sourced mainly
from forest residues and industry co-products.
In 2009, the financial crisis had a major impact on the Russian forest and
woodworking sector [30]. Regardless of the poor investment climate and reduced
availability of wood waste, the wood energy market was one of the branches of the
forest and woodworking sector that has had rising demand and supply since 2007. In
reaction to the investment malaise in the forest and woodworking sector, several
regional governments have developed subsidizing mechanisms, which directly or
indirectly stimulate the wood energy market. The increased export tariffs on
unprocessed wood, and the decline in wood processing, resulted in a surplus of
roundwood in 2009. Some of these logs were chipped and exported as wood fuel.
Global wood chip trade for energy – IEA Bioenergy Task 40
13
6. Phytosanitary measures
6.1. Historic wood chip bans
In 1984, pine wood chips from the US and Canada were found to be infested with
pine wood nematodes which are considered to cause pine wilt disease. The wood
chip embargo commenced in 1985 when Finland banned the importation of conifer
chips and timber cut from softwood trees grown in areas of the world in which pine
wood nematodes are present. The same year, the EU Plant Protection Organization
(EPPO) recommended that Europe as a whole bans softwood products except kiln
dried lumber from countries known to have pine wood nematodes (Bursaphelenchus
xylophilus). Although the US government vehemently objected the ban, resulting in
fact finding teams from Finland, Norway and Sweden visiting the US, it was
implemented across the EU.
The prevailing argument was that the EU could experience a pine wilt disease
epidemic similar to the one which occurred in Japan in 1969; and which was blamed
on wood chip imports from North American trees killed by a pine wilt epidemic. That
also was not found to be the case, nor was it the cause of tree dieback in Canada. In
fact, pine wood nematodes are seldom, if ever, the primary cause of mortality of
conifers in the forests of North America.
The current EU regulation for softwood imports from North America, which requires
kiln drying, cannot be applied to wood chips as the drying process would result in the
burning of the wood chips.
6.2. The European Commission Standing Committee on Plant Health
Under the EU Directive 2000/29/EC, the importation of wood chips for whatever
purpose is regulated under the lumber standard of kiln drying which requires heat
exposure of 56°C for 30 minutes. However, the international recognized (IPPO)
standard of ISPM-15 allows for <6 mm packing material (soft or hardwood) to be
shipped without further regulation. Despite the fact the Committee and the EU
Health & Consumers Directorate acknowledge this inconsistency no actions have
been taken so far to change it. Due to an outbreak of pine wood nematodes in
Portugal in 2008 and more recent outbreaks in Spain in 2010, the EU has not been
open to any further change in the Directive.
At the same time, the EU acknowledges the need for wood chip imports for power
generation and the increasing need for wood fuel based power generation. There is
no ban on the importation of wood pellets despite the fact that their heat treatment
does not meet the kiln dried standard. However, wood pellets made from softwood,
are literally exempt from any regulation and require no supportive scientific data for
export to the EU.
Global wood chip trade for energy – IEA Bioenergy Task 40
14
6.3. Recent US developments on eradicating nematodes in wood chips
In 2010, a scientist at the University of Arkansas was contracted by a private
company to develop a process using heat treatment that would eradicate the
nematode in pine wood chips without degrading the quality of the chip and that
would gain approval by the USDA. The USDA must issue a Phytosanitary certificate
for each export shipment specifying the treatment. The results of the testing proved
conclusive and the testing was moved from the lab scale to commercial scale. The
USDA has approved the testing method and it is in the process of being patented.
The patent pending process requires a special facility whereby the chips are batch
processed using a specified regime of time and temperature. The process uses lower
temperatures over a 2 ½ hour duration which does not degrade the wood chips but
has been proven to kill the nematodes.
The private company that contracted the study at the University of Arkansas has the
patent application in process and it will be proprietary to them. They will build the
facilities which will have a 40,000 s/t per month capacity and receive a fee per ton
for processing the wood chips which at this point would be cost prohibitive for the
EU countries since the current market price for wood chips could not bear the
additional expense of the heat treatment. The first commercial scale plant is
scheduled to be built in Mississippi. The target market currently is the Far East,
primarily China for use in fibreboard/mdf and paper production where importation
of pine wood chips is allowed but must be fumigated with methyl bromide prior to
importation. This has proved costly and many times ineffective when the wood is
tested upon arrival resulting in load rejection until re-fumigation can take place.
Other processes for eliminating nematodes continue to be studied in the US. These
include densification of the wood chips in briquette form to allow the fibers to stay
intact as well as more cost effective heat treatment methods. Another University
study is also examining the possibility that once in chip form, nematodes, if found in
the chips, can not pose a threat to living timber.
Global wood chip trade for energy – IEA Bioenergy Task 40
15
7. Summary and conclusions It is estimated that less than 10% of annually reported wood chip trade volumes are
energy-related. The remaining, largest fraction is primarily destined for pulp and
paper production, with some trade for other uses such as fibre and particle boards.
Energy-related wood chip trade takes almost exclusively place to and within the
European Union (EU), where respective policies promoting the use of renewable
energy have stimulated wood chip use in the residential and industrial segment.
Wood chips for the EU residential market are primarily sourced locally. Hence,
international wood chip trade is exclusively driven by the industrial sector, where
chips are combusted in dedicated or converted co- and/or mono-firing installations
(primarily fluidized-bed). Respective trade takes place in the form of chips (virgin
wood chips), crushed (waste) wood, or as roundwood which is chipped at the plant.
Official statistics indicate that wood waste volumes dominate the EU-related trade.
Outside the EU, wood chip trade is only known to occur to Japan and Turkey from
Canada and the Southeastern US. Should respective policies be implemented in Asia,
the region could become one of the key drivers for an increase in international wood
chip trade for energy.
So far though, global wood chip trade to the EU is unlikely to increase significantly.
North American imports to the EU underlie phytosanitary measures (pine beetle, and
nematodes) which increases wood chip end prices and limits their use to the higher
priced segments, primarily pulp and paper production. South America (esp. Brazil)
and Asia are ramping up pulp and paper (and also pellet) production capacities.
Hence, woody material such as chips (e.g. from Vietnam) will therefore be used
mostly locally. Africa has increased wood chip production (driven e.g. by companies
from Sweden and Denmark), also for energy use, but end-use markets remain off-
shore and companies currently investing in Africa are expected to eventually turn
chips into pellets prior to transport. The strong demand in Asia and the distance to
Europe make Oceania also unlikely to become a large supplier of wood chips for
energy to the EU. Oceania (primarily Australia and New Zealand) already supplies
wood chips to Asian pulp and paper producers, e.g. in China, Japan, India. As said
above though, should any of these countries create policy incentives to use wood
chips for energy, total global energy related wood chip trade could increase
significantly.
Key EU wood chip markets for energy lie in Scandinavia and Italy. Both regions
currently experience an underutilization of pulp and paper production capacities
resulting in an oversupply of wood chips; reducing the need for global supplies.
However, additional resources could also be used for other industries, e.g.
fibreboard or pellet production. One potential driver for increased EU wood chip
trade could be extended Russian duties on roundwood; especially to Scandinavian
markets.
In general, the key constraint for international wood chip trade for energy is
economic viability. Margins are primarily influenced by production and transport
costs, but also prices in and exchange rates to target markets. As production costs
depend heavily on feedstock prices, it is not surprising that key wood chip producing
and exporting regions have a long tradition in export oriented forestry, wood
Global wood chip trade for energy – IEA Bioenergy Task 40
16
processing, and/or pulp and paper industries, and benefit from the availability of
low/no cost feedstock and/or residues, infrastructure, and experience [6].
Facilities in Sweden and Denmark indicate that they would source wood chips
globally but do stress the need for reasonable transport costs per load. Transport
costs are determined by vehicle costs and availability (e.g. in the case bulk carrier
vessels), and biofuel characteristics [6]. The current availability of shipping capacities
for large international (i.e. open-ocean, long-distance) trade indicates that the
limiting factor for significant international wood chip trade lies with the chips’
characteristics. Without densification of the woodchips (a patented process
developed in the US) woodchips require specialty vessels (woodchip carriers) in
order to make the transportation on a long haul basis economically feasible. Pellets
in comparison have better transport qualities: high homogeneity, high heating value
and bulk density (thus high energy density per ship load), ability to be transported in
standard sized vessels for greater ocean transportation economy, plus flexible end-
use regarding combustion technology and scale (e.g. co-firing in pulverized coal
combustion plants).
Hence, in comparison to wood pellets, global wood chip trade for energy remains
small. While wood pellet production has already experienced replacement effects;
e.g. in Austria, where an increase in regional biomass use for energy has led to
increased (oversea) imports of the local pulp and paper industry [31]. Production and
trade developments of wood chips for energy have not (yet) shown similar effects.
The availability and importance of the respective solid biofuels remain linked and
ultimately limited by the developments in their underlying sectors i.e. forestry/pulp
and paper for wood chips and roundwood, construction/recycling for wood waste or
food/fodder processing for residues. Apart from feedstock availability, new
challenges on the supply side include increasing standardization and sustainability
requirements.
On the demand side, the residential market has been less influenced by policies, due
to the singularity of the support measures as compared to large-scale applications,
where long-term framework conditions primarily aim at bridging the economic gap
towards substitute fuels (esp. coal) [6]. Trade in the industrial market can therefore
be based on longer-term pricing signals and has shown increasingly established trade
routes. The latter is also supported by a growing vertical supply chain integration of
large scale users [6].
Current statistical reporting make global wood chip trade patterns still hard to
distinguish between energy and other end-uses. Anecdotal data remains essential to
estimate and interpret trade flows. Future datasets of international institutions, we
believe, should be streamlined and eventually allow reporting of global commodity
trade streams beyond digit-6-level.
Global wood chip trade for energy – IEA Bioenergy Task 40
17
References [1] Edenhofer O, R. Pichs-Madruga, Sokona Y, Seyboth K, Matschoss P, Kadner S, et
al. IPCC Special Report on Renewable Energy Sources and Climate Change Mitigation
Cambridge University Press, Cambridge, UK and New York, USA; 2011.
[2] IEA. World Energy Outlook. Paris: International Energy Agency; 2010.
[3] Bauen A, Berndes G, Junginger M, Londo M, Vuille F, Ball R, et al. Bioenergy - a
sustainable and reliable energy source: A review of status and prospects. IEA
Bioenergy; 2009. http://www.ieabioenergy.com/LibItem.aspx?id=6479 [12.01.2011].
[4] IPCC. Climate Change 2007: Mitigation of Climate Change. Contribution of
Working Group III to the Fourth Assessment Report of the Intergovernmental Panel
on Climate Change. Cambridge, UK and New York, USA: Cambridge University Press;
2007.
[5] Chum H, A. Faaij, J. Moreira, G. Berndes, P. Dhamija, H. Dong, et al. Bioenergy. In:
Edenhofer O, Pichs-Madruga R, Sokona Y, Seyboth K, Matschoss P, Kadner S, et al.,
editors. IPCC Special Report on Renewable Energy Sources and Climate Change
Mitigation. Cambridge, UK and New York, USA: Cambridge University Press; 2011.
[6] Lamers P, Junginger M, Hamelinck C, Faaij A. Developments in international solid
biofuel trade - an analysis of volumes, policies, and market factors. Renewable and
Sustainable Energy Reviews. 2012;16:3176-99.
[7] Cocchi M, L. Nikolaisen, M. Junginger, C. S. Goh, J. Heinimö, D. Bradley, et al.
Global wood pellet industry and market study. IEA Bioenergy Task 40; 2011.
http://www.bioenergytrade.org/downloads/t40-global-wood-pellet-market-
study_final.pdf [January 2012].
[8] Heinimö J. Methodological aspects on international biofuels trade: International
streams and trade of solid and liquid biofuels in Finland. Biomass and Bioenergy.
2008;32:702-16.
[9] UN. Commodity Trade Statistics Database (COMTRADE). New York, Geneva:
United Nations; 2011. http://comtrade.un.org/db/default.aspx [04.08.2011].
[10] Eurostat. Data Explorer - EU27 Trade Since 1995 By CN8. Brussels, Belgium:
Eurostat; 2012.
http://epp.eurostat.ec.europa.eu/portal/page/portal/statistics/search_database
[April 2012].
[11] FAOSTAT. ForesSTAT. Rome, Italy: Food and Agriculture Organization of the
United Nations; 2011. http://faostat.fao.org/site/626/default.aspx#ancor
[07.02.2011].
[12] Bornerup T, Corneliusen B. Director and Bioenergy manager of Verdo Energy,
Aarhus, Denmark: Personal communication on global roundwood for energy trade,
June. 2011.
[13] Alakangas E. European Standard (EN 14961) for wood chips and hog fuel. Forest
Bioenergy 2010: Finbio Publications; 2010. p. 329-40.
[14] Hektor B. Member representative Swedish Bioenergy Association SVEBIO,
Stockholm, Sweden: Personal communication on global wood pellet and charcoal
trade and wood chip trade in Scandinavia, March. 2011.
[15] Junginger M, van Dam J, Alakangas E, Virkkunen M, Vesterinen P, Veijonen K.
Solutions to overcome barriers in bioenergy markets in Europe. EUBIONET3: VTT &
Utrecht University; 2010.
Global wood chip trade for energy – IEA Bioenergy Task 40
18
http://www.eubionet.net/GetItem.asp?item=digistorefile;144551;1087¶ms=op
en;gallery [12.01.2011].
[16] Wiik C, Alakangas E, Rathbauer J, Sulzbacher L, Kilgus D, Baumbach G, et al. Used
wood in the EU - part 1: classification, properties, and practices. In: II B, editor.
Jyväskylä, Finland: VTT; 2008.
[17] Olsson O. PhD student at School for Forest Management, Swedish University of
Agricultural Sciences, Skinnskatteberg, Sweden: Personal communication on solid
biofuel esp. wood chip trade/use in Scandinavia, March. 2011.
[18] USDA. Forestry production and trade outlook - Russian Federation. Moscow,
Russia: US Department of Agriculture, Foreign Agricultural Service; 2009.
http://gain.fas.usda.gov/Recent%20GAIN%20Publications/Russia%20Refrains%20fro
m%20Increases%20in%20Export%20Tariff%20for%20Round%20Wood%20_Moscow
_Russian%20Federation_1-13-2011.pdf [21.02.2011].
[19] Heinimö J. Project manager at Lappeenranta University of Technology, Varkaus,
Finland: Personal communication on global and finnish market developments in
wood chips, waste wood, roundwood, and wood pellets, data sources and
discrepancies, March. 2011.
[20] Wild M. Director of Wild & Partner KG, Vienna, Austria: Personal communication
on global solid residue trade, March. 2011.
[21] Flynn R. Director International Timber at RISI, USA: Personal communication on
global wood chip trade patterns for energy, May. 2012.
[22] Guizot M. The prospects of wood chips and pellets production and trade. 2nd
Biomass for Heat and Power Conference. Brussels, Belgium2010.
[23] Willumsen K. Import of wood-chips from non-European countries - need for a
common PRA? Nordic-Baltic plant health meeting. Finland2010.
http://www.evira.fi/files/attachments/en/evira/events/nordic_baltic_plant_health_f
orum_2010/kw_nor_import_of_wood_chips_from_non-european_countries.pdf
[22.02.2011].
[24] Vattenfall. Vattenfall acquires share of Buchanan Renewables Fuel Ltd in Liberia.
2010. http://feed.ne.cision.com/wpyfs/00/00/00/00/00/11/96/D8/wkr0011.pdf
[17.06.2011].
[25] Alakangas E, Heikkinen A, Lensu T, Vesterinen P. Biomass fuel trade in Europe.
In: EUBIONET2, editor. Jyväskylä, Finland: VTT; 2007.
http://eubionet2.ohoi.net/ACFiles/Download.asp?recID=4705 [05.04.2011].
[26] Vikinge B. Trading of wood chips in the Baltic Sea region. EUBIONETIII
workshop: Biomass trade – focus on solid biofuels. Espoo, Finland2011.
[27] Faber J, Bergsma G, Vroonhof J. Bio-energy in Europe 2005 - Policy trends and
issues. Delft, the Netherlands: CE; 2006.
[28] Goto S, Oguma M, Iwasaki Y, Hayashi Y. Japan country report 2011. IEA
Bioenergy Task 40; 2012. www.bioenergytrade.org [May 2012].
[29] Goto S, Oguma M, Iwasaki Y. Country Report Japan. IEA Task 40; 2011.
http://www.bioenergytrade.org/downloads/japanesetask40countryreport2011.pdf
[01.03.2011].
[30] UNECE, FAO. Forest Products Annual Market Review 2009-2010. In: Pepke E,
editor. Geneva Timber and Forest Study Paper. New York, Geneva: United Nations
Economic Commission for Europe / Food and Agriculture Organization of the United
Global wood chip trade for energy – IEA Bioenergy Task 40
19
Nations 2010. http://timber.unece.org/fileadmin/DAM/publications/sp-25.pdf
[18.01.2011].
[31] Kranzl L. Senior researcher at EEG, TU Vienna, Austria: Personal communication
on global solid biofuel trade codings and methodologies, June. 2011.
[32] Heinimö J, Junginger M. Production and trading of biomass for energy – An
overview of the global status. Biomass & Bioenergy. 2009;33:1310-21.
[33] Ume-Ezeoke O. Palm kernel shell product offer. London, UK: Opean Energy;
2010.
[34] ECN. Phyllis Database. Petten, the Netherlands2011. http://www.ecn.nl/phyllis/
[29.06.11].
[35] Emrich W. Handbook of charcoal making. Dordrecht / Boston / Lancaster: D.
Reidel Publishing Company; 1985.
[36] Clark A, Daniels R. Estimating moisture content of tree-length roundwood.
Pulping/Process and Product Quality Conference. Boston, USA2000.
http://www.srs.fs.usda.gov/pubs/ja/ja_clark015.pdf [29.06.11].
[37] Kaltschmitt M, Hartmann H. Energie aus Biomasse: Grundlagen, Techniken und
Verfahren: Springer, Germany; 2001.
Global wood chip trade for energy – IEA Bioenergy Task 40
20
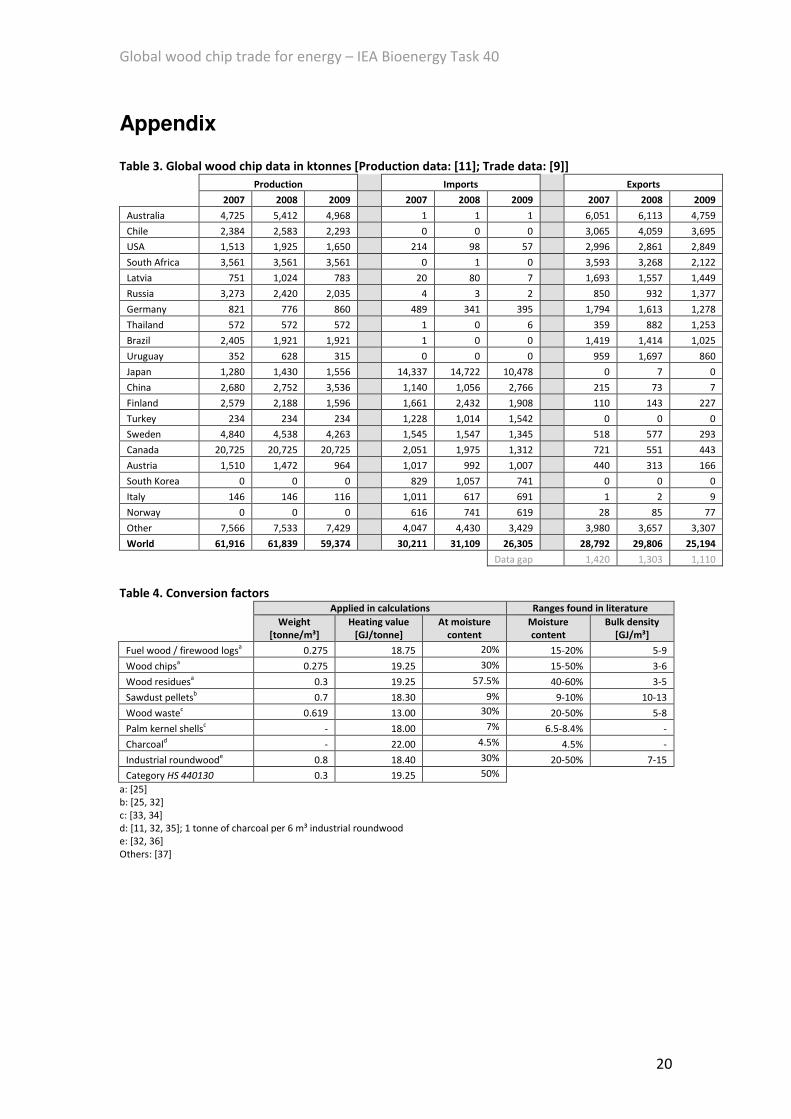
Appendix
Table 3. Global wood chip data in ktonnes [Production data: [11]; Trade data: [9]]
Production Imports Exports
2007 2008 2009 2007 2008 2009 2007 2008 2009
Australia 4,725 5,412 4,968 1 1 1 6,051 6,113 4,759
Chile 2,384 2,583 2,293 0 0 0 3,065 4,059 3,695
USA 1,513 1,925 1,650 214 98 57 2,996 2,861 2,849
South Africa 3,561 3,561 3,561 0 1 0 3,593 3,268 2,122
Latvia 751 1,024 783 20 80 7 1,693 1,557 1,449
Russia 3,273 2,420 2,035 4 3 2 850 932 1,377
Germany 821 776 860 489 341 395 1,794 1,613 1,278
Thailand 572 572 572 1 0 6 359 882 1,253
Brazil 2,405 1,921 1,921 1 0 0 1,419 1,414 1,025
Uruguay 352 628 315 0 0 0 959 1,697 860
Japan 1,280 1,430 1,556 14,337 14,722 10,478 0 7 0
China 2,680 2,752 3,536 1,140 1,056 2,766 215 73 7
Finland 2,579 2,188 1,596 1,661 2,432 1,908 110 143 227
Turkey 234 234 234 1,228 1,014 1,542 0 0 0
Sweden 4,840 4,538 4,263 1,545 1,547 1,345 518 577 293
Canada 20,725 20,725 20,725 2,051 1,975 1,312 721 551 443
Austria 1,510 1,472 964 1,017 992 1,007 440 313 166
South Korea 0 0 0 829 1,057 741 0 0 0
Italy 146 146 116 1,011 617 691 1 2 9
Norway 0 0 0 616 741 619 28 85 77
Other 7,566 7,533 7,429 4,047 4,430 3,429 3,980 3,657 3,307
World 61,916 61,839 59,374 30,211 31,109 26,305 28,792 29,806 25,194
Data gap 1,420 1,303 1,110
Table 4. Conversion factors Applied in calculations Ranges found in literature
Weight
[tonne/m³]
Heating value
[GJ/tonne]
At moisture
content
Moisture
content
Bulk density
[GJ/m³]
Fuel wood / firewood logsa 0.275 18.75 20% 15-20% 5-9
Wood chipsa 0.275 19.25 30% 15-50% 3-6
Wood residuesa 0.3 19.25 57.5% 40-60% 3-5
Sawdust pelletsb 0.7 18.30 9% 9-10% 10-13
Wood wastec 0.619 13.00 30% 20-50% 5-8
Palm kernel shellsc - 18.00 7% 6.5-8.4% -
Charcoald - 22.00 4.5% 4.5% -
Industrial roundwoode 0.8 18.40 30% 20-50% 7-15
Category HS 440130 0.3 19.25 50%
a: [25]
b: [25, 32]
c: [33, 34]
d: [11, 32, 35]; 1 tonne of charcoal per 6 m³ industrial roundwood
e: [32, 36]
Others: [37]