
Emulating randomized clinical trials with non-randomized ...

Do Your Online Friends Make You Pay?A Randomized Field Experiment
in an Online Music Social Network
Ravi Bapna*University of Minnesota, Carlson School of Management, [email protected]
Akhmed Umyarov*University of Minnesota, Carlson School of Management, [email protected]
Demonstrating compelling causal evidence of the existence and strength of peer to peer influence has become
the holy grail of the modern research in online social networks. In these networks, it has been consistently
demonstrated that user characteristics and behavior tend to cluster both in space and in time. There are two
well known rival mechanisms that compete to be the explanation for this observed clustering: peer influence
and homophily. Both mechanisms lead to similar observational data, yet have tremendously different policy
implications. In this paper, we present a novel randomized experiment that tests the existence of causal
peer influence in the general population of a particular large-scale online social network and quantifies its
strength as compared to homophily. We utilize a unique social feature to exogenously induce adoption of
a paid product amongst a group of randomly selected users, and in the process develop truly exogenous
randomization of treatment and control groups. Our estimates show that peer influence causes 50% increase
in odds of buying the product due to the influence coming from an adopting friend. In addition, we find
that users with smaller number of friends are significantly more susceptible to be influenced by their peers
as compared to the ones with larger number of friends. Finally, our experimental apparatus allows us to
compare our randomized trial with a matching-based quasi-experiment. We find that the quasi-experiment
tends to produce the results similar to randomized trial, but over-estimating the effect on users with larger
number of friends and under-estimating it for the users with smaller number of friends, thus providing the
first insights about the nature of bias in estimating peer-effects by the models with self-selected populations.
Key words : Peer-effects, randomized experiment, social contagion, matching models, music subscription,
online social networks
1. Introduction and Background
The general challenge of demonstrating causal inference from observational data has been immor-
talized in Manski (1995) reference to the simultaneous movements of a man and his image in the
*The names of the authors are in alphabetical order. This research was supported by University of Minnesota, Carlson
School of Management Dean’s Small Research Grant.
1

Ravi Bapna and Akhmed Umyarov: Do Your Online Friends Make You Pay?2 NBER Working Paper Series 2012
mirror. He asks, “Does the mirror cause the man’s movement or reflect them?” and concludes
that without understanding optics and human behavior we cannot really tell. Interestingly, this
quote from pre-Facebook era is extremely relevant to the causality questions that arise in today’s
digital age featuring massive online social networks such as Facebook and Twitter as well as niche
networks such as Last.fm, Spotify, LinkedIn and others1. These online social networks are credited
with playing roles that range from inspiring political action to driving viral and word-of-mouth
spread of products and services (Aral and Walker 2011, Hill, Provost, and Volinsky 2006, Iyengar,
Van den Bulte, and Valente 2011, Manchanda, Xie, and Youn 2008, Mayzlin 2006), and as such,
represent a vast reservoir of social and economic influence. Central to the tapping into this reser-
voir is the understanding of causal relationships that drive the spread of products, services and
information over these social networks, the focus of this paper.
It has been consistently demonstrated in the literature that in online social networks user charac-
teristics and behavior tend to cluster both in space and in time, with users generally being similar to
their online friends and acting similar to their online friends (Aral and Walker 2011). Interestingly,
there are several different underlying causal mechanisms that can lead to this observed clustering
with the most frequently cited ones being peer influence and homophily. Under the mechanism of
peer influence, an individual causes her online friends to undertake a certain action, which in turn,
leads to the observed correlation of the behavior of online friends.
On the other hand, under the mechanism of homophily, an individual tends to befriend peers
that are similar to her on observed and unobserved characteristics and possibly the environment
that they face. In this case, it is not surprising that behavior of an individual is correlated with the
behavior of her friends: they may not influence each other at all, but the observed correlation of
their actions comes from their intrinsic similarity. This underlying similarity is what forces them to
make similar choices independently again and again, and therefore, we may observe the correlation
between actions of online friends in case of homophily as well.
For an illustrative example, it is well known that smokers tend to be friends with smokers (Cutler
and Glaeser 2007). One explanation for this could be the peer influence mechanism: a smoker A
convinces his friend B to become smoker too. Alternatively, an explanation for this could the
homophily mechanism: people choose friends who are similar to them. That is, if person A is a
teenager who covertly believes that smoking is cool, his friend B is likely to be a teenager who
independently believes that too. So it is some underlying reasons (like young age and not thinking
1 Online social networks such as Facebook, with 800 MM users, and Twitter, with 100 MM users, are increasinglyconsuming a significant and growing portion of our time and attention. A 2010 Nielsen study estimated that theamount of time the average user spent on Facebook was about seven hours per month, and more importantly, wasgrowing at the rate of 10% per month.

Ravi Bapna and Akhmed Umyarov: Do Your Online Friends Make You Pay?NBER Working Paper Series 2012 3
about health) that causes both the friendship of A with B and their smoking and thus, leads to
the observed clustering.
The importance of disentangling peer influence and homophily mechanisms stems from the fact
that despite leading to very similar observational data, the policy implications of each of these
mechanisms are vastly different. Under peer influence an effective policy may be to identify the
“most influential” people and induce the desired behavior among them so that it would propagate
through the social contagion, while under homophily mechanism this policy may have little effect
(Aral 2011). Instead, under homophily, a careful segmentation based targeting strategy might be
preferred. Moreover, the mechanisms of peer influence and homophily are not necessarily mutu-
ally exclusive and may complement each other, therefore social contagion processes in real online
networks may contain a complex mixture of peer-influence and homophily.
Importantly, peer influence has the added bonus of bringing with it the social multiplier effect.
Manski (1995) provides an intuitive example of that effect describing a potential positive feedback
loop of peer influence in the context of academic performance of high school students. Manski
(1995) posits that if an increase in individual student’s academic performance causes the increase
in the performance of the reference group of her peers, then this reference group may in turn
increase the performance of that individual even further, and so on, leading to a positive self-
reinforcing feedback loop with the social multiplier effect. On the other hand, homophily-based
mechanisms that arise out of similarity of individual characteristics or contextual information do
not typically exhibit this multiplier effect, perhaps explaining the fascination amongst researchers
and practitioners about viral marketing of product and services.
All these factors make it critical, both for theory and for practice, to causally identify the presence
of each of these mechanisms in the context of large-scale online social networks. It is fair to say
that causal identification and measurement of peer influence in the general population of online
social networks, or put simply, existence and strength of social contagion, has become the holy
grail of modern research in online social networks.
In this paper, we present a novel randomized experiment that identifies the existence of peer
influence in the general population of users of a particular online social network. Our work is
inspired by Aral and Walker (2011) that demonstrates that significant social contagion can be
created by embedding viral features into product design and showcases the potential of using
randomized experiments to study peer-effects in online social networks. Our work is different in that
it uses a novel non-intrusive treatment that allows us to create a random assignment of subjects
and thus avoids voluntary subject recruitment procedures observed in prior literature.
Observational data that we collected from Last.fm website clearly indicates that premium sub-
scribers are significantly more likely to be connected to premium subscribers even controlling for the

Ravi Bapna and Akhmed Umyarov: Do Your Online Friends Make You Pay?4 NBER Working Paper Series 2012
number of friends and other known covariates. However, as explained by Manski (1995), inferring
the presence of peer-influence from this is not judicious. More specifically, there are several sorts of
biases identified in making such an inference: these include simultaneity (Godes and Mayzlin 2004),
unobserved heterogeneity (Van den Bulte and Lilien 2001), homophily (Aral, Muchnik, and Sun-
dararajan 2009), and correlated effects (Manski 1995). While multiple attempts have been made at
identifying peer effects using network structure based instrument variables (Bramoulle, Djebbari,
and Fortin 2009, Oestreicher-Singer and Sundararajan 2010), natural experiments (Tucker 2008)
and matched sample counterfactuals (Aral, Muchnik, and Sundararajan 2009, Susarla, Oh, and
Tan 2012, Oestreicher-Singer and Zalmanson 2010), each method has its limitations (Aral 2011,
Manski 1995) and the best we have in the absence of randomized or controlled exogenous variation
are upper bounds of peer influence (Aral, Muchnik, and Sundararajan 2009).
Interestingly, Manski (1995) touches upon the possible reasons behind the lack of randomized
trials involving general populations of different real-world networks. He reminds the reader that
it is particularly harder to draw inference about general population from a self-selected sample
of recruited subjects. In addition to self-selection bias, Manski (1995) argues that generalizable
analysis is limited to the observations that are made without undue intrusion, since people behavior
may change when they know they are being observed. In this study, we hope to demonstrate how
our research pushes the frontier on both dimensions. Our study attempts to close this gap in
the literature by introducing a randomized field experiment that eliminates any voluntary subject
recruitment procedure, thus mitigating a potential self-selection bias. In addition to that:
1. Our manipulation is non-intrusive and subjects are watched quietly. Therefore, observer bias
is not applicable to our setting;
2. Our manipulation cannot be escaped and subjects cannot withdraw from the study: subject
mortality bias is not applicable;
3. The peer influence has straightforward economic measurement in this setting since the
observed outcome for each subject is a physical payment (purchase of subscription) and, unlike
adoption of free products, subjects must actually pay their own money to adopt the subscription;
4. Manipulation was done uniformly randomly in the general population of all network users,
thus our results provide the inference about the general population of a social network. Also,
our experimental design provides insights into the nature and extent of the bias that self-selected
samples may inflict when analyzed using quasi-experimental techniques such as propensity score
matching (Rosenbaum and Rubin 1983) that attempt to match based only on the observables.
We present our findings starting with the insights gained from observational data followed by
the analysis of randomized experiment. We also touch upon a series of simulated quasi-experiments

Ravi Bapna and Akhmed Umyarov: Do Your Online Friends Make You Pay?NBER Working Paper Series 2012 5
that provide insights into the nature of the effect of self-selection bias. The randomized experiment
demonstrated that new adoptions were significantly higher in the treatment group vs. control group.
Moreover, our logistic regression estimates indicate that, on average, the odds of adopting the paid
subscription by a user increase by 50% due to peer influence when her friend adopts it, indicating
significant causal peer-effects in the monetization of social networks. In addition, we find that the
peer influence can be significantly weakened by the size of the influenced user’s friendship circle.
Finally, we find that the quasi-experiment tends to produce results similar to randomized trial,
somewhat over-estimating the effect on users with larger number of friends and under-estimating
it for the users with smaller number of friends, providing the first insights about the nature of bias
in estimating peer-effects by the models with self-selected populations.
The remaining sections are structured as follows. Section 2 describes the institutional details of
our experimental context. Section 3 formally poses the research question. Section 4 describes the
design of our experiment. In Section 5, we describe the data collection process, review the data,
and provide summary statistics. Section 6 presents our analysis and results of the randomized
experiment. Section 7 draws the conclusion of our results and outlines prospects for the future
work.
2. Institutional Details
The music industry today serves as a canonical example of how a long-established, growing and
profitable industry can be disrupted and subsequently re-invented by the social machinery of Inter-
net. One of the important emerging models of today’s music consumption in the Internet is a
freemium social community (Anderson 2008), as exemplified by sites such as Last.fm, Pandora,
Spotify and many others. Freemium social communities typically operate based on a two-tiered
business model that offers free access to the basic set of features and content while charging a fee
for more advanced premium features. For example, free users of Last.fm2 website can listen to the
online music radio interrupted by commercials, while paid subscribers of Last.fm website enjoy
continuous commercial-free music listening experience, a prestigious black “Subscriber” icon next
to their user avatars that is visible to everyone on Last.fm as a sign of status, have the ability to
listen to the online radio on a mobile phone and have access to additional colorful music statistical
charts.
Freemium communities often employ numerous social computing features (Parameswaran and
Whinston 2007), such as, for example, friendship social network feature that allows website users
to become listed as online friends with another website user. Being an online friend with someone
2 http://virtualmusic.tv/2011/02/2010-music-website-heat-map/ indicates that Last.fm, with reportedly 30 millionsubscribers, received 9.8 million hits per month in 2010.

Ravi Bapna and Akhmed Umyarov: Do Your Online Friends Make You Pay?6 NBER Working Paper Series 2012
typically gives certain benefits: friends can easily share information among themselves and exert
certain peer influence on each other. On Last.fm website, for instance, online friends can affect
each other’s music choices while sharing their own music listening experiences, they can listen to
friend’s “recommended radio”, can review friend’s “Loved songs” and so on. Appendix A provides
a snapshot of a typical Last.fm user’s page. More specifically, Oestreicher-Singer and Zalmanson
(2010) provide a nice overview of the institutional details of Last.fm website as freemium social
community. Among the findings of their study is the fact that the music listening on Last.fm is
socially driven which means it is based on what your friends are listening, and that a paid sub-
scription appears as a distinct (ostensibly status) symbol visible to your friends. Also, as discussed
in the studies of Freemium communities (Oestreicher-Singer and Zalmanson 2010, Pauwels and
Weiss 2008), a singular challenge for their long-term economic viability is discerning pathways and
strategies for moving users from-free-to-fee, that is converting users from the large pool of free
users to the elite set of premium paid users.
In this paper, we present a randomized field experiment on Last.fm website providing the evi-
dence that making one person a paid subscriber on Last.fm can cause her online friends to pay for
subscription and become subscribers as well. Our experimental design relies on the unique social
feature of Last.fm that allows gifting any random user in Last.fm social network with a paid sub-
scription. While this feature of Last.fm website has not yet been studied extensively in the social
networks literature, it offers a unique opportunity to create a “gold standard” randomized trial
on an online social network. From an experimental design perspective anyone in Last.fm social
network has an equal chance of receiving a gift from us. Last.fm users cannot decline the gift or
hide their subscription status from others. They cannot transfer the gift to anyone else, or postpone
using it, or share it with someone else, or refund it. This makes the unrestricted gifting social fea-
ture particularly valuable for online social networks in an experimental context, a fact this research
is the first to bring forth.
3. Research Questions
The main research questions of this study are formulated as the following hypotheses:
Hypothesis 1. In an online social network there exists peer influence such that an individual’s
product adoption causes the adoption by her online friends.
Hypothesis 2. The effect of peer influence is moderated by and is decreasing in the number of
friends the influenced individual has.
While the first hypothesis is the focal point of this paper and its rationale has been articulated
at length already, it is worth dwelling a bit on the basis for the second hypothesis. Iyengar, Van den

Ravi Bapna and Akhmed Umyarov: Do Your Online Friends Make You Pay?NBER Working Paper Series 2012 7
Bulte, and Valente (2011) make a compelling case for looking at moderating factors that may shape
the nature and extent of social contagion at work. While it could be argued that, for instance, heavy
users are more likely to exert a greater influence on others, Godes and Mayzlin (2009) note that
heavy users may tend to be connected mostly to people already predisposed to be early adopters.
While the focus of Godes and Mayzlin (2009) is on the influencer side of the equation, such as
whether better connected adopters exert more influence than do less connected ones, we position
ourselves on the susceptibility-to-influence-side of that equation, since it is natural to believe that
impact of peer influence will also depend on the susceptibility of the individual being influenced. A
user who has many thousands of friends on Last.fm may be much less responsive to the marginal
peer’s adoption decision, with her attention possibly divided among all friends, as opposed to those
social network users who are more selective in befriending others. Similar distinctions between
selective and non-selective tie forming behaviors in the context of trust have been observed in other
online social networks such as Facebook (Bapna, Gupta, Rice, and Sundararajan 2012).
In order to address our research questions we first need to establish a causal link between
person’s B decision to subscribe and the influence from B’s friend - person A. In this paper,
our conceptualization of peer influence is due to Aral (2011). This conceptualization is rooted in
utility theory in that the actions of one’s peers change the utility one expects to receive from
engaging in a certain behavior and thus the likelihood that one will engage in that behavior (Aral
2011). Such a conceptualization is flexible and encompassing with respect to the myriad influence
mechanisms that could lead to social contagion. In other words, in order to demonstrate the
presence of peer influence we do not seek to explain which influence mechanism from person A
causes person B to subscribe: be it awareness raising, explicit or tacit persuasion, observational or
social learning, imitation or any other mechanism. It is only required to demonstrate that person A
causes person B to subscribe. It is important to note that in this study, we do not raise the question
of disentangling the general peer influence into the exact types of peer influence mechanisms as
above. This disentanglement would require collecting very different type of data and possibly a
different experimental design.
Our works relates to and builds upon the propensity score (Rosenbaum and Rubin 1983) match-
ing based approaches of Aral, Muchnik, and Sundararajan (2009), Susarla, Oh, and Tan (2012)
as well as Oestreicher-Singer and Zalmanson (2010). A key advancement of our work is that while
propensity score matching accounts for observable user characteristics in crafting usable control
groups, it is widely recognized (Aral, Muchnik, and Sundararajan 2009, Oestreicher-Singer and
Zalmanson 2010) that other unobservable user characteristics (say amount of free-time an indi-
vidual has, income level, sensitivity to commercials etc) or contextual effects such as marketing

Ravi Bapna and Akhmed Umyarov: Do Your Online Friends Make You Pay?8 NBER Working Paper Series 2012
promotions (Van den Bulte and Stremersch 2004) could as well be influencing the propensity to
be treated and be linked to homophily.
This limitation of not accounting for unobserved characteristics is overcome in our study through
exogenous randomization such that there is no reason to believe the treatment group and the
control group (described in the next section) should have any systematic difference in observable
and latent/unobservable characteristics. In the absence of randomization, the best we can get are
upper bounds of the true estimate of contagion (Aral and Walker 2011).
4. Experimental Design4.1. Informal Description
For illustrative purposes, we present the following intuitive explanation of our research approach
before we describe the actual experimental setup using strict formalism. We will consistently rely
on that illustration throughout the paper in order to convey abstract concepts more intuitively.
Assume that the paid subscription in Last.fm social network is like a “disease” caused by virus,
albeit a benevolent one. We call this the U1B1-B virus3. Our data shows that people sick with
this virus tend to be friends with other sick people, but this alone is not the evidence that the
“disease” is contagious. This clustering could easily be explained by the fact that people tend
to befriend people who are of similar “age” and in a similar “health” condition and therefore
belong to the same “health” risk group and are equally likely to catch the U1B1-B virus from the
environment (rather than from a peer), causing the observed clustering. Therefore, the question
of our experiment would be: is the U1B1-B “subscription disease” contagious or is it just caught
from the “environment” by cliques of people who are in “poor health”?
For the experiment, we will randomly select the manipulated group M of 1000 Last.fm users
who will be chosen to receive the subscription gifts, which is akin to getting randomly infected by
the U1B1-B virus, over which they have no control, ruling out any self-selection, and individual
characteristics or contextual (observed or unobserved) homophily-based decisions that confound
the analysis of observational data. We will also randomly select the not-manipulated group NM of
1000 random Last.fm users who do not get “infected” by us.
After a period of time, we compare the occurrence of the “disease” among the friends of group M
and friends of group NM . Given the initial uniform randomization of groups M and NM , both
observed and unobserved statistical properties of M and NM are expected to be statistically
identical before the manipulation. Therefore, if any statistical difference is observed in the out-
comes among friends of M and friends of NM groups, this difference should be attributed to our
manipulation.
3 stands for Umyarov-1-Bapna-1-Benevolent

Ravi Bapna and Akhmed Umyarov: Do Your Online Friends Make You Pay?NBER Working Paper Series 2012 9
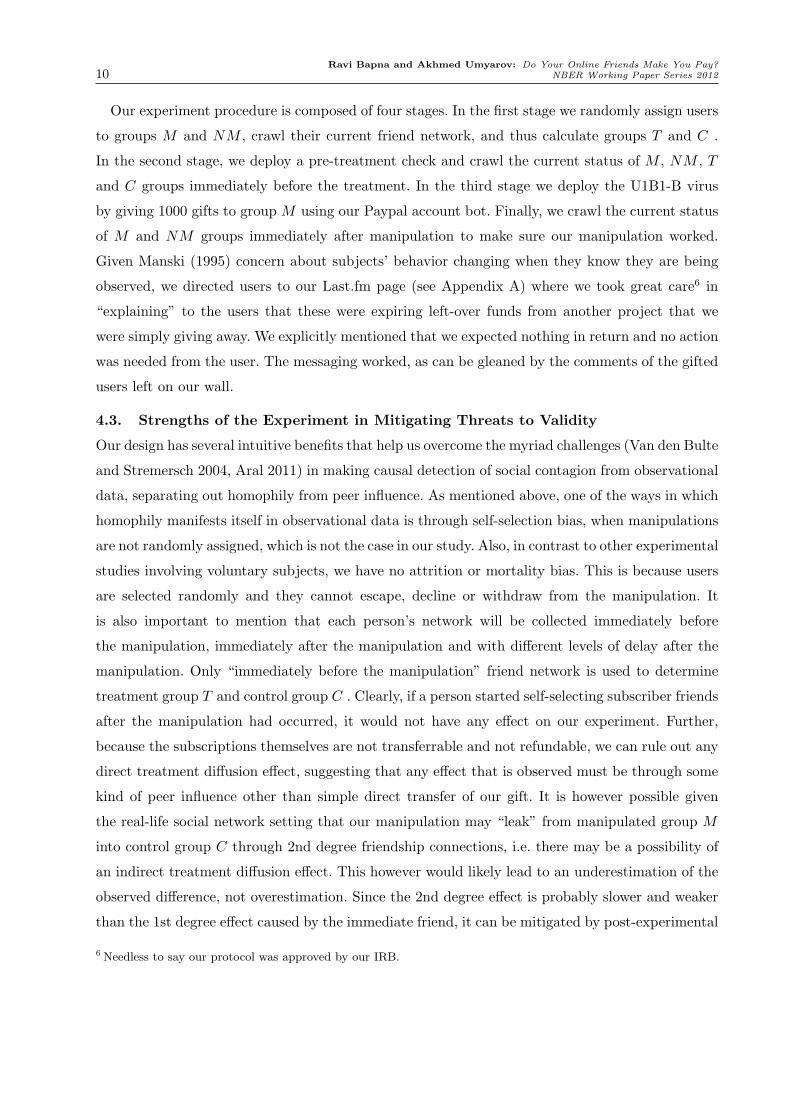
Figure 1 Venn Diagram Showing Treatment, Control, Manipulated and Non-Manipulated Groups
4.2. Formal Design
At the onset of the study we collected Last.fm social network data that consists of roughly 3.8 mil-
lion users. Because there are a considerable number of inactive accounts in the network, we decided
to direct our attention only to the active users for receiving subscription gifts, where a user is
considered active if she listened to at least 1 song in the last 30 days before our manipulation. It
turned out there were roughly 1.26 million active listeners in the Last.fm connected component.
Let’s call this list L. We form the group G as a random sample of 2000 users drawn uniformly
randomly from L with no replacement. Therefore, group G contains 2000 users who will then be
randomly split into manipulated and non-manipulated groups. Consequently, we form the manip-
ulated group M as a random sample of 1000 users drawn uniformly randomly from G with no
replacement. Finally, we form the non-manipulated group NM as NM = G\M , that is the rest
1000 users that were left in G after we picked group M .
We define our treatment group T as all immediate friends of M who are not themselves in M
or NM and who are not friends of someone in NM . Symmetrically, we define our control group
C as all immediate friends of NM who are not themselves in M or NM and are not friends of
someone in M . Figure 1 presents an intuitive Venn diagram for these sets of users. Given the real-
world nature of our data, a small number of users will likely turn out to be friends of both M and
NM groups simultaneously4. These users cannot be unequivocally put either into the treatment
or control group and hence were excluded5 from the experiment.
4 In our empirical data, this intersection constitutes less than 5% of the treatment and control groups.
5 Excluding the intersection seems to be the best way to proceed since keeping it in either T or C alone wouldimmediately throw T and C off-balance. Alternatively, including this intersection in both T and C constitutes aguaranteed bias: estimates become biased if exactly the same set of people is counted to be both in the treatmentgroup and in the control group at the same time.
Ravi Bapna and Akhmed Umyarov: Do Your Online Friends Make You Pay?10 NBER Working Paper Series 2012
Our experiment procedure is composed of four stages. In the first stage we randomly assign users
to groups M and NM , crawl their current friend network, and thus calculate groups T and C .
In the second stage, we deploy a pre-treatment check and crawl the current status of M , NM , T
and C groups immediately before the treatment. In the third stage we deploy the U1B1-B virus
by giving 1000 gifts to group M using our Paypal account bot. Finally, we crawl the current status
of M and NM groups immediately after manipulation to make sure our manipulation worked.
Given Manski (1995) concern about subjects’ behavior changing when they know they are being
observed, we directed users to our Last.fm page (see Appendix A) where we took great care6 in
“explaining” to the users that these were expiring left-over funds from another project that we
were simply giving away. We explicitly mentioned that we expected nothing in return and no action
was needed from the user. The messaging worked, as can be gleaned by the comments of the gifted
users left on our wall.
4.3. Strengths of the Experiment in Mitigating Threats to Validity
Our design has several intuitive benefits that help us overcome the myriad challenges (Van den Bulte
and Stremersch 2004, Aral 2011) in making causal detection of social contagion from observational
data, separating out homophily from peer influence. As mentioned above, one of the ways in which
homophily manifests itself in observational data is through self-selection bias, when manipulations
are not randomly assigned, which is not the case in our study. Also, in contrast to other experimental
studies involving voluntary subjects, we have no attrition or mortality bias. This is because users
are selected randomly and they cannot escape, decline or withdraw from the manipulation. It
is also important to mention that each person’s network will be collected immediately before
the manipulation, immediately after the manipulation and with different levels of delay after the
manipulation. Only “immediately before the manipulation” friend network is used to determine
treatment group T and control group C . Clearly, if a person started self-selecting subscriber friends
after the manipulation had occurred, it would not have any effect on our experiment. Further,
because the subscriptions themselves are not transferrable and not refundable, we can rule out any
direct treatment diffusion effect, suggesting that any effect that is observed must be through some
kind of peer influence other than simple direct transfer of our gift. It is however possible given
the real-life social network setting that our manipulation may “leak” from manipulated group M
into control group C through 2nd degree friendship connections, i.e. there may be a possibility of
an indirect treatment diffusion effect. This however would likely lead to an underestimation of the
observed difference, not overestimation. Since the 2nd degree effect is probably slower and weaker
than the 1st degree effect caused by the immediate friend, it can be mitigated by post-experimental
6 Needless to say our protocol was approved by our IRB.

Ravi Bapna and Akhmed Umyarov: Do Your Online Friends Make You Pay?NBER Working Paper Series 2012 11
controls on the shortest distances between the control group C and the treatment group T and on
the time passed since manipulation. Finally we can rule out any compensatory rivalry/resentful
demoralization or experimenter bias, since neither treatment group T nor control group C know
that they are being treated and watched. Only manipulated group M receives a gift from us.
However, manipulated group M is told that the gift is given out of the expiring left-over funds
from a prior survey and that gift receiver is not required to do anything, thus group M itself is
also not aware of being manipulated and watched.
5. Data Description5.1. Snapshot Data
Our dataset was collected by our custom multi-threaded, Amazon Cloud-based web crawler and
consists of panel data on approximately 3.8 million users that make up the largest connected
component7 of Last.fm network forming over 23 million friendship pairs . These users have been
tracked consistently as a panel since May 2011 with updates roughly every 2 weeks. These dynamic
updates provided us with fresh snapshots of the entire social network containing the list of friends
and subscription status for every user. In addition to this information, we have been tracking
self-reported demographic information and website-reported social activity information.
For every snapshot at time t, we have collected the following data for each user:
• Agei,t. Self-reported age of user i. Age distribution was truncated to the interval between 8
and 79 in order to eliminate outlier data points that are likely fake.
• Gender i,t. Self-reported gender of user i. Dummy variable.
• FriendCnt i,t. Total count of number of friends of user i.
• SubscriberFriendCnt i,t. Total count of number of friends of user i who are paid subscribers at
time t.
• SongsListened i,t. Total count of all songs ever listened and reported to Last.fm by user i. If
a user listened to the same song twice, the song would be counted twice as well. (An alternative
name for that variable could be TotalCountOfPlays i,t)
• Playlists i,t. Total count of playlists ever made by user i on Last.fm.
• Posts i,t. Total count of forum posts ever made by user i.
• Shouts i,t. Total count of shouts8 ever received user i.
7 We employed multiple checks to ensure that we indeed got the largest connected component of the network and notjust some smaller closed clique of users. Our checks ranged from looking for additional users in forums to crawling thelists of recommended music “neighbors” of each user. The total number of the extra users that we checked outsideof our connected component amounts to the additional 0.5 million unique users. We have not discovered any otherlarge connected component.
8 Shout is a Last.fm slang for a wall post on the user’s “wall”.
Ravi Bapna and Akhmed Umyarov: Do Your Online Friends Make You Pay?12 NBER Working Paper Series 2012
• LovedTracks i,t. Total count of all tracks that were “loved” by user i.
• RegDatei. User i original registration date on the website measured as number of days since
January 1, 1960 (standard date representation of SAS statistical package).
• LastfmCountry i,t. Dummy variable. If user i’s self-reported country is “USA”, “Germany”
or “UK”, then LastfmCountry=1 for this user, otherwise 0. This variable is important because
Last.FM subscription rules are slightly different9 in the official Last.fm countries (“USA”, “Ger-
many”, “UK”) versus the rest of the world.
• Subscriberi,t. Dummy variable indicating whether user i is currently a premium subscriber.
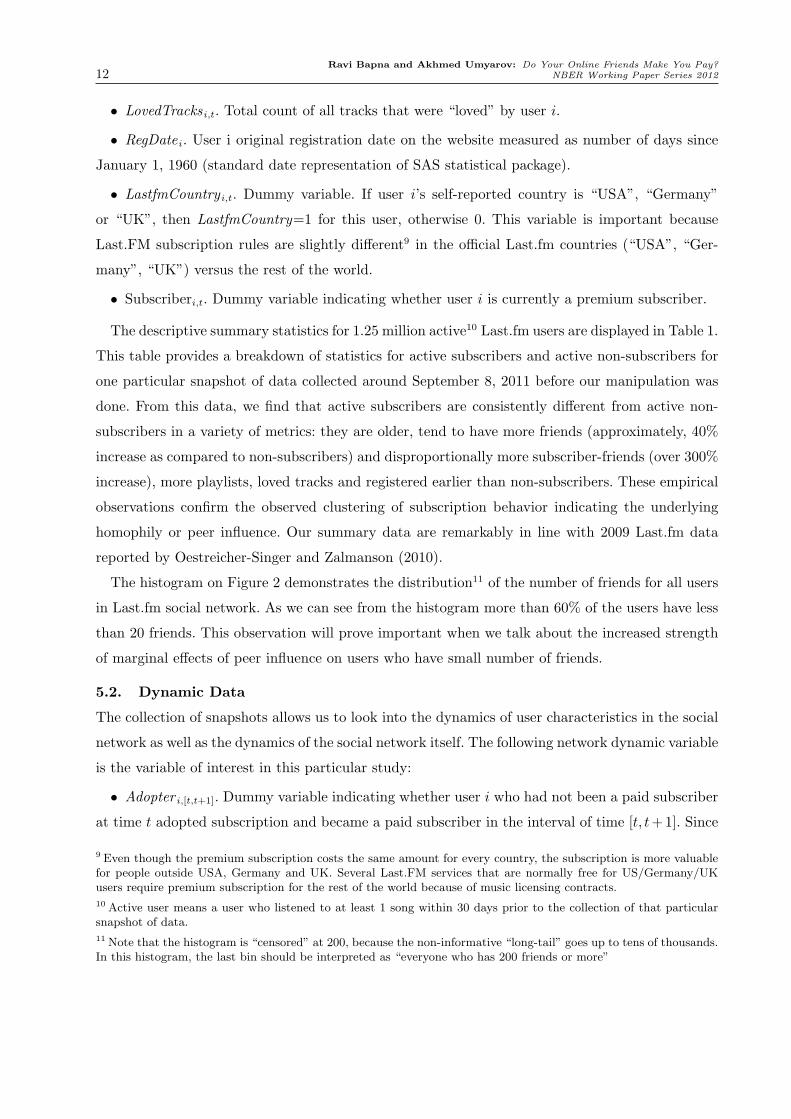
The descriptive summary statistics for 1.25 million active10 Last.fm users are displayed in Table 1.
This table provides a breakdown of statistics for active subscribers and active non-subscribers for
one particular snapshot of data collected around September 8, 2011 before our manipulation was
done. From this data, we find that active subscribers are consistently different from active non-
subscribers in a variety of metrics: they are older, tend to have more friends (approximately, 40%
increase as compared to non-subscribers) and disproportionally more subscriber-friends (over 300%
increase), more playlists, loved tracks and registered earlier than non-subscribers. These empirical
observations confirm the observed clustering of subscription behavior indicating the underlying
homophily or peer influence. Our summary data are remarkably in line with 2009 Last.fm data
reported by Oestreicher-Singer and Zalmanson (2010).
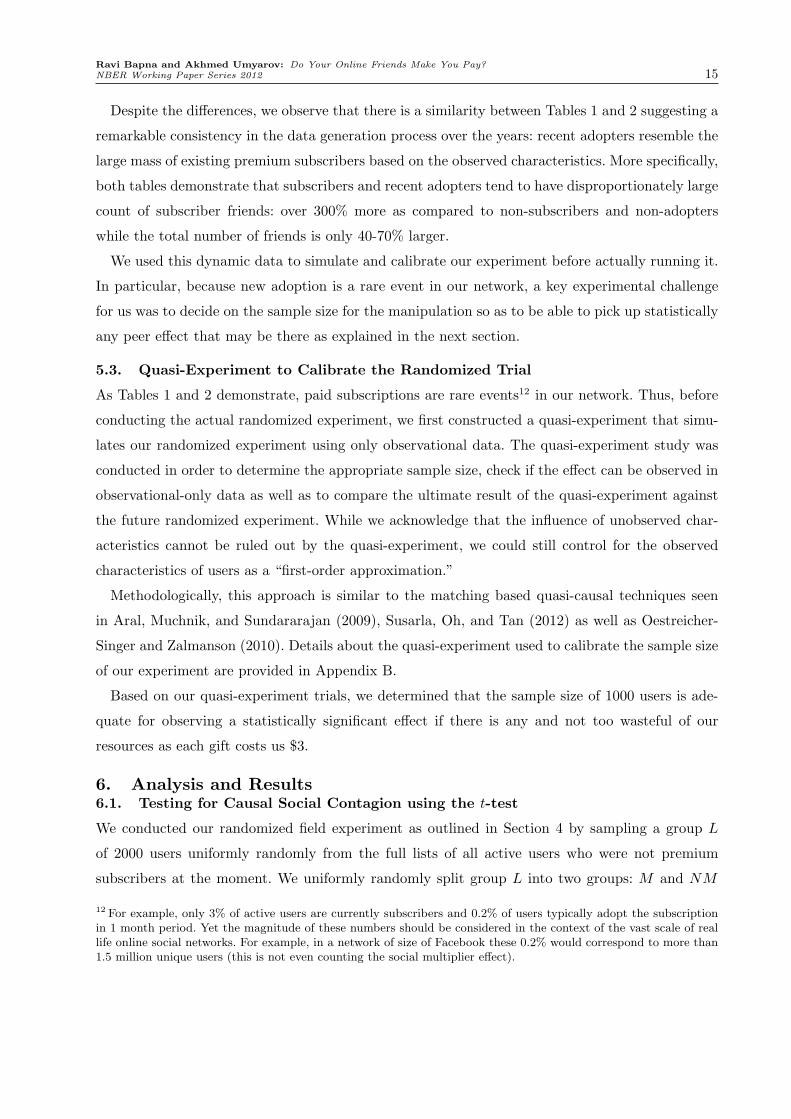
The histogram on Figure 2 demonstrates the distribution11 of the number of friends for all users
in Last.fm social network. As we can see from the histogram more than 60% of the users have less
than 20 friends. This observation will prove important when we talk about the increased strength
of marginal effects of peer influence on users who have small number of friends.
5.2. Dynamic Data
The collection of snapshots allows us to look into the dynamics of user characteristics in the social
network as well as the dynamics of the social network itself. The following network dynamic variable
is the variable of interest in this particular study:
• Adopter i,[t,t+1]. Dummy variable indicating whether user i who had not been a paid subscriber
at time t adopted subscription and became a paid subscriber in the interval of time [t, t+1]. Since
9 Even though the premium subscription costs the same amount for every country, the subscription is more valuablefor people outside USA, Germany and UK. Several Last.FM services that are normally free for US/Germany/UKusers require premium subscription for the rest of the world because of music licensing contracts.
10 Active user means a user who listened to at least 1 song within 30 days prior to the collection of that particularsnapshot of data.
11 Note that the histogram is “censored” at 200, because the non-informative “long-tail” goes up to tens of thousands.In this histogram, the last bin should be interpreted as “everyone who has 200 friends or more”

Ravi Bapna and Akhmed Umyarov: Do Your Online Friends Make You Pay?NBER Working Paper Series 2012 13
Subscriber N Obs Variable Mean Std Dev Missing Median Min Max
0 1214303 Age 23.21 6.18 385200 22 8 79Gender (Male=1) 0.66 0.48 234278 1 0 1FriendCnt 24.18 70.65 0 10 1 11780SubscriberFriendCnt 0.65 2.85 0 0 0 541SongsListened 24913.30 32365.72 1 15022 0 1000472.00Playlists 0.53 3.32 0 0 0 2291Posts 7.67 141.70 0 0 0 64108Shouts 42.19 271.02 27717 5 0 131765LovedTracks 128.15 406.44 0 35 0 99109RegDate 17838.23 636.71 584 17902 15642 18877LastfmCountry 0.30 0.46 0 0 0 1
1 37161 Age 30.26 9.25 14165 28 8 78Gender (Male=1) 0.76 0.43 8449 1 0 1FriendCnt 33.73 116.62 0 10 1 9788SubscriberFriendCnt 2.85 10.35 0 1 0 709SongsListened 31996.64 43938.95 0 18139 0 1000070Playlists 1.44 5.38 0 1 0 496Posts 27.74 465.16 0 0 0 50740Shouts 85.31 531.56 1275 5 0 36508LovedTracks 370.05 1104.95 0 149 0 63595RegDate 17678.54 628.82 1 17735 15642 18868LastfmCountry 0.28 0.45 0 0.00 0.00 1.00
Table 1 Summary Statistics of Historical Data for Active Users
Figure 2 Distribution of Number of Friends of Last.fm Users
(the last bin represents the “long-tail” of users having 200 friends or more)

Ravi Bapna and Akhmed Umyarov: Do Your Online Friends Make You Pay?14 NBER Working Paper Series 2012
Adopter N Obs Variable Mean Std Dev Missing Median Min Max
0 1211366 Age 23.20 6.18 384294 22 8 79Gender (Male=1) 0.66 0.48 233726 1 0 1FriendCnt 24.16 70.43 0 10 1 11780SubscriberFriendCnt 0.65 2.80 0 0 0 465SongsListened 24912.04 32363.37 1 15024 0 1000472Playlists 0.53 3.32 0 0 0 2291Posts 7.67 141.83 0 0 0 64108Shouts 42.14 271.01 27602 5 0 131765LovedTracks 127.97 406.32 0 35 0 99109RegDate 17838.13 636.65 584 17902 15642 18877LastfmCountry 0.30 0.46 0 0 0 1
1 1099 Age 26.31 7.13 346 25 11 74Gender (Male=1) 0.70 0.46 204 1 0 1FriendCnt 42.70 196.79 0 14 1 4730SubscriberFriendCnt 2.76 17.58 0 1 0 541SongsListened 31984.12 38619.43 0 18991 0 423529Playlists 1.05 1.98 0 1 0 27Posts 13.08 96.25 0 0 0 2266Shouts 93.17 381.14 43 7 0 6247LovedTracks 310.65 542.01 0 133 0 6143RegDate 17712.48 651.39 0 17734 15642 18877LastfmCountry 0.24 0.43 0 0 0 1
Table 2 Summary Statistics of Data for Recent Adopters over 2-3 weeks
the minimum possible unit of a premium subscription is 1 month and we collected our data with
the intervals of 2-3 weeks, our data collection process has not missed any single subscription event
for any user in the network beginning from May 2011 and till the moment this paper is being
read by our readers. Therefore, Adopter i,[t,t+1] variable is an objective and guaranteed indicator of
adoption or absence of adoption in time period [t, t+1] for every user among 3.8 million users.
Similarly to Table 1, Table 2 displays the summary statistics for the dynamic data of recent
adopters vs. recent non-adopters. Please note that there is a subtle, but very important difference
between the types of information displayed by Table 1 and Table 2:
• Table 1 compares the current subscribers versus current free users. This is the information
about the current state that the network has achieved over the years.
• Table 2 displays the information on the recent adopters. This is the information about the
change in the current state: a change in the network over 2-3 week period.
The difference between Table 1 and Table 2 can be explained better if we mention that many
people who are currently subscribers have been premium subscribers for very long time. Clearly,
these “mature subscribers” should not be considered recent adopters and should not be counted
in Table 2, but they are still subscribers and therefore, should be counted in Table 1.
Ravi Bapna and Akhmed Umyarov: Do Your Online Friends Make You Pay?NBER Working Paper Series 2012 15
Despite the differences, we observe that there is a similarity between Tables 1 and 2 suggesting a
remarkable consistency in the data generation process over the years: recent adopters resemble the
large mass of existing premium subscribers based on the observed characteristics. More specifically,
both tables demonstrate that subscribers and recent adopters tend to have disproportionately large
count of subscriber friends: over 300% more as compared to non-subscribers and non-adopters
while the total number of friends is only 40-70% larger.
We used this dynamic data to simulate and calibrate our experiment before actually running it.
In particular, because new adoption is a rare event in our network, a key experimental challenge
for us was to decide on the sample size for the manipulation so as to be able to pick up statistically
any peer effect that may be there as explained in the next section.
5.3. Quasi-Experiment to Calibrate the Randomized Trial
As Tables 1 and 2 demonstrate, paid subscriptions are rare events12 in our network. Thus, before
conducting the actual randomized experiment, we first constructed a quasi-experiment that simu-
lates our randomized experiment using only observational data. The quasi-experiment study was
conducted in order to determine the appropriate sample size, check if the effect can be observed in
observational-only data as well as to compare the ultimate result of the quasi-experiment against
the future randomized experiment. While we acknowledge that the influence of unobserved char-
acteristics cannot be ruled out by the quasi-experiment, we could still control for the observed
characteristics of users as a “first-order approximation.”
Methodologically, this approach is similar to the matching based quasi-causal techniques seen
in Aral, Muchnik, and Sundararajan (2009), Susarla, Oh, and Tan (2012) as well as Oestreicher-
Singer and Zalmanson (2010). Details about the quasi-experiment used to calibrate the sample size
of our experiment are provided in Appendix B.
Based on our quasi-experiment trials, we determined that the sample size of 1000 users is ade-
quate for observing a statistically significant effect if there is any and not too wasteful of our
resources as each gift costs us $3.
6. Analysis and Results6.1. Testing for Causal Social Contagion using the t-test
We conducted our randomized field experiment as outlined in Section 4 by sampling a group L
of 2000 users uniformly randomly from the full lists of all active users who were not premium
subscribers at the moment. We uniformly randomly split group L into two groups: M and NM
12 For example, only 3% of active users are currently subscribers and 0.2% of users typically adopt the subscriptionin 1 month period. Yet the magnitude of these numbers should be considered in the context of the vast scale of reallife online social networks. For example, in a network of size of Facebook these 0.2% would correspond to more than1.5 million unique users (this is not even counting the social multiplier effect).

Ravi Bapna and Akhmed Umyarov: Do Your Online Friends Make You Pay?16 NBER Working Paper Series 2012
Variable Group Not Miss Mean Std Err Minimum Maximum t-value Pr> |t|
Age NM 697 23.3529 0.2425 11 69 0.16 0.8698M 709 23.2990 0.2225 14 66
Gender (Male=1) NM 819 0.6606 0.0166 0 1 0.98 0.3256M 819 0.6374 0.0168 0 1
FriendCnt NM 1000 26.4890 1.9297 1 918 -0.24 0.8089M 1000 27.3050 2.7683 1 2248
SubscriberFriendCnt NM 1000 0.7860 0.1169 0 100 0.65 0.5138M 1000 0.6930 0.0813 0 40
SongsListened NM 1000 28260.9 1286.6 35 536568 0.93 0.3539M 1000 26723.8 1045.5 32 365165
Playlists NM 1000 0.5560 0.0275 0 11 1.31 0.1901M 1000 0.4990 0.0337 0 22
Posts NM 1000 6.7290 1.4856 0 846 -0.10 0.9210M 1000 6.9410 1.5355 0 696
Shouts NM 970 39.1918 4.4609 0 2530 0.05 0.9595M 975 38.9036 3.5029 0 1528
LovedTracks NM 1000 144.5 13.8871 0 8214 0.11 0.9090M 1000 142.5 11.5661 0 6396
RegDate NM 1000 17763.2 19.3645 15778 18753 0.64 0.5221M 1000 17745.6 19.3291 15815 18760
Table 3 Groups M and NM have Similar Observed Statistical Properties
with 1000 users each, therefore there is no reason to believe that groups M and NM would be
systematically different from each other in either observed or unobserved attributes, or that the
friends of group M and the friends of group NM could be systematically different as was confirmed
by Table 3 as well as by our additional tests with bootstrapping.
Each person in group M subsequently received a 1 month subscription gift from us, with the
1000 gifts being distributed over the period of several hours by a GreaseMonkey script. The users
from group NM did not receive any gift or any other communication from us and were only being
silently tracked.13
Also, a manipulation check was done immediately after distributing the gifts. This check demon-
strated that all 1000 users in group M received the gift and became premium subscribers imme-
diately. In one month after the manipulation was done, we collected a new snapshot of the social
13 While clinical trials frequently give a placebo pill to the control group instead of just not giving anything at all, inour study we do not need it. Clinical trials deal with special circumstances of mind-body connection: it is well-known(Ariely 2010) that a placebo pill itself can demonstrate significant improvements in patient health as compared tono treatment at all. Therefore, clinical trials have to demonstrate not that the pill works in general, but that thepill works stronger than placebo works. Therefore, for clinical trials, it is typically a comparison of two alternativemechanisms both of which work. In our case, we do not intend to show that our manipulation works stronger thansome other alternative manipulation. Instead, we plan to demonstrate that our manipulation works stronger thanhaving no manipulation and simply “going with the flow”.

Ravi Bapna and Akhmed Umyarov: Do Your Online Friends Make You Pay?NBER Working Paper Series 2012 17
Friend of N Mean Std Dev Std Err t-value Pr> |t|NM 21284 0.00197 0.0444 0.000304 2.06 0.0394M 21981 0.00296 0.0543 0.000366
Table 4 Experimental results: t-test
network and compared adoption behavior among all friends of group M versus all friends of group
NM as described in the experiment design.
Given exogenous and independent randomization of our manipulation, the assignment of user i
as a friend of M or NM is independent of her observed or unobserved characteristics, therefore we
can compare the distributions of outcomes among friends of M and friends of NM without any
need for controls.
As shown by the results of the t-test in Table 4, friends of group M demonstrated statistically
and economically significant difference against friends of NM : there were approximately 50% more
adoptions in the treatment group as compared to the control group. This offers valid support for the
existence and importance of causal peer-effects for premium subscription adoption in the general
population of Last.fm social network.
In order to demonstrate the economic significance of this effect, it should be noted that groupsM
andNM were selected as a random sample from the general population and not from the population
of very influential people. It is remarkable that even 1000 average social network users have been
able to exert that much peer influence on their friends. It is a part of a separate study to explore
how much stronger the influence could have been had we focused ourselves on manipulating the
sample of 1000 highly influential people rather than 1000 average people.
In addition to that, it is important to point out that we only look at the effect on immediate
friends of M and NM in this paper. As was mentioned in Section 1, peer influence is subject
to social multiplier effect such that once influenced the immediate friends of M and NM may
themselves start influencing their own friends, possibly increasing economic significance of the
original first-degree effect dramatically.
6.2. Logistic Regression
As explained in Section 5, we were able to collect considerable data about individual users. Given
the exogenously randomized nature of our experimental design, knowing this data is not required
for testing Hypothesis 1. Nevertheless, this data is useful in explaining the individual adoption
decisions and we can utilize it to introduce control variables in order to increase statistical effi-
ciency of our model as well as to set up the stage for testing Hypothesis 2. Since our outcome
variable Adopter i,[t,t+1] is a binary variable we decided to use the standard logistic regression as
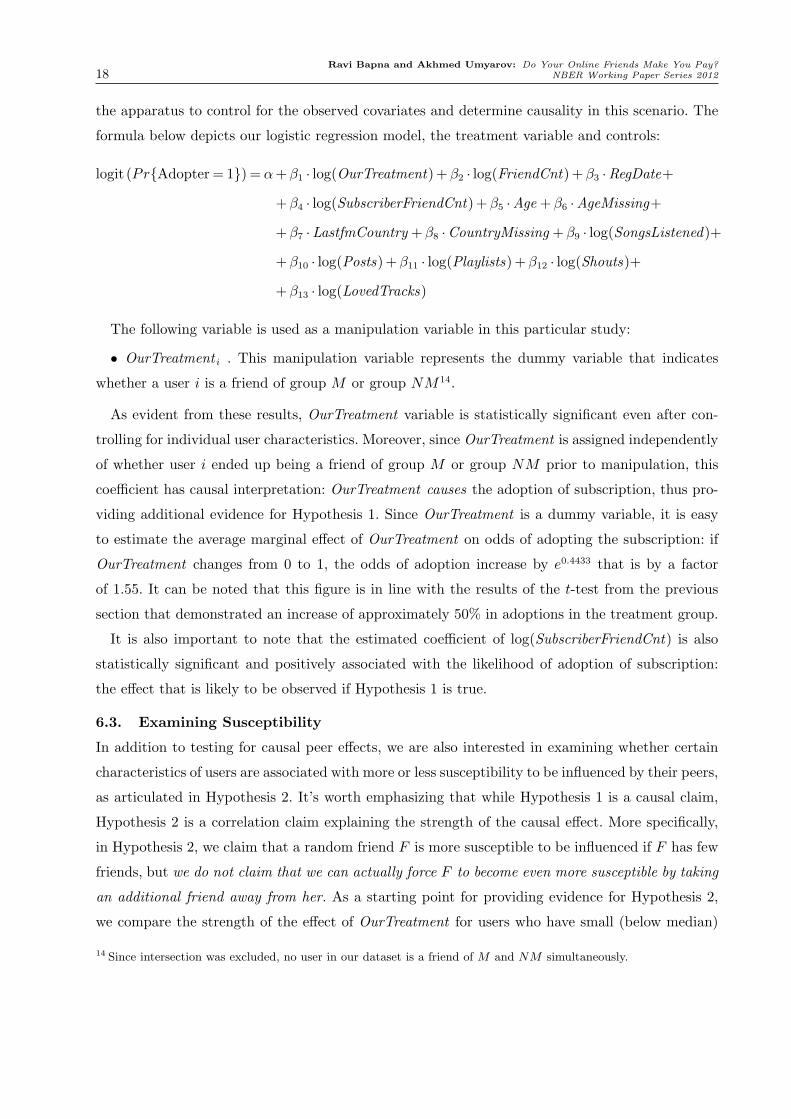
Ravi Bapna and Akhmed Umyarov: Do Your Online Friends Make You Pay?18 NBER Working Paper Series 2012
the apparatus to control for the observed covariates and determine causality in this scenario. The
formula below depicts our logistic regression model, the treatment variable and controls:
logit (Pr{Adopter = 1}) = α+β1 · log(OurTreatment)+β2 · log(FriendCnt)+β3 ·RegDate+
+β4 · log(SubscriberFriendCnt)+β5 ·Age +β6 ·AgeMissing+
+β7 ·LastfmCountry +β8 ·CountryMissing +β9 · log(SongsListened)+
+β10 · log(Posts)+β11 · log(Playlists)+β12 · log(Shouts)+
+β13 · log(LovedTracks)
The following variable is used as a manipulation variable in this particular study:
• OurTreatment i . This manipulation variable represents the dummy variable that indicates
whether a user i is a friend of group M or group NM 14.
As evident from these results, OurTreatment variable is statistically significant even after con-
trolling for individual user characteristics. Moreover, since OurTreatment is assigned independently
of whether user i ended up being a friend of group M or group NM prior to manipulation, this
coefficient has causal interpretation: OurTreatment causes the adoption of subscription, thus pro-
viding additional evidence for Hypothesis 1. Since OurTreatment is a dummy variable, it is easy
to estimate the average marginal effect of OurTreatment on odds of adopting the subscription: if
OurTreatment changes from 0 to 1, the odds of adoption increase by e0.4433 that is by a factor
of 1.55. It can be noted that this figure is in line with the results of the t-test from the previous
section that demonstrated an increase of approximately 50% in adoptions in the treatment group.
It is also important to note that the estimated coefficient of log(SubscriberFriendCnt) is also
statistically significant and positively associated with the likelihood of adoption of subscription:
the effect that is likely to be observed if Hypothesis 1 is true.
6.3. Examining Susceptibility
In addition to testing for causal peer effects, we are also interested in examining whether certain
characteristics of users are associated with more or less susceptibility to be influenced by their peers,
as articulated in Hypothesis 2. It’s worth emphasizing that while Hypothesis 1 is a causal claim,
Hypothesis 2 is a correlation claim explaining the strength of the causal effect. More specifically,
in Hypothesis 2, we claim that a random friend F is more susceptible to be influenced if F has few
friends, but we do not claim that we can actually force F to become even more susceptible by taking
an additional friend away from her. As a starting point for providing evidence for Hypothesis 2,
we compare the strength of the effect of OurTreatment for users who have small (below median)
14 Since intersection was excluded, no user in our dataset is a friend of M and NM simultaneously.

Ravi Bapna and Akhmed Umyarov: Do Your Online Friends Make You Pay?NBER Working Paper Series 2012 19
Variable Estimate Std Err Wald χ2 Pr>χ2
Intercept: adopter=0 −3.6311 3.8762 0.8775 0.3489OurTreatment 0.4433 0.2022 4.8043 0.0284log(FriendCnt) −0.2308 0.1467 2.4734 0.1158log(SubscriberFriendCnt) 0.4544 0.1578 8.2910 0.0040Age 0.0292 0.0139 4.3905 0.0361AgeMissing 0.5599 0.4567 1.5028 0.2202LastfmCountry −0.4405 0.2428 3.2908 0.0697CountryMissing 0.0668 0.3690 0.0328 0.8563RegDate −0.00030 0.000200 2.2362 0.1348log(SongsListened) 0.1102 0.0862 1.6349 0.2010log(Posts) 0.0733 0.0653 1.2575 0.2621log(Playlists) 0.4070 0.1568 6.7375 0.0094log(Shouts) 0.0243 0.0791 0.0944 0.7587log(LovedTracks) 0.2511 0.0639 15.4215 <.0001
Table 5 Experimental results: logistic regression
small FriendCnt large FriendCntVariable Estimate Pr > χ2 Estimate Pr > χ2
Intercept: adopter=0 -3.5497 0.5812 -2.6041 0.6106OurTreatment 0.8200 0.0243 0.2881 0.2438log(FriendCnt) 0.3641 0.3199 -0.5482 0.0132log(SubscriberFriendCnt) 0.7211 0.0233 0.6350 0.0011Age 0.0722 <.0001 -0.0174 0.4511AgeMissing 1.3647 0.0621 -0.4054 0.5331LastfmCountry -0.5859 0.1473 -0.4190 0.1726CountryMissing -0.0258 0.9695 0.2923 0.5022RegDate -0.00049 0.1409 -0.00019 0.4595log(SongsListened) 0.1289 0.3751 0.0687 0.5395log(Posts) 0.0227 0.8838 0.0981 0.1759log(Playlists) 0.1945 0.5681 0.4490 0.0097log(Shouts) -0.0176 0.9048 0.0357 0.7037log(LovedTracks) 0.2768 0.0083 0.2150 0.0079
Table 6 Experimental results: separate logistic regressions for two groups
number of friends and users who have large number of friends (above median). To accomplish that
we split both the treatment and control groups into two subgroups:
• Small FriendCnt subgroup that consists of all users i from T and C who have FriendCnt i ≤m
• Large FriendCnt subgroup that consists of all users j from T and C who have FriendCnt j ≥m
wherem is the overall median FriendCnt that users from T and C has. By splitting our treatment
and control group this way we ensure that both of these subgroups are of equivalent sample sizes
and therefore the groups could be compared more directly.

Ravi Bapna and Akhmed Umyarov: Do Your Online Friends Make You Pay?20 NBER Working Paper Series 2012
Variable Estimate Std Err Wald χ2 Pr>χ2
Intercept: adopter=0 −4.3159 3.9064 1.2207 0.2692OurTreatment 1.4780 0.6257 5.5806 0.0182OurTreatment * log(FriendCnt) −0.2428 0.1282 3.5851 0.0583log(FriendCnt) −0.0745 0.1708 0.1903 0.6627log(SubscriberFriendCnt) 0.4490 0.1581 8.0619 0.0045Age 0.0294 0.0140 4.3907 0.0361AgeMissing 0.5621 0.4583 1.5040 0.2201LastfmCountry −0.4441 0.2430 3.3406 0.0676CountryMissing 0.0732 0.3687 0.0394 0.8427RegDate −0.00030 0.000201 2.2136 0.1368log(SongsListened) 0.1086 0.0862 1.5886 0.2075log(Posts) 0.0761 0.0655 1.3484 0.2456log(Playlists) 0.4075 0.1570 6.7348 0.0095log(Shouts) 0.0248 0.0789 0.0990 0.7530log(LovedTracks) 0.2510 0.0639 15.4258 <.0001
Table 7 Peer Effects are Moderated by the Number of Friends of Influencee
Consequently, we run separate logistic regressions for each of these two subgroups and compare
the results side-by-side in Table 6.
As demonstrated by the results in Table 6, OurTreatment variable is statistically significant for
users who have small number of friends while being statistically insignificant for users who have
large number of friends. This result suggests that the strength of the effect of OurTreatment on
the target user actually depends on the total number of friends the target user has.
6.4. Logistic Regression with Interaction Term
Given the results of Table 6, it is natural to refine the model such as it becomes capable of
learning the decreasing strength of OurTreatment from data itself. To achieve this, we introduce
the interaction term between OurTreatment and FriendCnt.
In addition to that we propose to refine the model even further and notice that some of our
users in group T naturally received “multiple treatments”: just by chance they happened to have
two or more friends that were manipulated by us. For these users, we assume the linear response
to additional treatment and refined our model as follows:
• OurTreatment i,t . This manipulation variable represents the count of how many friends of user
i were manipulated by us at time t. Since this variable was manipulated by us independently of
whether user i ended up being a friend of M or NM prior to manipulation, its coefficient has
causal interpretation.
Table 7 presents the results of fitting the model with interaction term to our data. Observe that
we obtain a negative coefficient for the interaction term. This implies that the larger FriendCnt is,
the weaker is the response to OurTreatment other things being equal, thus supporting Hypothesis 2.

Ravi Bapna and Akhmed Umyarov: Do Your Online Friends Make You Pay?NBER Working Paper Series 2012 21
Figure 3 Randomized Experiment Design:
Naturally Occurring “OtherTreatment” Offers an Interesting Contrast to OurTreatment
6.5. Some Insights into the Homophily and Peer Influence Rivalry
An interesting aspect of our real-world experimental setup is that while our manipulation was in
progress, users in groups T and C still had some other friends from the other parts of the network
who decided to purchase the subscription on their own as demonstrated in Figure 3. These adopter
friends from the “outer” network15 may have also exerted some peer influence on the treatment
and control groups.
Because of the exogenous random assignment of OurTreatment, these “other treatments” do
not introduce any statistical bias since the friends of M and friends of NM should be exposed
to statistically equivalent levels of this background “other treatment”. Nevertheless, by creating a
new control variable called OtherTreatment and controlling for this “other treatment” administered
by the rest of the network, we are able to learn the strength of peer influence as compared to
homophily.
Considering Figure 3, the key difference between OurTreatment and OtherTreatment lies in the
fact that user A did not choose to be a subscriber on her own, it is we, the experimenters, who
chose to subscribe her. At the same time, user C is a self-selected subscriber and therefore, is more
likely than average to come from the “premium subscription risk-group”.
Rephrasing the same idea in U1B1-B virus terms, user A is an average user artificially infected
by us with the virus. At the same time, user C is infected on her own, so likely belongs to the
15 That is, these naturally occurring adopter friends are not from groups M , NM , T or C, but from the rest of the3.8 million network.
Ravi Bapna and Akhmed Umyarov: Do Your Online Friends Make You Pay?22 NBER Working Paper Series 2012
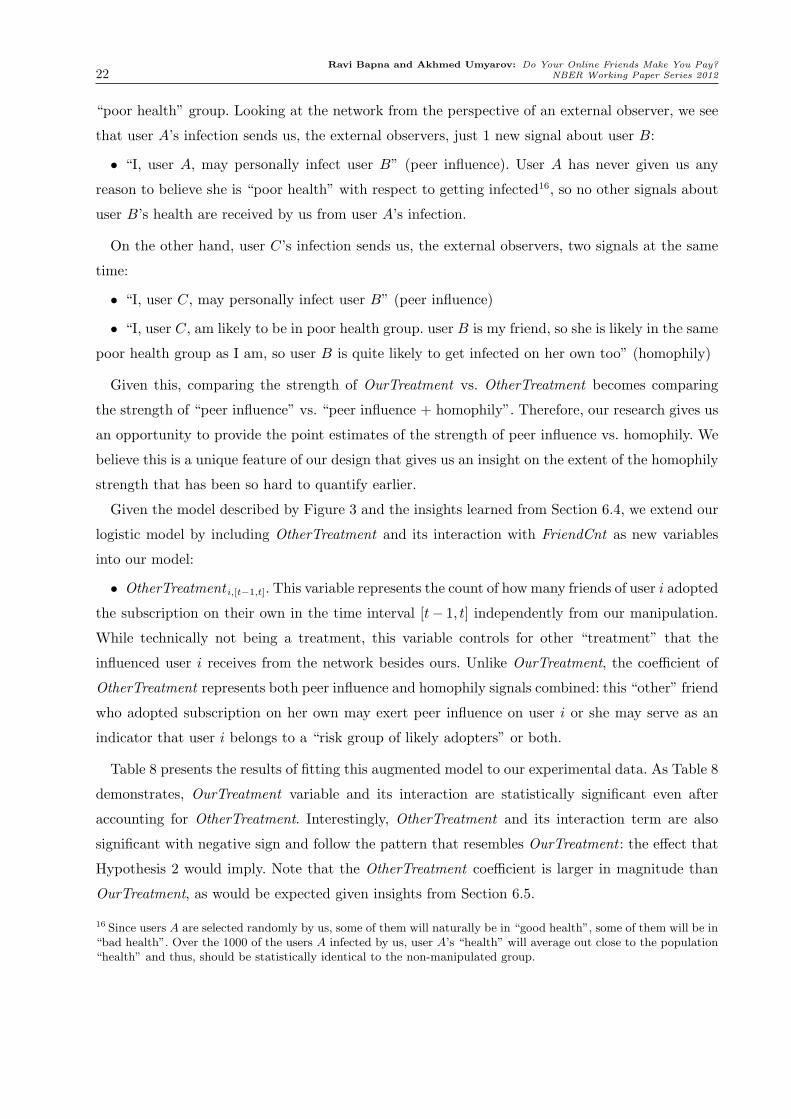
“poor health” group. Looking at the network from the perspective of an external observer, we see
that user A’s infection sends us, the external observers, just 1 new signal about user B:
• “I, user A, may personally infect user B” (peer influence). User A has never given us any
reason to believe she is “poor health” with respect to getting infected16, so no other signals about
user B’s health are received by us from user A’s infection.
On the other hand, user C’s infection sends us, the external observers, two signals at the same
time:
• “I, user C, may personally infect user B” (peer influence)
• “I, user C, am likely to be in poor health group. user B is my friend, so she is likely in the same
poor health group as I am, so user B is quite likely to get infected on her own too” (homophily)
Given this, comparing the strength of OurTreatment vs. OtherTreatment becomes comparing
the strength of “peer influence” vs. “peer influence + homophily”. Therefore, our research gives us
an opportunity to provide the point estimates of the strength of peer influence vs. homophily. We
believe this is a unique feature of our design that gives us an insight on the extent of the homophily
strength that has been so hard to quantify earlier.
Given the model described by Figure 3 and the insights learned from Section 6.4, we extend our
logistic model by including OtherTreatment and its interaction with FriendCnt as new variables
into our model:
• OtherTreatment i,[t−1,t]. This variable represents the count of how many friends of user i adopted
the subscription on their own in the time interval [t− 1, t] independently from our manipulation.
While technically not being a treatment, this variable controls for other “treatment” that the
influenced user i receives from the network besides ours. Unlike OurTreatment, the coefficient of
OtherTreatment represents both peer influence and homophily signals combined: this “other” friend
who adopted subscription on her own may exert peer influence on user i or she may serve as an
indicator that user i belongs to a “risk group of likely adopters” or both.
Table 8 presents the results of fitting this augmented model to our experimental data. As Table 8
demonstrates, OurTreatment variable and its interaction are statistically significant even after
accounting for OtherTreatment. Interestingly, OtherTreatment and its interaction term are also
significant with negative sign and follow the pattern that resembles OurTreatment : the effect that
Hypothesis 2 would imply. Note that the OtherTreatment coefficient is larger in magnitude than
OurTreatment, as would be expected given insights from Section 6.5.
16 Since users A are selected randomly by us, some of them will naturally be in “good health”, some of them will be in“bad health”. Over the 1000 of the users A infected by us, user A’s “health” will average out close to the population“health” and thus, should be statistically identical to the non-manipulated group.

Ravi Bapna and Akhmed Umyarov: Do Your Online Friends Make You Pay?NBER Working Paper Series 2012 23
Variable Estimate Std Err Wald χ2 Pr>χ2
Intercept: adopter=0 −4.5533 3.9079 1.3576 0.2440OurTreatment 1.5819 0.7042 5.0462 0.0247OurTreatment * log(FriendCnt) −0.2643 0.1479 3.1953 0.0739OtherTreatment 2.0440 0.5771 12.5429 0.0004OtherTreatment * log(FriendCnt) −0.3526 0.1058 11.0959 0.0009log(FriendCnt) 0.0598 0.1837 0.1058 0.7450log(SubscriberFriendCnt) 0.4334 0.1743 6.1829 0.0129Age 0.0279 0.0141 3.9128 0.0479AgeMissing 0.5374 0.4590 1.3710 0.2416LastfmCountry −0.4187 0.2440 2.9450 0.0861CountryMissing 0.1126 0.3662 0.0945 0.7586RegDate −0.00030 0.000200 2.2942 0.1299log(SongsListened) 0.0920 0.0866 1.1302 0.2877log(Posts) 0.0748 0.0650 1.3254 0.2496log(Playlists) 0.4098 0.1580 6.7254 0.0095log(Shouts) 0.00985 0.0776 0.0161 0.8990log(LovedTracks) 0.2408 0.0643 14.0351 0.0002
Table 8 Peer Effects hold for OurTreatment and OtherTreatment
6.6. Strength of Peer Influence versus Homophily
As explained in Section 6.5, variable OurTreatment represents the effect of pure peer influence,
while the effect of OtherTreatment represents the effect of peer influence and homophily combined.
As outlined in Table 8, both OurTreatment and OtherTreatment enter our model with interactions
terms, therefore, the marginal effects of either of these variables is not constant and depends on
the exact characteristics of the influenced user. In order to provide a point estimate of the marginal
effect of each of these variables, we take a median Last.fm user from the social network and apply
OurTreatment to that user varying only her number of friends and holding all other variables
constant (assuming also OtherTreatment = 0). We repeat the same procedure for OtherTreatment
by varying only the median user’s number of friends and holding all other variables constant
(assuming also OurTreatment = 0).
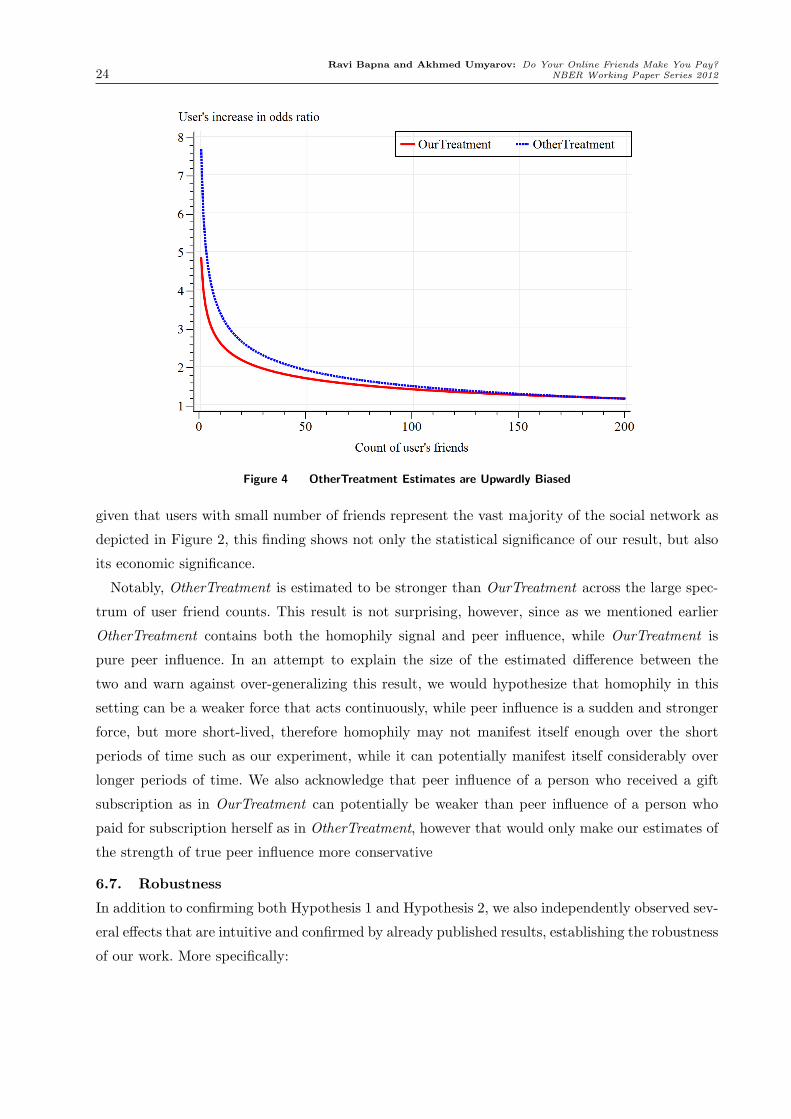
The two resulting curves are displayed in Figure 4 where the solid line represents the marginal
effect of OurTreatment varying with the number of friends and the dashed line represents the
marginal effect of OtherTreatment respectively: the horizontal axis represents the number of friends
the influenced user has, while the vertical axis represents the ratio of increase in the user’s odds of
adopting the subscription. For example, for a median user with 10 friends a unit of OurTreatment
is estimated to increase the user’s odds of buying subscription 2.72 times (that is, 172% increase
in odds).
As Figure 4 demonstrates users with small number of friends are the ones who are the most
susceptible to peer influence demonstrating hundreds of percents increases in odds. Moreover,
Ravi Bapna and Akhmed Umyarov: Do Your Online Friends Make You Pay?24 NBER Working Paper Series 2012
Figure 4 OtherTreatment Estimates are Upwardly Biased
given that users with small number of friends represent the vast majority of the social network as
depicted in Figure 2, this finding shows not only the statistical significance of our result, but also
its economic significance.
Notably, OtherTreatment is estimated to be stronger than OurTreatment across the large spec-
trum of user friend counts. This result is not surprising, however, since as we mentioned earlier
OtherTreatment contains both the homophily signal and peer influence, while OurTreatment is
pure peer influence. In an attempt to explain the size of the estimated difference between the
two and warn against over-generalizing this result, we would hypothesize that homophily in this
setting can be a weaker force that acts continuously, while peer influence is a sudden and stronger
force, but more short-lived, therefore homophily may not manifest itself enough over the short
periods of time such as our experiment, while it can potentially manifest itself considerably over
longer periods of time. We also acknowledge that peer influence of a person who received a gift
subscription as in OurTreatment can potentially be weaker than peer influence of a person who
paid for subscription herself as in OtherTreatment, however that would only make our estimates of
the strength of true peer influence more conservative
6.7. Robustness
In addition to confirming both Hypothesis 1 and Hypothesis 2, we also independently observed sev-
eral effects that are intuitive and confirmed by already published results, establishing the robustness
of our work. More specifically:

Ravi Bapna and Akhmed Umyarov: Do Your Online Friends Make You Pay?NBER Working Paper Series 2012 25
• We observed that even after our gift manipulation had expired in group M , some people in
group M decided to renew subscription on their own. The count of “renew-ers” in group M was
statistically larger than the count of “new adopters” in group NM despite the fact that these
groups were chosen initially at random, thus confirming the well-known effect of free promotions.
• The estimation results suggest that older people are more likely to adopt subscription; also
subscribers and adopters tend to be older and registered earlier than general population confirm-
ing the earlier findings of Oestreicher-Singer and Zalmanson (2010) who independently collected
Last.fm data for a different study.
• We discovered that being in non-LastfmCountry (that is being outside of the US, UK or
Germany) provides a significant increase in the likelihood of adopting: a finding that is consistent
with the fact that premium subscription gives much more features to people outside of the US, UK
and Germany even though it costs the same amount.
While these findings are not the main research question of this study, they serve as additional
evidence that Last.fm social network is a domain that is subject to traditional economic laws and
therefore the insights learned from Last.fm domain can be a manifestation of more fundamental
laws that are applicable across other domains as well.
7. Conclusions, Discussion and Future Work
In this paper, we design a novel randomized experiment that allows us to make a causal inference
about the presence of economic social contagion and peer-effects in the general population of an
online social network without any subject recruitment procedures. More specifically, we conduct
the experiment in the context of purchasing premium subscriptions of Last.fm social network using
a unique feature of this website that allows us to buy a premium subscription gift for any user in
the network and then examine how the premium subscriptions spread through the social contagion.
This unique feature induces the proverbial “helicopter drop,” an exogenous random assignment of
a treatment to a subset of the population, which can be compared against a statistically identical
control group. We believe that this research is at the frontier of what IS can do - an “economic
experiment in the wild” with real subjects but without a self-selection based subject recruitment
procedure.
In this study, we demonstrate that there exists statistically and economically significant causal
peer influence in the general population of a social network. In addition to that, we quantify the
strength of this peer influence and discover that the strength of peer influence decreases with the
size of the friendship circle of the influenced user.
Moreover, in our case each individual outcome is a purchase of the paid product with well
defined monetary cost as compared to prior research that looked at the adoption of free products.

Ravi Bapna and Akhmed Umyarov: Do Your Online Friends Make You Pay?26 NBER Working Paper Series 2012
Therefore, product adoption requires subjects to make explicit economic decision with their own
money in our setting.
In addition to that, we compare the point estimates of the pure peer influence effect vs. peer
influence and homophily combined. While these estimates provide a way of quantifying the strength
of homophily vs. peer influence in a social network, this study suggests to look at peer influence
and homophily as forces of nature acting over different time horizons and suggests that a separate
study is needed to identify the longitudinal effects of both of these forces.
As a concluding remark, we also compare the results of observational quasi-experiment with the
randomized experiment and conclude that quasi-experiments tend to overestimate the strength of
peer influence for users with large number of friends, while underestimating it for users with small
number of friends.
Our work does not concern the exact peer influence tactics that are at work in the ongoing
social contagion process: we do not distinguish between tactics like persuading a friend to subscribe
versus imitation of a friend etc, as we combine all of them under the umbrella of peer influence
mechanism that is contrasted with the umbrella of homophily mechanism. In this paper, we also do
not study whether the influence comes from a few elite highly influential users or a large number
of low influential users: our major goal for this paper is to demonstrate that significant economic
social contagion is at work on average in a general population of a social network such as Last.fm.
We expect the following as the important directions for the future work:
• Identification of social network characteristics of influential people and people highly suscepti-
ble to peer influence beyond the characteristics discovered in this study by using stratified samples
and rare-event detection techniques
• Incorporation of dynamic time-series and survival models that are capable of using multiple
snapshots of network and network dynamics into the model in order to better explain the adoption
behavior over the long-term
• Study of the longitudinal effects and strength of peer influence vs. homophily.
Finally, we believe our experimental methodology is something that can be practically carried
out by both researchers and practitioners. A venture capitalist could use our design and approach
as a dipstick to examine the nature and strength of social contagion in competing networks. We
expect to see more such random acts of kindness to solve interesting problems facing business and
society.

Ravi Bapna and Akhmed Umyarov: Do Your Online Friends Make You Pay?NBER Working Paper Series 2012 27
Appendix A: Sample Last.fm web pages
Figure 5 Sample Last.fm user page
Figure 6 Gift landing page
The images were selectively blurred so as to maintain privacy of individual users.
Ravi Bapna and Akhmed Umyarov: Do Your Online Friends Make You Pay?28 NBER Working Paper Series 2012
Appendix B: Quasi-Experiment to Calibrate Randomized Trial
B.1. Quasi-experimental setup
Before conducting the actual randomized experiment, we first constructed a quasi-experiment that simulates
our randomized experiment using only observational data. The quasi-experiment study was conducted in
order to determine the appropriate sample size, check if the effect can be observed in observational-only data
as well as to compare the ultimate result of the quasi-experiment against the future randomized experiment.
While we acknowledge that the influence of unobserved characteristics cannot be ruled out by the quasi-
experiment, we could still control for the observed characteristics of users as a “first-order approximation.”
Methodologically, this approach is similar to the matching based quasi-causal techniques seen in Aral, Much-
nik, and Sundararajan (2009), Susarla, Oh, and Tan (2012) as well as Oestreicher-Singer and Zalmanson
(2010).
In order to introduce the design of the quasi-experiment, consider 3 consecutive times in the evolution
of our data: t− 1, t and t+ 1 each separated by at least 2 weeks. If we look into our data across at least
2 week period [t− 1, t], we will typically see that thousands of users suddenly became subscribers in that
time period [t−1, t]. We will refer to them as “0→ 1” users. Let us randomly select 1000 of these 0→ 1 users
into a group “M” . It is also very typical that in the same time period [t− 1, t], we will likely see more than
1 million active users who remained non-subscribers. We will refer to them as “0→ 0” users. For every user
in group “M”17, we would like to find her alter-ego, that is a person who has certain properties identical
to the user but happened to remain a “0→ 0” in the same time frame [t− 1, t]. We match every 0→ 1 user
from group “M” with a random 0→ 0 alter-ago based on the exact matching of the observed count of friends
and subscriber friends18 and thus form a group “NM” of 1000 alter-egos. Figure 7 depicts the nature of the
quasi-experiment, with “manipulated” users actually representing natural adopters.
Similarly to our experimental setup, we define our quasi-treatment group “T” as all immediate friends of
“M” who are not themselves in “M” or “NM” and who are not friends of someone in “NM”. Symmetrically,
we define our quasi-control group “C” as all immediate friends of “NM” who are not themselves in “M” or
“NM” and are not friends of someone in “M”. Clearly, because of the matching, groups “M” and “NM”
are identical in terms of the matched characteristics at time t− 1. By comparing the subscription changes
in groups “T” and “C” during the subsequent time period [t, t+1] and controlling for all known observed
characteristics of each user, we are able to tell whether being a friend of “M” has any effect on the subscription
behavior as compared to being a friend of “NM”.
17 We denote quasi- groups with quotes: like group “M” as opposed to group M so as to clearly separate places wherewe talk about the quasi-experiment from places where we talk about the randomized experiment
18 This is just one particular type of matching, and a different type of matching (like propensity score matching)could have definitely been done here. We chose our particular matching in order to make sure that the social networkcharacteristics of “M” and “NM” groups are as similar as possible since this is the subject of our study. Fortunately,the sheer size of our dataset allowed us a plenty of precise matches for every 0→ 1 user.

Ravi Bapna and Akhmed Umyarov: Do Your Online Friends Make You Pay?NBER Working Paper Series 2012 29
Figure 7 Dynamic Data and Quasi-Experiment Used to Calibrate Experiment
B.2. Results of Randomized Experiment compared with Quasi-Experiment
An interesting aspect of our study is that it allows us to directly compare the estimates obtained from a
quasi-experiment with the estimates obtained from the randomized experiment in order to get an idea of
potential biases that can be introduced by doing quasi-experiments with observational data in the research
of online social networks. Our logistic regression analysis of adoption among friends of groups “M” and
“NM” is presented in right panel of Table 9. This analysis demonstrates that OurTreatment variable is
statistically significant in explaining the decision to subscribe after controlling for variety of demographic,
network and social activity variables. Similar results occur if we select different time periods, different
seeds for random samples and with other robustness checks. Note also that all other “peer influence”-
related variables like OtherTreatment, SubscriberFriendCnt as well as their interactions are also statistically
significant. The results provide a strong suggestion for the possibility to observe the desired causal effect
in the randomized experiment. However, as we have already mentioned, the quasi-experiment only takes
observed variables into account. Since the variable OurTreatment features an interaction term in both the
randomized experiment and the quasi-experiment, the marginal effects of it are not constant and vary
depending on the characteristics of the user. Using an approach similar to the one that we used in Figure 4,
we plot marginal effects of OurTreatment on a median social network user for the randomized experiment
and quasi-experiment respectively.
As is demonstrated by the plot above, quasi-experiment tends to over-estimate the effect of the treatment
on users with larger number of friends and tends to under-estimate it for the users with smaller number of
friends. Moreover, this pattern of over-estimation and under-estimation is robust across multiple randomiza-
tion seeds and different runs of the quasi-experiment. To the best of our knowledge this is the first indication
of the nature of the quasi-experimental bias in estimating peer-effects in online social networks.

Ravi Bapna and Akhmed Umyarov: Do Your Online Friends Make You Pay?30 NBER Working Paper Series 2012
Figure 8 Quasi-treatment Estimates are Upwardly Biased in the Tail of the Friends Distribution
This result is, again, not surprising, since quasi-manipulated group “M” is constructed not from a random
sample of general population, but from a random sample of adopters. As we described earlier, adopters have
consistently more friends than general population. Because of likely homophily, not only friends of group
“M” will have larger number of friends than expected for general population in this scenario, but also the
friends of group “M” will be more likely19 to adopt subscription than general population with that count
of friends. Therefore, it is expected that the logistic regression model will overestimate the likelihood of
adoption for users with large number of friends given the quasi-experimental data.
Nevertheless, this comparison shows that the quasi-experiment was useful in predicting the basic statistical
significance results for the treatment as well as a ball-park estimate of the effect strength. However, the
effects of controls were very different in randomized experiment vs. quasi-experiment given that underlying
samples were statistically different as well.
As evident from Table 9 both quasi-experiment and randomized experiment were able to discover the
significance of OurTreatment and its interaction terms as well as significance of OtherTreatment20 and
log(SubscriberFriendCnt).
19 This is because they are friends with group “M”, but group “M” consists completely of users who have purchasedthe subscription by themselves.
20 It is interesting to note that, unlike randomized experiment, for quasi-experiment the strength of OurTreatmentis not expected to be weaker than the strength of OtherTreatment since both of them contain homophily and peerinfluence.

Ravi Bapna and Akhmed Umyarov: Do Your Online Friends Make You Pay?NBER Working Paper Series 2012 31
Randomized Experiment Quasi-ExperimentVariable Estimate Std Err Pr>χ2 Estimate Std Err Pr>χ2
Intercept: Adopter=0 -4.8567 3.3430 0.1463 -10.2650 2.3595 <.0001OurTreatment 1.3570 0.5860 0.0206 1.2182 0.3459 0.0004OtherTreatment 1.5822 0.4787 0.0009 1.1634 0.4200 0.0056log(FriendCnt) 0.0167 0.1529 0.9130 -0.4467 0.1075 <.0001OurTreatment * log(FriendCnt) -0.2547 0.1235 0.0391 -0.1778 0.0758 0.0190OtherTreatment * log(FriendCnt) -0.2631 0.0830 0.0015 -0.2055 0.0804 0.0106log(SubscriberFriendCnt) 0.4779 0.1514 0.0016 0.8729 0.1015 <.0001Age 0.0322 0.0119 0.0068 0.00726 0.00895 0.4178AgeMissing 0.6690 0.3909 0.0870 0.0376 0.2840 0.8945LastfmCountry -0.5555 0.2199 0.0116 -0.6470 0.1482 <.0001CountryMissing 0.1688 0.3044 0.5791 0.3154 0.1779 0.0762RegDate -0.00023 0.000172 0.1794 0.000119 0.000119 0.3170log(SongsListened) 0.0464 0.0696 0.5051 0.2129 0.0515 <.0001log(Posts) 0.0991 0.0560 0.0770 0.0199 0.0407 0.6252log(Playlists) 0.3543 0.1415 0.0123 0.0510 0.0993 0.6078log(Shouts) 0.0259 0.0684 0.7051 0.0715 0.0504 0.1561log(LovedTracks) 0.2119 0.0548 0.0001 0.2382 0.0370 <.0001
Table 9 Head to Head Comparison of Quasi-Experiment and Randomized Experiment on similarly selected data
References
Anderson, C. 2008. The long tail: Why the future of business is selling less of more. Hyperion Books.
Aral, S. 2011. Identifying social influence: A comment on opinion leadership and social contagion in new
product diffusion. Marketing Science 30 217–223.
Aral, S., L. Muchnik, A. Sundararajan. 2009. Distinguishing influence-based contagion from homophily-
driven diffusion in dynamic networks. Proceedings of the National Academy of Sciences 106(51) 21544–
21549.
Aral, S., D. Walker. 2011. Creating social contagion through viral product design: A randomized trial of
peer influence in networks. Management Science 57(9) 1623.
Ariely, D. 2010. Predictably irrational: The hidden forces that shape our decisions. HarperCollins.
Bapna, R., A. Gupta, S. Rice, A. Sundararajan. 2012. Trust, reciprocity and the strength of social ties: An
online social network based field experiment. Working Paper. University of Minnesota (Carlson School
of Management).
Bramoulle, Y., H. Djebbari, B. Fortin. 2009. Identification of peer effects through social networks. Journal
of Econometrics 150(1) 41–55.
Cutler, D.M., E.L. Glaeser. 2007. Social interactions and smoking. Tech. rep., National Bureau of Economic
Research.
Godes, D., D. Mayzlin. 2004. Using online conversations to study word-of-mouth communication. Marketing
Science 545–560.
Godes, D., D. Mayzlin. 2009. Firm-created word-of-mouth communication: Evidence from a field test.
Marketing Science 28(4) 721–739.
Ravi Bapna and Akhmed Umyarov: Do Your Online Friends Make You Pay?32 NBER Working Paper Series 2012
Hill, S., F. Provost, C. Volinsky. 2006. Network-based marketing: Identifying likely adopters via consumer
networks. Statistical Science 21(2) 256–276.
Iyengar, R., C. Van den Bulte, T.W. Valente. 2011. Opinion leadership and social contagion in new product
diffusion. Marketing Science 30(2) 195–212.
Manchanda, P., Y. Xie, N. Youn. 2008. The role of targeted communication and contagion in product
adoption. Marketing Science 27(6) 961–976.
Manski, C.F. 1995. Identification problems in the social sciences. Harvard University Press.
Mayzlin, D. 2006. Promotional chat on the internet. Marketing Science 155–163.
Oestreicher-Singer, G., A. Sundararajan. 2010. The visible hand of peer networks in electronic markets.
URL http://ssrn.com/abstract=1268516. Working paper, Leonard N. Stern School of Business,
New York University, New York.
Oestreicher-Singer, G., L. Zalmanson. 2010. Paying for content or paying for community ? the effect of social
computing platforms on willingness to pay in content websites. Working Paper. Tel-Aviv University.
Parameswaran, M., A.B. Whinston. 2007. Research issues in social computing. Journal of the Association
for Information Systems 8(6) 336–350.
Pauwels, K., A. Weiss. 2008. Moving from free to fee: How online firms market to change their business
model successfully. Journal of Marketing 72(3) 14–31.
Rosenbaum, P.R., D.B. Rubin. 1983. The central role of the propensity score in observational studies for
causal effects. Biometrika 70(1) 41–55.
Susarla, A., J. Oh, Y. Tan. 2012. Influentials or susceptibles? analyzing cascades of word-of-mouth conver-
sations in online social networks. forthcoming in Information Systems Research .
Tucker, C. 2008. Identifying formal and informal influence in technology adoption with network externalities.
Management Science 54(12) 2024–2038.
Van den Bulte, C., G.L. Lilien. 2001. Medical innovation revisited: Social contagion versus marketing effort.
American Journal of Sociology 106(5) 1409–1435.
Van den Bulte, C., S. Stremersch. 2004. Social contagion and income heterogeneity in new product diffusion:
A meta-analytic test. Marketing Science 23(4) 530–544.