
Do Workers’ Remittances Promote Financial...
41
Do Workers’ Remittances Promote Financial Development? ∗ Reena Aggarwal McDonough School of Business, Georgetown University [email protected] Asli Demirgüç-Kunt The World Bank [email protected] Maria Soledad Martinez Peria The World Bank [email protected] June 2006 Abstract Workers’ remittances to developing countries have become the second largest type of flows after foreign direct investment. This paper uses data on workers’ remittance flows to 99 developing countries during 1975-2003 to study the impact of remittances on financial sector development. In particular, we examine whether remittances contribute to increasing the aggregate level of deposits and credit intermediated by the local banking sector. This is an important question considering the extensive literature that has documented the growth-enhancing and poverty- reducing effects of financial development. Our findings provide strong support for the notion that remittances promote financial development in developing countries. Keywords : remittances, financial development JEL Classification : F22, J61, 016 ∗ We benefited from comments and suggestions from Thorsten Beck, Caroline Freund, Aart Kray, David Mackenzie, and L. Alan Winters. We thank Nicola Spatafora, Caroline Freund, and Angela Cabugao for providing us data. We are grateful to Florencia Moizeszowicz for excellent research assistance. The views expressed in this paper are those of the authors and do not represent the opinions of The World Bank, its Executive Directors, or the countries they represent. Corresponding author: Reena Aggarwal, McDonough School of Business, Georgetown University, G-04 Old North, Washington D.C. 20057. E-mail:[email protected].
Transcript of Do Workers’ Remittances Promote Financial...

Do Workers’ Remittances Promote Financial Development? ∗
Reena Aggarwal McDonough School of Business, Georgetown University
Asli Demirgüç-Kunt The World Bank
Maria Soledad Martinez Peria The World Bank
June 2006
Abstract Workers’ remittances to developing countries have become the second largest type of flows after foreign direct investment. This paper uses data on workers’ remittance flows to 99 developing countries during 1975-2003 to study the impact of remittances on financial sector development. In particular, we examine whether remittances contribute to increasing the aggregate level of deposits and credit intermediated by the local banking sector. This is an important question considering the extensive literature that has documented the growth-enhancing and poverty-reducing effects of financial development. Our findings provide strong support for the notion that remittances promote financial development in developing countries. Keywords: remittances, financial development JEL Classification: F22, J61, 016
∗ We benefited from comments and suggestions from Thorsten Beck, Caroline Freund, Aart Kray, David Mackenzie, and L. Alan Winters. We thank Nicola Spatafora, Caroline Freund, and Angela Cabugao for providing us data. We are grateful to Florencia Moizeszowicz for excellent research assistance. The views expressed in this paper are those of the authors and do not represent the opinions of The World Bank, its Executive Directors, or the countries they represent. Corresponding author: Reena Aggarwal, McDonough School of Business, Georgetown University, G-04 Old North, Washington D.C. 20057. E-mail:[email protected].

1
Do Workers’ Remittances Promote Financial Development?
Abstract Workers’ remittances to developing countries have become the second largest type of flows after foreign direct investment. This paper uses data on workers’ remittance flows to 99 developing countries during 1975-2003 to study the impact of remittances on financial sector development. In particular, we examine whether remittances contribute to increasing the aggregate level of deposits and credit intermediated by the local banking sector. This is an important question considering the extensive literature that has documented the growth-enhancing and poverty-reducing effects of financial development. Our findings provide strong support for the notion that remittances promote financial development in developing countries. Keywords: remittances, financial development JEL Classification: F22, J61, 016
2
Do Workers’ Remittances Promote Financial Development?
Remittances, funds received from migrants working abroad, to developing countries have
grown dramatically in recent years from U.S. $2.98 billion in 1975 to close to U.S.$90 billion in
2003.1 They have become the second largest source of external finance for developing countries
after foreign direct investment (FDI), both in absolute terms and as a proportion of GDP (Figures
1 and 2). Relative to private capital flows, remittances tend to be stable and to increase during
periods of economic downturns and natural disasters (see Yang, 2006). Furthermore, while a
surge in inflows, including aid flows, can erode a country’s competitiveness, remittances do not
seem to have this adverse effect (see Rajan and Subramanian, 2005).
As researchers and policy-makers have come to notice the increasing volume and stable
nature of remittances to developing countries, a growing number of studies have analyzed their
development impact along various dimensions, including: poverty, inequality, growth, education,
infant mortality, and entrepreneurship.2 However, beyond descriptive accounts of financial
institutions’ efforts to “bank” remittance recipients (e.g., Orozco and Fedewa, 2005), surprisingly
little attention has been given to the question of whether remittances promote financial
development in recipient countries.3 Yet, this issue is important because financial systems
perform a number of key economic functions and their development has been shown to foster
growth and reduce poverty (for example, see King and Levine, 1993; Beck, Levine and Loayza,
2000a, b; and Beck, Demirguc-Kunt, and Levine, 2004). Furthermore, this question is relevant
1 Estimates for 2005 put remittances at U.S. $142 billion (World Bank, 2006). 2 A review of this literature can be found in Section II. 3 In contrast, there is evidence that private capital flows can help relax financing constraints (see Harrison, Love, and McMillan, 2004).

3
since some argue that banking remittance recipients will help multiply the development impact
of remittance flows (see Hinojosa-Ojeda, 2003; Terry and Wilson, 2005, and World Bank, 2006).
In this paper, we use balance of payments data on remittance flows received by 99
countries over the period 1975-2003 to study the impact of workers’ remittances on financial
development. We specifically examine whether remittances contribute to the development of the
financial sector by increasing the aggregate level of deposits and/or the amount of credit to the
private sector extended by the local banking sector.4
Whether and how remittances might affect financial development is a priori unclear. The
notion that remittances can lead to financial development in developing countries is based on the
concept that money transferred through financial institutions paves the way for recipients to
demand and gain access to other financial products and services, which they might not have
otherwise (Orozco and Fedewa, 2005). At the same time, providing remittance transfer services
allows banks to “get to know” and reach out to unbanked recipients or recipients with limited
financial intermediation. For example, remittances might have a positive impact on credit market
development if banks become more willing to extend credit to remittance recipients because the
transfers they receive from abroad are perceived to be significant and stable. However, even if
bank lending to remittance recipients does not materialize, overall credit in the economy might
increase if banks’ loanable funds surge as a result of deposits linked to remittance flows.
Furthermore, because remittances are typically lumpy, recipients might have a need for
financial products that allow for the safe storage of these funds, even if most of these funds are
4 A recent survey of central banks in 40 countries reveals that most countries (90 percent of the sample to be exact) collect remittance statistics from commercial banks, while less than 40 percent gather information from money transfer companies and post offices (De Luna Martinez, 2005). Therefore, balance of payment statistics tend to better reflect the portion of remittances that is transferred through banks.

4
not received through banks. In the case of households that receive their remittances through
banks, the potential to learn about and demand other bank products is even larger.
On the other hand, because remittances can help relax individuals’ financing constraints,
they might lead to a lower demand for credit and have a dampening effect on credit market
development. Also, a rise in remittances might not translate itself into an increase in credit to the
private sector if these flows are instead channeled to finance the government or if banks are
reluctant to lend and prefer to hold liquid assets. Finally, remittances might not increase bank
deposits if they are immediately consumed or if remittance recipients distrust financial
institutions and prefer other ways to save these funds.
An important complication in empirically studying the impact of remittances on financial
development is the potential for endogeneity biases as a result of measurement error, reverse
causation, and omitted variables. Officially recorded remittances are known to be measured with
error.5 Estimates of unrecorded remittances range from 20 to 200 percent of official statistics on
remittances (Freund and Spatafora, 2005). Reverse causality is also a concern since better
financial development might lead to larger measured remittances either because financial
development enables remittance flows or because a larger percentage of remittances are
measured when those remittances are channeled through formal financial institutions. In
addition, financial development might lower the cost of transmitting remittances, leading to an
increase in such flows. Finally, omitted factors can explain both the evolution of remittances and
of financial development, also leading to biases in the estimated impact of remittances on
financial development.
5 De Luna Martinez (2005) reports that balance of payment statistics produced by developing countries often neglect remittances received via money transfer operators and almost always exclude those transferred via informal means such as hawala operators, friends, and family members.

5
We address the above concerns, using several different empirical techniques to examine
the relationship between remittance flows and financial development. First, we conduct fixed and
random effects estimations to account for unobserved country effects, ignoring other sources of
biases. Second, we obtain estimates of the impact of remittances over the last decade to account
for the fact that recent remittances data are likely to be more accurate relative to statistics from
the beginning of the sample, when less attention was given to these kinds of flows. Third, we
present estimations including time dummies to control for unobserved time effects or common
country shocks. Fourth, to mitigate concerns about reverse causality we run regressions lagging
all regressors and we conduct dynamic system Generalized Method of Moments (GMM)
estimations à la Arellano and Bover (1995), using lagged regressors as instruments. Finally, we
perform instrumental variables (IV) estimations to address the potential endogeneity of
remittances arising from measurement error, omitted factors, and/or reverse causation in a more
direct and complete manner. In particular, we use economic conditions in the remittance-source
countries (i.e., the countries where migrants sending remittances reside) to instrument for
remittance flows received by countries in our sample.
Our empirical analysis provides support for a robust positive impact of remittances on
financial sector development, even after controlling for other factors that affect financial
development and after correcting our estimates for different potential sources of bias. The results
are invariant to whether we measure financial development by the ratio of deposits or credit to
GDP. All in all, our findings confirm yet another channel through which remittances can a have a
positive influence on recipient countries’ development.
The rest of the paper is organized as follows. Section II summarizes the main findings
from the research on financial development and reviews the literature on the development impact

6
of remittances. Section III discusses the data used and the methodology pursued to study the
impact of remittances on financial development. Section IV presents the empirical results and
Section V concludes.
II. Literature Review
The determinants of financial development and its effect on growth have been studied
extensively. The main findings from this literature can be summarized as follows. First, the level
of inflation has a negative impact on financial sector development (Boyd, Levine, and Smith,
2001). Second, the degree of capital account openness and the liberalization of domestic
financial systems help develop the financial sector (see Chinn and Ito, 2002; Demirguc-Kunt and
Detragiache, 1998). Third, a country’s legal origin affects both creditor rights and private credit,
and the extent of creditor rights protection also has an independent effect on financial sector
development (see La Porta, Lopez-de-Silanes, Shleifer, and Vishny, 1997, 1998; Beck, Levine,
and Loayza, 2000a; Beck, Demirguc-Kunt, and Levine, 2003; Djankov, McLeish, Shleifer,
2006). Fourth, a country’s geography and initial endowment also influence the extent of financial
sector development (see Acemoglu, Johnson, and Robinson, 2001, 2002). Finally, other country
characteristics like the degree of ethnic diversity (Easterly and Levine, 1997) and the type of
religion practiced by the majority of the population (Stulz and Williamson, 2003) also affect the
level of financial development, but their impact is less robust (Beck, Demirguck-Kunt, and
Levine, 2003) .
As for the economic impact of financial development, among others, King and Levine
(1993), Levine and Zervos (1998) and Beck, Levine and Loayza (2000a,b) document how
financial development is associated with greater growth across countries. Similar evidence also

7
exists at the firm and industry levels (Demirguc-Kunt and Maksimovic, 1998 and Rajan and
Zingales, 1998). More recently, Beck, Demirguc-Kunt and Levine (2004) have shown that
financial development also leads to lower levels of poverty and inequality.
By analyzing the impact of remittances on financial development, our paper not only
examines an unexplored potential determinant of financial development, but also this study
investigates a new channel through which remittances can affect economic development. Most
studies on the development impact of remittances have focused on issues such as poverty,
education, entrepreneurial activity, and health. Research on the impact of remittances on poverty
using household data suggests that these transfers help reduce the level of poverty, but have an
even greater influence on its severity, as measured by the poverty gap (e.g., Adams, 2004, on
Guatemala; Lopez-Córdova, 2005, and Taylor, Mora, and Adams, 2005, on Mexico). In addition,
Maimbo and Ratha (2005) find that in terms of poverty reduction, rural areas in developing
countries tend to benefit the most because much of the world’s migrants are drawn from these
areas.
The finding that remittances help to reduce poverty is confirmed in cross-country studies.
Based on a dataset of 74 low and middle-income developing countries, Adams and Page (2003)
find that remittances have a statistically significant impact on reducing poverty. This result is
also corroborated in a separate analysis for 101 countries over the period 1970-2003, reported in
the IMF’s 2005 World Economic Outlook.
Studies that analyze the impact of remittances on education such as Cox and Ureta
(2003), for the case of El Salvador, Yang (2005), for the case of Philippines, and Hanson and
Woodruff (2003) and López-Córdova (2005), for Mexico, find that by helping to relax household
constraints, remittances are associated with improved schooling outcomes for children.
8
Remittances have also been shown to promote entrepreneurship (Massey and Parrado,
1998; Woodruff and Zenteno, 2001; Maimbo and Ratha, 2005; Yang, 2005). Furthermore, a
number of studies on infant mortality and birth weight (Kanaiaupuni and Donato, 1999;
Hildebrandt and McKenzie, 2005; Duryea et al., 2005; and López-Córdova, 2005) have
documented that at least in the Mexican case, migration and remittances help lower infant
mortality and are associated with higher birth weight among children in households that receive
remittances.
Research on the effect of remittances on economic growth is scant so far and has yielded
mixed results. Using a panel of 113 countries over almost three decades, Chami et al. (2003) find
that remittances are negatively associated with economic growth. This result is consistent with
their model in which remittances weaken recipients’ incentives to work and, therefore, lead to
poor economic performance. Solimano (2003), on the other hand, finds a positive association
between remittances and growth for a panel of Andean countries, while the IMF’s 2005 World
Economic Outlook highlights the lack of correlation between these variables, at least at the
country level.
Finally, two recent studies by Giuliano and Ruiz-Arranz (2005) and Mundaca (2005)
show that the impact of remittances on growth can depend on the level of financial development
in a country. However, these studies reach very different conclusions. Using a panel of more than
100 countries for the period 1975-2003, Giuliano and Ruiz-Arranz (2005) show that remittances
help promote growth in less financially developed countries. They argue that this is evidence that
agents compensate for the lack of development of local financial markets using remittances to
ease liquidity constraints and to channel resources towards productive uses that foster economic
growth. Mundaca (2005) analyzes the effect of workers’ remittances on growth in countries in

9
Central America, Mexico, and the Dominican Republic using a panel data set over 1970 to 2003.
She finds that controlling for financial development in the analysis strengthens the positive
impact of remittances on growth and concludes that financial development potentially leads to
better use of remittances, thus boosting growth. Neither study, however, investigates the impact
of remittances on financial development. Our paper contributes to the literature by directly
addressing this issue, exploring the impact of remittances on bank deposits and credit to the
private sector.
III. Empirical methodology and data
We empirically examine the relationship between financial development and remittances
by estimating a number of variants of equation (1), depending on the assumptions made about
the error term and the exogeneity of remittances.
FDi,t= β1Remi,t + β2’Xi,t + αi + ui,t (1)
where i refers to the country and t refers to the time period from 1975 to 2003. However, data for
the complete time period are not available for all countries and countries are only included if at
least five years of data are available. A complete list of countries and time periods is given in
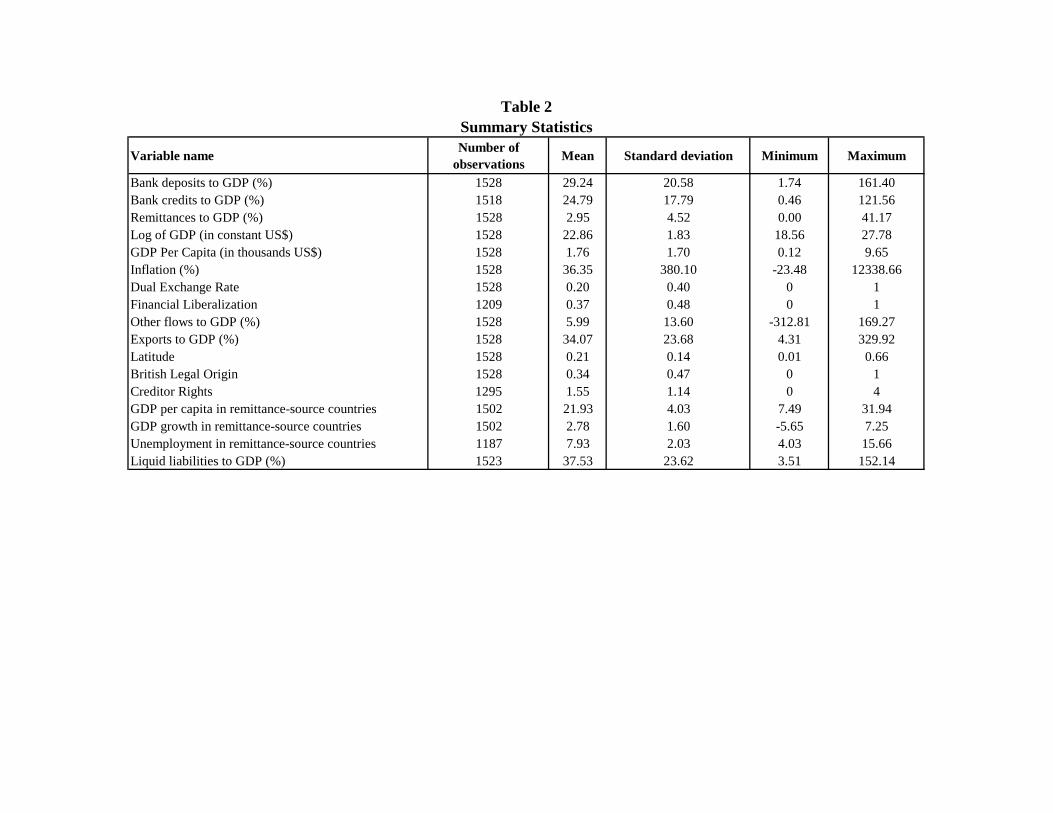
Appendix 1. Table 1 provides definitions and sources for each of the variables in our estimations,
while Table 2 presents descriptive statistics.
FD, financial development, refers either to the ratio of bank credit to the private sector or
the share of bank deposits expressed as a percentage of GDP.6 These are the standard measures
of financial depth used in the literature (e.g., King and Levine, 1993). Data to construct these
ratios come from the International Financial Statistics (IMF) and the World Development
Indicators (World Bank). As shown in Table 2, there is considerable variation in financial

10
development for our sample of countries with the ratio of deposits to GDP ranging from 1.74%
to 161.40% and the ratio of credit to GDP varying from 0.46% to 121.46%.
Rem refers to the ratio of remittances to GDP. The data on remittances are obtained from
the IMF’s 2005 World Economic Outlook. With some exceptions, these data are constructed as
the sum of three items in the Balance of Payment Statistics Yearbook (IMF): workers’
remittances (current transfers made by migrants who are employed and resident in another
economy); compensation of employees (wages, salaries and other benefits earned by nonresident
workers for work performed for resident of other countries); and migrant transfers (financial
items that arise from the migration or change of residence of individuals from one economy to
another).7 Figures 3 and 4 show the top ten remittance recipient countries in our sample based on
averages for the period 1975-2003, measured both in U.S. billion dollars and as a proportion of
GDP. India ($U.S. 4.26 billion), Mexico ($U.S. 4.82 billion), Egypt ($U.S. 3.27 billion),
Philippines ($U.S. 2.95 billion) and Turkey ($U.S. 2.44 billion) are among the largest recipients
of remittances in absolute terms as shown in Figure 3. Relative to the size of the economy,
remittances are especially high among low-income, small economies such as Jordan (18.61%),
Tonga (17.86%), Moldova (11.66%), Haiti (10.09%), Vanuatu (8.03%), and El Salvador (8.01%)
as shown in Figure 4.
The matrix X refers to a set of variables that the literature has found to affect financial
development. In all estimations we control for country size, defined as the log of GDP in
constant dollars, and the level of economic development, as measured by GDP per capita. These
variables are included on the grounds that financial sector development requires paying fixed
costs that become less important the larger the size of the economy and the richer the country.
6 In Appendix 3 we also show estimates for financial development defined as the ratio of liquid liabilities to GDP.

11
Also, GDP per capita can proxy for the quality of legal institutions in the country which have
been shown to have a positive impact on financial development.
In all models, we also control for inflation, measured as the annual percentage change in
the GDP deflator. Studies have that shown that inflation distorts economic agents’ decision-
making regarding nominal magnitudes, discouraging financial intermediation, and promoting
saving in real assets (Boyd, Levine, and Smith, 2001).
Current and capital account openness has also been found to have a positive effect on
financial development (see Chinn and Ito, 2002). We include a number of variables to control for
the degree of capital and current account openness.8 First, we include a dummy for the presence
of dual exchange rates regimes. Second, we include the ratio of capital inflows to GDP
(including aid, FDI, and portfolio flows).9 Lastly, we control for the share of exports to GDP.
Countries that have liberalized their domestic financial systems removing interest rate
controls have been shown to be more financially developed (Demirguc-Kunt and Detragiache,
1998). Following earlier studies, we capture periods of domestic financial liberalization with a
dummy that equals one in cases when there are no controls on domestic interest rates. More
details on the sources used to identify such periods are provided in Table 1.
The importance of legal origin and creditor rights for the development of the financial
sector has also been firmly established in the finance literature (e.g., La Porta, Lopes-de-Silanes,
Shleifer, and Vishny 1997, 1998; Beck, Levine, and Loayza, 2000a; Beck, Demirguc-Kunt, and
7 Additions and adjustments to these data from national sources are required for some specific countries. Details are provided in Appendix 2. 8 Chinn and Ito (2002) develop an openness index based on the first principal component of four variables capturing the absence of (1) multiple exchange rate regimes, (2) restriction on current account transactions, (3) restrictions on capital account transactions, and (4) requirements of the surrender of exports proceeds. Higher values of this index indicate greater openness. We prefer our three separate measures because they allow us to disentangle which aspects of openness are most critical for financial development. Also, our measures are largely de facto as opposed to de jure measures of openness as is the case with the index developed by Chinn and Ito (2002). 9 We refer to this variable as Other flows to GDP.

12
Levine 2003; and Djankov, McLiesh, and Shleifer, 2006). To control for these factors we include
an index of Creditor Rights (ranging from 0, weak, to 4, strong) developed by Djankov,
McLiesh, and Shleifer (2006) and a dummy to control for countries with British legal origin (i.e.,
dummy equals 1 if legal system is based on Common Law). An alternative view of the
determinants of financial development, stresses the importance of geography and initial
endowments (Acemoglu, Johnson, and Robinson, 2001, 2002). To control for these factors, we
include countries’ absolute latitude, a frequently used proxy of endowments (Beck, Demirguc-
Kunt, and Levine, 2003).10 Since our measures of legal institutions and endowments do not vary
over time, these variables are not included in the fixed effect estimations and only appear in the
random effect regressions. 11
We first examine the relationship between financial development and remittances by
running fixed effects (FE) and random effects (RE) regressions, ignoring the potential for biases
due to reverse causation, omitted factors, or measurement error. FE and RE estimations make
different assumptions about the error term in equation (1). In the FE model, the error term is the
sum of αi and ui,t where αi represents individual specific fixed parameters to be estimated and ui,t
are independent and identically distributed errors with zero mean and constant variance In the
RE regressions, both αi and ui,t are independently distributed and, furthermore, both are assumed
to be independent from the regressors in the equation. In conjunction with these estimations, we
report F-tests for the joint significance of the fixed effects and Hausman tests comparing the
efficiency of random vis-à-vis fixed effect estimates.
10 The original paper by Acemoglu et al. (2001) uses settlers’ mortality data as a measure of endowments. However, this information is only available for a subset of former colonies. Using this data restricts our sample of countries, therefore, we prefer to use absolute latitude as a proxy for endowments. 11 Beck, Demirguc-Kunt, and Levine (2003) show that the impact of variables such as religion, ethnic diversity or political structure on financial development is neither significant nor very robust. Thus, we do not control for these factors when investigating the effect of remittances on financial development.

13
The fixed and random effects estimates described above can be biased due to
measurement error, omitted variables, and reverse causality. The concern about reverse causation
is justified, considering that our measure of remittances refers to balance of payment statistics
that largely cover flows transferred through the formal financial system. Thus, it is conceivable
that remittances may grow over time simply because financial development in the recipient
countries allows banks to play a greater role in the remittance transfer process. Furthermore,
biases might also occur because of common omitted variables driving the behavior of both
remittances and financial development. Finally, measurement error, which is known to plague
balance of payment statistics on remittances, will also likely bias our estimates.
We conduct a number of different estimations to address the concerns outlined above.
First, we separately conduct estimations for the most recent period (1995-2003), because the
potential for measurement error should be smaller in this period, since remittance statistics are
likely to have improved over time. Second, we conduct estimations including time dummies to
mitigate the concern for omitted relevant regressors. Third, we try to address the potential bias
due to reverse causality by conducting estimations lagging regressors and, separately, by using
lagged values of the regressors as instruments in a GMM dynamic framework à la Arellano and
Bover (1995).
Two equations, (2) and (3), are estimated as part of the dynamic system GMM estimates
FDi,t= γFDi,t-1+ β1Remi,t + β2’Xi,t+ αi+ ui,t (2)
FDi,t - FDi,t-1 = γ(FDi,t-1 - FDi,t-2) + β1(Remi,t -Remi,t-1) + β2’(Xi,t - X i,t-1)+ ui,t - ui,t-1 (3)
In equations (2) and (3), the use of instruments is required to deal with the likely
endogeneity of the explanatory variables (most notably, remittances) and with the fact that in

14
both equations the error term is correlated with the lagged dependent variable. Assuming that (a)
the error terms are not serially correlated, (b) the explanatory variables are weakly exogenous
(i.e., explanatory variables are uncorrelated with future realization of the error terms), and (c)
there is no correlation between the changes in the right hand side variables and the country
specific effects, αi, then the following moment conditions can be applied to obtain unbiased
estimates of the regressors:
E[FDi,t-s.(ui,t - u i,t-1)]=0 for s≥2; t=3,…,T (4)
E[Remi,t-s.(ui,t - u i,t-1)]=0 for s≥2; t=3,…,T (5)
E[Xi,t-s.(ui,t - u i,t-1)]=0 for s≥2; t=3,…,T (6)
E[(FDi,t-s.- FDi,t-s-1)( αi + ui,t)]=0 for s=1 (7)
E[(Remi,t-s- Remi,t-s-1).( αi + u i,t)]=0 for s=1 (8)
E[(Xi,t-s- Xi,t-s-1).( αi + u i,t)]=0 for s=1 (9)
Hence, lagged values of the difference of regressors can be used as instruments to estimate the
equation in levels (i.e., equation 2), and lagged values of the level of regressors can be used as
instruments for the regressors in the equation in first differences (i.e., equation 3).
While using lagged values of the regressors as instruments can help deal with the
problem of reverse causality, it does not address biases arising due to measurement error, since
lagged values of the regressors (in particular, remittances) are likely to suffer from this problem
as well. Therefore, we also present Instrumental Variables (IV) estimations where we use
external as opposed to internal instruments. In particular, we use economic conditions – GDP per
capita, real GDP growth, and the unemployment rate - in the top remittance-source countries
15
(i.e., the countries from which migrants send money) as instruments for the remittances flows
received by the countries in our sample.
Economic conditions in the remittance-source countries are likely to affect the volume of
remittance flows that migrants are able to send, but are not expected to affect financial
development in the remittance receiving countries in ways other than through its impact on
remittances or through the effect on other variables we already control for like exports or capital
flows. Because bilateral remittance data are largely unavailable, we identify the top remittance-
source countries for each country in our sample, using bilateral migration data from the OECD’s
Database on Immigrants and Expatriates. This dataset identifies the top five OECD countries
that receive the most migrants from each remittance-recipient country.12 Here we assume that
these OECD countries receive the bulk of the migrants from the countries in our sample and
account for the majority of the remittance flows sent to the countries in our sample. We construct
three instruments by multiplying, respectively, the GDP per capita, the real GDP growth, and the
unemployment rate, in each of the top five remittance-source countries by the share of migration
to each of these five OECD countries.13
IV. Empirical Results
Table 3 reports FE estimates of equation (1) for the share of deposits and credit to GDP,
assuming that remittances are exogenous and adequately measured. In all regressions we control
for the log of GDP, the level of GDP per capita, the inflation rate, the presence of dual exchange
rates and for the extent of current and capital account openness. Because the variable capturing
12 http://www.oecd.org/document/51/0,2340,en_2825_494553_34063091_1_1_1_1,00.html. 13 Note that the bilateral migration data is only available for 2000, so the weights we use are constant. The time variation arises from the series on the GDP per capita, real growth rate, and unemployment rate in remittance-source countries.

16
periods of domestic financial liberalization is available for fewer countries, we report separate
estimations including this variable along with the others.
Across all estimations, we find that remittances have a positive coefficient, but the size of
the coefficient in the bank deposits to GDP regressions is almost twice as large the coefficient in
bank credit to GDP regressions. Assuming a causal relationship, a one percentage point increase
in the share of remittances to GDP suggests around a 0.5-0.6 percentage point increase in the
ratio of deposits to GDP, while it leads to at most a 0.3 percentage point rise in the share of credit
to GDP.
As expected, the results on Table 3 also confirm that financial development is positively
affected by a country’s size and level of income, but negatively influenced by inflation and the
adoption of multiple exchange rate regimes. While the share of exports to GDP has a positive
influence on financial development, the size of capital inflows appears to have no effect.
Random effects estimates shown in Table 4 yield similar results to the fixed effects
results reported in Table 3. Remittances have a positive relationship with both deposits and
credits and again the coefficient on the former is almost twice as large. Including controls such
as latitude, legal origin and creditor rights, which do not change over time, does not affect the
main results.14 As before, country size, income, and exports have a positive impact on financial
development, but inflation and the presence of dual exchange regimes have a negative impact.
Though the findings from the RE estimates are very similar to the FE results, the Hausman tests
at the bottom of Table 4 indicate that the FE specification is preferable so from now on we only
report results based on FE estimates.
14 A possible explanation for why these additional controls – legal origin, creditor rights, and latitude - are not themselves significant might be that they are highly correlated with GDP per capita also included in the estimations.

17
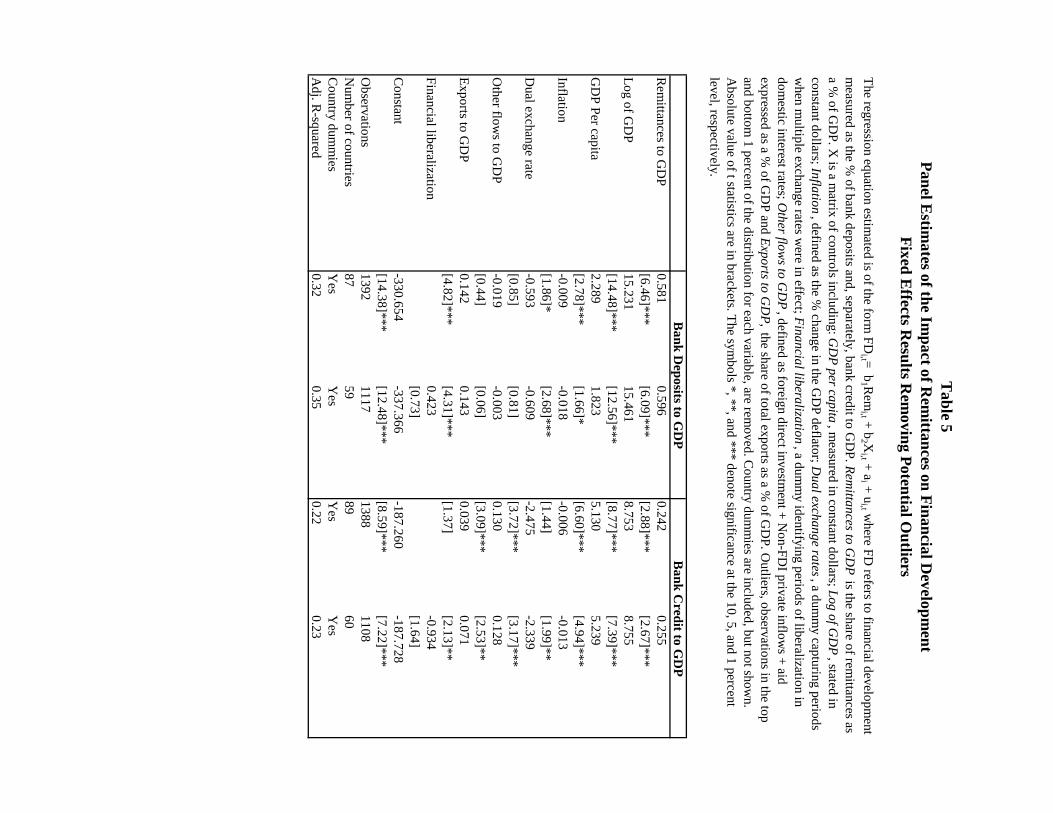
To verify the robustness of the FE results obtained thus far we conduct a number of
additional estimations. First, to account for the presence of potential outliers we drop
observations at the top 1 and bottom 1 percent of the distribution for each variable (see Table 5).
Second, to limit concerns about measurement error we report results for the period 1995-2003
(see Table 6). We speculate that the degree of measurement error is likely to be smaller during
this later period, as opposed to during the 1970s and 1980s, given that countries have taken steps
over time to improve their balance of payments statistics and, in particular, to better measure
remittances. Also, in recent years competition in the remittance market has led to a decline in the
cost of formal remittances that might have led to an increase in measured remittances (i.e.,
informal remittances could have declined as a result). Third, to control for common time effects,
we run a two-way fixed effect model including country and time dummies (see Table 7). Fourth,
to address the potential for reverse causation we conduct FE estimations substituting regressors
for their lags (see Table 8) and we report dynamic system GMM estimations à la Arellano and
Bover (1995), where lags of the regressors are used as instruments for the variables in the model
(see Table 9). The problem with estimations including lagged regressors (either directly or as
instruments like in the GMM case) is that they cannot correct for biases arising from
measurement error, since these would also affect lags of the questionable variable/s. Hence,
finally, in order to correct for endogeneity biases that might arise due to measurement error, we
present separate instrumental variables regressions using economic conditions in the remittance-
source countries as instruments (see Table 10).
Removing potential outliers does not change our results in any significant way. Table 5
shows that both the significance and the magnitude of the remittance variable remain unchanged
when we drop observations in the top and bottom one percent of the distribution for each

18
variable in the model. Remittances continue to have a positive effect on both credit and deposits
and, as before, the impact on deposits appears to be twice as large. Similarly, the estimates for
the period 1995-2003, shown on Table 6, also yield results similar to those encompassing the
overall period.
While remittances continue to have a positive and significant effect on financial
development, including time dummies reduces the impact of remittances on deposits and credit
(see Table 7). In particular, the size of the coefficient on deposits drops from close to 0.6 to 0.2-
0.3. Similarly, introducing time dummies reduces the impact of remittances on credit from an
average of 0.3 to closer to 0.2.
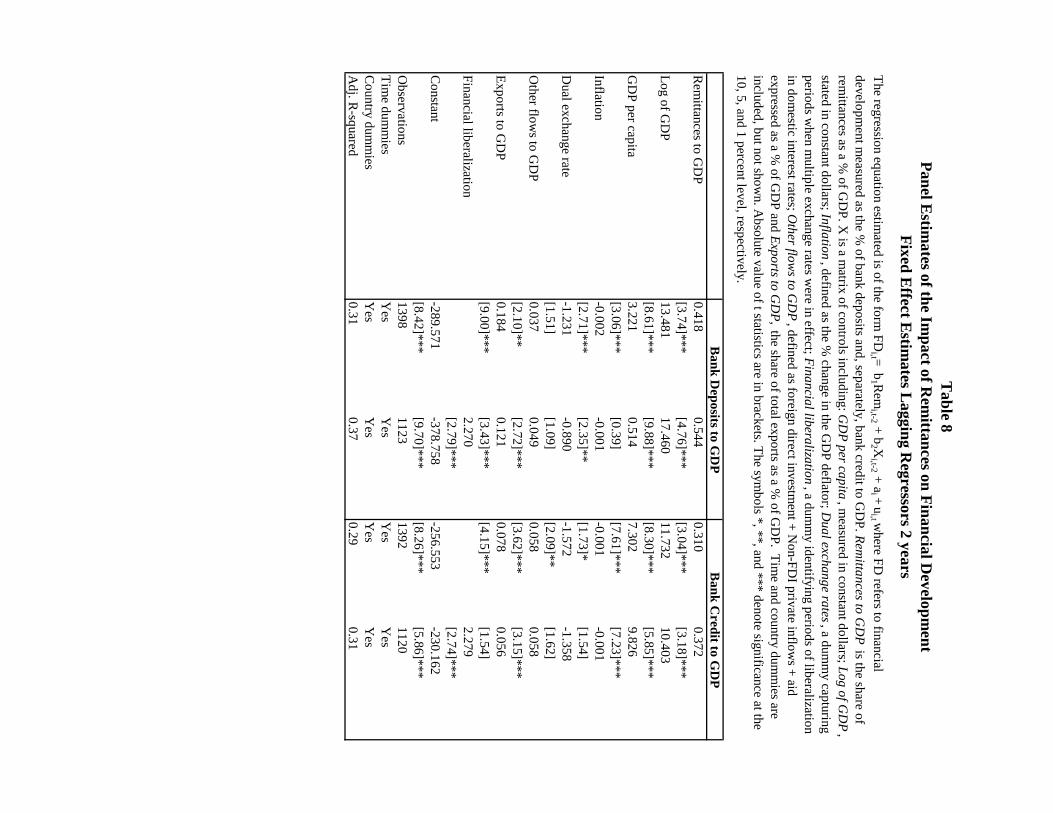
In order to deal with the possibility that remittances are endogenous due to reverse
causation we conduct estimations lagging remittances (as well as other regressors) two periods
(see Table 8) and we perform dynamic system GMM estimations where we use lags of the
regressors as instruments (see Table 9). When we lag regressors, we continue to find that
remittances have a positive impact on credit and deposits. In this case, a one percentage point
increase in remittances leads to 0.4-0.5 percentage increase in the ratio of deposits and 0.3-0.4
rise in credit to GDP. Using lags as instrument in the GMM estimations, results in remittances
having a lower impact on financial development. A one percentage point increase in remittances
leads to at most a 0.19 percentage point rise in deposits and a 0.12 percentage point increase in
credit. Furthermore, in the case of the credit estimations, once we control for financial
liberalization, remittances are no longer significant in the credit equations, perhaps due to the
smaller number of observations.
While lagging regressors or using lags as instrument might help deal with the problem of
reverse causation, it does not address the concern that the estimates reported so far might be

19
biased due to measurement error. In order to address these issues directly, we conduct
instrumental variable estimations where we use economic conditions in remittance-source
countries as instruments. In particular, we include the GDP per capita, real growth rate, and
unemployment rate of the five OECD countries that are the top recipients of migrants for each
remittance-receiving country in our sample. Each of these variables is separately weighted by the
share of migration from the corresponding country to each of those five OECD destinations.15
Table 10 shows the results from the instrumental variables estimations described above
We conduct and report two tests to show the validity of our instruments. First, we present the F-
statistic for weak instruments as suggested by Stock and Yogo (2002). This is a test of the
significance of our instruments in predicting remittances. In every regression the F-statistics is
above the critical value, at 5 percent significance, indicating that our estimates do not suffer from
a weak instruments problem. Second, we report the Sargan test of overidenditfying restrictions.
The joint null hypothesis in this case is that the instruments are uncorrelated with the error term
and that excluded instruments are correctly excluded from the estimated equation. Again, these
tests confirm the validity of our instruments.
As for the impact of remittances on financial development, we continue to find that they
have a positive and significant impact on both credit and deposits to GDP. Though the size of the
coefficients are in this case much larger than those obtained in previous estimations they are
within a range that can be justified by the presence of measurement error in the remittance
series.16 These results confirm that the positive impact of remittances on financial development
is not due to endogeneity biases.
15 We focus exclusively on the top five OECD destinations for migrants for each country in our sample because the OECD data only provides bilateral migration data vis-à-vis 5 countries.

20
V. Conclusions
Workers’ remittances, flows received from migrant workers residing abroad, have
become the second largest source of external finance for developing countries in recent years. In
addition to their increasing size, the stability of these flows despite financial crises and economic
downturns make them a reliable source of funds for developing countries. While the
development potential of remittance flows is increasingly being recognized by researchers and
policymakers, the effect of remittances on financial development remains largely unexplored.
Better understanding the impact of remittances on financial development is important given the
extensive literature on the growth enhancing and poverty reducing effects of financial
development.
This paper is a first effort to try to fill this gap in the literature. Using balance of
payments data on remittance flows to 99 countries for the period 1975-2003, we investigate the
impact of remittances on bank deposits, as well as on bank credit to the private sector. We find
that remittances have a significant and positive impact on bank deposits and credit to GDP. This
result is robust to using different estimation techniques and accounting for endogeneity biases
arising from omitted factors, reverse causation, and measurement error.
16 See Appendix 4 for a discussion about coefficient biases due to measurement error.

21
References
Abiad, Abdul and Ashoka Mody, 2005. “Financial Reform: What Shakes It? What Shapes It?” American Economic Review, 95, 66-88.
Acemoglu, Daron, Simon Johnson and James A. Robinson, 2001. “The Colonial Origins of Comparative Development: An Empirical Investigation.” American Economic Review, 91, 1369-1401.
Acemoglu, Daron, Simon Johnson and James A. Robinson, 2002. “Reversal of Fortune: Geography and Institutions in the Making of the Modern World Income Distribution,” Quarterly Journal of Economics, 117, 1231-1294.
Adams, Richard H. Jr., 2004. “Remittances and Poverty in Guatemala.” World Bank Policy Research Working Paper 3418.
Adams, Richard and John Page, 2003. “International Migration, Remittances and Poverty in Developing Countries.” World Bank Policy Research Working Paper 3179.
Arellano, Manuel and Olympia Bover, 1995. Another Look at the Instrumental Variable Estimation of Error Component Models. Journal of Econometrics, 68, 29-51.
Bandiera, Oriana, Gerard Caprio, Patrick Hanohan, and Fabio Schiantarelli, 2000. “Does Financial Reform Raise or Reduce Savings?” Review of Economics and Statistics, 82, 239-63.
Beck, Thorsten, Ross Levine, and Norman Loayza, 2000a. “Financial Intermediation and Growth: Causality and Causes.” Journal of Monetary Economics, 46, 31-77.
Beck, Thorsten, Ross Levine, and Norman Loayza, 2000b. “Finance and the Sources of Growth.” Journal of Financial Economics, 58, 261-300.
Beck, Thorsten, Aslı Demirgüç-Kunt, and Ross Levine, 2003. “Law, Endowments, and Finance.” Journal of Financial Economics, 70, 137-181.
Beck, Thorsten, Aslı Demirgüç-Kunt, and Ross Levine, 2004. “Finance, Inequality and Poverty: Cross-country Evidence.” NBER Working Paper 10979. Boyd, John H., Ross Levine, and Bruce D. Smith, 2001. “The Impact of Inflation on Financial Sector Performance.” Journal of Monetary Economics, 47, 221-248.
Chami, Ralph, Fullenkamp Connel and Jahjah Samir, 2003. “Are Immigrant Remittance Flows a Source of Capital for Development.” International Monetary Fund Working Papers 03/189.
Chinn, Menzie D. and Hiro Ito, 2002. “Capital Account Liberalization, Institutions and Financial Development: Cross Country Evidence.” NBER Working Paper 8967.
Cox Edwards, Alejandra and Manuelita Ureta, 2003. “International Migration, Remittances, and Schooling: Evidence from El Salvador.” Journal of Development Economics 72, 429–61.

22
De Luna Martinez, Jose, 2005. “Workers’ Remittances to Developing Countries. Findings of a Survey with Central Banks on Select Public Policy Issues.” World Bank. Mimeo.
Demirgrüç-Kunt, Asli and Enrica Detragiache, 1998. “Financial Liberalization and Financial Fragility.” International Monetary Fund Working Paper 9883.
Demirgrüç-Kunt, Asli and Vojislav Maksimovic, 1998. “Law, Finance, and Firm Growth”, Journal of Finance, 53, 2107-2137.
Djankov, Simeon, Caralee McLiesh and Andrei Shleifer, 2006. “Private Credit in 129 Countries.” Forthcoming Journal of Financial Economics.
Duryea, Suzanne, Ernesto López Córdova, and Alexandra Olmedo, 2005. “Migrant Remittances and Infant Mortality: Evidence from Mexico” Mimeo. Inter-American Development Bank.
Easterly, William and Ross Levine, 1997. “Africa’s Growth Tragedy: Politics, and Ethnic Divisions.” Quarterly Journal of Economics, 112, 1203-1250.
Freund, Caroline L. and Spatafora, Nikola, 2005. “Remittances: Transaction Costs, Determinants, and Informal Flows.” World Bank Policy Research Working Paper 3704.
Giuliano, Paola and Marta Ruiz Arranz, 2005. “Remittances, Financial Development and Growth.” International Monetary Fund Working Paper, forthcoming.
Hanson, Gordon H. and Christopher Woodruff, 2003. “Emigration and Educational Attainment in Mexico.” Mimeo. University of California, San Diego.
Hildebrandt, Nicole and David J. McKenzie, 2005. “The Effects of Migration on Child Health in Mexico.” World Bank Policy Research Working Paper 3573.
Harrison, Anne, Inessa Love, and Margaret McMillan, 2004. “Global Capital Flows and Financing Constraints.” Journal of Development Economics 75, 269-301.
Hinojosa Ojeda, Raul, 2003. Transnational Migration, Remittances and Development in North America: Globalization Lessons from the Oaxa-California Transnational Village/Community Modeling Project. Paper prepared for presentation at a Conference on "Remittances as a Development Tool in Mexico" organized by the Multilateral Investment Fund (MIF) of the Inter-American Development Bank (IDB), Mexico City, Mexico, October 28, 2003.
IMF, various years. Annual Report on Exchange Arrangements and Exchange Restrictions, Washington, D.C.
IMF, 2005. World Economic Outlook, Washington, D.C.
IMF, various years. Balance of Payments Statistics Yearbook, Washington, D.C.
Kaminsky, Graciela and Sergio Schmukler, 2004. “Short-Run Pain, Long-Run Gain: The Effects of Financial Liberalization.” NBER Working Paper 9787.

23
Kanaiaupuni, Shawn and Katharine M. Donato, 1999. “Migradollars and Mortality: The Effects of Migration on Infant Survival in Mexico.” Demography, 36, 339-353.
King, Robert, and Ross Levine, 1993. “Finance and Growth: Schumpeter Might be Right.” Quarterly Journal of Economics, 108, 717-737.
La Porta, Rafael; Florencio Lopez de Silanes, Andrei Shleifer, and Robert Vishny, 1997. “Legal Determinants of External Finance.” Journal of Finance, 52, 1131-1150.
La Porta, Rafael; Florencio Lopez de Silanes, Andrei Shleifer, and Robert Vishny, 1998. “Law and Finance,” Journal of Political Economy, 107, 1113-55.
Laeven, Luc, 2003. “Does Financial Liberalization Reduce Financing Constraints?” Financial Management, 32, 5-34.
Levine, Ross and Sara Zervos, 1998. “Stock Markets, Banks, and Growth.” American Economic Review, 88, 537-558.
López Córdova, Ernesto, 2005. “Globalization, Migration and Development: The Role of Mexican Migrant Remittances.” Economia, Journal of the Latin American and Caribbean Economic Association, forthcoming.
Maimbo, Samuel, and Dilip Ratha, 2005. Remittances: Development Impact and Future Prospects. Washington, D.C.: World Bank.
Massey, Douglas and Emilio Parrado, 1998. “International Migration and Business Formation in Mexico,” Social Science Quarterly, 79(1), 1-20.
Mundaca, Gabriela B., 2005. “Can Remittances Enhance Economic Growth? The Role of Financial Markets Development.” Mimeo. University of Oslo.
Orozco, Manuel and Rachel Fedewa, 2005. Leveraging Efforts on Remittances and Financial Intermediation. Report Commissioned by the Inter-American Development Bank.
Rajan, Raghuram, and Arvind Subramanian, 2005. “What Undermines Aid’s Impact on Growth?” International Monetary Fund Working Paper 05/126.
Rajan Raghuram and Luigi Zingales, 1998. “Financial Dependence and Growth.” American Economic Review, 88, 559-86.
Solimano, Andrés, 2003. “Workers Remittances to the Andean Region: Mechanisms, Costs and Development Impact”, Paper prepared for the Multilateral Investment Fund-IDB's Conference on Remittances and Development, May, Quito Ecuador.
Stulz, Rene, and Rohan Williamson, 2003. “Culture, Openness, and Finance.” Journal of Financial Economics, 70, 313-349.

24
Taylor, J. Edward, Jorge Mora, and Richard Adams, 2005. “Remittances, Inequality, and Poverty: Evidence from Rural Mexico,” Mimeo. University of California, Davis.
Terry, Donald F. and Steven R Wilson. 2005. Beyond Small Change: Making Migrant Remittances Count. Washington, D.C.: Inter-American Development Bank
Tornell, Aaron, Frank Westermann and Lorenza Martinez, 2004. “The Positive Link Between Financial Liberalization Growth and Crisis.” NBER Working Paper 10293.
Woodruff, Christopher and Rene Zenteno. 2001. “Remittances and Microenterprises in Mexico.” Mimeo. University of California, San Diego.
World Bank, 2006. Global Economic Prospects, World Bank, Washington D.C.
Yang, Dean, 2005. “International Migration, Human Capital, and Entrepreneurship: Evidence from Philippine Migrants’ Exchange Rate Shocks.” World Bank Policy Research Working Paper 3578.
Yang, Dean, 2006. “Coping with Disaster: The Impact of Hurricanes on International Financial Flows, 1970-2002.” University of Michigan. Mimeo.
.

Variable name Source
Remittances to GDP Balance of Payments Statistics (IMF). Data reported in WEO (2005)
Bank credit to GDP International Financial Statistics (IMF)
Bank deposit to GDP IdemGDP per capita World Development Indicators (World Bank)Log of GDP IdemInflation IdemExports to GDP IdemDual exchange rate Annual Report on Exchange Arrangements and Exchange
Restrictions (IMF)Financial liberalization Annual Report on Exchange Arrangements and Exchange
Restrictions (IMF), Demirgrüç-Kunt and Detragiache (1998), Abiad and Mody (2005), Bandiera et al (2000), Kaminsky and Schmukler (2004), Laeven (2003), Tornell, Westermann and Martinez (2004)
Other flows to GDP Balance of Payments Statistics (IMF)Latitude La Porta, López de Silanes, Shleifer and Vishny (1998)
British legal origin World Development Indicators (World Bank)
Creditor rights Djankov, McLeish and Shleifer (2005)
GDP per capita in remittance-source countries (in thousands)
Database on Immigrants and Expatriates (OECD) and World Development Indicators (World Bank)
GDP growth in remittance-source countries
Idem
Unemployment in remittance-source countries
Idem
Table 1Variable Definitions and Data Sources
The index measures the legal rights that shareholders and creditors have that enable them to extract a return on their investment from the insiders. The creditor rights index varies between 0 (poor creditor rights) and 4 (strong creditor rights).
GDP per capita of the five principal OECD recipients of migration for each country in our sample, weighted by share of total migration to these countries. Focusing on remittance receiving country Z, and assuming that the top five OECD countries that receive migrants from Z are countries A, B, C, D, and E, the weighted GDP per capita is constructed as: Sum over i[GDP per capita i *(migration of Z to i)/(sum of migration from Z received by A through E)], where i=A to E.
Dummy equals to 1 indicates liberalization in deposit and loan interest rates.
Sum of foreign direct investment + non-FDI private inflows + aid flows. Variable expressed as a percentage Absolute value of the latitude of a country, scaled between zero and one.
Dummy equals to 1 indicates countries with Common Law legal origins.
Variable definitions
GDP growth of the five principal OECD recipients of migration for each country in our sample, weighted by share of total migration to these countries. Focusing on remittance receiving country Z, and assuming that the top five OECD countries that receive migrants from Z are countries A, B, C, D, and E, the weighted GDP per capita is constructed as: Sum over i[GDP per capita i *(migration of Z to i)/(sum of migration from Z received by A through E)], where i=A to E.
Unemployment of the five principal OECD recipients of migration for each country in our sample, weighted by share of total migration to these countries. Focusing on remittance receiving country Z, and assuming that the top five OECD countries that receive migrants from Z are countries A, B, C, D, and E, the weighted GDP per capita is constructed as: Sum over i[GDP per capita i *(migration of Z to i)/(sum of migration from Z received by A through E)], where i=A to E.
Sum of remittances + migrant transfers + workers compensation, depending on the country (see the data appendix for details). Variable is expressed as a percentage of GDP. Deposit money banks' credit extended to the private sector expressed as a percentage of GDP.
Deposit money banks' deposits expressed as a percentage of GDP.GDP per capita in thousands of constant 1995 US$.Log of GDP in constant 1995 US$.GDP deflator (annual %).Total exports expressed as percentage of GDP.Dummy equals to 1 indicates the presence of multiple exchange rates.
Variable nameNumber of
observationsMean Standard deviation Minimum Maximum
Bank deposits to GDP (%) 1528 29.24 20.58 1.74 161.40Bank credits to GDP (%) 1518 24.79 17.79 0.46 121.56Remittances to GDP (%) 1528 2.95 4.52 0.00 41.17Log of GDP (in constant US$) 1528 22.86 1.83 18.56 27.78GDP Per Capita (in thousands US$) 1528 1.76 1.70 0.12 9.65Inflation (%) 1528 36.35 380.10 -23.48 12338.66Dual Exchange Rate 1528 0.20 0.40 0 1Financial Liberalization 1209 0.37 0.48 0 1Other flows to GDP (%) 1528 5.99 13.60 -312.81 169.27Exports to GDP (%) 1528 34.07 23.68 4.31 329.92Latitude 1528 0.21 0.14 0.01 0.66British Legal Origin 1528 0.34 0.47 0 1Creditor Rights 1295 1.55 1.14 0 4GDP per capita in remittance-source countries 1502 21.93 4.03 7.49 31.94GDP growth in remittance-source countries 1502 2.78 1.60 -5.65 7.25Unemployment in remittance-source countries 1187 7.93 2.03 4.03 15.66Liquid liabilities to GDP (%) 1523 37.53 23.62 3.51 152.14
Table 2Summary Statistics

Rem
ittances to GD
P0.496
0.6000.278
0.323[5.38]***
[6.25]***[3.34]***
[3.36]***L
og of GD
P16.376
17.72310.511
9.758[13.95]***
[13.74]***[9.94]***
[7.59]***G
DP
Per C
apita2.946
2.5146.615
8.057[3.30]***
[2.22]**[8.22]***
[7.12]***Inflation
-0.002-0.002
-0.001-0.001
[3.35]***[3.39]***
[2.59]***[2.39]**
Dual E
xchange Rate
-1.797-1.913
-2.181-2.170
[2.27]**[2.39]**
[3.04]***[2.70]***
Other Flow
s to GD
P-0.024
0.0060.001
-0.001[1.37]
[0.34][0.07]
[0.07]E
xports to GD
P0.195
0.1360.094
0.109[8.93]***
[4.00]***[4.77]***
[3.21]***Financial L
iberalization0.003
-0.483[0.01]
[0.76]C
onstant-357.749
-390.777-230.538
-215.800[13.91]***
[13.77]***[9.96]***
[7.63]***O
bservations1528
12091518
1206N
umber of countries
9262
9262
Country dum
mies
Yes
Yes
Yes
Yes
Adj. R
-squared0.31
0.370.28
0.29F-statistic for country fixed effects
52.4039.55
53.5151.74
P-value for country fixed effects
0.000.00
0.000.00
Table 3
Bank C
redit to GD
PB
ank Deposits to G
DP
The regression equation estim
ated is of the form FD
i,t = b
1 Rem
i,t + b
2 Xi,t +
ai +
ui,t w
here FD refers to financial developm
ent measured
as the % of bank deposits and, separately, bank credit to G
DP
. Rem
ittances to GD
P is the share of rem
ittances as a % of G
DP
. X is a
matrix of controls including: G
DP
per capita, m
easured in constant dollars; Log of G
DP
, stated in constant dollars; Inflation,
defined as the % change in the G
DP
deflator; Dual exchange rates
, a dumm
y capturing periods when m
ultiple exchange rates were in
effect; Financial liberalization
, a dumm
y identifying periods of liberalization in domestic interest rates; O
ther flows to G
DP
, defined as foreign direct investm
ent + N
on-FDI private inflow
s + aid expressed as a %
of GD
P; and E
xports to GD
P, the share of total
exports as a % of G
DP
. Country dum
mies are included, but not show
n. Absolute value of t statistics are in brackets. T
he symbols *,
**, and *** denote significance at the 10, 5, and 1 percent level, respectively.
Fixed E
ffects Results
Panel E
stimates of the Im
pact of Rem
ittances on Financial D
evelopment

Remittances to GDP 0.627 0.706 0.695 0.723 0.342 0.333 0.364 0.335[6.67]*** [7.15]*** [7.41]*** [7.15]*** [4.09]*** [3.43]*** [3.88]*** [3.28]***
Log of GDP 7.305 8.830 10.937 10.194 6.305 7.634 7.465 7.733[10.00]*** [11.60]*** [13.78]*** [12.32]*** [9.70]*** [9.27]*** [8.40]*** [7.84]***
GDP Per Capita 5.541 4.226 1.118 0.276 6.213 5.794 6.008 5.117[8.40]*** [5.34]*** [1.32] [0.31] [10.58]*** [6.95]*** [6.59]*** [4.94]***
Inflation -0.002 -0.002 -0.002 -0.002 -0.002 -0.001 -0.001 -0.001[3.40]*** [3.48]*** [3.61]*** [3.49]*** [2.68]*** [2.46]** [2.48]** [2.37]**
Dual exchange rate -2.824 -3.015 -3.323 -3.507 -2.916 -2.913 -3.194 -3.279[3.47]*** [3.62]*** [4.31]*** [4.12]*** [4.00]*** [3.56]*** [4.14]*** [3.82]***
Other flows to GDP -0.026 -0.002 -0.002 -0.004 0.003 -0.002 -0.006 -0.008[1.41] [0.09] [0.12] [0.19] [0.17] [0.08] [0.33] [0.39]
Exports to GDP 0.240 0.256 0.267 0.298 0.123 0.179 0.194 0.234[11.02]*** [7.77]*** [8.47]*** [8.50]*** [6.36]*** [5.47]*** [6.08]*** [6.46]***
Financial liberalization 0.484 0.676 -0.584 -0.429[0.74] [1.01] [0.91] [0.64]
Latitude -15.030 5.958 -30.351 7.667[1.61] [0.43] [2.64]*** [0.41]
British legal origin 4.323 4.246 3.345 2.922[1.13] [1.13] [0.71] [0.58]
Creditor rights 0.103 -0.277 -0.205 -1.033[0.07] [0.19] [0.12] [0.54]
Constant -156.774 -192.251 -236.244 -222.930 -135.374 -165.733 -158.175 -169.297[9.70]*** [11.32]*** [13.38]*** [12.36]*** [9.42]*** [9.05]*** [7.98]*** [7.86]***
Observations 1528 1209 1295 1109 1518 1206 1285 1106Number of countries 92 62 75 56 92 62 75 56Adj. R-squared 0.13 0.22 0.29 0.31 0.15 0.16 0.19 0.19
Hausman test 156.7 162.96 -a -a 106.77 153.84 -a -a
P-value for Hausman test 0.00 0.00 0.00 0.00a The Hausman test cannot be performed in this case, because it is impossible to estimate the fixed effects model when we include time time invariant variables such as creditor rights, legal origin, and latitude.
Bank Deposits to GDP Bank Credit to GDP
Table 4Panel Estimates of the Impact of Remittances on Financial Development
Random Effects Results
The regression equation estimated is of the form FDi,t= b1Remi,t + b2Xi,t + ai + ui,t where FD refers to financial development measured as the % of bank deposits and, separately, bank credit to GDP. Remittances to GDP is the share of remittances as a % of GDP. X is a matrix of controls including: GDP per capita , measured in constant dollars; Log of GDP , stated in constant dollars; Inflation , defined as the % change in the GDP deflator; Dual exchange rates , a dummy capturing periods when multiple exchange rates were in effect; Financial liberalization , a dummy identifying periods of liberalization in domestic interest rates; Other flows to GDP , defined as foreign direct investment + Non-FDI private inflows + aid expressed as a % of GDP; Exports to GDP, the share of total exports as a % of GDP; Latitude , defined in absolute terms and scaled between 0 and 1; British legal origin, a dummy equal to 1 for countries with Common Law legal tradition, and Creditor rights , an index of creditor rights as defined by Djankov, McLiesh and Shleifer (2006). Absolute value of t statistics are in brackets. The symbols *, **, and *** denote significance at the 10, 5, and 1 percent level, respectively.
Rem
ittances to GD
P0.581
0.5960.242
0.255[6.46]***
[6.09]***[2.88]***
[2.67]***L
og of GD
P15.231
15.4618.753
8.755[14.48]***
[12.56]***[8.77]***
[7.39]***G
DP
Per capita
2.2891.823
5.1305.239
[2.78]***[1.66]*
[6.60]***[4.94]***
Inflation-0.009
-0.018-0.006
-0.013[1.86]*
[2.68]***[1.44]
[1.99]**D
ual exchange rate-0.593
-0.609-2.475
-2.339[0.85]
[0.81][3.72]***
[3.17]***O
ther flows to G
DP
-0.019-0.003
0.1300.128
[0.44][0.06]
[3.09]***[2.53]**
Exports to G
DP
0.1420.143
0.0390.071
[4.82]***[4.31]***
[1.37][2.13]**
Financial liberalization0.423
-0.934[0.73]
[1.64]C
onstant-330.654
-337.366-187.260
-187.728[14.38]***
[12.48]***[8.59]***
[7.22]***O
bservations1392
11171388
1108N
umber of countries
8759
8960
Country dum
mies
Yes
Yes
Yes
Yes
Adj. R
-squared0.32
0.350.22
0.23
Bank C
redit to GD
P
Table 5
The regression equation estim
ated is of the form FD
i,t = b
1 Rem
i,t + b
2 Xi,t +
ai +
ui,t w
here FD refers to financial developm
ent m
easured as the % of bank deposits and, separately, bank credit to G
DP
. Rem
ittances to GD
P is the share of rem
ittances as a %
of GD
P. X
is a matrix of controls including: G
DP
per capita, m
easured in constant dollars; Log of G
DP
, stated in constant dollars; Inflation
, defined as the % change in the G
DP
deflator; Dual exchange rates, a dum
my capturing periods
when m
ultiple exchange rates were in effect; F
inancial liberalization, a dum
my identifying periods of liberalization in
domestic interest rates; O
ther flows to G
DP
, defined as foreign direct investment +
Non-FD
I private inflows +
aid expressed as a %
of GD
P and E
xports to GD
P, the share of total exports as a %
of GD
P. O
utliers, observations in the top and bottom
1 percent of the distribution for each variable, are removed. C
ountry dumm
ies are included, but not shown.
Absolute value of t statistics are in brackets. T
he symbols *, **, and *** denote significance at the 10, 5, and 1 percent
level, respectively.
Panel E
stimates of the Im
pact of Rem
ittances on Financial D
evelopment
Fixed E
ffects Results R
emoving P
otential Outliers
Bank D
eposits to GD
P

Rem
ittances to GD
P0.618
0.6030.287
0.323[6.66]***
[6.04]***[3.10]***
[3.19]***L
og of GD
P18.379
19.51110.876
8.963[15.39]***
[13.83]***[9.15]***
[6.30]***G
DP
per capita2.764
0.9257.368
10.085[2.99]***
[0.70][8.00]***
[7.58]***Inflation
-0.002-0.002
-0.001-0.001
[3.34]***[3.28]***
[2.25]**[2.19]**
Dual exchange rate
-1.874-1.875
-2.837-2.658
[2.25]**[2.08]**
[3.40]***[2.90]***
Other flow
s to GD
P0.008
0.0090.004
-0.002[0.42]
[0.50][0.24]
[0.12]E
xports to GD
P0.121
0.1310.097
0.120[3.70]***
[3.65]***[2.98]***
[3.30]***Financial liberalization
0.201-0.156
[0.29][0.22]
Constant
-406.038-431.061
-243.145-202.14
[15.47]***[13.90]***
[9.31]***[6.46]***
Observations
12681041
12581038
Num
ber of countries70
4970
49C
ountry dumm
iesY
esY
esY
esY
esA
dj. R-squared
0.380.39
0.310.32
Bank C
redit to GD
P
Table 6
The regression equation estim
ated is of the form FD
i,t = b
1 Rem
i,t + b
2 Xi,t +
ai +
ui,t w
here FD refers to financial developm
ent m
easured as the % of bank deposits and, separately, bank credit to G
DP
. Rem
ittances to GD
P is the share of rem
ittances as a %
of GD
P. X
is a matrix of controls including: G
DP
per capita, m
easured in constant dollars; Log of G
DP
, stated in constant dollars; Inflation
, defined as the % change in the G
DP
deflator; Dual exchange rates, a dum
my capturing periods w
hen m
ultiple exchange rates were in effect; F
inancial liberalization, a dum
my identifying periods of liberalization in dom
estic interest rates; O
ther flows to G
DP
, defined as foreign direct investment +
Non-F
DI private inflow
s + aid expressed as a %
of G
DP
and Exports to G
DP
, share of exports as a % of G
DP
. Country dum
mies are included, but not show
n. Absolute value of
t statistics are in brackets. The sym
bols *, **, and *** denote significance at the 10, 5, and 1 percent level, respectively.
Panel E
stimates of the Im
pact of Rem
ittances on Financial D
evelopment
Fixed E
ffects Results for 1995-2003
Bank D
eposits to GD
P

Rem
ittances to GD
P0.182
0.3670.207
0.293[1.83]*
[3.48]***[2.27]**
[2.73]***L
og of GD
P6.890
12.33710.521
11.023[3.55]***
[5.27]***[5.95]***
[4.68]***G
DP
per capita3.523
2.8295.819
7.314[3.76]***
[2.31]**[6.81]***
[5.89]***Inflation
-0.002-0.002
-0.001-0.001
[3.23]***[3.25]***
[2.45]**[2.30]**
Dual exchange rate
-0.0140.013
0.0040.003
[0.80][0.70]
[0.24][0.16]
Other flow
s to GD
P0.201
0.1470.099
0.110[9.30]***
[4.34]***[5.02]***
[3.20]***E
xports to GD
P-1.410
-1.398-2.016
-2.086[1.79]*
[1.76]*[2.78]***
[2.57]**Financial liberalization
2.7902.178
[3.52]***[2.70]***
Constant
-134.589-260.538
-226.933-242.849
[3.05]***[4.87]***
[5.65]***[4.51]***
Observations
15281209
15181206
Num
ber of countries92
6292
62A
dj. R-squared
0.340.40
0.290.30
Country dum
mies
Yes
Yes
Yes
Yes
Tim
e dumm
iesY
esY
esY
esY
esF-statistic for country fixed effects
53.3239.09
53.6851.62
P-value
0.000.00
0.000.00
F-statistic for time fixed effects
2.822.74
1.541.51
P-value
0.000.00
0.040.04
Table 7
Bank C
redit to GD
PB
ank Deposits to G
DP
The regression equation estim
ated is of the form FD
i,t = b
1 Rem
i,t + b
2 Xi,t +
ai +
ui,t w
here FD refers to financial developm
ent measured
as the % of bank deposits and, separately, bank credit to G
DP
. Rem
ittances to GD
P is the share of rem
ittances as a % of G
DP
. X is a
matrix of controls including: G
DP
per capita, m
easured in constant dollars; Log of GD
P, stated in constant dollars; Inflation
, defined as the %
change in the GD
P deflator; D
ual exchange rates, a dum
my capturing periods w
hen multiple exchange rates w
ere in effect; F
inancial liberalization, a dum
my identifying periods of liberalization in dom
estic interest rates; Other flow
s to GD
P, defined as
foreign direct investment +
Non-FD
I private inflows +
aid expressed as a % of G
DP
and Exports to G
DP
, the share of total exports as a %
of GD
P. C
ountry dumm
ies are included, but not shown. A
bsolute value of t statistics are in brackets. The sym
bols *, **, and *** denote significance at the 10, 5, and 1 percent level, respectively.
Tw
o Way F
ixed Effects E
stimates Including C
ountry and Tim
e Dum
mies
Panel E
stimates of the Im
pact of Rem
ittances on Financial D
evelopment
Rem
ittances to GD
P0.418
0.5440.310
0.372[3.74]***
[4.76]***[3.04]***
[3.18]***L
og of GD
P13.481
17.46011.732
10.403[8.61]***
[9.88]***[8.30]***
[5.85]***G
DP
per capita3.221
0.5147.302
9.826[3.06]***
[0.39][7.61]***
[7.23]***Inflation
-0.002-0.001
-0.001-0.001
[2.71]***[2.35]**
[1.73]*[1.54]
Dual exchange rate
-1.231-0.890
-1.572-1.358
[1.51][1.09]
[2.09]**[1.62]
Other flow
s to GD
P0.037
0.0490.058
0.058[2.10]**
[2.72]***[3.62]***
[3.15]***E
xports to GD
P0.184
0.1210.078
0.056[9.00]***
[3.43]***[4.15]***
[1.54]Financial liberalization
2.2702.279
[2.79]***[2.74]***
Constant
-289.571-378.758
-256.553-230.162
[8.42]***[9.70]***
[8.26]***[5.86]***
Observations
13981123
13921120
Tim
e dumm
iesY
esY
esY
esY
esC
ountry dumm
iesY
esY
esY
esY
esA
dj. R-squared
0.310.37
0.290.31
Bank D
eposits to GD
PB
ank Credit to G
DP
Table 8
Panel E
stimates of the Im
pact of Rem
ittances on Financial D
evelopment
Fixed E
ffect Estim
ates Lagging R
egressors 2 years
The regression equation estim
ated is of the form FD
i,t = b
1 Rem
i,t-2 + b
2 Xi,t-2 +
ai +
ui,t w
here FD refers to financial
development m
easured as the % of bank deposits and, separately, bank credit to G
DP
. Rem
ittances to GD
P is the share of
remittances as a %
of GD
P. X
is a matrix of controls including: G
DP
per capita, m
easured in constant dollars; Log of G
DP
, stated in constant dollars; Inflation
, defined as the % change in the G
DP
deflator; Dual exchange rates, a dum
my capturing
periods when m
ultiple exchange rates were in effect; F
inancial liberalization, a dum
my identifying periods of liberalization
in domestic interest rates; O
ther flows to G
DP
, defined as foreign direct investment +
Non-FD
I private inflows +
aid expressed as a %
of GD
P and E
xports to GD
P, the share of total exports as a %
of GD
P. T
ime and country dum
mies are
included, but not shown. A
bsolute value of t statistics are in brackets. The sym
bols *, **, and *** denote significance at the 10, 5, and 1 percent level, respectively.

Rem
ittances to GD
P0.194
0.1480.124
0.058[2.45]**
[2.79]***[2.00]**
[0.67]L
og of GD
P1.532
0.6801.963
2.215[1.51]
[0.94][2.66]***
[1.92]*G
DP
per capita0.062
0.0720.322
-0.372[0.19]
[0.15][0.87]
[0.36]Inflation
-0.001-0.001
-0.002-0.002
[1.15][1.39]
[1.16][1.20]
Dual exchange rate
-2.011-0.996
0.063-0.043
[2.03]**[1.42]
[0.06][0.04]
Other flow
s to GD
P0.055
0.0180.001
-0.011[1.05]
[1.50][0.05]
[0.70]E
xports to GD
P0.095
0.0270.022
-0.040[3.64]***
[1.38][0.78]
[0.91]Financial liberalization
-0.269-2.725
[0.40][2.08]**
Lag 1 of deposits to G
DP
1.2701.205
[19.24]***[20.64]***
Lag 2 of deposits to G
DP
-0.346-0.205
[4.73]***[2.11]**
Lag 2 of deposits to G
DP
0.0550.000
[1.42][0.00]
Lag 1 of credit to G
DP
1.4261.440
[19.29]***[19.16]***
Lag 2 of credit to G
DP
-0.627-0.630
[5.25]***[5.01]***
Lag 3 of credit to G
DP
0.1630.155
[2.15]**[1.98]*
Constant
-39.458-17.373
-48.046-50.802
[1.67]*[1.08]
[2.90]***[2.07]**
Observations
12111019
11821013
Tim
e dumm
iesY
esY
esY
esY
esSargan test for overidentifying restrictions
19.412.39
26.2512.09
P-value Sargan test
0.620.98
0.240.99
Test for 2nd order autocorrelation
1.211.2
1.111.32
P-value for test for 2nd order autocorrelation
0.230.23
0.270.19
Table 9
GM
M D
ynamic System
Estim
ates of the Impact of R
emittances on F
inancial Developm
ent
Rem
ittances to GD
P is the share of rem
ittances as a % of G
DP
. X is a m
atrix of controls including: GD
P per capita
, m
easured in constant dollars; Log of G
DP
, stated in constant dollars; Inflation, defined as the % change in the G
DP
deflator; D
ual exchange rates, a dumm
y capturing periods when m
ultiple exchange rates were in effect; F
inancial liberalization, a
dumm
y identifying periods of liberalization in domestic interest rates; O
ther flows to G
DP
, defined as foreign direct investm
ent + N
on-FD
I private inflows +
aid expressed as a % of G
DP
and Exports to G
DP
, the share of total exports as a %
of GD
P. T
ime dum
mies are included, but not show
n. Absolute value of t statistics are in brackets. T
he symbols *, **, and ***
denote significance at the 10, 5, and 1 percent level, respectively.B
ank Deposits to G
DP
Bank C
redit to GD
P
Results reported below
are obtained by estimating the follow
ing system of equations FD
i,t = b
1 FDi,t-1 +
b2 R
emi,t +
b3 X
i,t + a
i +
ui,t and F
Di,t -FD
i,t-1 =b
1 (FDi,t-1 -FD
i,t-2 )+ b
2 (Rem
i,t -Rem
i,t-1 ) + b
3 (Xi,t -X
i,t-1 ) + u
i,t -ui,t-1 . T
o compute the system
estimator,
variables in differences are instrumented w
ith lags of their own levels, w
hile variables in levels are instrumented w
ith lags of their ow
n differences. FD refers to financial developm
ent measured as the %
of bank deposits and bank credit to GD
P.

Rem
ittances to GD
P4.905
4.2284.899
5.443[5.62]***
[5.51]***[5.76]***
[5.77]***L
og of GD
P26.349
31.71633.006
47.587[4.47]***
[4.78]***[5.70]***
[5.83]***G
DP
per capita4.844
2.5665.325
1.920[2.73]***
[1.26][3.07]***
[0.77]Inflation
-0.003-0.002
-0.002-0.002
[2.92]***[3.21]***
[1.94]*[1.74]*
Dual exchange rate
0.9430.374
-1.313-1.950
[0.67][0.29]
[0.95][1.22]
Other flow
s to GD
P-0.026
0.021-0.020
0.004[0.78]
[0.68][0.62]
[0.11]E
xports to GD
P0.167
0.0650.030
-0.102[4.76]***
[1.16][0.87]
[1.48]Financial liberalization
3.6694.286
[2.91]***[2.77]***
Constant
-514.466-775.204
-763.790-1176.806
[4.66]***[4.67]***
[5.81]***[5.77]***
Observations
1181927
1174927
Num
ber of Countries
8660
8660
Country dum
mies
Yes
Yes
Yes
Yes
Tim
e dumm
iesY
esY
esY
esY
esC
ragg Donald F-statistic for w
eak instruments
15.0214.57
14.9614.57
Sargan test of overidentifying restrictions0.43
0.342.44
3.99P
-value for Sargan test0.81
0.850.30
0.14
The regression equation estim
ated is of the form FD
i,t = b
1 Rem
i,t + b
2 Xi,t +
ai +
ui,t w
here FD
refers to financial development m
easured as the %
of bank deposits and, separately, bank credit to GD
P. R
emittances to G
DP
is the share of remittances as a %
of GD
P. X
is matrix of
controls including: GD
P per capita
, measured in constant dollars; L
og of GD
P, stated in constant dollars; Inflation, defined as the %
change in the G
DP
deflator; Dual exchange rates, a dum
my capturing periods w
hen multiple exchange rates w
ere in effect; Financial liberalization
, a dum
my identifying periods of liberalization in dom
estic interest rates; Other flow
s to GD
P, defined as foreign direct investm
ent + N
on-FDI
private inflows +
aid expressed as a % of G
DP
and Exports to G
DP
, the share of total exports as a % of G
DP
. GD
P per capita, real G
DP
grow
th, and unemploym
ent rates in remittance-source countries, w
eighted by migration, are used as instrum
ents. Tim
e and country dumm
ies are included, but not show
n. Absolute value of t statistics are in brackets. T
he symbols *, **, and *** denote significance at the 10, 5, and 1
percent level, respectively.
Bank D
eposits to GD
PB
ank Credit to G
DP
Table 10
Econom
ic conditions in the remittance-source countries are used as instrum
ent for remittances
Panel E
stimates of the Im
pact of Rem
ittances on Financial D
evelopment
Instrumental V
ariables Fixed E
ffects Estim
ates
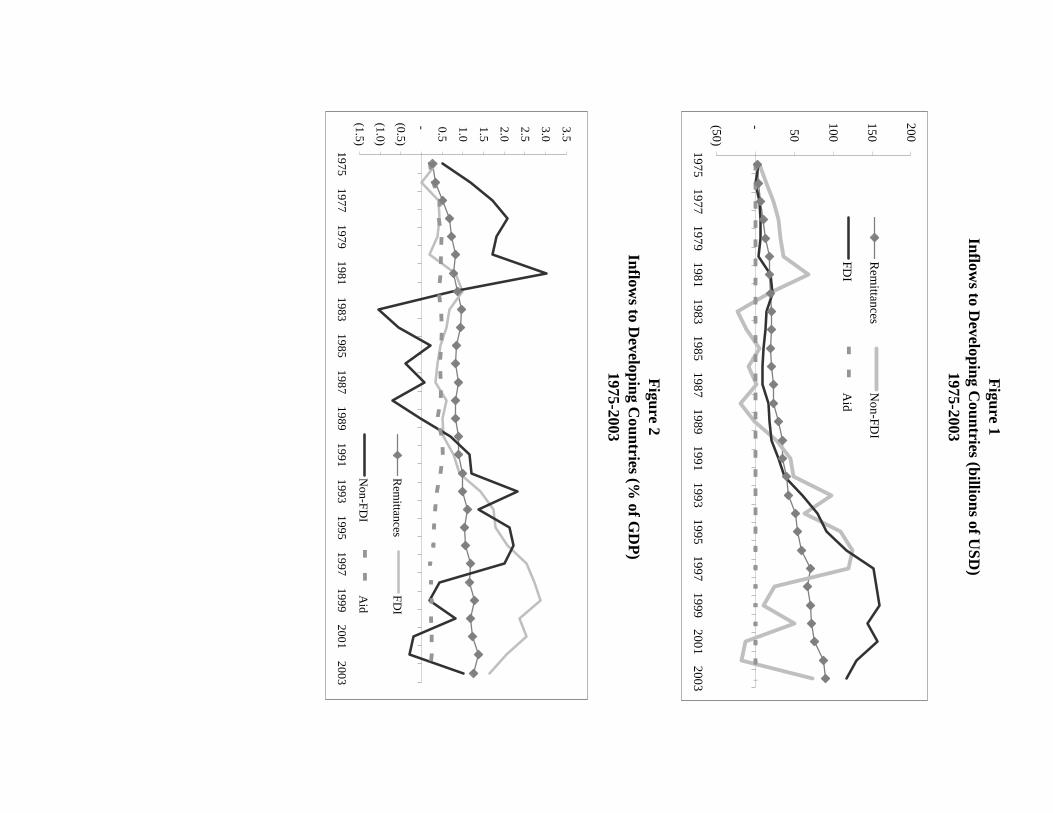
Inflows to D
eveloping Countries (%
of GD
P)
1975-2003
Figure 1
Inflows to D
eveloping Countries (billions of U
SD)
1975-2003
Figure 2
(50)
- 50
100
150
200
19751977
19791981
19831985
19871989
19911993
19951997
19992001
2003
Rem
ittancesN
on-FDI
FDI
Aid
(1.5)
(1.0)
(0.5)
- 0.5
1.0
1.5
2.0
2.5
3.0
3.5
19751977
19791981
19831985
19871989
19911993
19951997
19992001
2003
Rem
ittancesF
DI
Non-F
DI
Aid

10 Largest R
ecipients of Rem
ittances (in % of G
DP
)1975-2003 (A
verage)
Figure 3
10 Largest R
ecipients of Rem
ittances (in billions of USD
)1975-2003 (A
verage)
Figure 4
0.96
1.01
1.02
1.05
1.60
2.44
2.95
3.27
4.26
4.26
-0.50
1.001.50
2.002.50
3.003.50
4.004.50
Brazil
Bangladesh
Jordan
Poland
Morocco
Turkey
Philippines
Egypt, A
rab Rep.
Mexico
India
6.77
6.83
7.77
7.78
8.01
8.03
10.09
11.66
17.86 18.61
02
46
810
1214
1618
20
Jamaica
St. K
itts and Nevis
Sw
aziland
Egypt, A
rab Rep.
El S
alvador
Vanuatu
Haiti
Moldova
Tonga
Jordan

Country
Years
Country
Years
Country
Years
Algeria
1980 - 1988G
hana1979 - 1997
Nigeria
1977 - 1993A
rgentina1978 - 2003
Grenada
1986 - 1990P
akistan1976 - 2003
Arm
enia1995 - 2003
Guatem
ala1977 - 2001
Panam
a1980 - 2002
Bangladesh
1994 - 2003H
aiti1975 - 2003
Papua N
ew G
uinea1976 - 2001
Barbados
1975 - 2002H
onduras1975 - 2003
Paraguay
1975 - 2003B
elarus1995 - 2003
Hungary
1995 - 2003P
eru1990 - 2003
Belize
1984 - 2002India
1975 - 2002P
hilippines1977 - 2003
Benin
1992 - 2001Indonesia
1983 - 2003P
oland1994 - 2003
Bolivia
1976 - 2003Jam
aica1976 - 2003
Rom
ania1994 - 2003
Botsw
ana1975 - 2002
Jordan1977 - 2003
Rw
anda1976 - 2002
Brazil
1980 - 2003K
azakhstan1995 - 2003
Senegal1975 - 2002
Bulgaria
1992 - 2003K
enya1975 - 2003
Seychelles1989 - 2002
Burkina Faso
1983 - 2001K
yrgyz Republic
1996 - 2003Sierra L
eone1980 - 2001
Cam
eroon1979 - 1995
Lao P
DR
1988 - 2001Slovak R
epublic1994 - 2003
Central A
frican Republic
1982 - 1993L
atvia1996 - 2003
South Africa
1985 - 2001C
had1985 - 1994
Lithuania
1994 - 2003Sri L
anka1975 - 2003
Chile
1983 - 2003M
adagascar1975 - 2003
St. K
itts and Nevis
1986 - 1990C
hina1987 - 2001
Malaw
i1994 - 2000
Sudan1984 - 1997
Colom
bia1975 - 2003
Malaysia
1975 - 2003Surinam
e1978 - 1994
Congo, R
ep.1995 - 2002
Maldives
1996 - 2003Sw
aziland1975 - 2002
Costa R
ica1977 - 2003
Mali
1988 - 2002Syrian A
rab Republic
1992 - 2002C
ote d'Ivoire1975 - 2002
Mauritania
1986 - 1997T
hailand1975 - 2003
Croatia
1994 - 2003M
auritius1981 - 2003
Togo
1975 - 2002D
ominica
1986 - 2002M
exico1979 - 2001
Tonga
1985 - 1993D
ominican R
epublic1975 - 2003
Moldova
1995 - 2001T
rinidad and Tobago
1983 - 2002E
cuador1976 - 2001
Morocco
1976 - 2003T
unisia1988 - 2003
Egypt, A
rab Rep.
1977 - 2003M
ozambique
1996 - 2002T
urkey1987 - 2003
El Salvador
1977 - 2003N
amibia
1991 - 2001V
anuatu1982 - 2001
Estonia
1994 - 2003N
epal1996 - 2001
Venezuela, R
B1997 - 2002
Fiji1979 - 1988
Nicaragua
1977 - 1993Z
imbabw
e1980 - 1993
Gabon
1978 - 1999N
iger1975 - 1995
Appendix T
able 1C
ountries and Periods Included

Appendix 2: Remittance Data Unless otherwise indicated, total remittances are the sum of three components: compensation of employees (under income balance of current account), workers’ remittances (under current transfers) and migrant transfers (under capital account). These data were primarily obtained from the International Monetary Fund (IMF) Balance of Payments Statistics Yearbook, reported in the IMF’s 2005 World Economic Outlook. Compensation of employees should not be part of total remittances for Argentina, Australia, Azerbaijan, Barbados, Belize, Benin, Bosnia-Herzegovina, Brazil, Cambodia, Cape Verde, China, Cote d’Ivoire, Dominican Republic, Ecuador, El Salvador, Guyana, Italy, Panama, Rwanda, Senegal, Seychelles, Singapore, Turkey, and Venezuela In general, “other current transfers” are NOT included in the definition of total remittances, except for Kenya, Malaysia, and Syria, where the Balance of Payment Yearbook specifies explicitly that migrants’ remittances are recorded under “other current transfers”. For countries for which data were not available, IMF desk economists were contacted and the following data and/or information were provided: 1. Bulgaria: Other current transfers should be included in the remittances figure. 2. Haiti: Added remittances inflows data for 1991-2003. 3. Iran: Other current transfers should be used as the figure for total remittances. 4. Moldova: Added remittances data for 2000. 5. Niger: Added remittances inflows data for 1995-2003. 6. Romania: Added remittances data for 2000-2003. 7. Slovak Republic: Added remittances data for 1999-2003. 8. Ukraine: Added remittances data for 2000. 9. Venezuela: Added remittances inflows data for 1997-2003.

Remittances to GDP 0.425 0.399 0.467 0.431 0.317 0.371 0.418 0.321[6.11]*** [6.01]*** [6.80]*** [6.36]*** [4.42]*** [5.44]*** [5.89]*** [4.56]***
Log of GDP 15.362 14.862 14.833 13.020 9.827 18.020 16.557 8.010[13.36]*** [12.28]*** [11.44]*** [11.05]*** [4.98]*** [8.01]*** [7.04]*** [4.04]***
GDP Per Capita 3.678 5.468 3.034 3.943 4.437 4.031 2.121 4.324[4.41]*** [5.14]*** [2.66]*** [4.39]*** [4.95]*** [3.40]*** [1.70]* [4.53]***
Inflation -0.002 -0.002 -0.002 -0.002 -0.002 -0.002 -0.002 -0.002[2.59]*** [2.73]*** [2.89]*** [2.91]*** [2.69]*** [2.79]*** [2.93]*** [2.97]***
Dual Exchange Rate -2.276 -0.865 -1.032 -0.960 -2.275 -0.706 -0.808 -0.910[2.95]*** [1.13] [1.29] [1.23] [2.95]*** [0.93] [1.01] [1.15]
Financial Liberalization 0.259 0.120 3.881 4.044[0.42] [0.19] [5.11]*** [5.07]***
Other Flows to GDP -0.008 -0.033 0.004 -0.022[0.43] [1.85]* [0.20] [1.20]
Exports to GDP 0.254 0.312 0.248 0.315[7.41]*** [14.18]*** [7.30]*** [14.28]***
Constant -318.748 -316.622 -319.326 -277.962 -188.464 -384.567 -353.938 -159.411[12.62]*** [11.79]*** [11.19]*** [10.76]*** [4.22]*** [7.46]*** [6.60]*** [3.55]***
Observations 1867 1367 1257 1586 1867 1367 1257 1586Number of Countries 103 66 65 96 103 66 65 96Time Dummies No No No No Yes Yes Yes YesAdj. R-squared 0.19 0.28 0.32 0.31 0.21 0.31 0.35 0.32
Appendix Table 3
Fixed Effects Results with Liquid Liabilities
Liquid liabilities to GDP
The regression equation estimated is of the form FDi,t= b1Remi,t + b2Xi,t + ai + ui,t where in this case FD refers to financial development measured as the % of liquid liabilities to GDP. Remittances to GDP is the share of remittances as a % of GDP. X is a matrix of controls including: GDP per capita, measured in constant dollars; Log of GDP , stated in constant dollars; Inflation , defined as the % change in the GDP deflator; Dual Exchange Rates , a dummy capturing periods when multiple exchange rates were in effect; Financial Liberalization , a dummy identifying periods of liberalization in domestic interest rates, Other flows to GDP , defined as foreign direct investment + Non-FDI private inflows + aid expressed as a % of GDP and Exports to GDP, the share of total exports as a % of GDP. Absolute value of t statistics are in brackets. The symbols *, **, and *** denote significance at the 10, 5, and 1 percent level, respectively.
Panel Estimates of the Impact of Remittances on Financial Development
With Time Dummies Without Time Dummies

Appendix 4: Note on the impact of measurement error
Given tititi vxy ,,, += β , tititi uxx ,
*,, += and 0),cov( * =ux
where x is measured with error and *x is the true value of x , it can be shown that
β)var()var(
)var(*
*
xu
xb
+=
where b is the estimated value of the coefficient. Furthermore, given that )var()var()var( * uxx −= , b can be expressed as
β)var(
)var()var(
x
uxb
−=
or
)var(
)var(1
x
ub −=β
From our FE estimates for bank deposits b ≅ 0.6 and from our IV estimations β ≅ 4, implying
that:
)var(
)var(115.0
x
ub −==β
or 85.0)var(
)var( =x
u or 85.0
)(.
)(. =xdevstd
udevstd
Given that in our sample standard deviation of x (or the standard deviation of remittances) equals
4.52 then this implies that std.dev(u) would equal 4.17. Considering that the mean of x is 2.95,
this suggests that the size of the measurement error of x, remittance, could be close to 142% of x.
This number is within the existing estimates of the size of informal remittances which range
between 20 and 200% of formal remittances.