Do Visual Aids Really Matter? A Comparison of Student ... · A Comparison of Student Evaluations...
24
The Journal of Educators Online-JEO January 2016 ISSN 1547-500X Vol 13 Number 1 194 Do Visual Aids Really Matter? A Comparison of Student Evaluations Before and After Embedding Visuals Into Video Lectures Kristine Fish, California State Polytechnic University, Pomona, California, USA Jungwon Mun, California State Polytechnic University, Pomona, California, USA RoseAnn A’Jontue, California State Polytechnic University, Pomona, California, USA ABSTRACT Educational webcasts or video lectures as a teaching tool and a form of visual aid have become widely used with the rising prevalence of online and blended courses and with the increase of web-based video materials. Thus, research pertaining to factors enhancing the effectiveness of video lectures, such as number of visual aids, is critical. This study compared student evaluations before and after embedding additional visual aids throughout video lectures in an online course. Slide transitions occurred on average every 40 seconds for the pre-treatment group with approximately 600 visuals total, compared to slide transitions every 10 seconds for the post- treatment group with approximately 2,000 visuals total. All students received the same audio recordings. Research questions addressed are: (1) Are student perceptions of the effectiveness of examples used to illustrate concepts affected by number of visual aids? (2) Is the extent to which students feel engaged during the lectures affected by number of visual aids? (3) Are students’ perceived overall learning experiences affected by number of visual aids? Surprisingly, results indicate that for questions #1 and #3, student ratings of those who viewed videos with fewer visuals rated their experiences higher than students who viewed more visuals. There was no significant difference found for question #2. Conclusion: Although some visuals have been shown to enhance learning, too many visuals may be a deterrent to learning.
Transcript of Do Visual Aids Really Matter? A Comparison of Student ... · A Comparison of Student Evaluations...
The Journal of Educators Online-JEO January 2016 ISSN 1547-500X Vol 13 Number 1 194
Do Visual Aids Really Matter? A Comparison of Student Evaluations Before and After Embedding Visuals
Into Video Lectures
Kristine Fish, California State Polytechnic University, Pomona, California, USA
Jungwon Mun, California State Polytechnic University, Pomona, California, USA
RoseAnn A’Jontue, California State Polytechnic University, Pomona, California, USA
ABSTRACT
Educational webcasts or video lectures as a teaching tool and a form of visual aid have become
widely used with the rising prevalence of online and blended courses and with the increase of
web-based video materials. Thus, research pertaining to factors enhancing the effectiveness of
video lectures, such as number of visual aids, is critical. This study compared student evaluations
before and after embedding additional visual aids throughout video lectures in an online course.
Slide transitions occurred on average every 40 seconds for the pre-treatment group with
approximately 600 visuals total, compared to slide transitions every 10 seconds for the post-
treatment group with approximately 2,000 visuals total. All students received the same audio
recordings. Research questions addressed are: (1) Are student perceptions of the effectiveness of
examples used to illustrate concepts affected by number of visual aids? (2) Is the extent to which
students feel engaged during the lectures affected by number of visual aids? (3) Are students’
perceived overall learning experiences affected by number of visual aids? Surprisingly, results
indicate that for questions #1 and #3, student ratings of those who viewed videos with fewer
visuals rated their experiences higher than students who viewed more visuals. There was no
significant difference found for question #2. Conclusion: Although some visuals have been
shown to enhance learning, too many visuals may be a deterrent to learning.
The Journal of Educators Online-JEO January 2016 ISSN 1547-500X Vol 13 Number 1 195
Keywords: video lecture, instructional video, visual aids, e-learning, student evaluations
INTRODUCTION
Educational technology, specifically in the area of visual aids, has dramatically enhanced
teaching and learning. For decades, visuals have typically included illustrations, photographs,
videotapes, slides, movies, diagrams, and animations and have been used to supplement text-
based information. These types of visuals have generally resulted in increased recall of text
information (Issing, 1990; Levie & Lentz, 1982; Pressley, 1977; Rusted & Coltheart, 1979;
Schallert, 1980; Stone & Glock, 1981; Brigman, Cherry, Reese, & Dokey, 2003; Carney &
Levin, 2002).
Educational webcasts and video lectures as a teaching tool and a form of visual aid have
become widely used with the rising prevalence of online and blended courses and with the
increase of web-based video materials. Thus, research pertaining to factors that enhance the
effectiveness of video lectures is critical. Furthermore, much of the literature regarding video
usage in higher education shows that videos have been largely used to supplement materials in
face-to-face classes or used in teacher training programs (Krammer, et.al, 2006). The
significance of this research study is based on the fact that the following factors have yet to be
explored: (1) The educational effectiveness of videos used as an autonomous method of
disseminating information as opposed to a supplemental method; (2) The impact of the number
of visual aids within a video as opposed to the type of visual aids; And 3) The effectiveness of
videos within the field of stress management.
LITERATURE REVIEW
A plethora of research indicates a variety of visual aids enhance learning in a variety of
disciplines and in a variety of ways. Kim and Gilman (2008) investigated the use of visual text,
spoken text, and graphics in a web-based self-instruction program to increase learners' English

The Journal of Educators Online-JEO January 2016 ISSN 1547-500X Vol 13 Number 1 196
vocabulary at a middle school in Seoul, South Korea. A total of 172 middle school students in
five classes participated in the study. The effects of six methods of instruction were evaluated:
visual text (Group A), visual text and added spoken text (Group B), visual text, and added
graphics (Group C), visual text, added graphics, and added spoken text (Group D), reduced
visual text and added spoken text (Group E), and reduced visual text, added graphics, and added
spoken text (Group F). Each student completed testing instruments such as a pretest, posttest,
retention test, and attitude inventory. Results revealed students in Groups C and D learned better.
In other words, learning was enhanced when students received instruction via (1) visual text and
added graphics and (2) visual text, added spoken text, and added graphics. The researchers
concluded that an effective way to improve learning of English vocabulary is to offer graphics
illustrating the meaning of the vocabulary.
In addition to language acquisition, the field of marketing may be another discipline in
which visuals enhance learning. Clarke, Flaherty,and Yankey (2006) investigated the use of
visual summaries as an instructional technique for visual learners. Visual summaries are
diagrams summarizing linkages between material and topics based on organizing information via
hierarchies and categories. The sample consisted of students enrolled in one of two concurrent
principles of marketing courses. Traditional teaching materials of a textbook, class handouts,
lectures, and PowerPoint presentations of the lectures were provided in one section to 34
students. Visual summaries to supplement topic discussions in addition to the aforementioned
teaching materials were provided in the other section, which consisted of 35 students. Both
sections had the same instructor, covered identical content, and used the same course materials
and exams. Findings reveal students in the visual summaries class performed better on all three
exams and significantly higher on the cumulative final exam, were more satisfied with their
The Journal of Educators Online-JEO January 2016 ISSN 1547-500X Vol 13 Number 1 197
professor, rated the value of the course significantly higher, and reported significantly higher
levels of subject mastery for 13 of the 16 marketing topics.
Science is another field in which visuals, specifically diagrams, have been shown to
enhance learning. Cromley, Perez, Fitzhugh, Newcombe, and Wills (2013) examined whether
students can be taught to better understand conventional representations in diagrams,
photographs, and other visual images in science textbooks. The authors developed a teacher-
delivered, workbook and discussion-based classroom instructional method called Conventions of
Diagrams (COD). The researchers trained one experienced teacher to deliver COD to 31 tenth-
grade biology students and compared gains in diagram comprehension from COD to those from
a control group of 30 students taught by the same teacher. Students in the COD group showed
statistically significantly greater growth in comprehension of literal and inferential biology
diagrams.
Both knowledge and behaviors pertaining to chemical safety practices appear to be
enhanced with the use of visual aids as well. Saleh (2011) investigated the effectiveness of
chemical safety-related visual aids to enhance learning. A total of 172 undergraduate students
enrolled in a general chemistry laboratory class participated in the study: 89 in the experimental
group and 83 in the control group. Both sets of students received the same safety materials
except students in the experimental group were also given visual aids such as safety-related
video presentations and photographs. Since visual aids were used in the experimental group, the
time spent on providing theoretical explanations was less than the time spent with students in the
control groups. A comparison of post-exam responses showed students who were provided
visual aids achieved significantly higher scores than those who were not provided visual aids.
Additionally, safe work practices in the laboratory were observed and evaluated with a standard
checklist. Students provided with visual aids were observed exercising safe work practices more
The Journal of Educators Online-JEO January 2016 ISSN 1547-500X Vol 13 Number 1 198
often than those who were not provided with visual aids. Also, although subjective in nature, the
authors observed that students in the experimental group asked more and deeper safety-related
questions than students in the control group.
Mayer, Bove, Bryman, Mars, and Tapangco (1996) examined the effects of using a
multimedia summary, which is a sequence of annotated illustrations depicting the steps in a
process, in explaining a scientific process. In a series of three experiments, students who read a
summary containing a sequence of short captions with simple illustrations depicting the main
steps in the process of lightning recalled these steps and solved transfer problems as well as or
better than students who received the full text along with the summary or the full text alone. In
Experiment 2, taking away the illustrations or the captions eliminated the effectiveness of the
summary. In Experiment 3, adding text to the summary actually reduced its effectiveness. These
results suggest a verbal summary is not as effective as a multimedia summary combining both
visual and verbal formats and that a multimedia summary is more effective when it contains a
small amount of text rather than a large amount.
So visual aids in general have been shown to enhance learning in a variety of disciplines.
Assessing types of visuals, however, may be significant in determining quality of learning.
Dwyer (2015) explored the effectiveness of three types of visual illustrations used to
complement oral tutoring in an English class. A total of 108 students were randomly assigned to
one of four groups. Students in Group 1 (n=30) received oral symbols throughout the entire
presentation from a tape recorder with no visual illustrations. Students in Groups II (n=27), III
(n=26), and IV (n=25) received the same oral instructions as students in Group I. However,
Group II received abstract linear visual illustrations depicting form and relative locations of parts
of the heart, Group III viewed detailed drawings representing parts of the heart, and Group IV
viewed realistic photographs of the part of the heart being descripted orally. Their achievement
The Journal of Educators Online-JEO January 2016 ISSN 1547-500X Vol 13 Number 1 199
was evaluated in terms of total criterion test scores and in terms of four individual criterion tests
designed to measure specific educational objectives. Results indicate all visual illustrations are
not equally effective. Surprisingly, the abstract linear presentation proved to be the most
effective medium used in complementing oral instruction with the shaded drawing presentation
being second. Nevertheless, students who received visual illustrations performed better than
those who did not receive any visual illustrations.
In addition to still images, animated clips may enhance learning and understanding.
Specifically animated clips may help increase and maintain students’ attention and motivation
(Gurvitch & Lund, 2014). Similarly, videos have become increasingly popular and have been
shown to enhance learning. Video is a rich and powerful medium especially in e-learning
because information can be presented in an attractive and appealing manner. Studies have
investigated the effect of instructional video on learning outcomes.
Lents and Cifuentes (2009) examined web-based lecture delivery into a majors-level
introductory biology course. Prerecorded Voice-Over PowerPoint video lectures were introduced
on a limited basis to an experimental section while a control group, with the same instructor,
received standard in-class lectures. Select lectures were delivered to the experimental section via
videos, replacing in-class attendance of live lectures. A detailed analysis revealed the video
lectures prepared students for exams as effectively as live in-class lectures. This finding indicates
students can learn complicated biology course material through prerecorded, web-delivered
lectures much as they do through in-class attendance of those same lectures. The researchers
suggest that although further careful study is needed, these results warrant further
experimentation in web-based teaching methods in the sciences. Additionally, Hahn (2012)
demonstrated that an information literacy course was enhanced through the use of video lectures
The Journal of Educators Online-JEO January 2016 ISSN 1547-500X Vol 13 Number 1 200
to deliver course content. Students’ feedback indicated a majority of them used the video
lectures, at least partly, and found them helpful.
He, Swenson, and Lents (2012) examined the incorporation of video tutorials as a
supplement to learning in an undergraduate analytical chemistry course. The concepts and
problems in which students faced were first identified by assessing students' homework
assignments and exam responses. Then, a tutorial video clip aimed at that specific knowledge
point was uploaded to the course Web site portal. To assess the effectiveness of the tutorials,
students' oral and written feedback, pre- and post-video-tutoring exam performance, and data
from previous classes taught by the same instructor were examined. Results indicate online video
tutorials are a valuable, flexible, and cost-effective tool to improve student mastery of chemistry
problem solving.
Wieling and Hofman (2010) examined the extent to which a blended learning
configuration of face-to-face lectures, online on-demand video recordings of the face-to-face
lectures and the offering of online quizzes with appropriate feedback have a positive impact on
student performance compared to the traditional face-to-face course approach. A total of 474
students (161 men and 313 women) enrolled in a European Law course participated. Results
indicate the number of online lectures they viewed, along with several other factors such as grade
point average, was a significant predictor of students’ final grade in the course. Students who
attended few lectures had more benefit from viewing online lectures than students who attended
many lectures. The researchers suggest offering recordings of face-to-face lectures is an easy
extension of a traditional course and is of practical importance because it enables students who
are often absent from the regular face-to-face lectures to be able to improve their course grade by
viewing the lectures online.
The Journal of Educators Online-JEO January 2016 ISSN 1547-500X Vol 13 Number 1 201
Merkt, Weigand, Heier, and Schwan (2011) compared the usage patterns and the
effectiveness of interactive videos and illustrated textbooks when German secondary school
students learned complex content. For this purpose, two videos affording different degrees of
interactivity and a content-equivalent illustrated textbook were used. Two complementary
studies, one in the laboratory and one in the field, were conducted. Results of both studies
showed in contrast to previous studies working with non-interactive videos, the effectiveness of
interactive videos was at least comparable to print, probably due to the possibilities provided for
self-regulated information processing. The interactive features of the videos were used
spontaneously. However, features enabling micro-level activities, such as stopping the video or
browsing, seemed to be more beneficial for learning than features enabling macro-level
activities, such as referring to a table of contents or an index. So type of visual, such as an
interactive video and the type of interaction of the video may determine its effectiveness in terms
of learning outcomes.
Zhang, Zhou, Briggs, and Nunamaker (2006) also examined the influence of interactive
video on learning outcome and learner satisfaction in e-learning environments. Four different
settings were examined: three were with interactive video, one with non-interactive video, and
one without video all within an e-learning environment. The fourth was the traditional classroom
environment. Results showed the value of video for learning effectiveness was contingent upon
the provision of interactivity. Students in the e-learning environment that provided interactive
video achieved significantly better learning performance and a higher level of learner satisfaction
than those in other settings. The findings suggest it may be important to integrate interactive
instructional video into an e-learning environment.
So video lectures appear to enhance learning in many cases. However, results are
somewhat mixed. Jordan and Sanchez (1994) examined whether the use of short video clips in

The Journal of Educators Online-JEO January 2016 ISSN 1547-500X Vol 13 Number 1 202
the classroom enhanced students' ability to learn and retain basic concepts in an introductory
American government course. A total of 117 freshmen undergraduate students were placed into
either a treatment or video section or a traditional or control section. In the video sections, many
of the concepts in the course were presented through video clips. In the traditional sections,
traditional methods of classroom instruction were used, specifically lectures and discussions.
Results revealed students in the video sections on average scored 9.3 percentage points higher on
the first exam than the students in the traditional sections with a significance level of 99.8%.
However, no significant differences were found on the second exam and final exam. Also, no
significant differences were found among the groups on graded written work. The researchers
conclude video augmentation may not be helpful in enhancing student understanding in this case.
Webcasting, in which live or recorded videos are used, refers to streaming audio or video
broadcasts over the Internet and has been shown to be an effective educational tool. Traphagan,
Kucsera, and Kishi (2010) investigated the impact of lecture webcasts on students’ attendance
and learning. One section had access to webcasts and one section did not. Results indicate the
availability of webcasts negatively impacted student attendance but webcast access appeared to
nullify the negative effects absenteeism had on student performance. And more webcast viewing
was associated with higher performance for performance measures based on lecture content.
Also, most students in the webcast section reported positive learning experiences from using
webcasts.
However, results pertaining to the effectiveness of webcasts are somewhat mixed.
Giannakos and Vlamos (2013) compared traditional learning with educational webcasts. A total
of 66 middle school students were placed in two groups based on a pretest. Results showed the
effectiveness of the webcasts appeared to be particularly high when applied to tasks requiring
simple comprehension. Conversely, the effectiveness of the webcast appeared to be poor in the
The Journal of Educators Online-JEO January 2016 ISSN 1547-500X Vol 13 Number 1 203
consolidation of complex tasks. In simple comprehension tasks, webcasts seem to have much
better performance compared with traditional learning. In tasks where a greater degree of
comprehension is required, webcast and traditional learning seem to have the same performance.
With complex tasks requiring additional comprehension and a great degree of consolidation,
webcasts had very low performance and few of the students coped with the complex task. In
other words, knowledge that has to be comprehended and consolidated and used in combination
with other knowledge for solving complex tasks, webcasts may not be recommended because its
performance in this area appears to be very poor. So similar to still images and animated clips,
the effectiveness of webcasts may also be determined in part on the type of material and type of
learning objectives.
Similar to webcasts, podcasts appear to be an effective teaching tool. Unlike webcasts,
podcasts do not involve live streaming of media. So a podcast is a non-streaming webcast that
has taken the name of Podcast because of the popularity of the iPod. Podcasting involves
downloading a series of audio or video broadcasts onto a digital media player, which then can
then be watched or listened to when, where and as often as students choose. Regardless of
podcast or webcast format, videos are typically used. Schreiber, Fukuta, and Gordon (2010)
examined undergraduates’ experiences, information recall, and preference for video lectures
versus face-to-face live lectures. Results indicate traditional teaching methods are still the
preferred method of learning, however the video lectures provide convenience to review at their
leisure and to be able to stop and review as needed. The researchers indicated video lectures do
have value in learning, however they feel video learning or podcasts are less engaging than face-
to-face lectures. Thus, the question arises as to potential factors, such as number of visual aids,
that increase student engagement with video lectures.
The Journal of Educators Online-JEO January 2016 ISSN 1547-500X Vol 13 Number 1 204
Evans (2007) evaluated the effectiveness of podcasting as well. A separate group of just
under 200 first-level students were given a series of revision podcasts after completing a course
in Information and Communications Technology. As part of the subscription process, they were
required to complete an online survey about their experience. The survey utilized a five-point
Likert scale comparing their attitudes to lectures, podcasts, notes, textbooks and multimedia e-
learning systems. Results indicate students believe podcasts are more effective revision tools
than their textbooks and they are more efficient than their own notes in helping them to learn.
They also indicated they are more receptive to the learning material in the form of a podcast than
a traditional lecture or textbook. The study suggests the use of podcasts as a revision tool has
clear benefits as perceived by undergraduate students in terms of the time they take to revise and
how much they feel they can learn. The researcher suggests that coupled with the advantages of
flexibility in when, where and how it is used, podcasting appears to have significant potential as
an innovative learning tool.
Conversely, Dupagne, Millette, and Grinfeder (2009) examined whether the use of video
podcasts as a revision tool would improve test scores of undergraduate students enrolled in an
introductory communication theory course. Twelve podcasts were created from videos presented
in class and made available online to students for optional viewing prior to completion of three
tests. Results indicated students who viewed the podcasts did not score higher on the test
questions related to the videos than their non-viewing classmates. So the results regarding
podcasting, which again involves students watching videos, are mixed.
A growing amount of evidence of the impact of visuals aids, including videos, webcasts,
and podcasts as evidenced by the aforementioned studies, indicates a variety of visuals are
generally effective and enhance learning and student satisfaction. Relative to current literature,
the importance of this study is: (1) Despite much of the research indicating that visuals are
The Journal of Educators Online-JEO January 2016 ISSN 1547-500X Vol 13 Number 1 205
effective, the results are mixed. Additional research is needed in order to shed light on possible
reasons for these mixed results. Disciplines, learning objectives, number of visuals, and types of
visuals may influence the effectiveness of visual aids as a teaching tool. (2) Research regarding
function and effectiveness of visual aids within the unique field of stress management is
currently non-existent. (3) Much of the literature involves assessing impact of visuals on
academic performance (grades, scores, total points, etc.). In a stress management course,
students’ psychosomatic ability to achieve a relaxed state may be considered to be just as
important, if not more important than scores on traditional cognitive measures such as exams. In
other words, learning to affect physiology is very different than learning typical cognitive tasks.
Research is needed in order to better understand the influence of visuals on this type of learning.
(4) Additional research is needed to document the effect of videos as an autonomous primary
source of instruction, as opposed to a supplemental source. The primary purpose of this study
was to compare student evaluations before and after embedding visuals throughout video lectures
in a fully online course.
METHODS
Research Questions
This study was designed to answer the following research questions: (1) Are student
perceptions of the effectiveness of examples used to illustrate concepts affected by number of
visual aids? (2) Is the extent to which students feel engaged during the lectures affected by
number of visual aids? (3) Are students’ overall learning experiences affected by number of
visual aids?
Participants
Participants included undergraduate students enrolled in an online, upper division stress
management course. This course fulfills a general education requirement at a large, public west

The Journal of Educators Online-JEO January 2016 ISSN 1547-500X Vol 13 Number 1 206
coast university in the United States. The university is on a quarter system, which involves 10
weeks of instruction and one week during which final exams are given. Students from all majors
across campus typically enroll in this course. No demographic information was available
because the data consisted of responses from student evaluations, which do not include questions
pertaining to demographic information. The total number of students who were invited to
complete the survey for the pre-treatment group was 1,260 and the total number for the post
treatment group was 1,125. However, as is often the case with online courses, the response rate
for completing student evaluations is relatively low. The participant sample for the pre-condition
group consisted of 257 students who were enrolled during Fall, Winter, or Spring quarters of the
2013/14 academic year, and the participant sample for the post-condition group was 404
enrolled during Fall, Winter, and Spring of 2014/15 academic year.
Procedure
This study compared pre and post outcome data obtained from student evaluations. The
pre-group consisted of students enrolled in one of 20 online sections of Stress Management for
Healthy Living during the academic year 2013-14, and the post-group consisted of students
enrolled in the same course during the following academic year 2014-15. Students in both the pre
and post-treatment groups listened to 27 audio/visual recordings of lectures and 20 audio
recordings of relaxation techniques throughout the quarter. All students received the same audio
for both the lectures and relaxation techniques. The format of the lectures for both groups
consisted of (1) an introductory quote, an anticipatory set or “attention-getter” (i.e. question,
cartoon strip, images, etc.), and key points at the end of the lecture or a synopsis of the material
covered in that particular lecture. Students in both groups completed the same assignments. The
only difference between the groups was the number of slides and images in the video lectures.
Students in the pre-group were provided with just over 600 slides (611), and students in the post

The Journal of Educators Online-JEO January 2016 ISSN 1547-500X Vol 13 Number 1 207
group were provided with just under 2,000 slides (1,993). Transitions occurred roughly every 40
seconds for the pre-treatment group and roughly every 10 seconds for the post-treatment group.
Instrumentation
At the end of each quarter, data was collected via an online survey consisting of items on the
student evaluation form used by the department in which the course was offered. Approval from
the campus Institutional Research Board (IRB) committee was unnecessary because the data was
comprised of responses from the university approved instructional assessment form (i.e. student
evaluation form), which are completely anonymous and are collected and tabulated by the
university, not the instructors. The items on the student evaluation form are approved at the
department, college, and university levels and include a 1 to 5 Likert rating (1=Very Good;
2=Good; 3=Satisfactory; 4=Poor; 5=Very Poor). The following items are included on the student
evaluation form:
1. Rate the effectiveness of the examples used to illustrate points provided in the lectures.
2. Rate how clear the course requirements were communicated.
3. Rate how well the instructor kept you engaged during the lectures.
4. Rate how helpful instructor feedback was on assignments, quizzes, or exams.
5. Rate your overall learning experience from this course.
It was anticipated the items that would be affected by visual aids were #1: Rate the effectiveness
of examples used to illustrate points, #3: How well did the instructor keep you engaged during
the lectures, and #5: Rate your overall learning experience.
Data Analysis
In order to test the research questions, a comparison of differences in pre and post ratings
was mainly done with Chi Square test. In addition, as the categories of the variable have a clear
The Journal of Educators Online-JEO January 2016 ISSN 1547-500X Vol 13 Number 1 208
ordering, M-Square test was examined along with Chi-Square test. For ordinal categorical
variables, M-square test assigns proportional weights to each category. In our analysis, the
weights of 3, 2 and 1 were assigned to (Very Good and Good). Satisfactory, and Poor and Very
Poor, respectively.
RESULTS
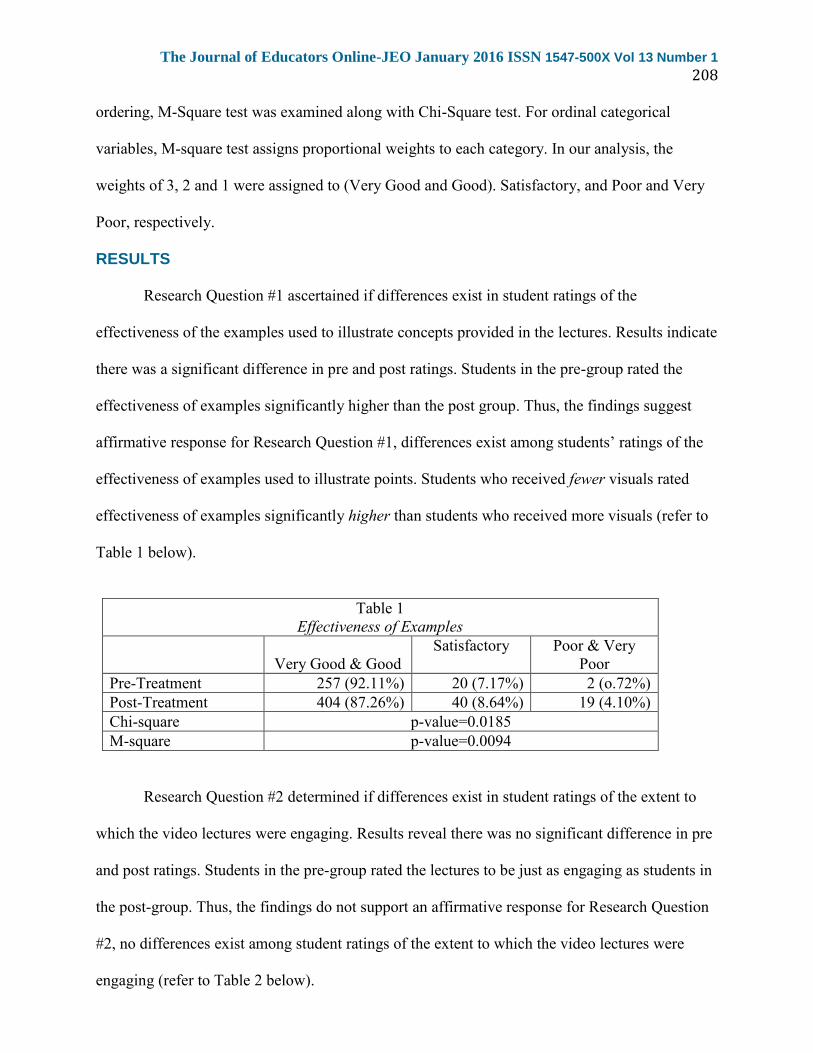
Research Question #1 ascertained if differences exist in student ratings of the
effectiveness of the examples used to illustrate concepts provided in the lectures. Results indicate
there was a significant difference in pre and post ratings. Students in the pre-group rated the
effectiveness of examples significantly higher than the post group. Thus, the findings suggest
affirmative response for Research Question #1, differences exist among students’ ratings of the
effectiveness of examples used to illustrate points. Students who received fewer visuals rated
effectiveness of examples significantly higher than students who received more visuals (refer to
Table 1 below).
Table 1
Effectiveness of Examples
Very Good & Good
Satisfactory
Poor & Very
Poor
Pre-Treatment 257 (92.11%) 20 (7.17%) 2 (o.72%)
Post-Treatment 404 (87.26%) 40 (8.64%) 19 (4.10%)
Chi-square p-value=0.0185
M-square p-value=0.0094
Research Question #2 determined if differences exist in student ratings of the extent to
which the video lectures were engaging. Results reveal there was no significant difference in pre
and post ratings. Students in the pre-group rated the lectures to be just as engaging as students in
the post-group. Thus, the findings do not support an affirmative response for Research Question
#2, no differences exist among student ratings of the extent to which the video lectures were
engaging (refer to Table 2 below).
The Journal of Educators Online-JEO January 2016 ISSN 1547-500X Vol 13 Number 1 209
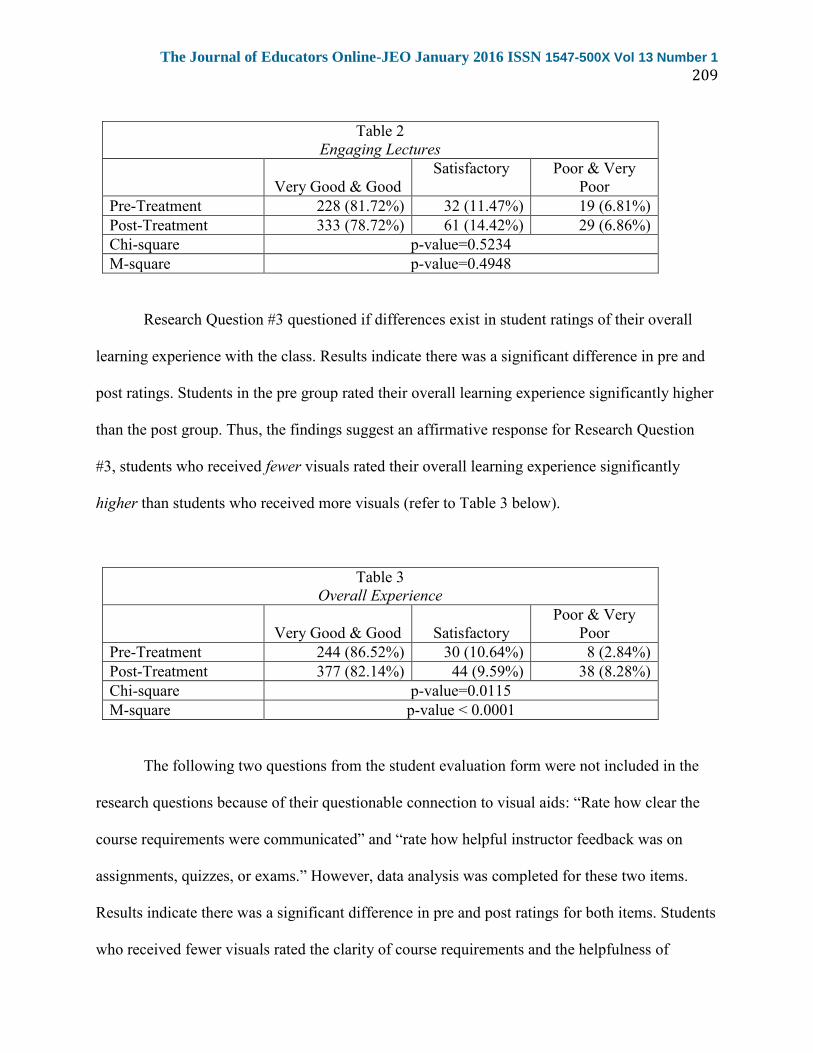
Table 2
Engaging Lectures
Very Good & Good
Satisfactory
Poor & Very
Poor
Pre-Treatment 228 (81.72%) 32 (11.47%) 19 (6.81%)
Post-Treatment 333 (78.72%) 61 (14.42%) 29 (6.86%)
Chi-square p-value=0.5234
M-square p-value=0.4948
Research Question #3 questioned if differences exist in student ratings of their overall
learning experience with the class. Results indicate there was a significant difference in pre and
post ratings. Students in the pre group rated their overall learning experience significantly higher
than the post group. Thus, the findings suggest an affirmative response for Research Question
#3, students who received fewer visuals rated their overall learning experience significantly
higher than students who received more visuals (refer to Table 3 below).
Table 3
Overall Experience
Very Good & Good Satisfactory
Poor & Very
Poor
Pre-Treatment 244 (86.52%) 30 (10.64%) 8 (2.84%)
Post-Treatment 377 (82.14%) 44 (9.59%) 38 (8.28%)
Chi-square p-value=0.0115
M-square p-value < 0.0001
The following two questions from the student evaluation form were not included in the
research questions because of their questionable connection to visual aids: “Rate how clear the
course requirements were communicated” and “rate how helpful instructor feedback was on
assignments, quizzes, or exams.” However, data analysis was completed for these two items.
Results indicate there was a significant difference in pre and post ratings for both items. Students
who received fewer visuals rated the clarity of course requirements and the helpfulness of

The Journal of Educators Online-JEO January 2016 ISSN 1547-500X Vol 13 Number 1 210
instructor feedback significantly higher than students who received more visuals (refer to Tables
4 and 5 below).
Table 4
Clear Course Requirements
Very Good & Good
Satisfactory
Poor & Very
Poor
Pre-Treatment 266 (94.33%) 12 (4.26%) 4 (1.42%)
Post-Treatment 363 (80.31%) 54 (11.95%) 35 (7.74%)
Chi-square p-value < 0.0001
M-square p-value < 0.0001
Table 5
Instructor Feedback
Very Good & Good
Satisfactory
Poor & Very
Poor
Pre-Treatment 231 (82.21%) 35 (12.46%) 15 (5.34%)
Post-Treatment 320 (72.56%) 74 (18.78%) 47 (10.66%)
Chi-square p-value=0.0072
M-square p-value=0.0017
DISCUSSION
It was anticipated that students who viewed videos with more visuals would provide
higher ratings on the three items pertaining to the research questions compared to students who
viewed videos with fewer visuals. The researchers are perplexed that the significant difference
found on two of the three items indicate the opposite – students who viewed fewer visuals rated
their experiences higher than those who viewed more visuals. In other words, a higher number of
visuals appeared to negatively affect students’ perceptions of the effectiveness of examples used
to illustrate points as well as their perceptions of their overall learning experience.
Of the three items, the one the researchers anticipated would definitely be positively
correlated with number of visuals pertained to the extent to which the videos were engaging.
However, no significant difference was found. In other words, number of visuals did not affect

The Journal of Educators Online-JEO January 2016 ISSN 1547-500X Vol 13 Number 1 211
students’ perceptions as to the extent to which the videos were engaging. These results point to
the notion there may be “too much of a good thing” in this case.
It should be noted that results of this study are consistent with results of research
conducted by Cronin and Myers (1997) who investigated the pedagogical effects of visuals
versus no visuals in interactive multimedia instruction (IMI). Two versions of an IMI program
were presented to 140 students randomly assigned to two treatment groups. Results indicated no
significant difference on cognitive test scores or listening test gain scores for students using IMI
with visuals versus IMI with no visuals. These findings, as well as the findings of the current
study, suggest further investigation is necessary in order to shed light on why visuals are
effective in some cases but may not be effective in other situations.
Regarding the two questions on the student evaluation pertaining to how clear the course
requirements were communicated and helpfulness of instructor feedback, it was anticipated there
would be no significant difference among the two groups because these items don’t pertain to the
video lectures. As such, they were not included in the official research questions. It is unclear as
to why students who received fewer visuals rated the clarity of course requirements and the
helpfulness of instructor feedback significantly higher than students who received more visuals.
However, that these two items were also found to be significant is indicative that students
enrolled in one particular quarter (Winter 2014) may have been disgruntled because of a
significant event that occurred which may have affected students’ overall experience with the
course.
A significant percentage of students enrolled during this quarter failed to submit an
important assignment by the deadline. This assignment comprised half the total points in the
course. Students were allowed to submit this assignment up to three days after the due date.
Points were deducted for every 24-hour period that they submitted late. Those who missed the
The Journal of Educators Online-JEO January 2016 ISSN 1547-500X Vol 13 Number 1 212
deadline failed the course or received a poor grade (e.g. D-). Only one or two students each
quarter at most typically fail to submit their assignment by the end of the grace period. One
possible explanation for the dramatic increase in this number is the reminder message posted on
Blackboard did not get emailed to the students. So students would have had to log into
Blackboard in order to see the reminder message. During the other quarters, the appropriate box
was checked, which enabled the announcements to be emailed. Students who failed to submit
their assignments were disgruntled, which may have affected their responses on the student
evaluation form. Additional analysis after removing this particular quarter would shed light on
this issue.
Another possible reason that might explain the results is a limitation with the study
design. Because student evaluations were used, it was necessary to use two different groups of
students for the pre and post conditions. One group of students was used for the pre condition
and a different group was used for the post condition. So students exposed to videos containing
fewer visuals were never exposed to the video with more visuals and vice versa. If the study
were repeated, results may be different if the same cohort of students were used for both the pre
and post conditions. That is, results may be different if the same group of students viewed videos
with few visuals for the first half of the quarter and then videos with more visuals the second half
of the quarter. Using the same sample for pre and post groups is recommended should this study
be repeated. Exposing the same group of students to both types of videos (one with few visuals
and one with several visuals) would most likely elicit more accurate responses depicting a better
comparison.
This study examined the impact of number of visuals in video lectures on student
learning. Further research is needed in order to determine if type of visual (e.g. animations, still
images, charts, graphs, images of people, etc.) is a stronger determining factor of student
The Journal of Educators Online-JEO January 2016 ISSN 1547-500X Vol 13 Number 1 213
learning and student preference in comparison to number of visuals. For example, are animations
better than still pictures in terms of enhancing learning?
Similarly, additional research may help shed light on whether particular visuals are more
effective for particular learning outcomes. For example, animations may be more beneficial for
depicting a scientific sequence or process whereas still images may be more powerful at touching
on the affective domain of learning or altering feelings and emotions in a psychology class. For
example, is learning and preference affected by the type of content or the type of class such as
hard sciences (e.g. physics) versus social sciences (e.g. psychology)?
This study examined video lectures used as the primary source of information
dissemination, rather than a secondary or supplemental source. The vast majority of literature
pertains to the effectiveness and impact of videos used largely to supplement face-to-face
classes. Visuals in supplemental videos, where students have the opportunity to hear the same
lesson again, might have a different effect on students’ perceptions of their effectiveness in
comparison to students in a fully online course who receive all information via videos.
Visuals are clearly important in the learning process in many cases. However, little
research exists documenting the consequences of including too many visuals. Additional
research should examine a potential rate of diminishing return. In other words, can too many
visuals, just as too few visuals, impede learning? Is there an optimal number of visuals that
enhance learning? And, similar to type of visual, does this optimal number of visuals depend on
the subject matter?
Because ratings on student evaluations were used, demographic information could not be
ascertained. Demographic information is not included on student evaluations at this particular
institution. It is recommended future research use a survey in which demographic data can be
The Journal of Educators Online-JEO January 2016 ISSN 1547-500X Vol 13 Number 1 214
collected and analyzed. Assessing age, gender, and ethnicity with regards to preference for and
impact of visuals may be helpful for instructional designers and faculty.
CONCLUSION
The results of this study suggest that too many visuals may negatively affect learning.
However, it is suspected that ratings may have been skewed by disgruntled students during one
particular quarter. Because two items on the student evaluation form were thought to be
unrelated to visuals but were found be affected, further investigation is necessary. Regardless,
use of visuals within video lectures, whether posted online or used as a webcast or podcast, is
becoming more prevalent in higher education and warrants further research. Based on this
research, faculty may want to hold off on spending an excessive amount of time embedding
additional visuals into video lectures.
The Journal of Educators Online-JEO January 2016 ISSN 1547-500X Vol 13 Number 1 215
REFERENCES
Brigman, S., Cherry, K. , Reese, C., & Dokey, D. (2003). Pictorial illustrations enhance
memory for sentences in younger and older adults. Experimental Aging Research, 29(3),
353-370.
Carney, R., & Levin, J. (2002). Pictorial illustrations still improve students' learning from
text. Educational Psychology Review, 14(1), 5-26.
Clarke, I., Flaherty, T., & Yankey, M. (2006). Teaching the visual learner: The use of visual
summaries in marketing education. Journal of Marketing Education, 28(3), 218-226.
Cronin, M. & Myers, S. (1997). The effects of visuals versus no visuals on learning outcomes
from interactive multimedia instruction. Journal of Computing in Higher Education, 8(2),
46-71.
Cromley, J.G., Perez, T.C., Fitzhugh, S.L., Newcombe, N.S., Wills, T.W., and Tanaka, J.C.
(2013). Improving students diagram comprehension with classroom instruction. The
Journal of Experimental Education, 8(4), 511-537.
Dupagne, M. , Millette, D. , & Grinfeder, K. (2009). Effectiveness of video podcast use as a
revision tool. Journalism & Mass Communication Educator, 64(1), 54-70.
Dwyer, F.M. (2015) The effectiveness of selected visual illustrations in teaching science
concepts to college freshman. The Journal of Educational Research, 61(8), 343-347.
Evans, C. (2007). The effectiveness of M-Learning in the form of podcast revision lectures in
higher education. Computers & Education, (50)2, 491-498.
Giannakos, M. , & Vlamos, P. (2013). Using webcasts in education: Evaluation of its
effectiveness. British Journal of Educational Technology, 44(3), 432-441.
Gurvich, R. and Lund, J. (2014). Animated video clips: Learning in the current generation.
Journal of Physical Education, Recreation, and Dance, 85(5), 8-17.
The Journal of Educators Online-JEO January 2016 ISSN 1547-500X Vol 13 Number 1 216
Hahn, E. (2012). Video lectures help enhance online information literacy course. Reference
Services Review, 40(1), 49-60.
He, Y., Swenson, S., & Lents, N. (2012). Online video tutorials increase learning of difficult
concepts in an undergraduate analytical chemistry course. Journal of Chemical
Education, 89(9), 1128-1132.
Issing, L. (1990). Learning from pictorial analogies. European Journal of Psychology of
Education, 5(4), 489-499.
Jordan, D.L. & Sanchez, P. Traditional versus technology-aided instruction: The effects of
visual stimulus in the classroom. PS: Political Science and Politics, 27(1), 64-67.
Kim, D., & Gilman, D. (2008). Effects of text, audio, and graphic aids in multimedia
instruction for vocabulary learning. Educational Technology & Society, 11(3), 114-126.
Krammer, K., Ratzka, N., Klieme, E., Lipowsky, F., Pauli, C. & Reusser, K. (2006).
Learning with classroom videos: Conception and first results of an online teacher-training
program. ZDM, 38(5), 422-432.
Lents, N. and Cifuentes, O. (2009). Web-based learning: Video lectures through voice-over
Power Point in a majors level biology course. Journal of College Science Teaching,
39(2), 38-47.
Levie, W., & Lentz, R. (1982). Effects of text illustration: A review of research.
Communication and Technology Journal, 30, 195–232.
Mayer, R., Bove, W., Bryman, A., Mars, R., & Tapangco, L. (1996). When less is more:
Meaningful learning from visual and verbal summaries of science textbook lessons.
Journal of Educational Psychology, 88(1), 64-73.
Merkt, M., Weigand, S., Heier, A., & Schwan, S. (2011). Learning with videos vs. learning
with print: The role of interactive features. Learning and Instruction, 21(6), 687-704.

The Journal of Educators Online-JEO January 2016 ISSN 1547-500X Vol 13 Number 1 217
Pressley, M. (1977). Imagery and children’s learning: Putting the pictures in developmental
perspective. Review of Educational Research, 47, 585–622.
Rusted, J., & Coltheart, V. (1979). The effect of pictures on the retention of novel words and
prose passages. Journal of Experimental Child Psychology, 28, 516–524.
Saleh, T.A. (2011). Testing the effectiveness of visual aids in chemical safety training.
Journal of Chemical Health and Safety, 18(2), 3-8.
Schreiber, B., Fukuta, J., & Gordon, F. (2010). Live lecture versus video podcast in
undergraduate medical education: A randomised controlled trial. Bmc Medical
Education, 10, 68-73.
Stone, D., & Glock, M. (1981). How do young adults read directions with and without
pictures? Journal of Educational Psychology, 73(3), 419–426.
Traphagan, T., Kucsera, J., & Kishi, K. (2010). Impact of class lecture webcasting on
attendance and learning. Educational Technology Research and Development, 58(1), 19-
37.
Wieling, M.B., Hofman, W.H.A. (2010). The impact of online video lecture recordings and
automated feedback on student performance. Computers and Education, 54, 992-998.
Zhang, D., Zhou, L., Briggs, R., & Nunamaker, J. (2006). Instructional video in e-learning:
Assessing the impact of interactive video on learning effectiveness. Information &
Management, 43(1), 15-27.