(4) Your Facebook Tricolor Profile Picture Doesnt Support Digital India; Heres the Ugly Truth
Forschungsinstitut zur Zukunft der ArbeitInstitute for the Study of Labor
DI
SC
US
SI
ON
P
AP
ER
S
ER
IE
S
Do They Find You on Facebook?Facebook Profile Picture and Hiring Chances
IZA DP No. 9584
December 2015
Stijn Baert
Do They Find You on Facebook?
Facebook Profile Picture and Hiring Chances
Stijn Baert Ghent University, University of Antwerp,
Université catholique de Louvain and IZA
Discussion Paper No. 9584 December 2015
IZA
P.O. Box 7240 53072 Bonn
Germany
Phone: +49-228-3894-0 Fax: +49-228-3894-180
E-mail: [email protected]
Any opinions expressed here are those of the author(s) and not those of IZA. Research published in this series may include views on policy, but the institute itself takes no institutional policy positions. The IZA research network is committed to the IZA Guiding Principles of Research Integrity. The Institute for the Study of Labor (IZA) in Bonn is a local and virtual international research center and a place of communication between science, politics and business. IZA is an independent nonprofit organization supported by Deutsche Post Foundation. The center is associated with the University of Bonn and offers a stimulating research environment through its international network, workshops and conferences, data service, project support, research visits and doctoral program. IZA engages in (i) original and internationally competitive research in all fields of labor economics, (ii) development of policy concepts, and (iii) dissemination of research results and concepts to the interested public. IZA Discussion Papers often represent preliminary work and are circulated to encourage discussion. Citation of such a paper should account for its provisional character. A revised version may be available directly from the author.
IZA Discussion Paper No. 9584 December 2015
ABSTRACT
Do They Find You on Facebook? Facebook Profile Picture and Hiring Chances*
We investigate whether the publicly available information on Facebook about job applicants affects employers’ hiring decisions. To this end, we conduct a field experiment in which fictitious job applications are sent to real job openings in Belgium. The only characteristic in which these candidates differ is the unique Facebook profile that can be found online with their name. Candidates with the most beneficial Facebook picture obtain approximately 39% more job interview invitations compared to candidates with the least beneficial picture. In addition, we find suggestive evidence for a higher effect of Facebook profile picture appearance on hiring chances when candidates are highly educated and when recruiters are female. JEL Classification: C93, D83, J24, J79, L86 Keywords: hiring, screening, Facebook, Internet, personality, attractiveness Corresponding author: Stijn Baert Ghent University Sint-Pietersplein 6 9000 Gent Belgium E-mail: [email protected]
* We are grateful to Bart Cockx for his comments that helped us to improve this study substantially; to Lynn Decuypere, Lisa Glorieux, Stefanie Notebaert, Anke Penninck and Willem Van Melkebeke for their research assistance; and to the participants of the annual conference of the European Society for Population Economics in 2013 and the World Conference of the Society of Labor Economists and the European Association of Labour Economists in 2015 for their constructive suggestions. The present research was approved by the Ethical Committee of the Faculty of Economics and Business Administration of Ghent University.
2
1 Introduction
A recent theme in the popular media has been that employers increasingly employ
personal information available on social networking websites (SNWs) such as
Facebook, LinkedIn and Twitter to make hiring decisions.1 Furthermore,
contributions to the academic psychological literature show that this supposed use
of SNWs by employers is, to some extent, rational. First, Kluemper and Rosen
(2009) find that recruiters can reliably and accurately determine productivity‐
related traits solely on the basis of one’s personal information available on SNWs.
Moreover, this information can be gained with little time and effort. Second, Back
et al. (2010), Gosling et al. (2008) and Kramer and Winter (2008) show that
appearance on SNWs reflects individuals’ actual personality traits and not their
self‐idealisation. Consistent with this empirical finding, Roulin and Bangerter (2013)
describe the information on the SNWs profiles of job candidates as “honest
signals” of their ability and commitment.
Given the popular belief that SNWs are consulted for hiring decisions and the
academic finding that this consultation could be rational, it is surprising that within
peer‐reviewed literature, the question of to what extent the information publicly
available on SNWs does affect hiring decisions has received only little attention.
The only academic study works we are aware of are six studies on self‐reported use
of SNWs by recruiters.2 These six studies are summarised in Table 1. Depending on
the moment when and the country and sector where the survey is conducted,
between 8.1% (use of Facebook in Greece in 2009–2010) and 50.0% (use of any
SNWs in the United States in 2010) of the examined recruiters indicate that they
employ SNWs when screening job candidates. In addition, while Gibbs et al. (2015)
find that employers perceive SNWs as more useful in recruiting lower‐level
1 See, e.g., Broughton et al. (2013), CareerBuilder (2012), Clark (2006), Du (2007), Kravets (2013), Levinson
(2010), Preston (2011), Shea and Wesley (2006), Stone (2006), SHRM (2011) and Zeidner (2007).
2 Besides this literature, the effect of social networking appearance on hiring chances has also been tested by
means of laboratory experiments (Bohnert and Ross, 2010; Roulin and Bangerter, 2013). However, these
experiments do not allow one to measure the extent to which SNWs are used in practice when evaluating job
candidates. A broader study on using online information about individuals in personnel selection is Berkelaar et al.
(2015).
3
employees than for higher‐level employees, Madera and Chang (2011) report the
opposite.
<Table 1 about here.>
The aforementioned literature based on self‐reported information from
employers suffers, in our opinion, from three methodological problems. First,
employers’ reported attitudes might not represent their actual hiring behaviour
(Pager and Quillian, 2005). They might adapt their answers to their perception of
whether the use of SNWs in the recruitment process is socially desirable. Second,
even if the measures of SNWs use by employers based on self‐reported
information square actual behaviour, these measures would still not reveal the
extent to which the information on SNWs affects hiring decisions. On the one
hand, the information found by recruiters on SNWs might in many cases not yield
explicit job‐related information beyond the information found in candidates’
written applications (Brown and Vaughn, 2011). On the other hand, recruiters may
just use SNWs to confirm the hiring decision that they in fact already made
(Elzweig and Peeples, 2009). Third, the analysis of self‐reported information on the
use of SNWs in screening job candidates is hampered by the variability in available
information on candidates’ profile pages due to variation in the extent to which
these candidates are active on SNWs and their (customisable) privacy settings
(Brown and Vaughn, 2011). This variability, which cannot be controlled based on
employer self‐reports, might be correlated with other determinants of
employment opportunities (e.g., the gender, education level, region, sector and
personality of the candidate). Not taking into account this variability in available
information might, therefore, bias measures of how appearance on SNWs does
affect hiring chances for different subpopulations.
To the best of our knowledge, our study is the first to directly investigate
whether the information publicly available on SNWs affects hiring decisions. More
concretely, we measure the extent to which job candidates’ Facebook profile
picture appearance affects their hiring chances.3 To this end, we conduct a
3 For a definition and description of Social Networking Sites in general and Facebook in particular, we refer to
4
randomised experiment in Belgium. We construct two template resumes and cover
letters, equal in all job‐relevant characteristics, for school graduates holding either
the same secondary or tertiary education degree. These pairs of applications are
sent to 1,056 genuine job openings. To each of both applications, we randomly
assign one out of four facial pictures with diverging scores on perceived
attractiveness and the Big Five Personality Dimensions. In half of the applications
we send out, these pictures are directly pasted into the resumes, while for the
other half of the applications, they are used as Facebook profile pictures. By
monitoring the subsequent reactions from the employer side, the (absolute and
relative) unequal treatment based on the pictures revealed by the Facebook profile
(and resume) pictures is identified directly and can be given a causal interpretation.
The remainder of this study is structured as follows. In the next section, we
describe the conducted experiment. In Section 3, we answer our research question
by means of a statistical examination of the experimentally gathered data. We
present measures of the extent to which the hiring chances of our fictitious job
candidates are affected by their Facebook profile pictures (as such and relative to
the effect of these pictures when pasted directly to their written application). In
addition, we investigate whether the effect of Facebook profile picture appearance
is heterogeneous by (i) the education level of the candidate, (ii) the gender of the
recruiter, (iii) the level of customer contact in the posted job and (iv) the labour
market tightness at the level of the occupation. The last section concludes the
article and provides the reader with directions for future research.
Boyd and Ellison (2007) and Brown and Vaughn (2011); for a literature review of the scientific literature on
Facebook, we refer to Caers et al. (2013), Rains and Brunner (2015), Roth et al. (2013), Wilson et al. (2012) and
Zhang and Leung (2015); for a discussion on the ethical and legal issues for employers using Facebook to screen
applicants, we refer to Brandenburg (2008), Brown and Vaughn (2011), Chauhan et al. (2013), Davison et al.
(2011), Slovensky and Ross (2012) and Smith and Kidder (2010).
5
2 TheExperiment
2.1An Alternative Application of the Correspondence
ExperimentationFramework
Over the past few decades, social and behavioural scientists in general and labour
economists in particular have conducted various correspondence experiments to
measure unequal treatment in the labour market. Within this type of experiment,
pairs of fictitious job applications are sent to real job openings. These applications
differ only in the characteristic that is to be tested. This characteristic is randomly
assigned within each pair of applicants. By monitoring the subsequent call‐back,
unequal treatment in first hiring decisions based on this characteristic can be
identified. This measure of unequal treatment can be given a causal interpretation.
Selection based on individual unobservable characteristics is eliminated as the
researcher fully controls the information available to the employer. This allows
her/him to disentangle discrimination from alternative explanations of
heterogeneous hiring outcomes, such as differences in preferences and behaviour
at the employee side or differences in human capital.
In the beginning, correspondence experiments were exclusively applied to
investigate racial and sex discrimination (Bertrand and Mullainathan, 2004; Pager,
2007; Riach and Rich, 2002). More recently, correspondence tests have been
employed to study discrimination based on other grounds, such as age, beauty and
sexual orientation (Baert et al., 2015b; Drydakis, 2009; Drydakis, 2011; Rooth,
2009). In addition, scholars have started to employ correspondence experiments to
study phenomena other than labour market discrimination in strict sense, such as
unemployment duration dependence and the labour market penalty of
motherhood (Baert, 2014; Eriksson and Rooth, 2014; Kroft et al., 2013).
In the present study, on the one hand, we join in with the more recent
correspondence experiments studying the effect of facial attractiveness (Lopez Bóo
et al., 2013; Mauzer‐Fazio and Lei, 2015; Rooth, 2009; Ruffle and Shtudiner, 2015),
6
as half of our pairs of fictitious applicants differ only in the picture added to their
resume. On the other hand, we distinguish ourselves from the former applications
of the correspondence experimentation literature by letting the other half of our
pairs of fictitious applicants differ only by a characteristic that cannot be evaluated
directly from the written application, i.e., the candidates’ publicly available
Facebook picture.
We conducted our field experiment between November 2013 and May 2014 in
the labour market of Flanders, the northern part of Belgium. During this period, we
tested 1,056 vacancies in the database of the Public Employment Agency of
Flanders, i.e., the region’s most important job search channel. More concretely, we
randomly selected 528 vacancies for jobs targeting labour market entrants with a
secondary education degree (i.e., ISCED level 3)4 in commerce and 528 vacancies
for jobs targeting labour market entrants with a Master’s degree (i.e., ISCED level 5
– Master) in commercial sciences. Two job applications of graduates, identical in
terms of productivity‐relevant characteristics, were sent to the selected vacancies.
To each candidate within our pairs of applicants, we randomly assigned one out of
four facial pictures diverging in attractiveness and personality traits. For half of the
pairs, these pictures were employed as the pair members’ Facebook profile
picture. By monitoring the subsequent call‐back for these pairs by profile picture,
unequal treatment based on the candidates’ Facebook profile picture could be
identified. For the other half of the pairs, the same pictures were used as the pair
members’ resume picture. As a result, we were able to compare the effect of
revealing the pictures as a Facebook profile picture to their effect when revealed
as a resume picture.5
Our choice for Facebook profile picture appearance as a social media item
potentially screened by employers is motivated as follows. First, with more than
4 ISCED stands for International Standard Classification of Education.
5 By also sending out pairs disclosing their facial picture as a resume picture, we anticipated a zero effect of
the Facebook profile pictures on hiring outcomes. This zero effect could have been explained by two important
reasons: (i) recruiters did not screen job candidates’ Facebook profile pictures and/or (ii) the pictures we used did
not yield diverging hiring chances if they were screened. A non‐zero effect of these pictures, when pasted directly
to one’s resume, could have ruled out explanation (ii), if we were willing to assume that Facebook profile pictures
and resume pictures affect, if they are screened, employers’ hiring decisions roughly to an equal extent.
7
1.49 billion monthly active users as of 30 June 2015, Facebook is the world’s most
popular SNW (Facebook, 2015). Second, a substantial fraction of the Facebook
users allow other users to whom they are not connected as friends to see only
their name and Facebook profile picture. Therefore, being only able to judge job
candidates’ Facebook profile picture is a situation in which many employers find
themselves in reality. Third, allowing only (randomised) variation in our fictitious
candidates’ facial pictures keeps the controlled experimental setting feasible.
Fourth, facial pictures nevertheless allow employers to screen candidates’
attractiveness and personality traits. This is relevant information as, following a
survey of the popular job search website CareerBuilder (2012), the most important
aspect that recruiters mention with respect to screening job candidates’ Facebook
profiles is making inferences about these candidates’ personality that might not be
as easily obtained through traditional screening.6 In addition, peer‐reviewed
research shows that resume pictures revealing beneficial characteristics with
respect to attractiveness and personality traits increase job candidates’ hiring
chances (Baert and Decuypere, 2014; Lopez Bóo et al., 2013; Mauzer‐Fazio and Lei,
2015; Rooth, 2009; Ruffle and Shtudiner, 2015).
2.2ConstructionofJobApplicationTemplatePairs
For each of the aforementioned two academic degrees held by our fictitious
applicants, we created two template applications comprising a resume and a cover
letter. We will refer to them as the Type A and Type B application types. These
types were equal in all productivity‐relevant characteristics but differed in lay‐out
and details such as the particular cultural activity mentioned. To ensure that our
application templates were realistic and representative, example applications of
the Public Employment Agency of Flanders were used and calibrated for our
purposes.
6 Another important self‐reported reason appears to be verifying information presented in candidates’
written applications (Brown and Vaughn, 2011; CareerBuilder, 2012).
8
The Type A and Type B applicants were single male graduates born, studying
and living in comparable suburbs of the cities of Antwerp and Leuven. We
appended a fictitious postal address (a real street but a non‐existing street
number) and a date of birth to all application templates. The applicants shared the
following characteristics: Belgian nationality, work experience from two student
jobs, adequate (and comparable) ICT and language skills, a driver’s license and
sports and cultural activities.
Our candidates graduated in June 2013, from a school with a comparable
reputation, without any grade retention experience. In line with the particular
vacancy to which the pair of applicants was sent, a specialisation was chosen. For
the secondary education degree in commerce, the specialisations used were (i)
commerce (no specific specialisation), (ii) accountancy, (iii) ICT, (iv) secretariat and
languages and (v) tourism. For the Masters in commercial sciences, the
specialisations used were (i) accountancy and tax, (ii) financial management, (iii)
human resource management, (iv) international affairs and (v) marketing
management. These different specialisations allowed us to apply for various
occupations. Testing multiple occupations (rather than just one) is important
because it enabled us to avoid the danger inherent in many former
correspondence experiments in which researchers simply selected an occupation
with, potentially, a high (or low) surplus of the tested characteristic. In addition,
the variety in occupations enabled us to measure heterogeneous treatment effects
by customer contact level at the posted job level and labour market tightness at
the occupation level.
It is important to note that the minimal differences between the Type A and
Type B application templates could not bias our results as the treatment of
interest, i.e., the candidate’s facial picture, was, for each vacancy, randomly
assigned to these types. Moreover, the regression analysis presented in Section 3.2
shows that these differences did not yield different call‐back outcomes for our two
template types.
9
2.3Randomised Assignment of Facebook Profile and Resume
Pictures
The pictures used for our experiment were selected from those employed in the
laboratory experiment of Baert and Decuypere (2014). In their study, which was to
some extent a preparatory study for the present one, 195 raters scored 22 pictures
of young graduates, selected from picture databases, on the Big Five Personality
Dimensions (agreeableness, conscientiousness, emotional stability, extraversion
and openness) and on attractiveness.7 Personality traits were rated using the Ten‐
Item Personality Inventory (Gosling et al., 2003) for each photograph. This yielded
a single index for each personality trait between 1 and 7, for each picture.
Attractiveness was measured by the participants’ assessment of the statement “I
see this person as attractive” on a 7‐point Likert Scale, yielding a last index
between 1 and 7.
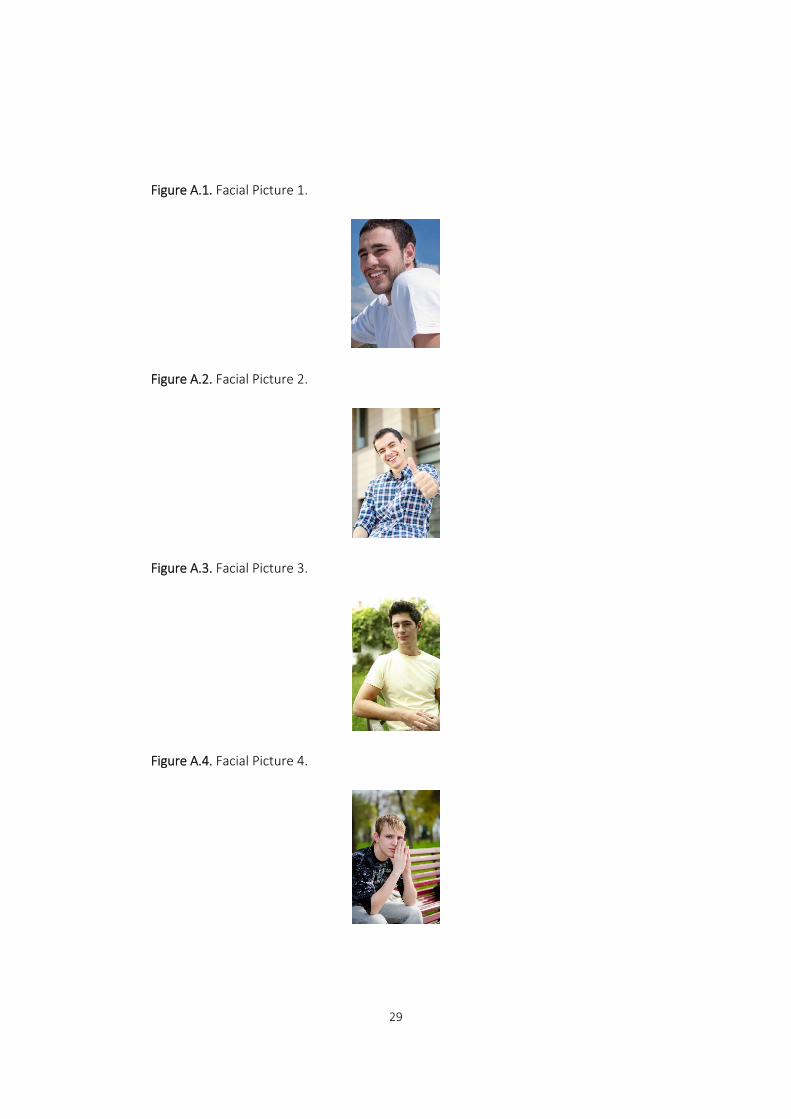
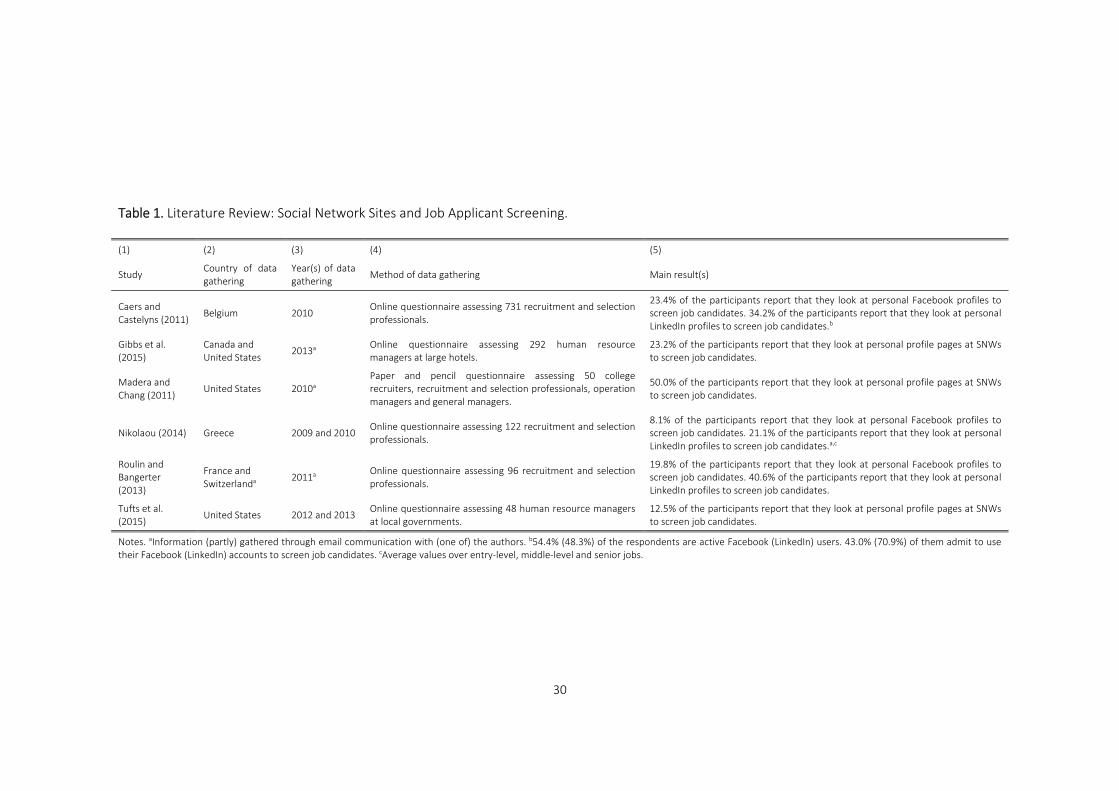
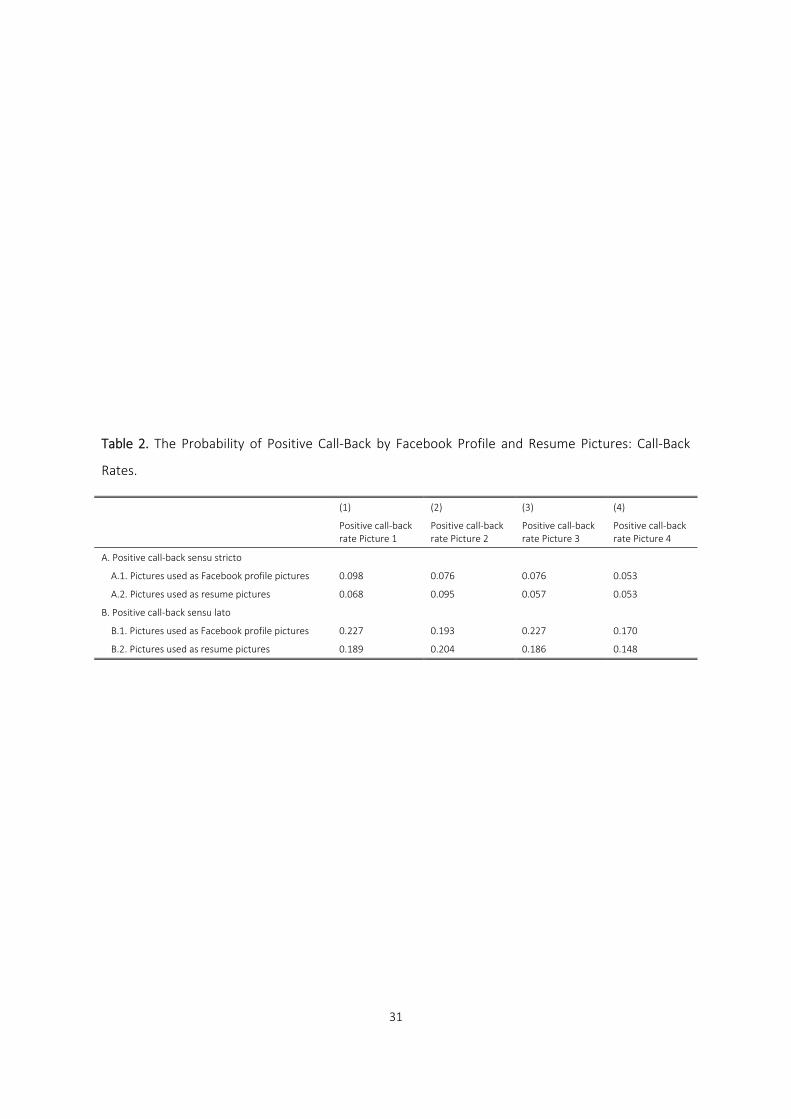
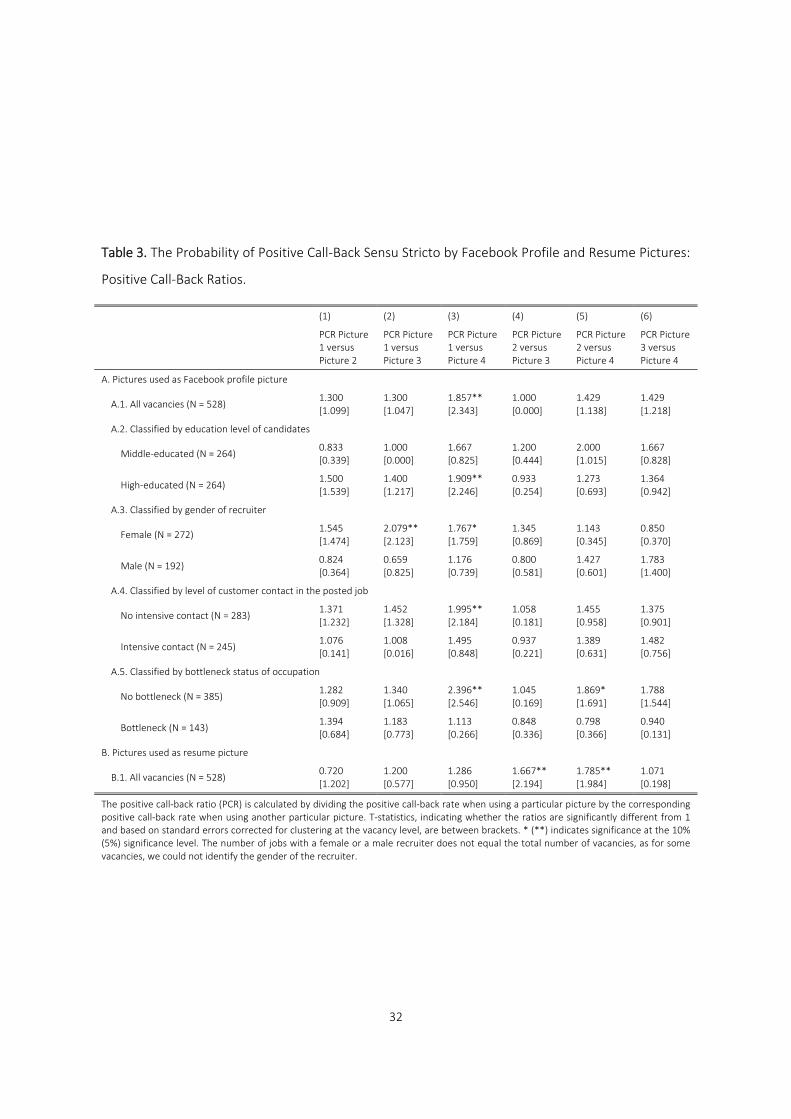
Based on the testers’ rating, we identified four facial pictures with diverging
scores on attractiveness and personality. These pictures are included in Appendix A
(Figures A.1, A.2, A.3 and A.4). Picture 1 and Picture 2 are facial pictures that got
beneficial scores. Picture 1 was chosen for its high score on attractiveness, on the
one hand, and extraversion, agreeableness, emotional stability and openness, on
the other hand. This picture, however, had only a moderate score with respect to
the personality trait that is generally found to drive productivity the most:
conscientiousness (Barrick and Mount, 1991; Heineck and Anger, 2010; Mueller
and Plug, 2006; Nyhus and Pons, 2005). Picture 2 was chosen for its high score on
the latter personality trait (and moderate scores with respect to attractiveness and
the other personality dimensions). Picture 3 got relatively moderate scores for all
characteristics. Picture 4 was a picture yielding bad scores, both with respect to
attractiveness and with respect to personality traits.8
7 Baert and Decuypere (2014) showed that these characteristics affected the experimental hiring decisions of
the testers in their role of recruiter.
8 More concretely, Picture 1, Picture 2, Picture 3 and Picture 4 scored, on average, 4.34 (third highest out of
22 pictures), 3.53 (11/22), 4.22 (5/22) and 2.75 (22/22) on attractiveness; 4.66 (2/22), 4.32 (6/22), 4.11 (16/22)
and 3.98 (18/22) on agreeableness; 4.43 (7/22), 4.86 (1/22), 4.23 (12/22) and 3.90 (15/22) on conscientiousness;
10
The random assignment of one out of four pictures to each of the two job
application template types was realised by a randomisation procedure in which we
alternated between the 12 possible pairs of applications sent to employers. In
addition, we alternated pairs who revealed their facial pictures by pasting it directly
into their resume9 and pairs who made their pictures publicly available as their
Facebook profile picture. For the latter pairs, no picture was added to their
resume. For these pairs, the first name and surname of the candidates led, by
searching it on Google or by submitting it to the Facebook search bar, to a single
Facebook profile (and no other Google hits). These fictitious profiles were under
our control and only publicly displayed the (current) profile picture of the
candidate. For the former pairs, the common first name and surname
combinations of the candidates’ led to tens of Facebook profile pictures so that the
employer could not screen the candidate through Facebook. It is important to
mention that we made sure that the names we chose did not represent a different
social background following Bloothooft and Onland (2011) who linked the suffix of
the first name Dutch speaking parents choose for their children to these children’s
later wages.10
We hypothesise that candidates who reveal Picture 1 or Picture 2 as their
resume picture have, given the beneficial scores of these pictures on perceived
attractiveness and personality, better hiring chances than candidates revealing
Picture 3, who have, in turn, better hiring chances than those revealing Picture 4.
We have no a priori expectations concerning the relative treatment of candidates
revealing Picture 1 versus candidates revealing Picture 2 as resume picture. In
addition, supported by the evidence of employers reporting that they use
5.13 (1/22), 4.30 (11/22), 4.49 (7/22) and 3.66 (22/22) on emotional stability; 5.07 (3/22), 5.04 (4/22), 4.10
(13/22) and 2.88 (22/22) on extraversion; and 5.09 (2/22), 4.60 (10/22), 4.29 (13/22) and 3.55 (22/22) on
openness. The consensus in the peer‐reviewed literature is that all these factors have a non‐negative effect on
productivity, except for agreeableness, for which, besides zero effects, both (slightly) positive and (slightly)
negative effects have been found (Baert and Decuypere, 2014; Barrick and Mount, 1991; Heineck, 2011; Mueller
and Plug, 2006).
9 Several Flemish human resource managers confirmed that in Flanders, it is not uncommon to add a facial
picture to one’s resume.
10 These names were “Peter Baert”, “Thomas De Groote”, “Sven De Clerck” and “Bart De Sutter” when
pasting Picture 1, Picture 2, Picture 3 and Picture 4, respectively, directly into the resume and “Thibaut Schoors”,
“Kjell Lievevrouw”, “Joannes Bombeek” and “Bregt Van Acoleyen” when using the same pictures as Facebook
profile pictures.
11
Facebook in screening job candidates, as reviewed in Table 1, we expect the same
ordering in terms of hiring chances, i.e., the highest for Picture 1 and Picture 2 and
the lowest for Picture 4, when the pictures are used as Facebook profile pictures.
Concerning the relative effect of variation in Facebook profile pictures
compared to the effect of these pictures when employed as resume pictures, we
have no a priori expectations. On the one hand, the probability that a candidate’s
facial picture is seen is higher when it is pasted into his resume than when it is
made available as a Facebook profile picture. Therefore, the chance of affecting
hiring outcomes is higher for resume pictures than for Facebook profile pictures,
ceteris paribus. On the other hand, the magnitude of the impact of a facial picture
might be higher when it is seen as a Facebook profile picture than when it is seen
as a resume picture. This may be the case if, as argued in Section 1, employers
perceive Facebook profile pictures as more honest signals of applicants’ ability and
commitment than resume pictures (because job candidates might be not aware
that employers screen their personal Facebook profile).
2.4ClassificationofCall‐Back
The combinations of application template types and experimental identities by
facial picture were sent to the employers between 24 November 2013 and 20 April
2014, in an alternating order, each time with approximately 24 hours in between
the pair members.
Call‐backs were received by telephone voicemail or email. In our analysis, we
follow the literature in distinguishing between two definitions of positive call‐back.
Positive call‐back sensu stricto means the applicant was invited for an interview
concerning the posted job. Positive call‐back sensu lato also includes the request to
contact the recruiter by telephone or to provide more information by email or the
proposal of an alternative job. All call‐backs received later than 30 days after
sending out the application were neglected.
12
3 TheResults
3.1PositiveCall‐BackRatios
Table 2 presents the positive call‐back rates for our fictitious job applicants by the
picture we assigned to them (Picture 1, 2, 3 or 4) and by the way they revealed this
picture (as a publicly available Facebook picture or as a resume picture). In Panel A,
we follow the strict sense definition of positive call‐back and in Panel B, the broad
sense definition. In total, the candidates revealing Picture 1, Picture 2, Picture 3
and Picture 4 as a Facebook profile picture obtained a positive call‐back in the strict
sense (broad sense) in 9.8% (22.7%), 7.6% (19.3%), 7.6% (22.7%) and 5.3% (17.0%)
of their applications, respectively. Except for one comparison (the positive call‐back
rate in broad sense is higher for those revealing Picture 3 as a Facebook profile
picture than for those revealing Picture 2), these numbers perfectly follow our
hypothesised ordering. On the other hand, the corresponding positive call‐back
rates are 6.8% (18.9%), 9.5% (20.4%), 5.7% (18.6%) and 5.3% (14.8%) for the
candidates who pasted Picture 1, Picture 2, Picture 3 and Picture 4 directly into
their resume. These numbers follow our hypothesised ordering without any
exception.
<Table 2 about here.>
To compare the positive call‐back rates outlined in Table 2 in a structured
manner, we calculate a statistic frequently employed in correspondence studies,
i.e., the positive call‐back ratio (PCR). This statistic is calculated by dividing the
positive call‐back rate when using a particular picture (as Facebook profile or as
resume picture) by the corresponding positive call‐back rate when employing
another particular picture. Table 3 (Table A.1 in Appendix A) presents the PCRs
following the sensu stricto definition (sensu lato definition) of positive call‐back, at
the level of the total dataset and for various subsamples. As we use the positive
call‐back rates of the pictures with a lower index (picture number) as the
numerator of these ratios and the corresponding call‐back rates of the pictures
13
with a higher index as the denominator, PCRs above 1 are expected given our
hypotheses mentioned in Section 2.3. A single exception in this respect is the PCR
comparing candidates with Picture 1 to candidates with Picture 2 (as we have no a
priori expectations concerning their relative hiring chances).
<Table 3 about here.>
At the level of the total dataset, Panel A.1 shows a PCR sensu stricto that is
significantly higher than 1 when comparing candidates using Picture 1 as Facebook
profile picture to candidates using Picture 4 for the same purpose. More
concretely, the PCR is 1.857, indicating that the former candidates obtained 85.7%
more job interview invitations. In addition, the PCR sensu lato indicates a
(statistically significant) 33.3% higher probability of obtaining any positive reaction
for both candidates using Picture 1 and Picture 3 compared to those using Picture
4. These findings are in line with our research hypotheses and indicate that
Facebook profile picture appearance does affect hiring decisions.
The significant PCRs for the pairs of candidates pasting the facial pictures
directly into their resumes (presented in Panel B.1) are also consistent with our
expectations. When the pictures are employed as resume pictures, we find a
statistically significant preference in respect of employers for Picture 2 above
(Picture 3 and) Picture 4. Taken together, our findings based on the comparison of
Panel A.1 and Panel B.1 might, given the relative strengths of Picture 1 and Picture
2, be interpreted as suggestive evidence for Facebook pictures being screened
more on attractiveness and resume pictures being screened more on personality
traits. Or, alternatively, they might be explained by recruiters employing Facebook
to screen candidates being relatively more interested in attractiveness and
recruiters who do not employ Facebook being more interested in personality traits.
However, our regression analysis below will show that, at least with respect to the
probability of obtaining any positive reaction, we cannot reject that the variation in
facial pictures does affect hiring chances equally when these pictures are used as
Facebook profile pictures and when they are used as resume pictures.
14
Next, we breakdown our ratios of unequal treatment by Facebook profile
picture by proxies of (i) the education level of the candidates, (ii) the gender of the
recruiter, (iii) the level of customer contact in the posted job and (iv) the
bottleneck status of the occupation. First, by construction of the experiment, we
observe two education levels, i.e., secondary education (“middle‐educated”) and
tertiary education (“high‐educated”). On the one hand, one could expect that high‐
educated candidates are screened more on Facebook as they seem to be more
engaged on social media (Correa et al., 2010). On the other hand, theoretical and
empirical studies show that, in general, unequal treatment based on subjective
factors is lower for the high‐educated as higher education degrees reduce
uncertainty about job candidates (Baert et al., 2015a; Carlsson and Rooth, 2007;
Taubman and Wales, 1974; Wood et al., 2009) and therefore, the need of making
inferences about these candidates’ ability based on informally gathered
information about them. Second, the gender of the recruiter is proxied by the
name of the contact person mentioned in the vacancy. Based on the fact that
women employ social media in general and Facebook in particular more than men
(Fitzgerald, 2012; Joinson, 2008), a higher surplus of beneficial Facebook profile
pictures might be expected when recruiters are female, ceteris paribus. Third, the
level of customer contact in the posted job is evaluated as intensive in case being
customer‐oriented is mentioned explicitly as a required skill in the vacancy. We
expect the returns on perceived attractiveness and beneficial personality traits to
be higher in jobs where customer contact is more important. Finally, concerning
the labour market tightness in the occupation, following Baert et al. (2015a), we
first matched each vacancy one‐to‐one with an occupation in the classification list
of the Public Employment Agency of Flanders. For each of these occupations, we
were able to look up their “bottleneck” status. This status is obtained by combining
three statistical criteria concerning the labour market tightness in the occupation:
(i) there must be at least 10 vacancies registered in the database of the Public
Employment Agency for this occupation, (ii) the vacancy filling rate in this
occupation must be lower than the median filling rate for all occupations together
and (iii) the median duration until a vacancy in this occupation is filled must be
15
greater than the median for all occupations together. When they must fill a
bottleneck occupation, recruiters are expected to have a lower number of job
candidates so that discriminating on (Facebook profile or resume) picture
appearance is more costly. We therefore expect that the surplus of a high rated
Facebook profile picture is higher in non‐bottleneck occupations.
The statistics presented in Panels A.2, A.3, A.4 and A.5 of Table 3 (and Table
A.1) show that our finding of more favourable hiring chances for candidates using
Picture 1 (and Picture 3) as their Facebook profile picture compared to Picture 4
are driven by the applications (i) with high‐educated candidates, (ii) with female
recruiters, (iii) for posted jobs with high levels of customer contact and (iv) for non‐
bottleneck occupations. With respect to (i), our findings are in line with those of
Madera and Chang (2011). In addition, the presented statistics are in line with our
aforementioned expectations except for the breakdown of the PCRs by the level of
customer contact in the posted job. We come back to the significance of these
dimensions of heterogeneity in unequal treatment based on Facebook profile
picture appearance later.
3.2RegressionAnalysis
As we randomly assigned the four facial pictures to the two applications we sent to
the tested vacancies, regressing positive call‐back at the individual application level
on these pictures and other candidate and vacancy characteristics should lead to
exactly the same statistical results for a sample size approaching infinity (both for
the subsample of candidates who used these pictures as Facebook profile picture
and for the subsample of candidates who used them as resume picture). However,
our sample size is finite. Therefore, observable and unobservable determinants of
hiring outcomes that vary across vacancies may occur to correlate with the facial
pictures used. To control for this potential correlation, we perform a regression
analysis controlling for random effects at the vacancy level.11 In addition, this
11 See, e.g., Verbeek (2004) for an introduction to random effects models. Basically, this approach allows one
16
regression analysis allows us to measure the independent effect of the
aforementioned variables (i), (ii), (iii) and (iv) interacted with the Facebook profile
(or resume) picture of the candidate.
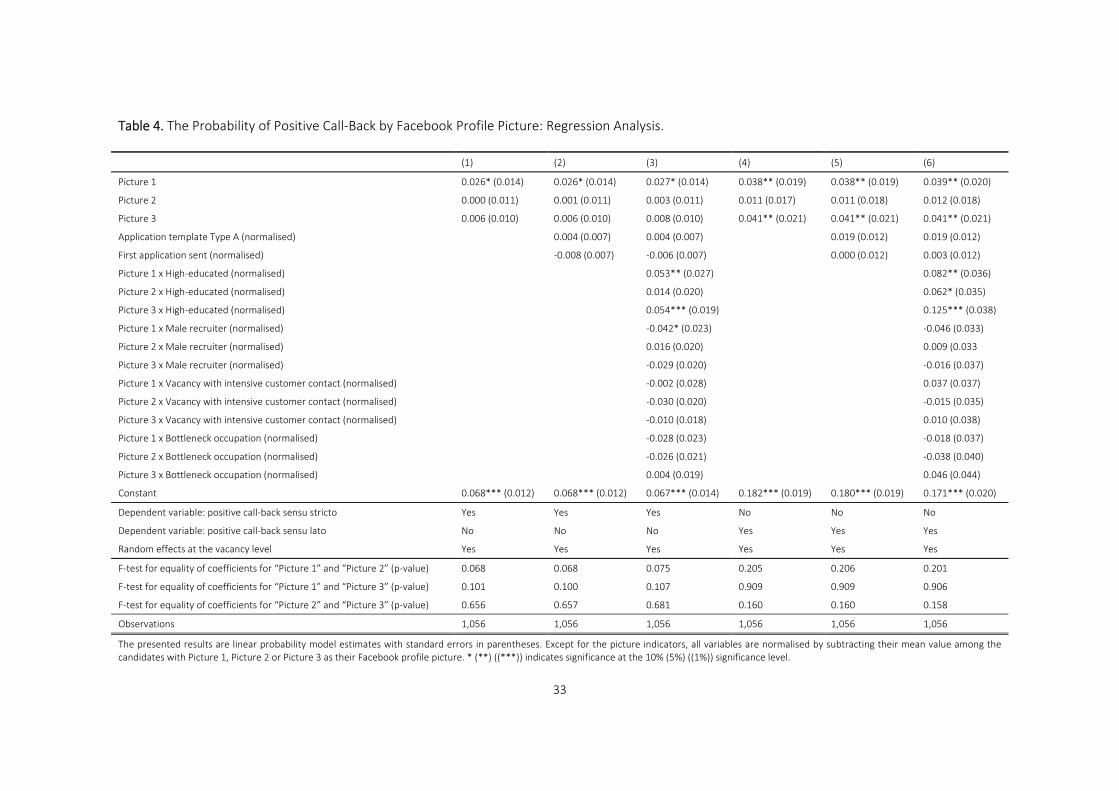
Table 4 and Table A.2 present our regression results for the subsamples of
candidates revealing their facial picture as Facebook profile picture and resume
picture, respectively. We regress the outcome of positive call‐back sensu stricto
(Models (1), (2) and (3)) and positive call‐back sensu lato (Models (4), (5) and (6))
on various sets of variables by means of a linear probability model with random
effects at the vacancy level. For reasons of comparability of the results for our
different regression models, except for the picture indicators, all variables are
normalised by subtracting their mean value among the candidates with Picture 1,
Picture 2 or Picture 3 as Facebook profile or resume picture. In what follows, we
first focus on the results outlined in Table 4. Afterwards, we compare these results
with the ones in Table A.2.
<Table 4 about here.>
In Model (1) and Model (4), we include only indicators of using Picture 1,
Picture 2 and Picture 3 as the Facebook profile picture (thereby implicitly choosing
Picture 4 as the reference picture) as explanatory variables. The regression results
in Table 4 show that revealing Picture 1 as a Facebook profile picture increases the
probability of job interview invitation with 2.6 percentage points (or 38.2%)12 and
the probability of obtaining any positive reaction with 3.8 percentage points (or
20.9%) in comparison with revealing Picture 4. In addition, revealing Picture 3
increases the probability of positive call‐back sensu lato with 4.1 percentage points
(or 22.5%). These effects controlling for random effects at the vacancy level are
somewhat lower than the ones derived from the corresponding PCRs mentioned
above. Interestingly, after controlling for random effects at the vacancy level, we
to control for random factors, independently and identically distributed over, in our case, vacancies. As a result,
the error term of the regression model consists of two components: a vacancy specific component and a
remainder component. Random effects models can be estimated by means of the command “xtreg” in Stata. As
an alternative, we estimated fixed effects models, i.e., linear regressions in which the intercept terms vary over
the vacancies (Verbeek, 2004). This, however, yielded the same conclusions.
12 38.2% = 0.026/0.068.
17
also find a weakly significant preference for candidates using Picture 1 as the
Facebook profile picture compared to their counterparts using Picture 2.
Next, in Model (2) and Model (4), we include indicators of the template type
employed and the submission order. As the picture assignment is, by construction,
not correlated with them, the inclusion of these additional variables does not
change the Facebook picture effects. Moreover, positive call‐back outcomes vary
neither by template type (as announced in Section 2.2) nor by place in the sending
order.
Finally, in Model (3) and Model (6), we add interactions between the facial
pictures used as the Facebook profile picture and indicator variables by which we
want to investigate the heterogeneous effects of these pictures: (i) an indicator for
high‐educated candidates, (ii) an indicator for male recruiters, (iii) an indicator for
jobs with intensive customer contact and (iv) an indicator for bottleneck
occupations. On the one hand, the results for these models confirm our findings
based on the descriptive analysis with respect to the higher surplus of high scored
Facebook profile pictures for high‐educated candidates and – to a lesser extent –
when recruiters are female. On the other hand, we do not find significant
interactions with the indicator for jobs with intensive customer contact or the
indicator for bottleneck occupations after controlling for random effects at the
vacancy level.
Table A.2 presents the corresponding regression results when employing the
subsample of candidates pasting the facial pictures directly into their resume. In
line with Panel B.1 of Table 3 and Table A.1, we find the highest positive call‐back
rates when using Picture 2 as the resume picture. In addition, we find weakly
significant evidence that the higher job interview invitation probability for
candidates with this picture is driven by the observations for non‐bottleneck
occupations.
A remaining question is whether the variation in the facial pictures we use has
a lower (or higher) effect on hiring chances when the photographs are used as the
Facebook profile picture than when they are used as the resume picture. By
18
comparing the effects of using Picture 1, Picture 2 and Picture 3 (in comparison
with Picture 4) as the Facebook profile picture in Table 4 to the corresponding
effects of pasting these pictures directly into one’s resume in Table A.2, we
observe (i) quite comparable effects with respect to Picture 1 and Picture 3 and (ii)
a substantially higher effect of Picture 2 when used as the resume picture.
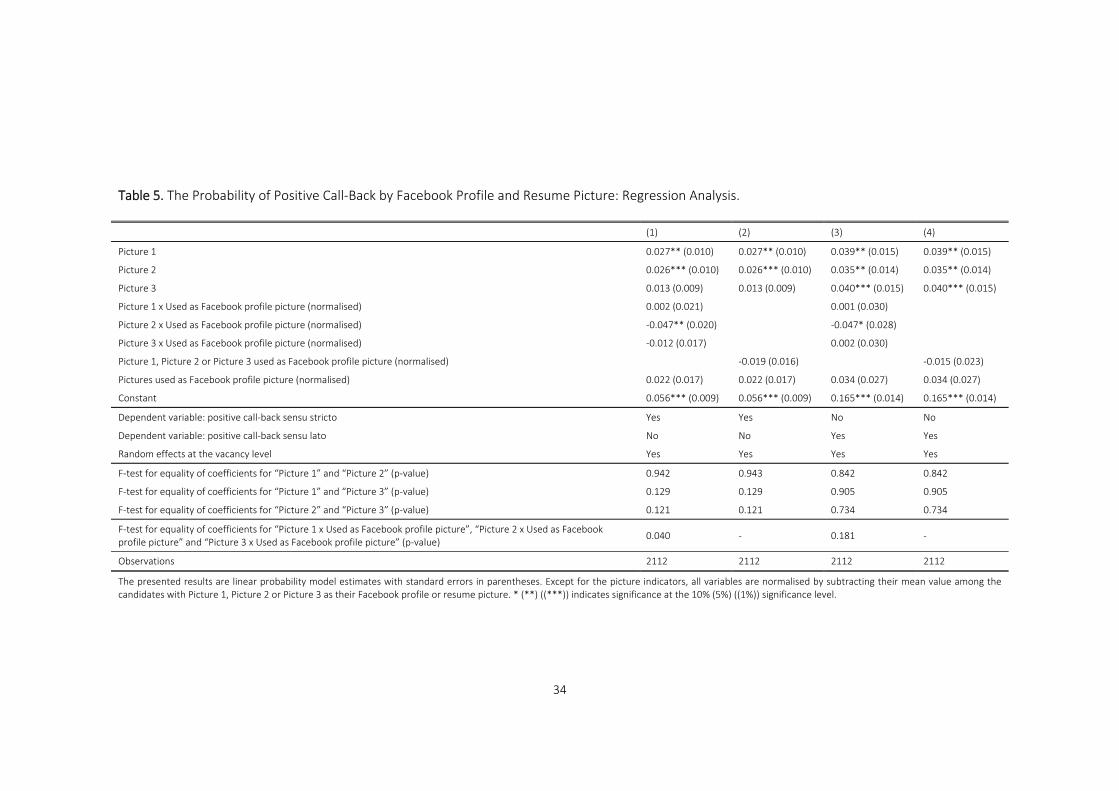
As a last exercise, which is reported in Table 5, we investigate the latter issue
formally. We do this by pooling the data and regressing positive call‐back on the
picture indicators (used as the Facebook profile or resume picture) and
interactions between the pictures assigned and an indicator of whether they were
used as the Facebook profile picture.13 The latter interactions are key in this
exercise. Model (1) and Model (2) follow the sensu stricto definition of positive call‐
back, and Model (3) and Model (4) follow the sensu lato definition. In Model (1)
and Model (2), we include flexible interactions between the three pictures and the
indicator of their use as a Facebook profile picture. We find that Picture 2 is
significantly more valued (in comparison with Picture 4) when used as a resume
picture than when used as the Facebook profile picture. However, we do not find a
difference in surplus for Picture 1 and Picture 3 (in comparison with Picture 4) by
their use as a Facebook profile picture or resume picture. In addition, we can, at
least with respect to the probability of positive call‐back in broad sense, not reject
that the additional surplus of using Picture 1, Picture 2 and Picture 3 as a Facebook
profile picture (compared to using them as a resume picture) instead of Picture 4 is
equal for these three pictures (p = 0.181). Therefore, in Model (2) and Model (4),
we adopt a more restrictive specification in which only one general interaction
between the assignment of Picture 1, Picture 2 or Picture 3 and the use of this
picture as a Facebook profile picture is included. For this more restrictive
specification, we cannot reject that the effect of these “better” pictures is
indifferent by whether they are used as a Facebook profile or resume picture.
Thus, except for one situation (the probability of positive call‐back sensu stricto for
individuals using Picture 2 compared to individuals using Picture 4), we cannot
13 In addition, to control for a difference in call‐back for the reference picture, i.e., Picture 4, in the situation
in which it is used as a Facebook profile picture and the situation in which it is used as a resume picture, a dummy
indicating members of pairs using their pictures as Facebook profile pictures is included.
19
reject that the surplus for the “better” pictures is equal when they are used as a
Facebook picture and when they are used as a resume picture.
<Table 5 about here.>
4 Conclusion
In this study, we contributed to the literature measuring the use of social media in
screening job candidates. We presented a systematic review of this literature and
concluded that all former contributions to it were based on data self‐reported by
employers. We argued that this approach suffers from three methodological
problems: (i) reported attitudes may deviate from actual hiring behaviour, (ii)
employing social media does not mean letting social media affect hiring decisions
and (iii) candidates differ in the available information on their online profile pages.
To overcome these issues, we conducted a field experiment in the Belgian
labour market. Pairs of fictitious job applicants were sent to genuine job openings.
To each application within a pair, we randomly assigned one out of four facial
pictures varying in attractiveness and personality. For half of the vacancies, these
pictures were directly pasted into the resumes, while for the other half, we
assigned a candidate name to the resumes, which, by searching it on Google or by
submitting it to the Facebook search bar, led to a single Facebook profile. These
fictitious profiles were under our control and only publicly displayed the profile
picture. By monitoring the subsequent reactions from the employer side, the effect
of the Facebook profile pictures was identified directly and could be interpreted in
a causal way. Due to the design of the experiment, we could measure the effect of
the Facebook profile pictures as such and in comparison with their effect when
pasted directly into the candidates’ resumes.
We found that candidates with the most beneficial Facebook picture got
approximately 39% more job interview invitations and 21% more positive reactions
20
in a broad sense compared to candidates with the least beneficial picture. This
surplus of a favourable Facebook picture was higher for the higher educated. In
addition, we found suggestive evidence for a higher surplus when recruiters were
female. Moreover, we could not reject that variation in Facebook profile pictures
affects positive call‐back in a broad sense with the same magnitude as (the same)
variation in resume pictures. A potential explanation for this finding is the fact that
only part of the recruiters screen Facebook is compensated for by their perception
of Facebook profile pictures as more honest signals of applicants’ ability and
commitment.
An important limitation of the current study is that we measured only the
impact of a very specific social media item, i.e., individuals’ Facebook profile
picture, on hiring chances.14 However, for many job candidates, this profile picture
is the only element that they make publicly available on Facebook, and by
extension – given that Facebook is by far the most popular social networking
website – on social media. Thereby, this profile picture is often the only social
media item employers are able to screen in practice. Nevertheless, we are in
favour of future studies exploring whether other components of publicly available
information also affect the employment opportunities of users of social networking
sites. The relative importance of these components could, for instance, be studied
by means of eye tracking experiments15 in which recruiters are asked to make
fictitious hiring decisions based on job candidates’ (fully public) social networking
profiles and their eye movements when screening these profiles are followed (and
analysed).
14 In addition, the reader might mention that correspondence experiments focus on a very particular
outcome, i.e., call‐back rates for first interviews. As a result, our findings do not allow making any statements
about unequal treatment based on Facebook profile picture appearance in the later stages of the screening
process. However, Bertrand and Mullainathan (2004) argue that a lower number of interview invitations is
expected to be reflected in reduced job offers. Furthermore, because job interviews are costly, employers invite
job candidates to an interview only if these applicants have a reasonable chance of getting the job.
15 An example of an eye tracking experiment applied to unequal treatment in the labour market is Lahey et
al. (2015).
21
References
Back, M., Stopfer, J., Vazire, S., Gaddis, S., Schmukle, S., Egloff, B., Gosling, S.
(2010): Facebook Profiles Reflect Actual Personality, Not Self‐Idealization.
Psychological Science, 20, 1–3.
Baert, S. (2014): Career Lesbians. Getting Hired for Not Having Kids? Industrial
Relations, 45, 543–561.
Baert, S., Cockx, B., Gheyle, N., Vandamme, C. (2015a): Is There Less
Discrimination in Occupations Where Recruitment Is Difficult? ILR Review, 68, 467–
500.
Baert, S., Decuypere, L. (2014): Better sexy than flexy? A lab experiment
assessing the impact of perceived attractiveness and personality traits on hiring
decisions. Applied Economics Letters, 21, 597–601.
Baert, S., Norga, J., Thuy, Y., Van Hecke, M. (2015b): Getting Grey Hairs in the
Labour Market. An Alternative Experiment on Age Discrimination. IZA Discussion
Paper Series, 9289.
Barrick, M. R., Mount, M. K. (1991): The big five personality dimensions and job
performance: a meta‐analysis. Personnel Psychology, 44, 1–26.
Berkelaar, B. L., Scacco, J. M., Birdsell, J. L. (2015): The worker as politician:
How online information and electoral heuristics shape personnel selection and
careers. New Media & Society, 17, 1377–1396.
Bertrand, M., Mullainathan, S. (2004): Are Emily and Greg more employable
than Lakisha and Jamal? A field experiment on labor market discrimination.
American Economic Review, 94, 991–1013.
Bloothooft, G., Onland, D. (2011): Socioeconomic determinants of first names.
Names, 59, 25–41.
22
Bohnert, D., Ross, W. H. (2010): The Influence of Social Networking Web Sites
on the Evaluation of Job Candidates. Cyberpsychology, Behavior and Social
Networking, 13, 341–347.
Boyd, D. M., Ellison, N. B. (2007): Social network sites: Definition, history and
scholarship. Journal of Computer Mediated Education, 13, 210–230.
Brandenburg, C. (2008): Newest Way to Screen Job Applicants: A Social
Networker’s Nightmare. Federal Communications Law Journal, 60, 597–626.
Broughton, A., Foley, B., Ledermaier, S., Cox, A. (2013): The use of social media
in the recruitment process. ACAS Research Papers, 03/13.
Brown, V. R., Vaughn, E. (2011): The Writing on the (Facebook) Wall: The Use
of Social Networking Sites in Hiring Decisions. Journal of Business and Psychology,
26, 219–225.
Caers, R., Castelyns, V. (2011): LinkedIn and Facebook in Belgium: The
Influences and Biases of Social Network Sites in Recruitment and Selection
Procedures. Social Science Computers Review, 29, 437–448.
Caers, R., De Freyter, T., De Couck, M., Stough, T., Vigna, C., Du Bois, C. (2013):
Facebook: A literature review. New Media & Society, 15, 984–1002.
CareerBuilder (2012): Thirty‐seven percent of companies use social networks
to research potential job candidates, according to new CareerBuilder Survey.
Retrieved 28 August 2015 from http://www.careerbuild‐
er.com/share/aboutus/pressreleasesdetail.aspx?id=pr691&sd=4%2F18%2F2012&e
d=4%2F18%2F2099.
Carlsson, M., Rooth, D.‐A. (2007): Evidence of ethnic discrimination in the
Swedish labor market using experimental data. Labour Economics, 14, 716–729.
Chauhan, R. S., Buckley, M. R., Harvey, M. G. (2013): Facebook and personnel
selection: What’s the big deal? Organizational Dynamics, 42, 126–134.
23
Clark, A. S. (2006): Employers look at Facebook, too. Retrieved 28 August 2015
from http://www.cbsnews.com/stories/2006/06/20/eveningnews/main1734920.s‐
html.
Correa, T., Hinsley, A. W., Gil de Zúñiga, H. (2010): Who interacts on the Web?
The intersection of users’ personality and social media use. Computers in Human
Behavior, 26, 247–253.
Davison, H. K., Maraist, C. C., Bing, M. (2011): Friend or Foe? The Promise and
Pitfalls of Using Social Networking Sites for HR Decisions. Journal of Business and
Psychology, 26, 153–159.
Drydakis, N. (2009): Sexual orientation discrimination in the labour market.
Labour Economics, 16, 364–372.
Drydakis, N. (2011): Women’s Sexual Orientation and Labor Market Outcomes
in Greece. Feminist Economics, 17, 89–117.
Du, W. (2007): Job candidates get tripped up by Facebook: Many students
learn the hard way that online image can limit opportunity. Retrieved 28 August
2015 from http://www.msnbc.msn.com/id/20202935/print/1/displaymode/1098.
Elzweig, B., Peeples, D. K. (2009): Using social networking web sites in hiring
and retention decisions. S.A.M. Advanced Management Journal, 74, 27–35.
Eriksson, S., Rooth, D.‐O. (2014): Do Employers Use Unemployment as a Sorting
Criterion When Hiring? Evidence from a Field Experiment. American Economic
Review, 104, 1014–1039.
Facebook (2015): Our Mission. Retrieved 28 August 2015 from
http://newsroom.fb.com/company‐info.
Fitzgerald, B. (2012): More Women On Facebook, Twitter And Pinterest Than
Men. Retrieved 28 August 2015 from http://www.huffington‐
post.com/2012/07/09/women‐facebook‐twitter‐pinterest‐n‐1655164.html.
Gibbs, C., MacDonald, F., MacKay, K. (2015): Social media usage in hotel human

24
resources: recruitment, hiring and communication. International Journal of
Contemporary Hospitality Management, 27, 170–184.
Gosling, S. D., Gaddis, S., Vazire, S. (2008): First impressions from the
environments that we create and inhabit. In Skowronski, J., Ambady, N. (Eds.): First
impressions. New York: Guilford.
Gosling, S. D., Rentfrow, P. J., Swann, W. B. (2003): A very brief measure of the
big‐five personality domains. Journal of Research in Personality, 37, 504–28.
Heineck, G. (2011): Does it Pay to Be Nice? Personality and Earnings in the
United Kingdom. ILR Review, 64, 1020–1038.
Heineck, G., Anger, S. (2010): The returns to cognitive abilities and personality
traits in Germany. Labour Economics, 17, 535–546.
Joinson, A. N. (2008): ‘Looking at’, ‘Looking up’ or ‘Keeping up with’ people?
Motives and uses of Facebook. CHI Proceedings, 2008, 1027–1036.
Kluemper, D. H., Rosen, P. A. (2009): Future employment selection methods:
evaluating social networking web sites. Journal of Managerial Psychology, 24, 567–
580.
Kramer, N. C., Winter, S. (2008): Impression Management 2.0: The relationship
of self‐esteem, extraversion, self‐efficacy and self‐presentation within social
networking sites. Journal of Media Psychology: Theories, Methods and Applications,
20, 106–113.
Kravets, D. (2013): Six states bar employers from demanding Facebook
passwords. Retrieved 28 August 2015 from http://www.wired.com/threatlevel/20‐
13/01/password‐protected‐states.
Kroft, K., Lange, F., Notowidigdo, M. J. (2013): Duration Dependence and Labor
Market Conditions: Evidence from a Field Experiment. Quarterly Journal of
Economics, 128, 1123–1167.
Lahey, J., Oxley, D. R., Alexander, G. (2015): Age Discrimination Using Resumes.
25
Report Prepared for the Alfred P. Sloan Foundation. Retrieved 28 August 2015 from
http://www.cla.auburn.edu/economics/assets/File/LaheyAgeDiscrimination.pdf.
Levinson, M. (2010): Social networking ever more critical to job search success.
Retrieved 28 August 2015 from http://www.cio.com/article/2417135/careers‐
staffing/social‐networking‐ever‐more‐critical‐to‐job‐search‐success.html.
Lopez Bóo, F., Rossi, M., Urzúa, S. (2013): The labor market return to an
attractive face: Evidence from a field experiment. Economics Letters, 118, 170–172.
Madera, J. M., Chang, W. (2011): Using Social Network Sites to Investigate
Employees in the Hospitality Industry. International CHRIE Conference‐Refereed
Track, 20.
Mauzer‐Fazio, M., Lei, L. (2015): “As rare as a panda.” How facial
attractiveness, gender, and occupation affect interview callbacks at Chinese firms.
International Journal of Manpower, 36, 68–85.
Mueller, G., Plug, E. (2006): Estimating the effect of personality on male and
female earnings. ILR Review, 60, 3–22.
Nikolaou, I. (2014): Social Networking Web Sites in Job Search and Employee
Recruitment. International Journal of Selection and Assessment, 22, 179–189.
Nyhus, E., Pons, E. (2005): The effects of personality on earnings. Journal of
Economic Psychology, 26, 363–384.
Pager, D. (2007): The use of field experiments for studies of employment
discrimination: contributions, critiques, and directions for the future. Annals of the
American Academy of Political and Social Science, 609, 104–133.
Pager, D., Quillian, L. (2005): Walking the talk? What Employers Say Versus
What They Do. American Sociological Review, 70, 355–380.
Preston, J. (2011): Social media history becomes a new job hurdle. Retrieved 28
August 2015 from http://www.nytimes.com/2011/07/21/technology/social‐media‐
history‐becomes‐a‐new‐job‐hurdle.html.
26
Rains, S. A., Brunner, S. R. (2015): What can we learn about social network sites
by studying Facebook? A call and recommendations for research on social network
sites. New Media & Society, 17, 114–131.
Riach, P. A., Rich, J. (2002): Field Experiments of Discrimination in the Market
Place. Economic Journal, 112, 480–518.
Rooth, D.‐O. (2009): Obesity, Attractiveness, and Differential Treatment in
Hiring: A Field Experiment. Journal of Human Resources, 44, 710–735.
Roth, P., Bobko, P., Van Iddekinge, C., Tatcher, J. (2013): Social Media in
Employee–Selection–Related Decisions: A Research Agenda for Uncharted
Territory. Journal of Management, 20, 1–30.
Roulin, N., Bangerter, A. (2013): Social Networking Websites in Personnel
Selection. A Signaling Perspective on Recruiters’ and Applicants’ Perceptions.
Journal of Personnel Psychology, 12, 143–151.
Ruffle, B., Shtudiner, Z. (2015): Are Good‐Looking People More Employable?
Management Science, 61, 1760–1776.
Shea, K., Wesley, J. (2006): How social networking sites affect students, career
services and employers. NACE Journal, 66, 26–32.
SHRM (2011): SHRM survey findings: The use of social networking websites and
online search engines in screening job candidates. Retrieved 28 August 2015 from
http://www.shrm.org/research/surveyfindings/articles/pages/theuseofsocialnetwo
rkingwebsitesandonlinesearchenginesinscreeningjobcandidates.aspx.
Slovensky, R., Ross, W. (2012): Should human resource managers use social
media to screen job applicants? Managerial and legal issues in the USA. Info, 14,
55–69.
Smith, W. P., Kidder, D. (2010): You’ve been tagged! (Then again, maybe not):
Employers and Facebook. Business Horizons, 53, 491–499.
27
Stone, B. (2006): Web of risks: Students adore social‐networking sites like
Facebook, but indiscreet postings can mean really big trouble. Newsweek, 148, 76.
Taubman, P. J., Wales, T. (1974): Higher Education and Earnings: College as an
Investment and Screening Device. Massachusetts: NBER Books.
Tufts, S. H., Jacobson, W. S., Stevens, M. S. (2015): Status Update: Social Media
and Local Government Human Resource Practices. Review of Public Personnel
Administration, 35, 193–207.
Verbeek, M. (2004): A Guide to Modern Econometrics. Chicester: John Wiley &
Sons Ltd.
Wilson, R. E., Gosling, S. D., Graham, L. T. (2012): A Review of Facebook
Research in the Social Sciences. Perspectives on Psychological Science, 7, 203–220.
Wood, M., Hales, J., Purdon, S., Sejersen, T., Hayllar, O. (2009): A test for racial
discrimination in recruitment practice in British cities. DWP Research Reports, 607.
Zeidner, R. (2007): How deep can you probe? HRMagazine, 52, 57–60.
Zhang, Y., Leung, L. (2015): A review of social networking service (SNS) research
in communication journals from 2006 to 2011. New Media & Society, 17, 1007–
1024.
28
AppendixA:AdditionalFiguresandTables
<Figure A.1 about here.>
<Figure A.2 about here.>
<Figure A.3 about here.>
<Figure A.4 about here.>
<Table A.1 about here.>
<Table A.2 about here.>
29
Figure A.1. Facial Picture 1.
Figure A.2. Facial Picture 2.
Figure A.3. Facial Picture 3.
Figure A.4. Facial Picture 4.
30
Table 1. Literature Review: Social Network Sites and Job Applicant Screening.
(1) (2) (3) (4) (5)
Study Country of data gathering
Year(s) of data gathering
Method of data gathering Main result(s)
Caers and Castelyns (2011)
Belgium 2010 Online questionnaire assessing 731 recruitment and selection professionals.
23.4% of the participants report that they look at personal Facebook profiles to screen job candidates. 34.2% of the participants report that they look at personal LinkedIn profiles to screen job candidates.b
Gibbs et al. (2015)
Canada and United States
2013a Online questionnaire assessing 292 human resource managers at large hotels.
23.2% of the participants report that they look at personal profile pages at SNWs to screen job candidates.
Madera and Chang (2011)
United States 2010a Paper and pencil questionnaire assessing 50 college recruiters, recruitment and selection professionals, operation managers and general managers.
50.0% of the participants report that they look at personal profile pages at SNWs to screen job candidates.
Nikolaou (2014) Greece 2009 and 2010 Online questionnaire assessing 122 recruitment and selection professionals.
8.1% of the participants report that they look at personal Facebook profiles to screen job candidates. 21.1% of the participants report that they look at personal LinkedIn profiles to screen job candidates.a,c
Roulin and Bangerter (2013)
France and Switzerlanda
2011a Online questionnaire assessing 96 recruitment and selection professionals.
19.8% of the participants report that they look at personal Facebook profiles to screen job candidates. 40.6% of the participants report that they look at personal LinkedIn profiles to screen job candidates.
Tufts et al. (2015)
United States 2012 and 2013 Online questionnaire assessing 48 human resource managers at local governments.
12.5% of the participants report that they look at personal profile pages at SNWs to screen job candidates.
Notes. aInformation (partly) gathered through email communication with (one of) the authors. b54.4% (48.3%) of the respondents are active Facebook (LinkedIn) users. 43.0% (70.9%) of them admit to use their Facebook (LinkedIn) accounts to screen job candidates. cAverage values over entry‐level, middle‐level and senior jobs.
31
Table 2. The Probability of Positive Call‐Back by Facebook Profile and Resume Pictures: Call‐Back
Rates.
(1) (2) (3) (4)
Positive call‐back rate Picture 1
Positive call‐back rate Picture 2
Positive call‐back rate Picture 3
Positive call‐back rate Picture 4
A. Positive call‐back sensu stricto
A.1. Pictures used as Facebook profile pictures 0.098 0.076 0.076 0.053
A.2. Pictures used as resume pictures 0.068 0.095 0.057 0.053
B. Positive call‐back sensu lato
B.1. Pictures used as Facebook profile pictures 0.227 0.193 0.227 0.170
B.2. Pictures used as resume pictures 0.189 0.204 0.186 0.148
32
Table 3. The Probability of Positive Call‐Back Sensu Stricto by Facebook Profile and Resume Pictures:
Positive Call‐Back Ratios.
(1) (2) (3) (4) (5) (6)
PCR Picture 1 versus Picture 2
PCR Picture 1 versus Picture 3
PCR Picture 1 versus Picture 4
PCR Picture 2 versus Picture 3
PCR Picture 2 versus Picture 4
PCR Picture 3 versus Picture 4
A. Pictures used as Facebook profile picture
A.1. All vacancies (N = 528) 1.300 [1.099]
1.300 [1.047]
1.857** [2.343]
1.000 [0.000]
1.429 [1.138]
1.429 [1.218]
A.2. Classified by education level of candidates
Middle‐educated (N = 264) 0.833 [0.339]
1.000 [0.000]
1.667 [0.825]
1.200 [0.444]
2.000 [1.015]
1.667 [0.828]
High‐educated (N = 264) 1.500 [1.539]
1.400 [1.217]
1.909** [2.246]
0.933 [0.254]
1.273 [0.693]
1.364 [0.942]
A.3. Classified by gender of recruiter
Female (N = 272) 1.545 [1.474]
2.079** [2.123]
1.767* [1.759]
1.345 [0.869]
1.143 [0.345]
0.850 [0.370]
Male (N = 192) 0.824 [0.364]
0.659 [0.825]
1.176 [0.739]
0.800 [0.581]
1.427 [0.601]
1.783 [1.400]
A.4. Classified by level of customer contact in the posted job
No intensive contact (N = 283) 1.371 [1.232]
1.452 [1.328]
1.995** [2.184]
1.058 [0.181]
1.455 [0.958]
1.375 [0.901]
Intensive contact (N = 245) 1.076 [0.141]
1.008 [0.016]
1.495 [0.848]
0.937 [0.221]
1.389 [0.631]
1.482 [0.756]
A.5. Classified by bottleneck status of occupation
No bottleneck (N = 385) 1.282 [0.909]
1.340 [1.065]
2.396** [2.546]
1.045 [0.169]
1.869* [1.691]
1.788 [1.544]
Bottleneck (N = 143) 1.394 [0.684]
1.183 [0.773]
1.113 [0.266]
0.848 [0.336]
0.798 [0.366]
0.940 [0.131]
B. Pictures used as resume picture
B.1. All vacancies (N = 528) 0.720 [1.202]
1.200 [0.577]
1.286 [0.950]
1.667** [2.194]
1.785** [1.984]
1.071 [0.198]
The positive call‐back ratio (PCR) is calculated by dividing the positive call‐back rate when using a particular picture by the corresponding positive call‐back rate when using another particular picture. T‐statistics, indicating whether the ratios are significantly different from 1 and based on standard errors corrected for clustering at the vacancy level, are between brackets. * (**) indicates significance at the 10% (5%) significance level. The number of jobs with a female or a male recruiter does not equal the total number of vacancies, as for some vacancies, we could not identify the gender of the recruiter.
33
Table 4. The Probability of Positive Call‐Back by Facebook Profile Picture: Regression Analysis.
(1) (2) (3) (4) (5) (6)
Picture 1 0.026* (0.014) 0.026* (0.014) 0.027* (0.014) 0.038** (0.019) 0.038** (0.019) 0.039** (0.020)
Picture 2 0.000 (0.011) 0.001 (0.011) 0.003 (0.011) 0.011 (0.017) 0.011 (0.018) 0.012 (0.018)
Picture 3 0.006 (0.010) 0.006 (0.010) 0.008 (0.010) 0.041** (0.021) 0.041** (0.021) 0.041** (0.021)
Application template Type A (normalised) 0.004 (0.007) 0.004 (0.007) 0.019 (0.012) 0.019 (0.012)
First application sent (normalised) ‐0.008 (0.007) ‐0.006 (0.007) 0.000 (0.012) 0.003 (0.012)
Picture 1 x High‐educated (normalised) 0.053** (0.027) 0.082** (0.036)
Picture 2 x High‐educated (normalised) 0.014 (0.020) 0.062* (0.035)
Picture 3 x High‐educated (normalised) 0.054*** (0.019) 0.125*** (0.038)
Picture 1 x Male recruiter (normalised) ‐0.042* (0.023) ‐0.046 (0.033)
Picture 2 x Male recruiter (normalised) 0.016 (0.020) 0.009 (0.033
Picture 3 x Male recruiter (normalised) ‐0.029 (0.020) ‐0.016 (0.037)
Picture 1 x Vacancy with intensive customer contact (normalised) ‐0.002 (0.028) 0.037 (0.037)
Picture 2 x Vacancy with intensive customer contact (normalised) ‐0.030 (0.020) ‐0.015 (0.035)
Picture 3 x Vacancy with intensive customer contact (normalised) ‐0.010 (0.018) 0.010 (0.038)
Picture 1 x Bottleneck occupation (normalised) ‐0.028 (0.023) ‐0.018 (0.037)
Picture 2 x Bottleneck occupation (normalised) ‐0.026 (0.021) ‐0.038 (0.040)
Picture 3 x Bottleneck occupation (normalised) 0.004 (0.019) 0.046 (0.044)
Constant 0.068*** (0.012) 0.068*** (0.012) 0.067*** (0.014) 0.182*** (0.019) 0.180*** (0.019) 0.171*** (0.020)
Dependent variable: positive call‐back sensu stricto Yes Yes Yes No No No
Dependent variable: positive call‐back sensu lato No No No Yes Yes Yes
Random effects at the vacancy level Yes Yes Yes Yes Yes Yes
F‐test for equality of coefficients for “Picture 1” and “Picture 2” (p‐value) 0.068 0.068 0.075 0.205 0.206 0.201
F‐test for equality of coefficients for “Picture 1” and “Picture 3” (p‐value) 0.101 0.100 0.107 0.909 0.909 0.906
F‐test for equality of coefficients for “Picture 2” and “Picture 3” (p‐value) 0.656 0.657 0.681 0.160 0.160 0.158
Observations 1,056 1,056 1,056 1,056 1,056 1,056
The presented results are linear probability model estimates with standard errors in parentheses. Except for the picture indicators, all variables are normalised by subtracting their mean value among the candidates with Picture 1, Picture 2 or Picture 3 as their Facebook profile picture. * (**) ((***)) indicates significance at the 10% (5%) ((1%)) significance level.
34
Table 5. The Probability of Positive Call‐Back by Facebook Profile and Resume Picture: Regression Analysis.
(1) (2) (3) (4)
Picture 1 0.027** (0.010) 0.027** (0.010) 0.039** (0.015) 0.039** (0.015)
Picture 2 0.026*** (0.010) 0.026*** (0.010) 0.035** (0.014) 0.035** (0.014)
Picture 3 0.013 (0.009) 0.013 (0.009) 0.040*** (0.015) 0.040*** (0.015)
Picture 1 x Used as Facebook profile picture (normalised) 0.002 (0.021) 0.001 (0.030)
Picture 2 x Used as Facebook profile picture (normalised) ‐0.047** (0.020) ‐0.047* (0.028)
Picture 3 x Used as Facebook profile picture (normalised) ‐0.012 (0.017) 0.002 (0.030)
Picture 1, Picture 2 or Picture 3 used as Facebook profile picture (normalised) ‐0.019 (0.016) ‐0.015 (0.023)
Pictures used as Facebook profile picture (normalised) 0.022 (0.017) 0.022 (0.017) 0.034 (0.027) 0.034 (0.027)
Constant 0.056*** (0.009) 0.056*** (0.009) 0.165*** (0.014) 0.165*** (0.014)
Dependent variable: positive call‐back sensu stricto Yes Yes No No
Dependent variable: positive call‐back sensu lato No No Yes Yes
Random effects at the vacancy level Yes Yes Yes Yes
F‐test for equality of coefficients for “Picture 1” and “Picture 2” (p‐value) 0.942 0.943 0.842 0.842
F‐test for equality of coefficients for “Picture 1” and “Picture 3” (p‐value) 0.129 0.129 0.905 0.905
F‐test for equality of coefficients for “Picture 2” and “Picture 3” (p‐value) 0.121 0.121 0.734 0.734
F‐test for equality of coefficients for “Picture 1 x Used as Facebook profile picture”, “Picture 2 x Used as Facebook profile picture” and “Picture 3 x Used as Facebook profile picture” (p‐value)
0.040 ‐ 0.181 ‐
Observations 2112 2112 2112 2112
The presented results are linear probability model estimates with standard errors in parentheses. Except for the picture indicators, all variables are normalised by subtracting their mean value among the candidates with Picture 1, Picture 2 or Picture 3 as their Facebook profile or resume picture. * (**) ((***)) indicates significance at the 10% (5%) ((1%)) significance level.

35
Table A.1. The Probability of Positive Call‐Back Sensu Lato by Facebook Profile and Resume Pictures:
Positive Call‐Back Ratios.
(1) (2) (3) (4) (5) (6)
PCR Picture 1 versus Picture 2
PCR Picture 1 versus Picture 3
PCR Picture 1 versus Picture 4
PCR Picture 2 versus Picture 3
PCR Picture 2 versus Picture 4
PCR Picture 3 versus Picture 4
A. Pictures used as Facebook profile picture
A.1. All vacancies (N = 528) 1.176 [1.092]
1.000 [0.000]
1.333** [1.974]
0.850 [1.149]
1.133 [0.768]
1.333* [1.847]
A.2. Classified by education level of candidates
Middle‐educated (N = 264) 1.000 [0.000]
1.250 [0.820]
1.333 [1.029]
1.250 [0.832]
1.333 [1.029]
1.067 [0.827]
High‐educated (N = 264) 1.290 [1.359]
0.909 [0.604]
1.333* [1.712]
0.705** [2.134]
1.033 [0.167]
1.467** [2.157]
A.3. Classified by gender of recruiter
Female (N = 272) 1.360 [1.558]
1.188 [0.875]
1.325 [1.461]
0.874 [0.674]
0.974 [0.111]
1.115 [0.470]
Male (N = 192) 0.873 [0.473]
0.688 [1.424]
1.037 [0.141]
0.788 [0.996]
1.189 [0.633]
1.508* [1.755]
A.4. Classified by level of customer contact in the posted job
No intensive contact (N = 283) 1.191 [0.898]
1.024 [0.130]
1.560** [2.076]
0.860 [0.760]
1.309 [1.089]
1.523* [1.918]
Intensive contact (N = 245) 1.162 [0.656]
0.972 [0.131]
1.153 [0.714]
0.837 [0.879]
0.992 [0.037]
1.186 [0.768]
A.5. Classified by bottleneck status of occupation
No bottleneck (N = 385) 1.128 [0.709]
1.029 [0.177]
1.361* [1.720]
0.911 [0.564]
1.206 [1.013]
1.323 [1.498]
Bottleneck (N = 143) 1.352 [0.987]
0.928 [0.263]
1.272 [0.970]
0.686 [1.341]
0.940 [0.177]
1.370 [1.105]
B. Pictures used as resume picture
B.1. All vacancies (N = 528) 0.926 [0.490]
1.020 [0.123]
1.282 [1.500]
1.102 [0.666]
1.385* [1.889]
1.256 [1.314]
The positive call‐back ratio (PCR) is calculated by dividing the positive call‐back rate when using a particular picture by the corresponding positive call‐back rate when using another particular picture. T‐statistics, indicating whether the ratios are significantly different from 1 and based on standard errors corrected for clustering at the vacancy level, are between brackets. * (**) indicates significance at the 10% (5%) significance level. The number of jobs with a female or a male recruiter does not equal the total number of vacancies, as for some vacancies, we could not identify the gender of the recruiter.

36
Table A.2. The Probability of Positive Call‐Back by Resume Picture: Regression Analysis.
(1) (2) (3) (4) (5) (6)
Picture 1 0.025 (0.015) 0.025 (0.015) 0.027 (0.016) 0.038* (0.023) 0.038* (0.023) 0.040* (0.023)
Picture 2 0.049*** (0.016) 0.049*** (0.016) 0.049*** (0.016) 0.059*** (0.022) 0.059*** (0.022) 0.059*** (0.022)
Picture 3 0.018 (0.014) 0.018 (0.014) 0.020 (0.014) 0.039* (0.021) 0.039* (0.022) 0.040* (0.022)
Application template Type A (normalised) ‐0.010 (0.010) ‐0.008 (0.011) ‐0.015 (0.014) ‐0.007 (0.015)
First application sent (normalised) ‐0.010 (0.010) ‐0.008 (0.011) ‐0.008 (0.014) ‐0.000 (0.014)
Picture 1 x High‐educated (normalised) 0.015 (0.024) 0.060 (0.040)
Picture 2 x High‐educated (normalised) ‐0.004 (0.034) 0.032 (0.039)
Picture 3 x High‐educated (normalised) 0.020 (0.021) 0.074* (0.038)
Picture 1 x Male recruiter (normalised) ‐0.019 (0.028) ‐0.045 (0.044)
Picture 2 x Male recruiter (normalised) ‐0.015 (0.032) ‐0.059 (0.040)
Picture 3 x Male recruiter (normalised) ‐0.019 (0.021) 0.007 (0.040)
Picture 1 x Vacancy with intensive customer contact (normalised) 0.018 (0.026) ‐0.004 (0.043)
Picture 2 x Vacancy with intensive customer contact (normalised) 0.028 (0.033) 0.006 (0.038)
Picture 3 x Vacancy with intensive customer contact (normalised) 0.019 (0.021) ‐0.041 (0.034)
Picture 1 x Bottleneck occupation (normalised) ‐0.030 (0.021) ‐0.019 (0.053)
Picture 2 x Bottleneck occupation (normalised) ‐0.049* (0.027) 0.001 (0.048)
Picture 3 x Bottleneck occupation (normalised) ‐0.032 (0.026) 0.005 (0.047)
Constant 0.045*** (0.013) 0.045*** (0.013) 0.044*** (0.013) 0.148*** (0.019) 0.148*** (0.019) 0.148*** (0.019)
Dependent variable: positive call‐back sensu stricto Yes Yes Yes No No No
Dependent variable: positive call‐back sensu lato No No No Yes Yes Yes
Random effects at the vacancy level Yes Yes Yes Yes Yes Yes
F‐test for equality of coefficients for “Picture 1” and “Picture 2” (p‐value) 0.126 0.126 0.148 0.378 0.381 0.421
F‐test for equality of coefficients for “Picture 1” and “Picture 3” (p‐value) 0.580 0.580 0.592 0.959 0.961 0.970
F‐test for equality of coefficients for “Picture 2” and “Picture 3” (p‐value) 0.016 0.016 0.020 0.341 0.342 0.374
Observations 1,056 1,056 1,056 1,056 1,056 1,056
The presented results are linear probability model estimates with standard errors in parentheses. Except for the picture indicators, all variables are normalised by subtracting their mean value among the candidates with Picture 1, Picture 2 or Picture 3 as resume picture. * (**) ((***)) indicates significance at the 10% (5%) ((1%)) significance level.