Do the Millionaires Still Live Next Door, or Have They Moved? Demographics of Millionnaires
51
By Pam Danziger, Unity Marketing & Ron Kurtz, American Affluence Research Center
-
Upload
pam-danziger -
Category
Marketing
-
view
327 -
download
0
Transcript of Do the Millionaires Still Live Next Door, or Have They Moved? Demographics of Millionnaires
By Pam Danziger, Unity Marketing &
Ron Kurtz, American Affluence Research Center

Despite rapid rates of growth in the wealth class, those who enjoy the highest net wealth today – top 10% of U.S. households based upon net worth which in 2013 starts at $941.7k or nearly $1 million – are choosing to continue to save and invest their wealth rather than spend it.
Since 1989, the share of the country’s wealth held by the top 10% wealthiest Americans rose from 66.8% to 75.3%.
While the rich got richer since 1989, with the sharpest rise since 2007, the bottom 90% of U.S. households with any savings saw their share of total wealth drop from just over one-third to less than one-fourth.
Copyright Unity Marketing, 2015 2
66.8% 67.0% 67.7% 68.6% 69.6% 69.4% 71.5% 74.6% 75.3%
33.2% 33.1% 32.2% 31.5% 30.4% 30.5% 28.5% 25.5% 24.7%
0.0%
10.0%
20.0%
30.0%
40.0%
50.0%
60.0%
70.0%
80.0%
1989 1992 1995 1998 2001 2004 2007 2010 2013
Source: Federal Reserve Bulletin 9/2014 & Unity Marketing
Wealth Shares by Wealth Percentile, 1989-2013
Top 10% Bottom 90%
The popular media is fascinated by how the rich live. Shows like the recent CNBC Secret Lives of the Super Rich and reality shows like Lifestyles of the Rich and Famous, Cribs, Real Housewives, and Rich Kids of Beverly Hills present an idealized and romanticized vision of the wealthy.
How well do you know and understand the wealthy? Is your brand’s marketing plan based upon the ‘conventional wisdom’ about the wealthy that you’ve seen on television and in magazines and newspapers? If so, your marketing program may well be filled with misconceptions, misunderstandings and myths that will derail your plans for growth.
3

Contrary to the way the media portrays millionaires as being conspicuous and ostentatious consumers, most millionaires really are like the people next door, as demonstrated by over 30 years of research by Thomas Stanley and William Danko, authors of “The Millionaire Next Door.”
The U.S. now has about 12 million households with a net worth of $1 million or more according to the latest Federal Reserve Board research. These are the wealthiest 10% of all households, based on net worth, and they account for about half of all consumer income.
4
“Creativity begins with the courage to challenge conventional wisdom,” says Ron Kurtz. He advises, “It’s time to challenge the conventional wisdom about wealthy Americans.”
Copyright Unity Marketing, 2015
?

Myths about Millionaires 1. Asian and other foreign markets are where
to look to find the most millionaires
2. Millionaires make lots of money
3. Millionaires live in big houses & drive late-model expensive cars
4. Millionaires inherit their wealth
5. Millionaires invest most of their money in the stock market
6. Millionaires know about luxury brands and price points
7. Millionaires shop at tony, high-end places
8. Millionaires don’t like to shop on the internet; They prefer to shop in stores
9. Millionaires don’t care about sales or discounts
10. Millionaires are conspicuous consumers who buy only the best, highest-priced brands
If you market a premium or
luxury product, or retail
such products, and you
believe any of the following
“myths” about millionaires,
your marketing program
and sources of data need to
be revisited and refined.
Over 10 years of research
by Unity Marketing and the
American Affluence
Research Center refutes
each of these common
myths about millionaires.
Copyright Unity Marketing, 2015 6

Myth #1: To find the most millionaires, look to the Asian markets – China, Japan, Hong Kong, Singapore.
Copyright Unity Marketing, 2015
7

News reports have focused
on the rapid growth in the
number of millionaires in
China and other developing
countries.
Despite rapid growth in the
number of millionaires,
China and every other
country in the world trails
the U.S. in total number of
millionaires.
Copyright Unity Marketing, 2015 8

Out of the total 122.5 million U.S. households, the top 10% -- 12.3 million – have a net worth of about $1 million. Specifically, the latest FRB reports that the top 10 percentile of net worth households (HNW – high net worth) in the U.S. starts at $941,700.
Combined the other top ten global markets have some 6.5 million. That is about half of the total millionaires in the U.S. market alone.
Copyright Unity Marketing, 2015 9
238
274
281
324
384
386
435
513
1,240
2,378
12,250
- 2,000 4,000 6,000 8,000 10,000 12,000 14,000
Hong Kong
France
Italy
Taiwan
Canada
Germany
Switzerland
United Kingdom
Japan
China
United States
in thousands
Source: BCG Global Wealth 2014 report & Federal Reserve
Bulletin vol. 100, no. 4
Millionaire Households

The United States is without doubt the most important market for luxury goods and services.
While the emerging luxury markets with their rapid growth, like China, make the news, the U.S. luxury market remains the world's largest many times over.
Not only does the U.S. have the greatest number of wealthy, the size of the U.S. luxury market, which reached €62,5 billion in 2013, is nearly 3.5 times larger than the next largest market, Japan. This according to estimates reported by Bain/Altagamma in their 2013 Luxury Worldwide Market Study.
Copyright Unity Marketing, 2015 10

Myth #2: Millionaires make lots of money.
Copyright Unity Marketing, 2015
?

The distribution of incomes among the top 10% net worth is surprising:
31% have HHI of less than $100,000, mostly the retired.
40% have HHI between $100k-$249,999, which fall within Unity Marketing’s HENRY income classification. But with their current levels of net worth, they more appropriately should be called HERNs – High Earners Rich Now.
Fewer than one-third have incomes of ultra-affluents, $250,000 and above.
The median income of all 12.3 million households with net worth at the top 10% is $184,400 (within the HENRY range) , while the average is $361,200. (Note: Average calculation is strongly impacted by extremes and outliers, while median is the midpoint in the range of all values)
Copyright Unity Marketing, 2015 12
31%
40%
30%
0%
5%
10%
15%
20%
25%
30%
35%
40%
45%
<$100,000 HENRYs ($100k-$249.9k) Ultra-affluents ($250k+)
Median HHI =$184,400 & Average HHI = $361,200
Source: Federal Reserve Board, 2013 Summary Extract Data
(SDA)
Top 10% Net Worth Household
Income
2013 (Top 10% HNW)
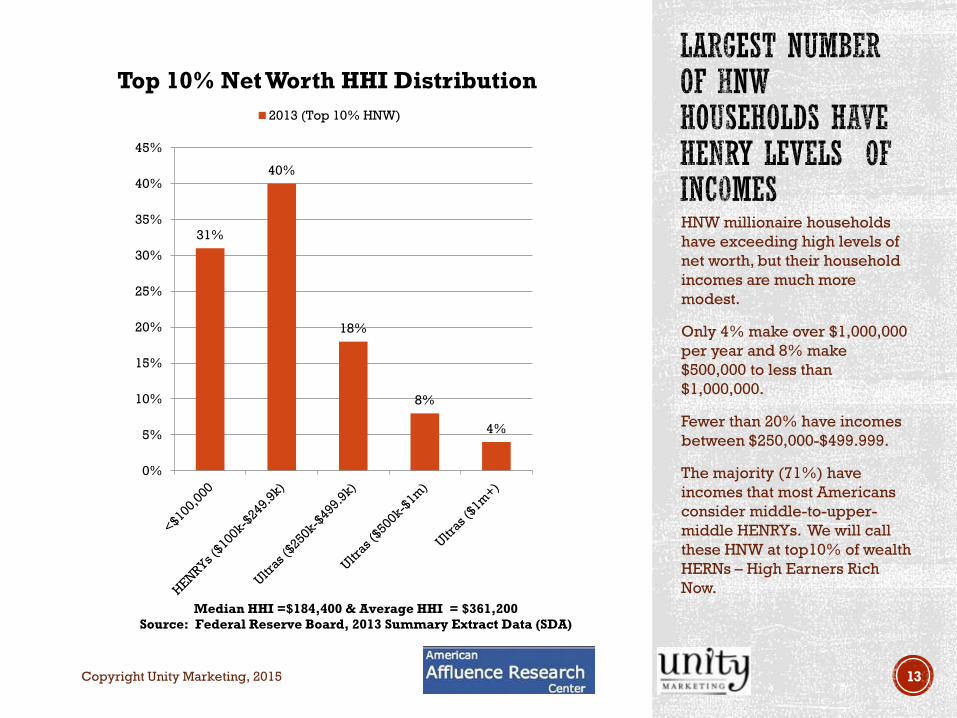
HNW millionaire households
have exceeding high levels of
net worth, but their household
incomes are much more
modest.
Only 4% make over $1,000,000
per year and 8% make
$500,000 to less than
$1,000,000.
Fewer than 20% have incomes
between $250,000-$499.999.
The majority (71%) have
incomes that most Americans
consider middle-to-upper-
middle HENRYs. We will call
these HNW at top10% of wealth
HERNs – High Earners Rich
Now.
Copyright Unity Marketing, 2015 13
31%
40%
18%
8%
4%
0%
5%
10%
15%
20%
25%
30%
35%
40%
45%
Median HHI =$184,400 & Average HHI = $361,200
Source: Federal Reserve Board, 2013 Summary Extract Data (SDA)
Top 10% Net Worth HHI Distribution
2013 (Top 10% HNW)

High levels of household incomes ($100k+) correlates with HNW ($1m+), but they are not one and the same.
Income is the value of money that is designated to be earned at any given point in time. It usually is a specific amount of money that is acquired in cycles or periods of time, i.e. annual earned income.
Wealth is money that is saved or stored. It is already earned and can be used anytime by its owner.
There has been much talk recently about ‘income inequality.’ For example those with incomes in the top 10% of U.S. households by income, which starts at $154,600 and with a median of $184,400 in 2013, account for slightly over half of all U.S. earned income.
By contrast, the top 10% HNW, measured by wealth which starts at $941,700, control some three-fourths of all the nation’s wealth.
Copyright Unity Marketing, 2015 14
47.3%
75.3%
52.7%
24.7%
0.0%
10.0%
20.0%
30.0%
40.0%
50.0%
60.0%
70.0%
80.0%
Distribution of Income Distribution of Wealth
Source: Federal Reserve Board Bulletin, September 2013
& Unity Marketing
Wealth Is More Concentrated
among Fewer Households than
Income Top 10% Bottom 90%

Myth #3: Millionaires live in mansions & drive the latest model luxury cars.
Copyright Unity Marketing, 2015
?
Copyright Unity Marketing, 2015 16
57.8%
7.7%
18.8%
31.4%
28%
15%
0.0% 10.0% 20.0% 30.0% 40.0% 50.0% 60.0% 70.0%
<$500,000
<$100,000
$100,000-$249,999
$250,000-$499,999
$500k-$999.9k
$1m+
Source: Federal Reserve Board Bulletin, September 2013 &
Unity Marketing
Primary Residence Home Value
2013 (Top 10% HNW)
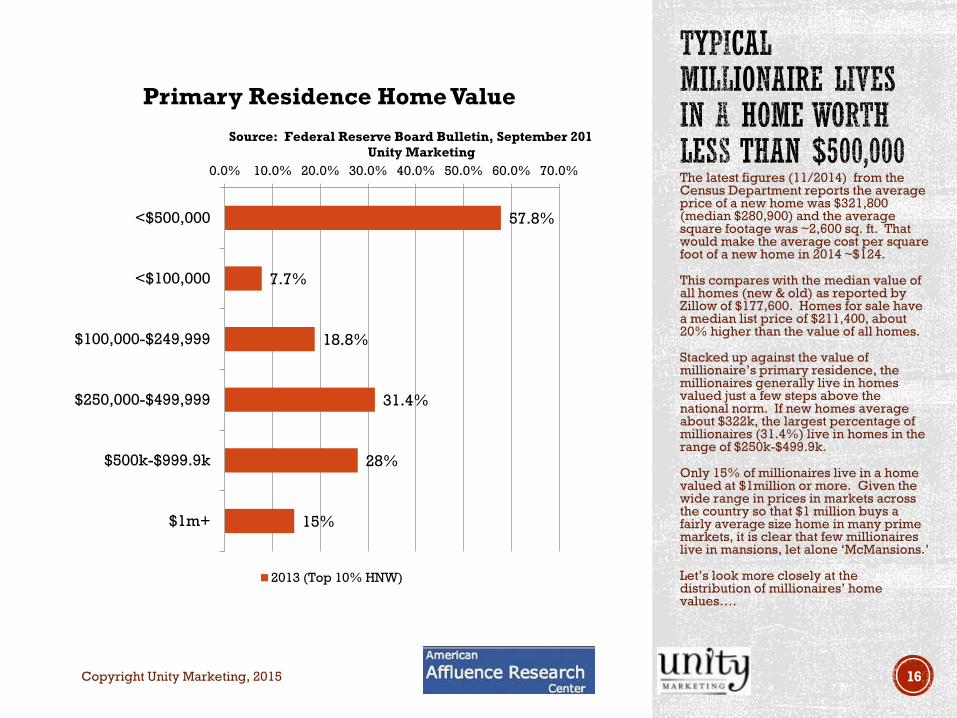
The latest figures (11/2014) from the Census Department reports the average price of a new home was $321,800 (median $280,900) and the average square footage was ~2,600 sq. ft. That would make the average cost per square foot of a new home in 2014 ~$124.
This compares with the median value of all homes (new & old) as reported by Zillow of $177,600. Homes for sale have a median list price of $211,400, about 20% higher than the value of all homes.
Stacked up against the value of millionaire’s primary residence, the millionaires generally live in homes valued just a few steps above the national norm. If new homes average about $322k, the largest percentage of millionaires (31.4%) live in homes in the range of $250k-$499.9k.
Only 15% of millionaires live in a home valued at $1million or more. Given the wide range in prices in markets across the country so that $1 million buys a fairly average size home in many prime markets, it is clear that few millionaires live in mansions, let alone ‘McMansions.’
Let’s look more closely at the distribution of millionaires’ home values….

Over one-fourth of
millionaires (27.1%) live in
a home valued between
$200k-$399.9k. That is
nearly twice as many
(14.2%) as live in a home
valued at $1 million or
more.
Copyright Unity Marketing, 2015 17
7.7%
11.7%
14.2%
12.9%
11.3%
9.0%
6.0%
5.3%
4.4%
3.1%
10.7%
2.2%
0.9%
0.3%
0.4%
0.0% 2.0% 4.0% 6.0% 8.0% 10.0% 12.0% 14.0% 16.0%
<$100,000
$100k-$199.9k
$200k-$299.9k
$300k-$399.9k
$400k-$499.9k
$500k-$599.9k
$600k-$699.9k
$700k-$799.9k
$800k-$899.9k
$900k-$999.9k
$1m-$1.9m
$2m-$2.9m
$3m-$3.9m
$4m-$4.9m
$5m+
Source: Federal Reserve Board, 2013 Summary Extract Data
(SDA) & Unity Marketing
Primary Residence Home Value
2013 (Top 10% HNW)

One out of every two millionaires drives a car model that is three-years or older. Slightly more than one-third own only one new car model two-years old or newer.
As for the total number of cars owned, the HNW average 2.2 cars owned. About two-thirds (63%) own two cars, while only about one-third own three or more cars.
These findings confirm statistics presented by Stanley and Danko in Millionaire Next Door which found that Fords, including the F-150 pickup trucks, Explorers and other Ford SUVs are the most popular makes among millionaires (9.4%) followed by Cadillacs (8.8%), Lincoln (7.8%) and a three-way tie at 6.4% each for Jeep, Lexus and Mercedes.
Overall 58% of millionaires in Stanley & Danko’s surveys drive American made cars.
Copyright Unity Marketing, 2015 18
54%
35%
10%
1%
0% 10% 20% 30% 40% 50% 60%
None
One only
Two
Three or more
Source: Federal Reserve Board, 2013 Summary Extract Data
(SDA) & Unity Marketing
Own Any Car/Truck/SUV No Older than Two
Years
2013 (Top 10% HNW)

Myth #4 -- Millionaires inherit their wealth.
Copyright Unity Marketing, 2015

Vast majority of millionaires (72%) are employed, about equally divided between self-employment and being employed by someone else.
The industries most millionaires work in include transportation, communications, utilities, wholesale trade, finance, insurance and real estate.
Numerous surveys show that those with HNW wealth assets tend to acquire them by working over their lifetime, rather than being born with a silver spoon in their mouth or a big fat trust fund in the bank.
A Fidelity Investments survey in 2012 found, that 86% of millionaires were self-made. Further they report “Most generated their wealth through careers in the technical, education, finance/accounting, and manufacturing/operations industries. Of those who are self-made, 30% report that they struggled financially growing up.”
PNC Wealth Management conducted a survey of people with more than $500,000 free to invest as they like. Only 6% of those surveyed got their money from inheritance alone. Some 69% earned their wealth, mostly by trading time and effort for money, or by “working.”
Copyright Unity Marketing, 2015 20
72%
28%
50%
47%
2%
15%
56%
29%
0% 10% 20% 30% 40% 50% 60% 70% 80%
Working
Retired/Disabled
Occupation Categories
Work for someone else
Self-employed/Partnership
Other
Industry
Mining/Construction/Manufacturing
Transportation/Communications/Ultilities/W…
Agriculture/Retail/Public Services & Adm
Source: Federal Reserve Board, 2013 Summary Extract Data (SDA) &
Unity Marketing
Labor Force Participation
2013 (Top 10% HNW)

Stanley and Danko were on
the money when they wrote
that the millionaires next
door “live well below their
means.”
It is a habit that can
transform the 40% of
millionaires who earn only
HENRY salaries into
millionaires as measured by
wealth.
Copyright Unity Marketing, 2015 21

Myth #5 -- Millionaires invest most of their money in the stock market.
Copyright Unity Marketing, 2015
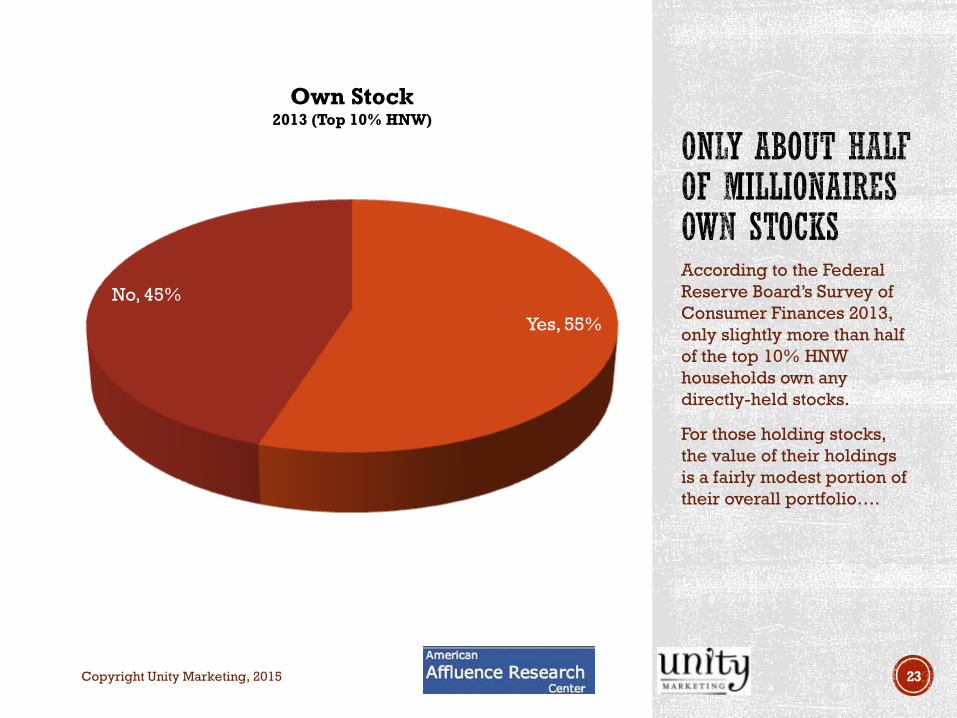
According to the Federal
Reserve Board’s Survey of
Consumer Finances 2013,
only slightly more than half
of the top 10% HNW
households own any
directly-held stocks.
For those holding stocks,
the value of their holdings
is a fairly modest portion of
their overall portfolio….
Copyright Unity Marketing, 2015 23
Yes, 55%
No, 45%
Own Stock 2013 (Top 10% HNW)
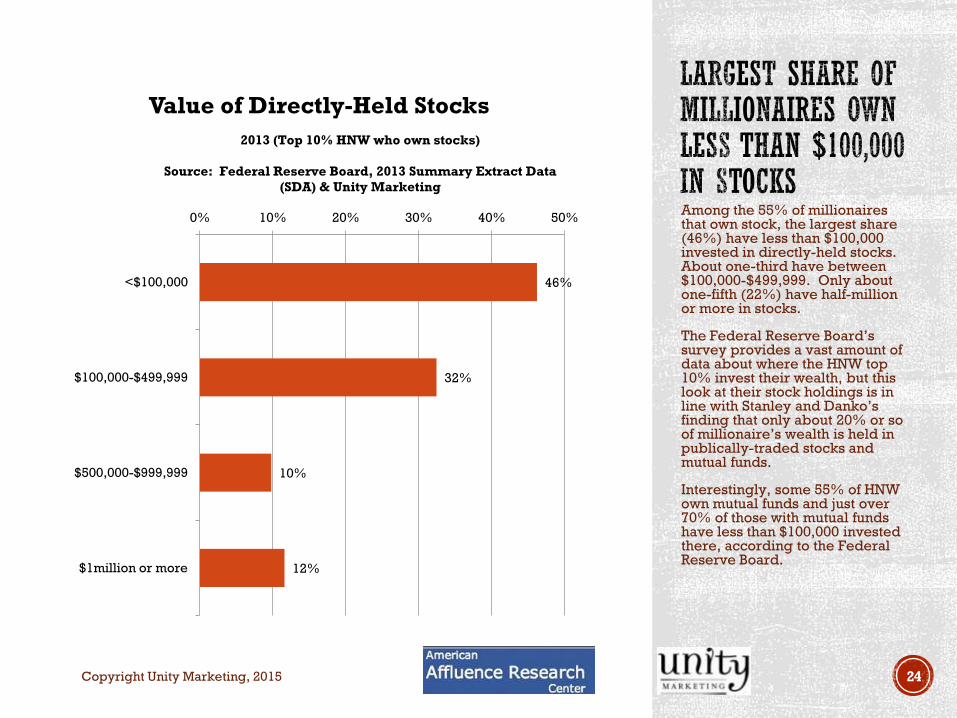
Among the 55% of millionaires that own stock, the largest share (46%) have less than $100,000 invested in directly-held stocks. About one-third have between $100,000-$499,999. Only about one-fifth (22%) have half-million or more in stocks.
The Federal Reserve Board’s survey provides a vast amount of data about where the HNW top 10% invest their wealth, but this look at their stock holdings is in line with Stanley and Danko’s finding that only about 20% or so of millionaire’s wealth is held in publically-traded stocks and mutual funds.
Interestingly, some 55% of HNW own mutual funds and just over 70% of those with mutual funds have less than $100,000 invested there, according to the Federal Reserve Board.
Copyright Unity Marketing, 2015 24
46%
32%
10%
12%
0% 10% 20% 30% 40% 50%
<$100,000
$100,000-$499,999
$500,000-$999,999
$1million or more
2013 (Top 10% HNW who own stocks)
Source: Federal Reserve Board, 2013 Summary Extract Data
(SDA) & Unity Marketing
Value of Directly-Held Stocks
Myth #6 -- Millionaires know about luxury brands and price points.
Copyright Unity Marketing, 2015

44%
38% 37% 37%
34%
29% 28% 28% 28% 27% 25%
21% 21%
17% 15% 14%
12%
0%
5%
10%
15%
20%
25%
30%
35%
40%
45%
50%
0%
10%
20%
30%
40%
50%
60%
70%
80%
90%
AVG. INCOME $295,000; AVG. NET WORTH $3.1 MILLION; AVG. PRIMARY
RESIDENCE $1.3 MILLION
SOURCE: AMERICAN AFFLUENCE RESEARCH CENTER & UNITY
MARKETING
N=327 WITH MINIMUM NET WORTH $800K (TOP 10% WEALTHIEST)
Luxury Brands & How They Rate Owned or experienced past 5 years Familiar with or have knowledge of
Believe to be Over-rated
The HNW top 10% generally believe many luxury brands are overrated, brands like Louis Vuitton, Gucci, Hermes, Prada, Rolex, according to a survey done by American Affluence Research Center and analysis conducted by Unity Marketing.
Through regression analysis, we found that about 70-80% of the wealthy consumers’ rating is tied to their level of experience (i.e. owned or experienced in past 5 years) and knowledge of the specific brand (i.e. familiar with of have knowledge of).
Further, looking at each multiple in the analysis that drives the rating (i.e. personal experience/ownership alone and just knowledge of the brand like you’d get through marketing communication), there isn’t much difference between the two.
Few millionaires own many of the most well-known luxury brands, such as Louis Vuitton, Gucci, Hermes. These findings reflect Stanley and Danko’s conclusion that the typical millionaire is ‘frugal, frugal, frugal,’ with a lifestyle that doesn’t include most luxury brands.
Copyright Unity Marketing, 2015 26

Myth #7 -- Millionaires shop at tony, high-end places.
Copyright Unity Marketing, 2015

The number one shopping destination for the HNW ($1 million or more in investible wealth), as well as all the other affluents included in Unity Marketing’s Affluent Consumer Tracking Study (ACTS) shopper track in 2014 was the Internet, followed ,by discount department stores and regular department stores, tied for third.
While the HNW (which roughly corresponds to the top 10% wealthiest) shop more often than LNW (i.e. low-net-worth with less than $1 million in investible assets) at luxury department stores (53%) as compared with 39% among the LNW in the survey, the fact is nearly half (47%) of the HNW reported no patronage in this class of stores during the three-month study period, which includes Neiman Marcus, Nordstrom, Saks 5th Avenue, Bloomingdale’s, Lord and Taylor and others. Even fewer of the HNW shopped in a luxury-branded boutique, only about one-fourth.
The simple fact is, HNW shoppers patronize all the same kind of stores that everybody else does. They don’t discriminate and shop only or mainly high-end. They shop discount and mass as well.
The chart to the left also shows the error of the next two widely held myths of the wealthy….
Copyright Unity Marketing, 2015 28
66%
65%
59%
53%
74%
24%
20%
67%
62%
56%
53%
47%
48%
44%
42%
38%
36%
31%
29%
29%
26%
24%
22%
0% 10% 20% 30% 40% 50% 60% 70% 80%
General Merchandise Store
Discount department stores
Department stores or websites
Warehouse clubs
Luxury department stores or websites
Internet/Direct-of-Consumer
Internet or Online websites
Direct mail catalogs
TV Shopping
Specialty Stores & Websites
Clothing and/or fashion accessories …
Home improvement stores, …
Personal care, beauty, cosmetics
Electronics and/or computer …
Home specialty stores
Liquor/wine stores and/or wineries
Craft & hobby stores
Book, record, video stores
Kitchenwares or tabletop stores
Gift specialty stores and boutiques
Toy stores
Jewelry stores
Appliance, Bath/Kitchen Remodeling
Luxury-brand boutiques
Sunglass or optical specialty stores
Art galleries, custom-framing, art …
Source: Unity Marketing Affluent Consumer Tracking Study
2014 Shopper Track
Shopping Destinations
2014 HNW (n=610) 2014 LNW (n=720)

Myth #8 -- Millionaires don’t like to shop on the internet; They prefer to shop in stores.
Copyright Unity Marketing, 2015

Based on Unity Marketing’s
ACTS Shopper Track
survey, HNW millionaires
shop most often online and
they are more active using
online to shop than their
LNW counterparts.
Further, the HNW spent
more than twice as much
during their last online
shopping experience
($597) than LWN ($226).
Copyright Unity Marketing, 2015 30
74%
22%
18%
11%
8%
14%
0% 10% 20% 30% 40% 50% 60% 70% 80%
Any Internet Shopping
Once or twice
Three or four
Five or six
Seven to ten
Eleven or more
Source: Unity Marketing Affluent Consumer Tracking Study
2014 Shopper Track
Number of Times Shopped Internet Last
Three Months
2014 HNW (n=610) 2014 LNW (n=720)

Another interesting finding from the Unity Marketing survey is that the HNW online shoppers are twice as likely as the LNW shoppers to say they shop online for fun or recreation.
Their favorite online shopping destinations? Number one is Amazon.com, followed by Ebay.com, Groupon.com, Zappos.com and Overstock.com. In shopping at luxury department store websites millionaires rank Nordstrom.com number one, followed in order by:
#1 – Nordstrom.com
#2 -- Bloomingdales.com
#3 -- SaksFifthAve.com
#4 -- BergdorfGoodman.com
#5 -- NeimanMarcus.com
#6 – Barneys.com and
#7 -- Lord&Taylor.com
Copyright Unity Marketing, 2015 31
51%
26%
25%
17%
13%
8%
50%
24%
13%
17%
8%
5%
0% 10% 20% 30% 40% 50% 60%
Needed to find an item/items or make
a specific purchase
Because of a special sale or discount
offered
Shopping for fun or recreation
To buy a gift
Impulse or last-minute shopping
experience
To get new ideas and inspiration
Source: Unity Marketing Affluent Consumer Tracking Study
2014 Shopper Track
Reasons for last online shopping
experience....
2014 HNW (n=610) 2014 LNW (n=720)

Myth #9 -- Millionaires don’t care about sales or discounts.
Copyright Unity Marketing, 2015

Since millionaires shop where everybody else does too, it is no surprise that patronage at these major discount retailers is as high for HNW millionaires are for the LNW, and in some cases, namely TJ Maxx, millionaires shop more actively at this store.
Other than Kohl’s, which is the only store with statistically-significant less patronage by millionaires, for all others, HNW and LNW shop equally at Target, Costco, Wal-Mart and Sam’s Club.
Copyright Unity Marketing, 2015 33
31%
25%
21%
19%
17%
12%
33%
25%
23%
24%
13%
10%
0% 5% 10% 15% 20% 25% 30% 35%
Target
Costco
Wal-Mart
Kohls
TJ Maxx
Sam's Club
Source: Unity Marketing Affluent Consumer Tracking Study
2014 Shopper Track
Discount Stores Shopped in Last
Three Months
2014 HNW (n=610) 2014 LNW (n=720)
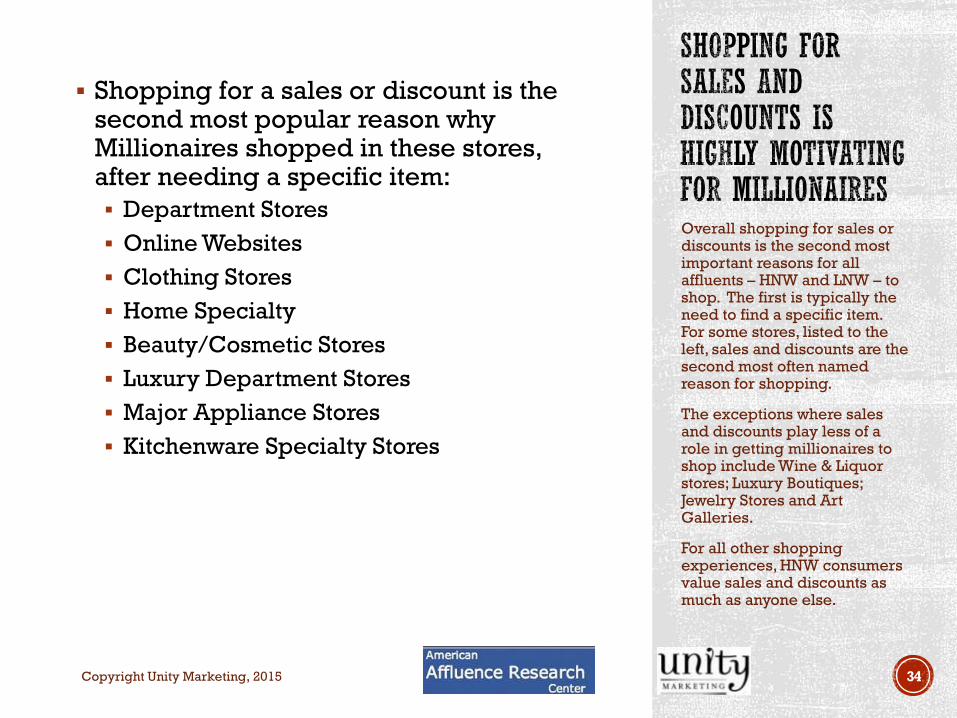
Shopping for a sales or discount is the second most popular reason why Millionaires shopped in these stores, after needing a specific item:
Department Stores
Online Websites
Clothing Stores
Home Specialty
Beauty/Cosmetic Stores
Luxury Department Stores
Major Appliance Stores
Kitchenware Specialty Stores
Overall shopping for sales or discounts is the second most important reasons for all affluents – HNW and LNW – to shop. The first is typically the need to find a specific item. For some stores, listed to the left, sales and discounts are the second most often named reason for shopping.
The exceptions where sales and discounts play less of a role in getting millionaires to shop include Wine & Liquor stores; Luxury Boutiques; Jewelry Stores and Art Galleries.
For all other shopping experiences, HNW consumers value sales and discounts as much as anyone else.
Copyright Unity Marketing, 2015 34

#10 -- Millionaires are conspicuous consumers who buy only the best, highest-priced brands.
Copyright Unity Marketing, 2015

In a recent American Affluence Research Center survey of wealthy consumers (top 10% of U.S. households based on wealth with a minimum of $800k net worth) were asked what was the most that they could imagine spending for a range of luxuries.
The chart to the left reveals what the consensus of the most wealthy consumers said they would pay. The median amount and the highest value reported in the survey are shown.
The reality of their expected spending is quite modest, e.g. a median of $300 per night for a room at a Caribbean resort or hotel room in NYC. The survey’s maximum amounts are also shown in the chart to the left, which is more in line with what various luxury marketers hope that their wealthy customers will spend.
The gap between what they expect to spend and the maximum is huge.
Copyright Unity Marketing, 2015 36
$300
$300
$300
$1,500
$1,500
$1,000
$200
$1,000
$130
$40
$125
$3,000
$10,000
$1,000
$10,000
$7,500
$30,000
$2,000
$25,000
$20,000
$25,000
$1,000
$0 $10,000 $20,000 $30,000
Room in winter in Caribbean resort
(per night)
European cruise (per person per
night)
Hotel room in NYC for vacation (per
night)
Refrigerator
Washer/Dryer set
Mattress king-sized
Linens set for kind-sized bed
Watch for dressy occasions
Watch for everyday
Wine bottle for special dinner at
home
Sunglass frames
Source: American Affluence Research Center Affluent Market
Tracking Study
What the Wealthy Expect to Pay for Luxury
Median Maximum

The consumers’ age and life stage are highly predictive of when consumer expenditures will reach their highest level in specific categories.
The graph to the left by economist Harry Dent, author of the Demographic Cliff, shows the age at which people’s spending peaks in key categories. For example, consumers aged 46 typically spend the most on furniture; those aged 53 spend most on automobiles. Note: this chart shows the age when people’s level of spending reaches its highest level. They may well make purchases in these categories before and after.
Unity Marketing’s Affluent Consumer Tracking Study (ACTS) shows consistently higher levels of spending on luxury among young affluents (24-44 years) than mature affluents (45-70 years).
Wealth correlates with age too, rising as people get older….
Copyright Unity Marketing, 2015 37
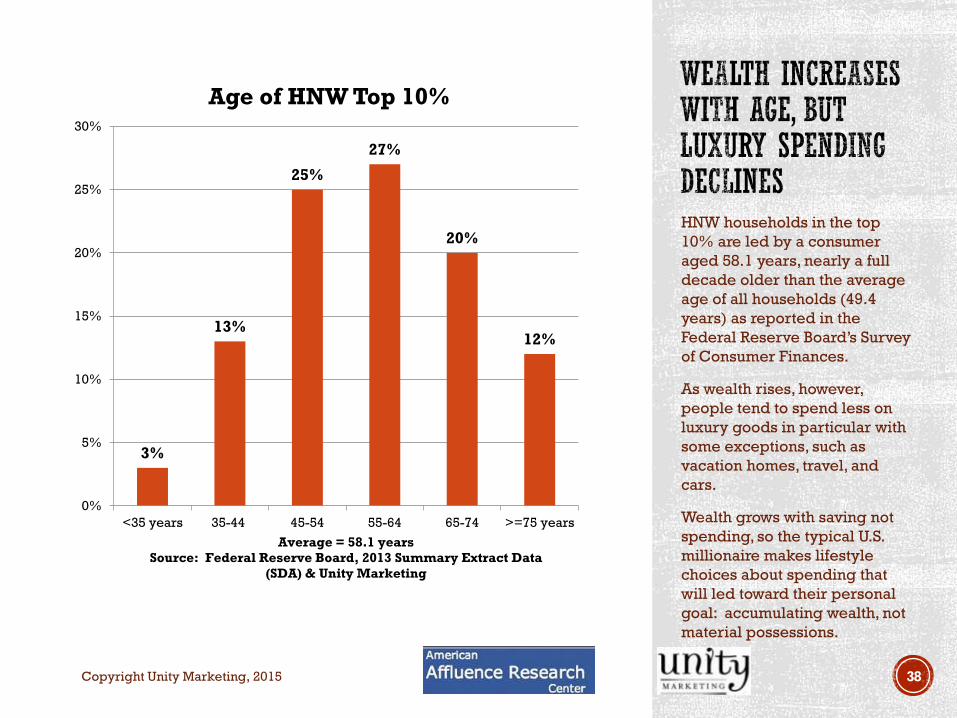
HNW households in the top
10% are led by a consumer
aged 58.1 years, nearly a full
decade older than the average
age of all households (49.4
years) as reported in the
Federal Reserve Board’s Survey
of Consumer Finances.
As wealth rises, however,
people tend to spend less on
luxury goods in particular with
some exceptions, such as
vacation homes, travel, and
cars.
Wealth grows with saving not
spending, so the typical U.S.
millionaire makes lifestyle
choices about spending that
will led toward their personal
goal: accumulating wealth, not
material possessions.
Copyright Unity Marketing, 2015 38
3%
13%
25%
27%
20%
12%
0%
5%
10%
15%
20%
25%
30%
<35 years 35-44 45-54 55-64 65-74 >=75 years
Average = 58.1 years
Source: Federal Reserve Board, 2013 Summary Extract Data
(SDA) & Unity Marketing
Age of HNW Top 10%

Millionaires haven’t moved, but still live well below their means next door.
Copyright Unity Marketing, 2015

In Drs. Stanley and Danko’s research, and in this research, as well as that of American Affluence Research Center’s over the past 12 years, we have found there are certain important attributes that most millionaires share.
These attributes include:
• Millionaires live within their means.
• They are careful shoppers who look for good quality and value.
• They are aggressive savers. Stanley & Danko call them PAWs- Prodigious Accumulators of Wealth
• They have limited experience with true luxury retailers and brands.
40

The challenge for luxury brands is to tell a ‘new story’ to the affluent, one that matters to them and makes them notice. And it isn’t the kind of brand messaging we see
from brands like LV, Gucci, Hermes, Prada, and Rolex focused on status and featuring young, beautiful, thin people.
To create a positive impression brands need to connect with the wealthy with stories that have meaning to them at their life stage. These will be messages that educate the affluent about why the brand and its products represent good value and merit being purchased.
How does your luxury brand rate? This is a simple analysis but it points to an
important finding for all brands that aim to attract the wealthy with money to spend on luxury goods and services. You got to tell the right branding stories to the right people (i.e. the wealthy) and many brands are missing the mark.
Further brand impressions are as important in driving positive feelings as actual customer experiences. That makes the job of marketers and their advertising agencies extremely important. They have to position and communicate the brand's values and qualities in the proper light.
Luxury brands need to tell a
‘new story’ to the wealthy, the
consumer segment that matters
most because they have the
wealth and ability to spend.
And it isn’t the kind of brand
messaging we see from brands
like LV, Gucci, Hermes, Rolex
focused on status and featuring
young, beautiful, thin people.
Copyright Unity Marketing, 2015 41

An upcoming special investigation into the lifestyles, mindset and consumer behavior of millionaires, high-net-worth and ultra-high-net worth consumers
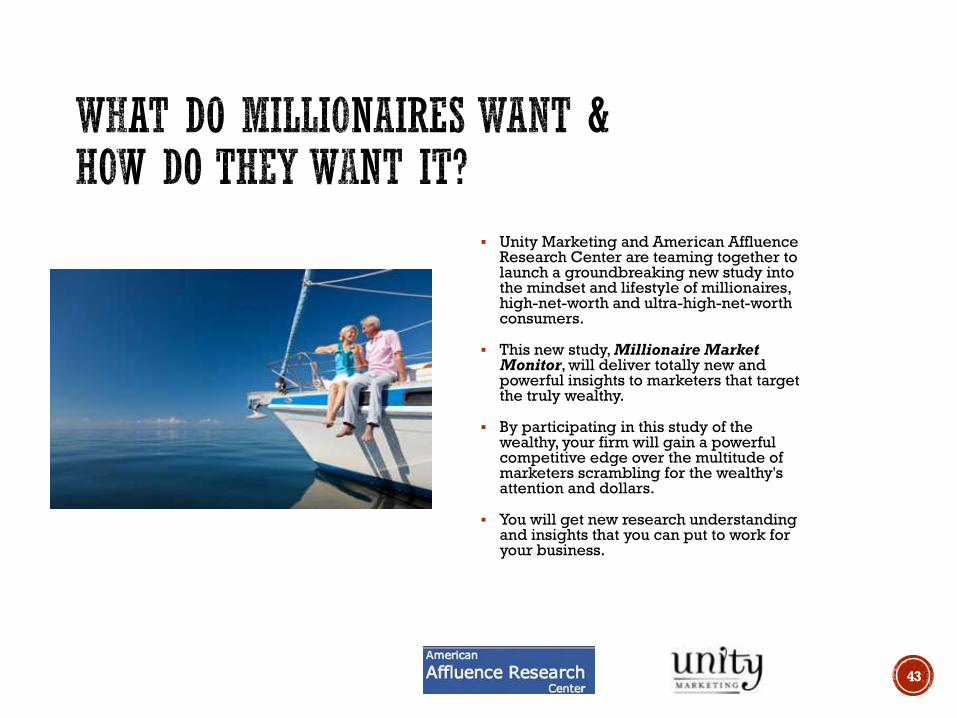
Unity Marketing and American Affluence Research Center are teaming together to launch a groundbreaking new study into the mindset and lifestyle of millionaires, high-net-worth and ultra-high-net-worth consumers.
This new study, Millionaire Market Monitor, will deliver totally new and powerful insights to marketers that target the truly wealthy.
By participating in this study of the wealthy, your firm will gain a powerful competitive edge over the multitude of marketers scrambling for the wealthy's attention and dollars.
You will get new research understanding and insights that you can put to work for your business.
43
1. Millionaires Only Other research of the affluent is not focused
exclusively on millionaires.
2. Truly Wealthy Net worth is a more stable indicator of wealth than
income.
3. Unique Methodology Our methodology which focuses on precise sample
selection and survey techniques that maximize response rates from HNW consumers avoids the problems associated with most other research studies of the affluent.
4. True & Validated Insights The media and other research portrays the wealthy in
a very misleading way. They ‘spin’ while we will deliver the truth.
5. Real Data “Big Data” cannot identify millionaires and thus
provide real insight into their behavior and thinking.
6. Your Questions Answered As a sponsor, you can influence the content of the
questionnaire.
44

Get the information about the wealthy that will move your business forward into this powerful consumer market segment. Do you need to know more about:
Millionaire's investment and money management strategies
Consumer purchases, what they buy, what they spend on their homes (furniture, decorating, art), themselves (fashion, jewelry), and others (gifts and gifting)
Brand awareness, brand usage, how brands influence them in their purchase decisions
Shopping behavior, where they shop (online vs. in store), what shopping experiences they like most, their favorite stores and places to shop
Lifestyles, aspirations and where they invest their time and money (travel, collecting, wine & spirits, country clubs, philanthropy, culture and the arts, health & wellness)
Attitudes and values (what luxury means to them, financial values and financial well being, attitudes about spending vs. investing)
Role of internet and social media in their lives, how they stay current and their media habits
Demographics of millionaires, HNW and UHNW and key distinctions and differences (employment, gender, age, homes)
45

The study will be fielded in early 2015 among a representative sample of Millionaires, those High-Net-Worth (HNW) and Ultra-High-Net-Worth (UHNW) consumers.
These consumers represent the best target customers for high-end luxury goods and services companies.
The survey will be conducted by mail among a sample of 4,500 households identified by AARC's exclusive targeting system which identifies consumers who meet our wealth criteria -- households with net worth of $1 million or more. This assures a reliable completed sample size.
46

Study sponsors will guide and direct the Millionaire Market Monitor research study.
Study sponsors will:
Define the survey scope and objectives
Set the time frame
Determine what questions are asked
Establish the parameters for the research investigation
Unity Marketing and American Affluence Research Center will support the study’s sponsors to make sure that their specific needs are addressed in the study.
47

Input into survey questions and additions of brands, terms, values where appropriate
Topline cross tab reports of each survey question and tabulated results by key demographics, such as
Gender
Age
Net Worth (HNW & UHNW) & Investable Assets
Home Value
Others to be determined
Detailed Millionaire Market Monitor analysis report
Personal executive summary webinar presentation of major findings and implications for your business conducted by Pam Danziger, Unity Marketing and Ron Kurtz, American Affluence Research Center
48
The sponsorship fees are applied toward the direct cost of fielding this study, which includes list acquisition, survey printing and mailing, data entry and compilation and delivery.
The fee for sponsorship of the Millionaire Market Monitor study will be dependent upon the total number of companies that participate in the study.
Our goal is to target a sponsorship fee of $2,500-$3,500. The sponsorship fee will be used to set the final subscription price for the resulting study, with the final published price being 10-15% more than the sponsorship fee.
That is, your company will benefit by sponsoring the study, rather than waiting for it to be published. If the sponsorship fee is $3,500, then the published cost of the study will be $3,995 or higher.
Net/Net: If you want and need this information about millionaire and HNW consumers, then it is a ‘no-brainer’ that you participate as a sponsor for the study.
Sponsorship will assure that your specific information needs are met in the research study.
Call Pam Danziger @ 717.336.1600 to discuss your information needs.
49

Pam Danziger is an internationally recognized expert in business insights for marketers targeting the upper-middle and affluent consumer segment. Pam is president of Unity Marketing, a boutique marketing consulting firm founded in 1992.
Leadership in luxury marketing recognized through Global Luxury Award presented by Harper’s Bazaar, London May 2007.
Luxury Daily named Pam to its list of "Women to Watch in 2013." She is a member of Jim Blasingame: The Small Business Advocate’s Brain Trust and a contributing columnist to The Robin Report.
Latest book, Putting the Luxe Back in Luxury: How New Consumer Values Are Redefining the Way We Market Luxury.
Previous books, Shopping: Why We Love It, Let Them Eat Cake: Marketing Luxury to the Masses as well as the Classes & Why People Buy Things They Don’t Need
50

Prior to starting AARC in 2001, Ron’s experience included 20 years in executive positions in the airline, cruise, and hotel industries and 13 years as a strategic marketing consultant.
Ron earned his MBA degree at Harvard Business School and a BBA degree at the University of Texas. A frequent writer for trade publications and speaker at industry functions, he has specialized in and researched the affluent market since 1982.
He is the author of the book Market Research: Strategy and Techniques, published by the American Management Association.
Ron has been a featured speaker at conferences for the cruise, residential resort, fractional ownership, realtor, travel agent, investment, and luxury industries.
AARC is unique in that it focuses on the wealthiest 10% of U.S. households, based on net worth. AARC is also somewhat unique in using mail surveys sent to a random projectable sample, a research methodology that provides several advantages over other research among the affluent that is typically done through online panels.
AARC is the only source of mailing lists that uses research surveys to profile the attributes of the data base from which names are drawn and to validate and refine formulas for identifying the affluent in a highly targeted and uniquely accurate manner.
51