
DO RESOURCES FLOW TO PATENTING FIRMS? … in employment and a 1.3% increase in the capital stock....
59
Unclassified ECO/WKP(2014)23 Organisation de Coopération et de Développement Économiques Organisation for Economic Co-operation and Development ___________________________________________________________________________________________ _____________ English - Or. English ECONOMICS DEPARTMENT DO RESOURCES FLOW TO PATENTING FIRMS? CROSS-COUNTRY EVIDENCE FROM FIRM LEVEL DATA ECONOMICS DEPARTMENT WORKING PAPERS No. 1127 By Dan Andrews, Chiara Criscuolo and Carlo Menon OECD Working Papers should not be reported as representing the official views of the OECD or of its member countries. The opinions expressed and arguments employed are those of the author(s). Authorised for publication by Jean-Luc Schneider, Deputy Director, Policy Studies Branch, Economics Department. All Economics Department Working Papers are available through OECD internet website at www.oecd.org/eco/workingpapers Complete document available on OLIS in its original format This document and any map included herein are without prejudice to the status of or sovereignty over any territory, to the delimitation of international frontiers and boundaries and to the name of any territory, city or area. ECO/WKP(2014)23 Unclassified English - Or. English
Transcript of DO RESOURCES FLOW TO PATENTING FIRMS? … in employment and a 1.3% increase in the capital stock....

Unclassified ECO/WKP(2014)23 Organisation de Coopération et de Développement Économiques Organisation for Economic Co-operation and Development
___________________________________________________________________________________________
_____________ English - Or. English ECONOMICS DEPARTMENT
DO RESOURCES FLOW TO PATENTING FIRMS? CROSS-COUNTRY EVIDENCE FROM FIRM
LEVEL DATA
ECONOMICS DEPARTMENT WORKING PAPERS No. 1127
By Dan Andrews, Chiara Criscuolo and Carlo Menon
OECD Working Papers should not be reported as representing the official views of the OECD or of its member
countries. The opinions expressed and arguments employed are those of the author(s).
Authorised for publication by Jean-Luc Schneider, Deputy Director, Policy Studies Branch, Economics
Department.
All Economics Department Working Papers are available through OECD internet website at
www.oecd.org/eco/workingpapers
Complete document available on OLIS in its original format
This document and any map included herein are without prejudice to the status of or sovereignty over any territory, to the delimitation of
international frontiers and boundaries and to the name of any territory, city or area.
EC
O/W
KP
(20
14)2
3
Un
classified
En
glish
- Or. E
ng
lish

ECO/WKP(2014)23
2
OECD Working Papers should not be reported as representing the official views of the OECD or of its member countries. The opinions expressed and arguments employed are those of the author(s).
Working Papers describe preliminary results or research in progress by the author(s) and are published to stimulate discussion on a broad range of issues on which the OECD works.
Comments on Working Papers are welcomed, and may be sent to OECD Economics Department, 2 rue André-Pascal, 75775 Paris Cedex 16, France, or by e-mail to [email protected]
This document and any map included herein are without prejudice to the status of or sovereignty over any territory, to the delimitation of international frontiers and boundaries and to the name of any territory, city or area.
© OECD (2014)
You can copy, download or print OECD content for your own use, and you can include excerpts from OECD publications, databases and multimedia products in your own documents, presentations, blogs, websites and teaching materials, provided that suitable acknowledgment of OECD as source and copyright owner is given. All requests for commercial use and translation rights should be submitted to [email protected]

ECO/WKP(2014)23
3
ABSTRACT/RESUMÉ
Do resources flow to patenting firms? Cross-country evidence from firm level data
This paper exploits longitudinal data on firm performance and patenting activity for 23 OECD countries
over the period 2003-2010 to explore the extent to which changes in the patent stock are associated with
flows of capital and labour to patenting firms. While the finding that patenting is associated with real
changes in economic activity at the firm level is in line with recent literature, new empirical evidence
presented suggests that the impact of patenting on firm size is likely to be causal. Moreover, these data
reveal important differences across OECD countries in the extent to which innovative firms can attract the
complementary tangible resources that are required to implement and commercialise new ideas. In turn, the
contribution of framework policies to explaining the observed cross-country differences in the magnitude
of these flows is explored. While further research is required to establish causality, the results are
consistent with the idea that well-functioning product, labour and capital markets; efficient judicial systems
and bankruptcy laws that do not overly penalise failure can raise the returns to innovative activity. The
paper also investigates the heterogeneous impacts of policies and finds that young firms – which are more
likely to experiment with disruptive technologies and rely on external financing to implement and
commercialise their ideas – disproportionately benefit from reforms to labour markets and more developed
markets for credit and seed and early stage finance.
JEL classification codes: O30, O31, O33, O34, L25
Keywords: Innovation, patents, reallocation, firm growth.
***********************
Les ressources convergent-elles vers les entreprises brevetantes ? Éléments de comparaison entre pays à
partir de données au niveau des entreprises
Cette étude tire parti de données longitudinales sur les performances et l’activité de brevetage d’entreprises
de 23 pays membres de l’OCDE sur la période 2003-2010 pour examiner dans quelle mesure des
évolutions du stock de brevets sont associées à des flux de capitaux et de main-d’oeuvre en direction des
entreprises brevetantes. Si l’observation que le brevetage est associé à des évolutions réelles de l’activité
économique au niveau de l’entreprise concorde avec les publications récentes, les nouvelles observations
empiriques présentées ici donnent à penser qu’il existe vraisemblablement un lien de causalité entre le
dépôt de brevets et la taille de l’entreprise. De plus, ces données font apparaître d’importantes différences
entre pays de l’OCDE quant à la mesure dans laquelle les entreprises innovantes peuvent attirer les
ressources corporelles complémentaires requises pour mettre en oeuvre et commercialiser des idées
nouvelles. L’étude explore ensuite la contribution de politiques cadres qui pourrait expliquer les
différences observées entre pays dans l’ampleur de ces flux. Bien que des recherches complémentaires
soient nécessaires pour établir une causalité, les résultats concordent avec l’idée que des marchés de
produits, de main-d’oeuvre et de capitaux efficaces, des systèmes judiciaires efficients et des législations
sur les faillites qui ne pénalisent pas indûment l’échec peuvent accroître les retours sur l’activité
d’innovation. L’étude examine aussi les impacts hétérogènes des politiques et constate que les jeunes
entreprises – qui sont davantage susceptibles d’expérimenter des technologies de rupture et de dépendre de
financements externes pour la mise en oeuvre et la commercialisation de leurs idées – bénéficient
beaucoup plus que les autres des réformes des marchés du travail et de marchés plus développés du crédit
et du financement des phases d’amorçage et de démarrage.
Codes JEL: O30, O31, O33, O34, L25
Mots-clés: l'innovation, brevets; la réaffectation, la croissance des entreprises.

ECO/WKP(2014)23
4
TABLE OF CONTENTS
DO RESOURCES FLOW TO PATENTING FIRMS? CROSS-COUNTRY EVIDENCE FROM FIRM-
LEVEL DATA ................................................................................................................................................ 4
1. Introduction .......................................................................................................................................... 5 2. Innovation, resource reallocation and growth ....................................................................................... 8
2.1 A healthy economy reallocates resources to their most productive use ...................................... 8 2.2 The links between reallocation and innovation ......................................................................... 11 2.3 Public policy and resource flows to innovative firms ............................................................... 12
3. Data ..................................................................................................................................................... 13 3.1 Firm level data ........................................................................................................................... 13 3.2 Preliminary evidence ................................................................................................................. 15
4. Empirical methodology ...................................................................................................................... 16 4.1 Patent stock and firm size .......................................................................................................... 16 4.2 Identifying the role of public policies ........................................................................................ 20 4.3 Identification concerns .............................................................................................................. 22
5. Empirical results ................................................................................................................................. 23 5.1 Do resources flow to patenting firms? ....................................................................................... 23 5.2 Cross-country differences in resource flows to patenting firms ................................................ 29 5.3 Role of public policy ................................................................................................................. 31
6. Extensions and robustness tests .......................................................................................................... 37 7. Conclusions ........................................................................................................................................ 38
REFERENCES .............................................................................................................................................. 40
APPENDIX A: A SIMPLE ALGORITHM TO DEFINE GROUPS IN ORBIS .......................................... 44
APPENDIX B: ADDITIONAL EMPIRICAL TABLES AND CHARTS .................................................... 46
APPENDIX C: FALSIFICATION TEST FOR INSTRUMENTAL VARIABLES STRATEGY ............... 56

ECO/WKP(2014)23
5
DO RESOURCES FLOW TO PATENTING FIRMS? CROSS-COUNTRY EVIDENCE FROM
FIRM-LEVEL DATA
By
Dan Andrews, Chiara Criscuolo and Carlo Menon1
1. Introduction
1. While innovation-based growth – underpinned by investments in knowledge-based capital
(KBC) – is central to raising long-term living standards, there are important differences across OECD
countries in investments in KBC and innovative capacity, which carry important implications for aggregate
productivity performance (OECD 2010; Andrews and Criscuolo, 2013). One possible explanation for these
patterns at the aggregate level is that the returns to innovation vary across OECD countries, which provide
firms in some countries with a greater incentive to innovate. The returns to innovation are partly influenced
by the ease with which innovative firms can attract sufficient tangible resources to underpin the
implementation and commercialisation of new ideas, which will in turn reflect the ability of national
economies to reallocate scarce resources toward the most innovative firms over time. In this context,
adjustment frictions preventing the (re)allocation of resources towards their most productive use can
significantly affect aggregate innovation and productivity outcomes (Bartelsman et al., 2013).2 Given the
potential for public policy to affect resource flows (Andrews and Cingano, 2014; Bravo-Biosca et al.,
2013), this paper explores the extent to which public policies shape the ability of innovative firms to attract
capital and labour.
2. This paper draws on an emerging literature from the United States, which utilises firm level
longitudinal data on firms’ patenting activity and performance to examine what happens when firms patent.
While patenting is an imperfect measure of innovation, these studies show that patenting tends to be
associated with important economic changes within firms (Balasubramanian and Sivadasan, 2011) and
demonstrate strong patterns of reallocation towards patenting firms and away from firms that do not
innovate (Kogan et al., 2012). Despite the emergence of this literature, there is very little cross-country
evidence on patterns of reallocation towards innovative firms. Accordingly, following the approach used
by Balasubramanian and Sivadasan (2011) for the United States, this paper looks at 23 OECD countries
over the period 2002-2010 using matched PATSTAT-ORBIS data, with a view to highlight cross-country
1 Corresponding authors are: Dan Andrews ([email protected]) from the OECD Economics
Department and Chiara Criscuolo ([email protected]) and Carlo Menon
([email protected]) from the OECD Science, Technology and Industry Directorate. The authors are
indebted to Hélène Dernis for her advice with the HAN patent dataset; Peter Gal and Alexandros Ragoussis
for help with the ORBIS database; Stuart Graham and Nicolas van Zeebroeck for useful advice on the
litigation data; and to Evrard van Zuylen for answering to all our enquiries on the same data. The authors
would also like to thank Eric Bartelsman, Antoine Dechezleprêtre, Stuart Graham, Bronwyn Hall, Nick
Johnstone, Giuseppe Nicoletti, Mariagrazia Squicciarini, Jean-Luc Schneider and participants to the CAED
2013 conference in Atlanta and to the PSDM 2013 conference in Rio de Janeiro for helpful comments on
the paper and Ines Gomez Palacio for excellent editorial support. The views expressed in the paper are
those of the authors and do not reflect those of the OECD and its member countries.
2 For example, see Restuccia and Rogerson, (2008) and Hsieh and Klenow (2009).

ECO/WKP(2014)23
6
differences in reallocation and innovation patterns.3 To the best of the authors’ knowledge, this paper is the
first to explore cross-country differences in the extent to which resources flow to patenting firms.
3. Using this approach, it is possible to replicate a key message from the US studies: namely, that
patenting is associated with real changes in economic activity at the firm level. For the average firm in the
sample, the baseline estimates imply that a 10% increase in the firm patent stock is associated with a 1%
increase in employment and a 1.3% increase in the capital stock. Moreover, instrumental variables
estimation – which exploits data on patent litigation within technological fields to instrument patenting –
suggests that the impact of patenting on firm size is likely to be causal, which is a significant contribution
to this literature given that existing studies have ignored biases arising from the endogeneity of patenting
activity. Beyond the direct positive effects of a firm’s own patents, firms will also indirectly benefit from
patenting of other firms in the same conglomerate, since firm performance measures also respond to the
patents held by other affiliates within the same group, highlighting the importance of knowledge flows
within broad organisational structures. Finally, while the baseline results suggest that patenting has a small
or insignificant impact on productivity – consistent with the US literature – additional analysis suggests
that the impact of patenting on productivity is realised with a lag. This is consistent with the idea that firms
typically need to undergo organisational restructuring and attract complementary tangible resources before
they can fully realise the benefits of new ideas (David and Wright, 2003).
4. The analysis also reveals some interesting cross-country patterns, which seem to suggest that
some countries are more successful than others at reallocating tangible resources to innovative firms. For
example, the extent to which labour flows to patenting firms in the United States is estimated to be more
than twice as large as in Italy, and these differences become four-to-five-fold when looking at capital.
These differences, in turn, motivate an analysis of the role of public policies in shaping the observed
cross-country differences in resource flows to patenting firms – another key novelty of the paper. While
further work is required to establish causality – and with the caveat related to the limitations of patenting
as a measure of innovation – the results are consistent with the idea that well-functioning product, labour
and capital markets, efficient judicial systems and bankruptcy laws that do not overly penalise failure can
raise the expected returns to investing in KBC. These benefits are partly realised through stronger
competitive pressures and more efficient reallocation, which make it easier for successful firms to
implement and commercialise new ideas and, by lowering the costs of failure, encourage firms to
experiment with uncertain growth opportunities.
5. More specifically, the results of the econometric analysis provide support for the following policy
conclusions:
Stringent employment protection legislation (EPL) is associated with lower resource flows to
patenting firms, reflecting the idea that stringent EPL raises the cost of reallocating resources.
The estimated effect of EPL is economically large: a policy reform that reduced the stringency of
EPL from the highest observed level (Portugal) to the average level (Norway) is estimated to
more than double the extent to which labour flows to patenting firms. Additional analysis
suggests that the burden of stringent EPL falls disproportionately on young firms, which is
consistent with existing studies showing that stringent EPL reduces the scope for experimentation
with uncertain technologies.
3 The 23 OECD countries included are: Austria, Belgium, Czech Republic, Denmark, Finland, France,
Germany, Greece, Hungary, Italy, Korea, Japan, Netherlands, Norway, Poland, Portugal, Slovak Republic,
Spain, Slovenia, Sweden, Switzerland, United Kingdom and the United States.

ECO/WKP(2014)23
7
Cumbersome product market regulations (PMR) are negatively associated with employment
flows to patenting firms, which may reflect the tendency for such regulations to prolong the
existence of inefficient firms in the market and to raise the cost structure of inputs that are
required by innovative firms to underpin their expansion. The estimates imply that the
responsiveness of firm employment to increases in the patent stock would more than double if the
stringency of PMR was reduced from the highest observed level (Poland) to the sample mean
value (Belgium). Similarly, more stringent barriers to trade and investment reduce the ability of
patenting firms to attract capital: all else equal, reducing barriers to trade and investment from the
most stringent setting (Slovak Republic) to sample average (Japan) is associated with a 70%
increase in the extent to which capital flows to patenting firms.
Bankruptcy legislation that does not excessively penalise business failure can promote the flow
of resources to more innovative firms by reducing entrepreneurs’ expectations that they will be
heavily penalised in case of failure and thus encouraging them to experiment with risky
high-return high-failure type technologies. For instance, reducing the cost of bankruptcy
procedures from the sample maximum (Italy) to the mean value (France) would be associated
with a 30% increase in the capital flow to patenting firms.
In countries with more efficient judicial systems, capital and labour flow more readily to
patenting firms, consistent with research showing that easier contract enforcement makes it less
costly to hire the skilled workers necessary to underpin firm growth. All else equal, a policy
reform that improved the civil justice system in the least efficient country (Czech Republic) to
the average efficiency in the sample (Switzerland) would be associated with a 50% increase in
the extent to which capital flows to patenting firms.
Resource flows to patenting firms tend to be stronger in countries with more developed financial
markets, and this effect is particularly important for young firms. Thus, financial systems play an
important role in helping credit-constrained firms to implement and commercialise new ideas,
raising the returns to innovation. Similarly, resources flow more freely to young patenting firms
in countries with more developed markets for seed and early stage venture capital. This suggests
that seed and early stage venture capital plays an important role for ensuring the growth of young
patenting firms and the development of radical innovations. For example, all else equal,
increasing access to early stage venture capital from the lowest level (Greece) to the sample
average (Belgium) implies that capital flows to patenting firms would be around one-third higher
than otherwise.
6. The paper proceeds as follows. The next section places our study in the context of the existing
literature and discusses the channels through which public policies may influence resource flows to
innovative firms. Section 3 describes the underlying firm level data used in the analysis and presents some
preliminary evidence on key economic differences between patenting and non-patenting firms. In
Section 4, the empirical methodology utilised to estimate resource flows to patenting firms is outlined, as
well as the approach to identify the impact of public policies on resource flows. Section 5 discusses the
empirical results and highlights: i) that patenting is likely to cause real changes in economic activity at the
firm level, both at the intensive and extensive margins; ii) some interesting cross-country differences in the
extent to which resources flow to patenting firms; iii) that public policies can shape resource flows to
innovative firms; iv) that these policy effects are stronger in sectors more exposed to the policies; and v)
that the burden of some policies fall disproportionately on young firms, which are shown to be key agents
in the introduction of radical innovations. In Section 6, some robustness tests are performed, while
Section 7 offers some concluding thoughts.

ECO/WKP(2014)23
8
2. Innovation, resource reallocation and growth
7. Cross-country differences in aggregate-level productivity outcomes are increasingly being linked
to the widespread asymmetry and heterogeneity in firm performance within sectors (Bartelsman et al.,
2013; Hsieh and Klenow, 2009). The distribution of firm productivity is typically not clustered around the
mean (as would be the case with a normal distribution) but is instead characterised by many below-average
performers and a smaller number of star performers. Moreover, the degree of heterogeneity is striking:
even within narrowly defined industries in the United States, firms at the 90th percentile of the TFP
distribution are twice as productive as firms at the 10th percentile (Syverson, 2004).4 These findings
suggest that the focus on average outcomes is misleading and thus heterogeneous firm models are
becoming the main analytical workhouse and empirical research is increasingly focusing on the star
performers which disproportionately drive productivity and job growth (Haltiwanger, 2013; Criscuolo et
al., 2014).
8. Given the tendency for highly productive firms to coexist with low productivity firms within
narrowly-defined sectors, the recent literature has focused on resource misallocation as a potential
explanation for why some countries are more productive than others (Bartelsman et al., 2013; Hsieh and
Klenow, 2009). A key observation is that in well-functioning economies, a firm’s relative position in the
productivity and size distributions is positively correlated, which means that on average relatively more
productive firms should be larger (e.g. static allocative efficiency; see Olley and Pakes, 1996). Research on
firm dynamics reveals large cross-country differences in the efficiency of resource allocation, which
suggests that some economies are more successful at channelling resources to highly productive firms than
others. For example, in the United States, manufacturing sector labour productivity is 50% higher due to
the actual allocation of employment across firms, compared to a hypothetical situation where labour is
uniformly allocated across firms, irrespective of their productivity (Bartelsman et al., 2013). While a
similar pattern holds for some countries of Northern Europe such as Sweden, it turns out that static
allocative efficiency is considerably lower in other OECD economies, particularly those of Southern
Europe (Andrews and Cingano, 2014).
9. While there are likely to be many reasons why some countries are more successful than others at
channelling resources to the most productive firms, static allocative efficiency can only be achieved if
there is dynamic allocative efficiency that occurs when resources move towards more productive firms at
the expense of less productive firms over time (Haltiwanger, 2011). Accordingly, the following section
discusses empirical evidence on dynamic resource reallocation with a special reference to resource flows to
patenting firms – the central issue explored in this paper.
2.1 A healthy economy reallocates resources to their most productive use
10. The pace of reallocation of inputs and outputs is generally high in OECD countries: on average,
about 15-20% of all firms and more than 20% of jobs are created or destroyed each year.5 This is not to say
that resource reallocation is always desirable – shifting resources also entails costs for firms, workers and
governments – and excessive reallocation is no more desirable than the persistent trapping of resources in
4 The same is true with respect to the firm size distribution, with many small firms co-existing with a smaller
number of very large firms (Bartelsman et al., 2013).
5 Over the first-half of the 1990s, firm turnover rates (entry plus exit rates) in OECD countries were in the
range of 15 to more than 20% in the business sector (see Bartelsman, Haltiwanger and Scarpetta 2004).
Meanwhile, average annual gross job reallocation – the sum of job creation and job destruction between t–
1 and t – was about 22% of dependent employment in the business sector between 1997 and 2004 (see
OECD, 2009a)

ECO/WKP(2014)23
9
inefficient activities. Nevertheless, continuous reallocation is a key feature of well-functioning market
economies and aggregate productivity will be improved if resources are reallocated away from less
productive to more productive businesses and activities over time. The key mechanisms through which this
process occurs are firm turnover (i.e. entry and exit), shifts in resources across incumbent firms and
resource reallocation within firms.
11. Empirical evidence suggests that, over time, resources tend to be reallocated toward more
productive activities. Most existing studies tend to focus on labour. For instance, while the leading
cross-country study finds that within-firm improvements in performance account for the majority of
aggregate labour productivity growth over a five-year window, the contribution from firm entry and exit is
estimated to reach at least 20% in some OECD countries (the estimates are higher for emerging countries),
while that from reallocation of labour across existing enterprises is generally small, but positive
(Bartelsman et al., 2004; OECD, 2003).6 Within-countries studies show the importance of reallocation
through entry, exit and market share gains by more productive firms via market selection. For example,
Disney et al., (2003) show that for the United Kingdom this reallocation accounts for more than 80% of
aggregate total factor productivity growth in the manufacturing sector, while decompositions of labour
productivity for the Canadian economy as a whole and the United States retail sector yield similar
conclusions.7 There is also considerable heterogeneity across firms in their ability to use capital
productively and existing studies show that capital – as measured by acquisitions of property, plant and
equipment – also tends to flow from less productive firms to more productive firms (Eisfeldt and Rampini,
2006; Jovanovic and Rousseau, 2002).
12. Recent evidence suggests that resources flow towards firms that patent at the expense of non-
patenting firms. Studies exploiting firm level longitudinal data from the United States suggest that
patenting – also a proxy for innovation – tends to be associated with important changes within firms, e.g.,
increases in firm size, scope, and skill and capital intensity observed after firms patent (see
Balasubramanian and Sivadasan, 2011). With respect to the intensive margin (i.e. differences amongst
patenting firms), a 10% increase in patent stock is associated with about a 1.5% increase in value added, a
1.7% increase in capital stock, and a 1.4% increase in employment over the sample period 1975 to 1997.
The impact of patenting on total factor productivity (TFP), however, tends to be small or insignificant. This
may reflect the possibility that new ideas – as proxied by increases in the patent stock – take a longer time
to affect productivity, since firms typically need to undertake organisational restructuring (Bloom and Van
Reenen, 2010; David and Wright, 2003; Pozzi and Schivardi, 2012) and attract complementary tangible
resources in order to implement and commercialise new ideas (Andrews and Criscuolo, 2013).8
13. Since the model controls for industry specific year fixed effects, these elasticities provide an
estimate of the extent to which patenting is associated with higher activity at the firm level, relative to the
average firm in the sector in a particular year, and are thus informative from a reallocation perspective.
Balasubramanian and Sivadasan (2011) also explore the extensive margin by analysing how firms’
6 These estimates are likely to understate the contribution of reallocation since the direct contribution of net
entry is reinforced by an indirect effect whereby incumbents raise their own productivity to maintain
market share in the face of strong entry pressures (see Aghion, et al., 2007). And, the contribution from
reallocation – particularly net entry – tends to increase when the analysis is conducted over longer time
horizons (Foster et al., 2001; Bartelsman et al., 2004).
7 Baldwin and Gu (2006) for Canada find that this reallocation accounts for about 70% of aggregate labour
productivity growth. Foster et al. (2006) find that entry and exit explain almost all labour productivity
growth of the US retail sector.
8 This lagged response of TFP may also reflect the fact that the patent stock is based on the year of
application as opposed to the year in which the patent is ultimately granted.

ECO/WKP(2014)23
10
economic characteristics change when they switch status from being a non-patentee to a patentee. Using an
event study and a matching estimator, they find that first-time patentees record significant growth along a
range of firm economic indicators relative to a control group of non-patenting firms that displayed similar
pre-treatment characteristics.
14. Looking at all factors of production, Kogan et al., (2012) find strong patterns of reallocation
towards innovating firms (the extent of which is determined by the stock market response to news about
patents), and away from firms that do not innovate as proxied by patenting activity. For instance, an
increase in patenting by a firm from the 50th to the 90th percentile of the innovation distribution increases
a firm’s physical capital investment rate by 0.4-0.9 percentage points, which is economically significant
given the sample median firm investment rate of 10% (see column 1 from Table below). Moreover, for
firms that do not innovate, a one standard deviation increase in the level of innovation by a firm’s
competitor triggers a decline of 1.2-1.6 percentage points in that firm’s investment rate. Innovation also
triggers similar patterns of reallocation for both labour and financial capital (columns 2 and 3), and similar
patterns have also been identified using data for Denmark (Lentz and Mortensen 2008).
Table 1. Innovation and reallocation in the United States
Notes: To estimate the economic magnitude of firm-level technological innovations, Kogan et al., (2012) use stock market responses to news about patents over the period 1926-2007. Net capital inflows are calculated as: debt issuance plus equity issuance minus payout (and are normalised by assets).
Source: Kogan et al., (2012).
15. Before proceeding, it is important to note that while the results from both aforementioned studies
demonstrate the important relationship between patenting and firm size, the authors are careful not to
attach a causal interpretation to their findings. One specific concern is that increases in – latent or explicit –
demand for certain products might spur growth in both patenting and firm size in some firms but not
others.9 As discussed in Section 4.1.3, there are also likely to be other sources of endogeneity and to the
best of our knowledge, few – if any – papers in the literature control for such biases. Accordingly, a key
contribution of this paper is to present instrumental variables estimates of the impact of patenting on firm
size.
9 The demand-pull channel for innovation was first proposed by Schmookler (1966) and is part of some
models of endogenous technological change (for example, Acemoglu & Linn 2004).

ECO/WKP(2014)23
11
2.2 The links between reallocation and innovation
16. Despite the emergence of this US literature, cross-country evidence on the extent to which
patenting firms can attract labour and capital is scarce. More systematic cross-country evidence on
resource flows to innovative firms is clearly desirable, particularly in light of the close links between
investments in knowledge-based capital (KBC) and innovation and reallocation mechanisms (see Andrews
and Criscuolo, 2013).
17. Recent research demonstrates the growing importance of KBC as a potential source of
productivity gains, and the contribution of efficient resource allocation to this process. Indeed, the non-
rivalrous nature of knowledge means that the initial cost incurred in developing new ideas – typically
through R&D – does not get re-incurred as the latter are combined with other inputs in the production of
goods or services. This gives rise to increasing returns to scale – the important property that makes ideas
and knowledge an engine of growth (Jones, 2005). Realising this growth potential, however, depends on
the ability to reallocate labour and capital to their most productive use.
18. Andrews and de Serres (2012) explore these ideas from the perspective of an intangible-based
start-up firm, where profitability depends not only on technological success but crucially on the ability to
leverage the fixed cost of investments in intangibles – which are subject to strong returns to scale – through
increases in the scale of production (Bartelsman and Groot, 2004). The ability to rapidly reallocate tangible
resources, such as labour and physical capital, in order to capture the value of the investment before
imitation by followers is therefore crucial for such firms. Likewise, in the event of technological failure, it
is vital that firms experimenting with innovative activities can rapidly scale down operations to facilitate
exit and thereby release resources that can be used by other firms.10
19. In fact, it is increasingly being recognised that the growth potential of innovative firms is
inversely related to the amount of resources that are absorbed by other less productive firms. In a
heterogeneous firm model calibrated to US data, Acemoglu et al., (2013) show that policy intervention
such as R&D tax subsidies are only truly effective when policy-makers can encourage the exit of “low-
type” incumbent firms, in order to free-up R&D resources (i.e. skilled labour) for innovative “high-type”
incumbents and entrants. This reflects the idea that low-type firms – despite their lack of innovativeness –
still employ skilled labour to cover the fixed costs of operation, such as management and back-office
operations. One implication is that a R&D subsidy will be fully capitalised into the high skilled wage rate –
without a concomitant rise in innovation output (as suggested by Goolsbee, 1998) – unless the effective
supply of high skilled labour can rise to meet additional demand via the downsizing and/or exit of “low-
type” firms.
20. Finally, the ability to rapidly redeploy tangible resources not only influences the returns to
innovation but also the type of strategy firms employ to boost their own productivity, which will be shaped
by their perceptions of the expected costs of implementing and commercialising new ideas and the ability
to capitalise on the expected benefits. If the costs of reallocation are deemed to be too high, entrepreneurs
may have to focus on incremental innovations, rather than experiment with disruptive technologies,
because it will be more difficult to realise the benefits of risky technologies when successful and contain
losses when unsuccessful (Bartelsman, 2004). In turn, some entrepreneurs might decide not to even enter
the market as it might not be profitable or sustainable to enter with just an incremental innovation (Shane,
2001; Bhide, 2000). Hence, the extent of specialisation in sectors that rely more on reallocation – such as
10 This process is also necessary to provide the entrepreneur with sufficient space in order to experiment with
alternative ideas. Indeed, this is consistent with anecdotal evidence that suggests that the most successful
entrepreneurs have experienced some form of business failure in the past.

ECO/WKP(2014)23
12
more innovative or ICT-intensive sectors – may vary across countries (Bartelsman et al., 2010), partly as a
result of the efficiency of reallocation mechanisms. In sum, efficient reallocation mechanisms are likely to
be particularly important for patenting firms to the extent that they shape the returns to innovation but also
determine the feasibility of various innovation strategies.
2.3 Public policy and resource flows to innovative firms
21. Emerging empirical evidence suggests that public policies can have important effects on the
efficiency of resource allocation (Arnold et al., 2011; Bartelsman et al., 2013; Andrews and Cingano,
2014; Bravo-Biosca et al., 2013). Andrews and Cingano (2014) construct estimates of static allocative
efficiency at the industry level for a large sample of OECD countries, and show that more stringent
regulations affecting product and labour markets and bankruptcy laws that excessively penalise business
failure are associated with less efficient resource allocation. Similarly, Bravo-Biosca et al., (2013) show
that these policy settings as well as less developed financial markets tend to be associated with a less
dynamic distribution of firm employment in a small sample of OECD countries, while Aghion et al.,
(2007) highlight the importance of financial development for post-entry employment growth. These
papers, however, are unable to address the question of how policies shape the growth prospects of the most
innovative firms, since they aggregate firm level data to the sectoral level.
22. With this background in mind, the strength of the link between resource flows to patenting firms
and relevant policy and institutional factors is explored, with a specific focus on:
Product market regulations (PMR): cumbersome PMR might raise the cost structure of inputs
and/or lower the quality of inputs that are required by innovative firms to underpin their
expansion (Arnold et al., 2011).11
More broadly, if regulations restrict the extent of competition
through higher barriers to entry, there is likely to be less pressure on incumbent firms to allocate
resources efficiently. Finally, PMR that create barriers to trade and investment may make it more
difficult for patenting firms to attract capital.
Employment protection legislation (EPL): more stringent EPL may hinder the reallocation of
workers across firms, thus making it more difficult for patenting firms to attract resources. By
raising exit costs, strict EPL may also make firms less willing to rapidly scale-up production to
capitalise on an idea which has uncertain returns (Bartelsman et al., 2010). Given their stage of
development this implies that young firms may be particularly sensitive to stringent EPL, and this
effect will be reinforced if such regulations impose a fixed cost on firms and younger firms have
fewer resources to absorb such costs.
Bankruptcy legislation: by increasing the costs associated with firm exit, bankruptcy laws that
overly penalise failure may make entrepreneurs less willing to rapidly scale up production and
result in valuable resources being trapped in inefficient firms, thereby making it more difficult for
innovative firms to attract resources.12
On the other hand, tighter bankruptcy laws imply a
stronger guarantee for creditors, which may improve the supply of credit, thereby implying a
theoretically ambiguous impact of bankruptcy laws on resource flows.
11 For example, cumbersome PMR could raise the cost of reallocating resources through land-use regulations
and overly cumbersome permitting processes, which may raise the costs of expanding production (e.g.
opening new factories etc.).
12 This effect will be reinforced if tight bankruptcy laws hamper entrepreneurship (by posing a greater burden
on firms in the event of failure) and result in less firm entry than otherwise, therefore implying less
competitive pressure on incumbents.

ECO/WKP(2014)23
13
Judicial efficiency: Legal systems that clearly assign and protect property rights and robust public
institutions that provide a strong rule of law and contain corruption can support efficient resource
allocation (Haltiwanger, 2011) and raise the returns to innovation.
Financial market development: a range of studies demonstrate the importance of financial
markets for the efficiency of reallocation and innovative firms more generally (Aghion et al.,
2005). For example, deeper financial systems can underpin the post-entry growth of successful
firms (Aghion et al., 2007) and are associated with a more dynamic distribution of firm growth
(i.e. more growing and shrinking firms and fewer static firms) in industries that are highly
dependent on external financing (Bravo-Biosca et al., 2012).
Seed and early stage venture capital: A key barrier to the growth of many KBC-based start-up
firms is the inability to obtain external finance, due to difficulties in collateralising KBC. In some
countries, the financing gap of young entrepreneurial firms is partly bridged by highly-
specialised financial intermediaries such as venture capitalists or business angels, who address
informational asymmetries by intensively scrutinising firms before providing capital and
monitoring them afterwards (Hall and Lerner, 2009).
3. Data
3.1 Firm level data
23. The empirical analysis is based on two large micro level databases. The first one is the EPO
Worldwide Patent Statistics Database (PATSTAT), containing detailed information on patent applications
for over 80 patent offices. The second one is the firm-level commercial database ORBIS, developed by
Bureau Van Dijk. This paper benefits from valuable additional elaboration on both datasets. These are the
HAN database, providing a sophisticated matching of patent applicants in PATSTAT with companies in
ORBIS based on string similarity; and the harmonised firm level dataset based on ORBIS, developed by
Gal (2013) and Gonnard and Ragoussis (2013).
24. While patenting activity – as a proxy for innovation – carries the advantage of being relatively
easy to measure and comparable across countries, it entails only a specific component of firms’ innovation
activity. Firms also employ a range of different strategies to manage and protect their intellectual assets,
either as an alternative or as a complement to formal intellectual property (IP) rights. These include
secrecy, confidentiality agreements, lead-time, complexity of design, the incorporation of specialist know-
how and open source methods (OECD, 2011). However, reliable data on these alternative IP strategies and
related assets at the firm level are unavailable. At the same time, while patents sometimes are filed for or
acquired for strategic reasons that are unrelated to technological innovation, restricting the empirical
analysis to companies with 20 employees or more minimises the risk that so-called “patent trolls” (Bessen
et al., 2011) are included in the sample.
25. Furthermore, there is now large and consolidated evidence supporting the role of patent statistics
as a meaningful indicator of innovative activity at the firm level (see Nagaoka et al., 2010, and Hall and
Harhoff, 2012, for recent surveys). Since Pakes and Griliches (1980), a number of papers proved the
existence of a robust correlation between R&D activity and patenting (see Griliches, 1990, for a survey).
More recently, survey evidence shows that 55% of new products are patented in Japan while the
corresponding figure for the United States is 60% (Goto and Nagata, 1997). Accordingly, this paper
focuses on patents to proxy the innovative capacity of the firm, but the above caveats should be kept in
mind when interpreting the policy conclusions arising from the analysis.

ECO/WKP(2014)23
14
26. Other firm-level variables come from the ORBIS database. Along with many advantages, this
commercial dataset also carries a number of caveats. First, there is evidence that ORBIS is not necessarily
representative of the underlying business population within a country, and that coverage varies over
countries and time without any clear patterns (see Bravo-Biosca et al., 2012). This in turn introduces an
important selection bias in our estimates. The required assumption for our estimates to hold is that
patenting intensity does not affect the probability of being selected into the sample, conditional on firm
fixed effects and on the wide set of sector*year*country fixed effects included in the main regressions. In
other words, this requires that companies that change their patent stock to a similar extent are equally
likely to be, or not to be, included in the sample, within the same country, sector, and year. There is not a
direct way to test this assumption, but it appears reasonably plausible, since other factors that are
controlled for in the analysis – e.g. age – are more likely to explain selection.
27. Secondly, when looking at the matched ORBIS-PATSTAT database, the sophistication and
accuracy of the matching technique might not be sufficient to rule out the possibility of some measurement
error in the patent stock variable assigned to ORBIS firms (e.g. as the probabilistic matching may lead to
some “false negative” or “false positive” patent assignments). To the extent that these errors are
uncorrelated with firm performance, the matching errors lead to random measurement error, attenuating
estimates of the effect of patenting on firm performance toward zero.
28. The resulting dataset is a large cross-country firm-level dataset covering 23 countries.
Information on firms’ accounts from ORBIS starts in 1998, but coverage increases significantly since
2003; the analysis therefore starts in that year, as pre-2002 information is likely to be affected by a stronger
selection bias (see Table B1 for country coverage). Patent information was retrieved since the year 1980,
which allows us to build the firms’ patent history over the longer time period. For the analysis, the sample
is restricted to companies with 20 or more employees at the start of the sample, if they are reported already,
or at the time they appear for the first time. This is preferable to using average employment over the period
as the latter criterion may lead to selection issues and amplify the impact of successful entrants.
29. In order to avoid double counting, balance sheet information from ORBIS is restricted to
unconsolidated accounts; for a detailed description of consolidation and related issues in ORBIS see Gal
(2013) and Gonnard and Ragoussis (2013). However, it is worth noting that many patent applications are
filed at the group level and are officially assigned to the headquarter company, which implies that they
may be excluded from the analysis, given that consolidated accounts are dropped. Thus, it becomes
important to also account for patents at the level of the group. While ownership information is only
partially reported in ORBIS, many of the missing links can be logically inferred from reported links (for
example, if the ownership link of firm C with firm A is missing, this could be inferred if we know that firm
A owns firm B, and that firm B owns firm C). Appendix A describes the methodology used to develop an
ad-hoc algorithm which iteratively exploits available information to reconstruct the ownership tree of each
company. In this way, it was possible to create a group identifier linking companies belonging to the same
group and to calculate the group-level patent stock.
30. The measure of patent stock is based on the number of (eventually granted) patent applications to
the three main patent offices: the USTPO, the EPO, and the WIPO. Robustness tests were performed such
as including patents from other important national patent offices for which reliable information is available
(i.e. the British, Canadian, German, French, and Japanese patent offices). The year of reference is the
application year. The patent stock is calculated as the cumulative sum of the depreciated yearly patent
count since 1980. The depreciation rate is the one most frequently used in the literature, equal to 15% per
year (Hall et al., 2005). Different patent applications, however, can arise from the same “inventive steps”,
as companies may seek protection for the same ideas in many countries by filing the same patent at several
patent offices. All patent applications referring to the same “priority” patent are defined as a “patent
family”. In order to take this issue into account, the company-level patent stock is also estimated based on

ECO/WKP(2014)23
15
the count of distinct patent families, rather than distinct patents; the International Patent Documentation
Centre (INPADOC) family definition has been adopted.
3.2 Preliminary evidence
31. This section presents some descriptive statistics drawn from our dataset. All in all, figures tend to
confirm three key stylised facts that have emerged from the literature: i) only a small percentage of firms
patent; ii) these firms are often concentrated in a few key sectors; and iii) on average, patenting firms are
very different with respect to their non-patenting counterparts, especially in terms of size, but also
productivity. It is worth stressing that these aggregate statistics are only suggestive and should be
interpreted with caution, as they might be prone to selection bias (see discussion in section 3.1 on the
limitations of ORBIS) and because the sample excludes firms with less than 20 employees. Finally, the
descriptive statistics in this section are limited to countries for which a significant number of patenting
firms over the 2003-2010 period is reported in the dataset, which corresponds to a total of around
2.8 million firms across 13 countries.
32. The left panel of Figure 1 reports the share of firms that own at least one patent in 2009 by
country. While the share of firms that patent is close to or above 20% in United States and Germany, this
figure is around 5% for most other countries in Figure 1. The right panel reports the corresponding statistic
by (NACE Rev. 1.1) 2-digit sectors. The graph shows that there is also large heterogeneity across sectors,
with manufacturing of chemicals – including pharmaceuticals – (NACE 24), machinery and equipment
(NACE 29), and electrical and optical (NACE 30-33) showing as expected the largest patenting rates, all
reporting a share of patenting firms of around 20%. Another stylised fact is that industries in
manufacturing generally show a much higher patenting rate than in the service sector.
Figure 1. Share of firms that patent by country and by 2-digit sector
Selected OECD countries
Panel A: Country
Panel B: Industry
Note: the sample is limited to companies and that have at least 20 employees in 2003 or at the time of their first appearance in the dataset and to countries for which at least 500 firms applied for a patent over the 2003-2010 period.
Source: PATSTAT, OECD HAN Database, and OECD ORBIS.
33. Table 2 reports some summary statistics comparing the group of patenting firms with non-
patentees. Patentees are systematically larger than non-patentees, irrespectively of the indicator used which
is consistent with existing research from the United States (Balasubramanian and Sivadasan, 2011): on
average, comparing the simple means of the size variables (columns 1 and 4), turnover is larger by a factor

ECO/WKP(2014)23
16
of 4; capital stock by a factor of 5; and employment by a factor of roughly 3.13
Not surprisingly, patenting
firms are also more capital intensive and show a higher level of labour productivity than non-patentees.14
Table 2. Mean firm characteristics: patentees versus non-patentees
Selected OECD countries, 2003-2010
Notes: The sample is limited to firms that are observed at least once in the ORBIS database between 2003 and 2010 and that have at least 20 employees in 2003 or at the time of their first appearance in the dataset. Patentees are defined as companies that have had at least one patent granted from the USTPO, the EPO, the WIPO, or other important national patent offices for which reliable information is available (i.e. the British, Canadian, German, French, and Japanese patent offices). *** denotes statistical significance at the 1% level.
4. Empirical methodology
4.1 Patent stock and firm size
34. To understand whether these cross-sectional differences between patenting and non-patenting
firms reflect self-selection on pre-existing differences, the longitudinal structure of the database is
exploited to explore how changes in firms’ patenting status over time are associated with changes in firms’
characteristics.
4.1.1 The baseline model
35. Following Balasubramanian and Sivadasan (2011), the within-firm elasticity of firm
characteristics (e.g. employment, capital, etc.) with respect to changes – or more specifically, deviations
from firm-average – in the patent stock is estimated, based on the following fixed effects regression
specification:
isctsctiisctisct PatSY )ln(ln 1 [1]
13 These variables are logarithms of the original values, and hence the factor, say, for employment is
computed as e1.034 = 2.8.
14 Note that 4,524 observations with zero real capital stock are excluded from the fixed assets statistics. The
real capital stock is calculated using the perpetual inventory method. See Gal (2013) for detail.

ECO/WKP(2014)23
17
where Y is the economic characteristic (employment, capital, turnover) for firm i, in sector s, in country c
at time t and PatS is the depreciated patent stock. The specification also includes firm fixed effects and
industry*country*year fixed effects. As a robustness test and to explore longer run impacts, we also
estimated equation (1) in long difference form – i.e., on a cross-sectional dataset formed by the 2009-2003
difference of all variables.
36. Since the log-log specification would exclude all firms that have zero patents, in order to include
in the sample observations with PatS equal to zero, the standard technique of taking the logarithm of
1+PatS is applied; this implies that we cannot strictly interpret the estimated coefficients as elasticities.
Since this may introduce a non-negligible bias, additional robustness tests show that the sign and the
magnitude of the results do not change when firms with no patents are excluded (see Table B2, Panel A).
The inclusion of zeros also implies that the estimated coefficient from equation [1] is a joint estimate of the
extensive (i.e. what happens to firms when they switch from non-patentee to patentee status) and intensive
(i.e. differences amongst patenting firms) margin and thus motivates an exploration of the extensive
margin through an event study methodology, as outlined in Section 4.1.2.
37. Two different PatS variables are included in the regression in turn – patent applications to
national offices and applications to the three most important patent offices (EPO, USTPO, and
WIPO/PCT) but the results are not particularly sensitive to this choice. The latter group of patents is
defined as “regional” patents. Only applications which are eventually granted are considered. The
coefficient β is the estimated sensitivity of firm characteristics (e.g. employment) to the patent stock.
Although technically β does not correspond to the elasticity due to the transformation described above, the
size of the coefficient can be approximately interpreted as such. If β>0, increases in the stock of patents are
associated with increases in firm employment, relative to the country-industry-year average. While this
provides an indicator of the extent to which resources flow to more innovative firms, the estimated effect
will also reflect other factors, including the quality of the underlying idea that is patented and the
characteristics of the national patenting system. Finally, in Section 5.1.1, we introduce another measure of
patent stock based on the patent portfolio of the group the company belongs to, since firms belonging to
the same group may access the patent stock – and the knowledge base – of other affiliated firms
4.1.2 The extensive margin
38. As a complement to the baseline results, a propensity score matching exercise aimed at exploring
the extensive margin effect of patenting – i.e. what happens to firms when they switch from non-patentee
to patentee status – is also performed in Section 5.1.2. The analysis is limited to the 4308 firms that apply
for a patent for the first time in the middle years of the database, i.e. 2005 and 2006, in order to balance the
pre- and post-treatment observation years.
39. Following Balasubramanian and Sivadasan (2011), every patentee is matched with the “most
similar” non-patentee, which results in a sample of 8616 firms (i.e. 4308 patenting firms and 4308 “nearest
neighbour” non-patenting firms). The “nearest neighbour” non-patentee is the firm with the closest “patent
propensity” score, that is, the probability of being a first-time patentee.15
The propensity score is estimated
in the years the patenting firms apply for their first patent via a cross-sectional Probit regression of the
first-patent dummy on one-year lagged employment, capital, and turnover (as in equation 2a):
tititititi TurnoverCapitalEmplpatentfirst ,1,31,21,1, ***)_Pr( [2a]
15 The sample is restricted to companies observed for at least 6 years over the period 2002-2009.

ECO/WKP(2014)23
18
40. The estimation of the propensity score in equation [2a] allow matching each first-time patentee to
its closest non-patenting counterpart in terms of employment, capital, and turnover levels; that is, with the
non-patenting firm with the most similar propensity score in the same year, 3-digits sector, age class (less
than or equal to 10 years, or 11 years or above) and country. Subsequently, the following second-stage
model is estimated:
titgjjiit IndexIndexPatDummyY ,
4
4
4
4
1 *ln
[2b]
Where PatDummy is a binary variable equal to one for patenting firms, γ is a fixed effect for each matched
patentee/non patentee pair, and τ is a year fixed effect. The inclusion of the patentee/non patentee pair
fixed effect (γ) implies that the model only exploits variation between the two matched firms. Index is a set
of 9 dummy variables which are equal to one in the nth year before or after the patentee’s patent is applied
for, with n=(-4, -3, -2, -1, 0, 1, 2, 3, 4). Note that n is equal to 0 in the year the patent is applied for. These
nine dummies take the same values for both patentees and non-patentees and control for time trends around
the year of first patenting. Finally, the first term on the right-hand side of the equation – i.e. the interaction
of the index dummies with the patentee dummy – are “switched on” only for patentees. Thus, β1j – the
main coefficients of interest – allow for different trends in the outcome variables both before and after the
first patent is applied for. If, as it is the case in the estimates presented, the β1j coefficients are significantly
different from zero only for non-negative n, i.e. only from the year of application onward, on>0 this will
confirm that significant patentee/non-patentee differences emerge only after the first patent has been
applied for.
4.1.3 Instrumental variables estimation
41. The baseline econometric model outlined in Section 4.1.1 quantifies the within-firm sensitivity
of firm characteristics (e.g. employment, capital, etc.) with respect to changes – or more specifically,
deviations from firm-average – in the patent stock, conditional on a wide set of time variant country-
industry dummies. However, this approach does not necessarily provide a causal estimate of the effect of
patenting on firm size to the extent that the positive association might reflect the positive impact of
unobservable or omitted factors on both patenting and firm size. For example, firms that are endowed with
a more skilled workforce or have better management might patent more, and at the same time grow more
for reasons independent from their patenting activity. Moreover, a reverse causality channel can also be in
place: firms that manage to attract more resources for reasons which are unrelated to patenting might be
able to funnel some of these resources into their patenting activity.
42. Controlling for these potential sources of endogeneity requires an instrumental variable that is
correlated with changes in firms’ patenting activity, but does not affect firm growth beyond its impact on
patenting. A potentially promising approach to instrument firms’ depreciated patent stock is to exploit
yearly data on patent litigation in different technology fields. The working hypothesis underlying this
approach is that the likelihood of patent litigation in the technological fields in which a firm specialises
may negatively influence the firm’s propensity to patent, since it might proxy for the expected exposure of
a patent in that field to litigation and its associated costs. For an instrument to be valid, it has to be both
relevant and exogenous.
43. In this case, the validity builds on the interplay between two factors: firms’ technological inertia
and the non-negligible time variation in litigation cases across different technologies. More specifically,
firms tend to exhibit a fair degree of inertia in their technological specialization. Even if the environment in
which they operate becomes significantly less profitable, it is generally not easy or cost-efficient to start
innovating and patenting in different technological fields. At the same time, both data (see Figure B1 in
Appendix B) and anecdotal evidence suggest that patent litigation has shown significantly different time

ECO/WKP(2014)23
19
patterns across technologies in the last decade, with some technological classes experiencing sudden bursts
in the number of litigation cases and others showing a more linear pattern. As a consequence of the
interaction of those two factors – the technological inertia and the significant time variation in litigation
across fields – some firms exogenously find their prospective patent portfolio potentially more exposed to
litigation risks, which in turn decreases their incentives to develop new patents. The exogeneity assumption
also requires that changes in litigation propensity do not affect changes in firm’s employment and capital
through other channels conditional on country-year and industry-year dummies – an assumption that seems
plausible.
44. Therefore, we develop a two-stage least square (2SLS) estimation strategy, where in the first
stage we regress the firm’s patent stock on a firm-specific, time-variant measure of litigation propensity,
which is our instrumental variable. Operationally, the instrument for firm i at time t is defined as:
∑ [3]
Where:
share is the share of patents in each 4-digit IPC class k within the firm’s patent portfolio applied
for before the start of the period of analysis. As most patents are allocated to more than one IPC
class, the share is calculated on patent fractional count, where each patent is weighted 1/N, where
N is the total number of IPC classes the patent is classified in. For those companies not patenting
before 2003 (around 10% of the sample), we build the IPC shares based on patents applied for in
the first year of the firm’s patenting activity in which at least 3 different IPC classes appear in the
PATSTAT dataset.
Litig_prop is the sum of all patents litigated in a given year, divided by the stock of patents
applied for in the same years. For example, if in year 2005 the data show that 20 patents have
been litigated, of which 10 have been applied for in 1995 and 10 in 2000, and the total number of
patents applied for in 1995 and 2000 is 50 and 100, respectively, the value of Litig_prop for the
year 2005 would be equal to 10/50+10/100=3/10.
45. Litigation data are sourced from a commercial database created and maintained by Darts-IP.16
To
the best of our knowledge, the dataset was first used and described by van Zeerbroeck and Graham (2011).
Figure B1 (see Appendix B) illustrates the time trends in litigations over the period 2003-2009 for the top
10% IPC 4-digit classes and clearly demonstrates that there is a significant variation over time in litigation
events within technological classes.
16 The Darts-IP dataset covers judgments across different Court levels (first instance, appeal, Supreme Court),
based on manual collection in courts. As a consequence, the unit of observation is the court decision, not
the case filing; in some countries some cases may be dropped before reaching a judgement, so the number
of court decisions can be lower than the (unobserved) number of patent suit filings. According to the data
provider, the coverage is not universal: while in bigger countries like US, France and UK the coverage is
close to 100% of the decisions, in other countries it reaches the 70-80%, and increases over time.

ECO/WKP(2014)23
20
4.2 Identifying the role of public policies
4.2.1 The baseline model
46. The role of policies in explaining the observed cross-country differences in the magnitude of
these flows is explored by introducing interaction terms between the firm-level patent stock and framework
policies (see equation 3). The quantitative indicators, sourced from the OECD and other agencies (see
Table 3 for a description), are used to proxy the stance of various framework policies.
isctscti
j
ctisct
j
j
isctisct PPatSPatSY *)ln()ln(ln 21 [3]
where P refers to various framework policies (see Table 3), which are first included in the regression
separately. For ease of interpretation, each policy variable (i.e. P) is re-scaled to equal zero for the United
States (i.e. the US value has been subtracted from each observation of the policy variable) so that β1 can be
interpreted as the US-specific estimated effect. All other terms are identical to those in the baseline
specification outlined in equation [1].
47. While equation [3] explores how policies shape the impact of changes in the patenting stock on
firm size for the average firm in the sample, there are reasons to suspect that the impact of policies may
vary with the characteristics of the firm. For example, regulations that impose a fixed cost on firms may
disproportionately affect young firms that typically have fewer resources to absorb such costs. Moreover,
to the extent that younger firms have a comparative advantage in radical innovations (see Henderson,
1993; Tushman and Anderson, 1986), evidence that policies have a disproportionate effect on younger
firms is likely to be of particular interest to policymakers. Thus, to explore the extent to which policies
have heterogeneous effects according to the firm’s age, the following equation is estimated:
isctsctiit
j
ctisct
j
j
it
j
ctisct
j
j
itisctitisctisct
OldPPatS
YgPPatSOldPatSYgPatSY
**)(ln
**)(ln*)ln(*)ln(ln
4
321
[4]
where Ygit is a dummy variable equal to one if firm i is less than or equal to 5 years of age in 2006 (the
mid-point of the sample), and zero otherwise. Oldit is a dummy variable equal to one if firm i is more than
5 years of age in 2006, and zero otherwise. The age of a firm is based on a firm’s date of incorporation in
ORBIS. All other terms are identical to those in the baseline specification outlined in equation [3].
4.2.2 Differences in differences estimation
48. To test the robustness of the baseline policy estimates, we explore whether the magnitude of the
impact of policies that shape the impact of patenting on firm size is stronger in sectors that are more likely
to be exposed to the policy at hand, due to their inherent technological characteristics. This approach,
popularised by Rajan and Zingales (1998), is based on the assumption that there exist industries that have
‘naturally’ high exposure to a given policy (i.e. the treatment group), and such industries – to the extent
that the policy is relevant to the outcome of interest – should be disproportionally more affected than other
industries (i.e. the control group). In other words, identification will be obtained comparing the differential
impact of patenting on firm characteristics (e.g. employment) between highly exposed industries and
marginally exposed industries in countries with different policy settings. While this approach does not
provide an estimate of the average effect of the policy of interest as in the baseline model (Section 4.2.1), it
nonetheless represents a useful robustness test to the core policy conclusions.

ECO/WKP(2014)23
21
Table 3. Policy variables, structural factors and relevant industry characteristics in difference-in-differences estimator
Variable Country-level variable Industry-level exposure variable
EPL EPL is the OECD Employment Protection
Legislation (EPL) sub-index of restrictions on
individual dismissal of workers with regular
contracts.
Layoff rates (defined as the percentage ratio of annual
layoffs to total employment) at the industry level in the
United States. Sourced from Bassanini et al., (2009).
Firm entry rates obtained from Haltiwanger et al.,
(2006).
PMR PMR is the overall index of the OECD product
market regulation index. Firm turnover rate (defined as the entry rate + exit rate)
at the industry level in the United States. Sourced from
Bartelsman et al., (2013).
Barriers to trade and
investment
Sub-index from the OECD product market
regulation index.
Trade intensity at the industry level in the United States
proxied by the sum of exports and imports divided by
output. Data are sourced from the OECD STAN
database and refer to the year 2002.
Stock market
capitalisation to GDP
Sourced from the World Bank. The variable measuring industries’ dependence on
external finance is computed from information contained
in the Thomson Financial Worldscope database for US
listed firms with less than 1000 employees. These
estimates are sourced from de Serres et al., (2006) and
following Rajan and Zingales (1998), a firm’s
dependence on external finance is defined as its capital
expenditure minus internal funds (cash flow from
operations) divided by capital expenditure.
Seed and early stage
finance
Investment in seed and early stage financing as a per
cent of GDP, 2005. OECD calculations, based on
Pricewaterhouse Coopers/National Venture Capital
Association MoneyTree™ Report.
Firm entry rates obtained from Haltiwanger et al.,
(2006).
Expansion stage
venture capital
finance
Investment in seed and early stage financing as a per
cent of GDP, 2005. OECD calculations, based on
Pricewaterhouse Coopers/National Venture Capital
Association MoneyTree™ Report.
Firm entry rates obtained from Haltiwanger et al.,
(2006).
Bankruptcy law The stringency of bankruptcy rules is measured by
an indicator of the cost to close a business, sourced
from the World Bank. Data from 2004.
Firm turnover rate.
External finance dependency at the industry level in the
United States (see above).
Judicial efficiency The cost of enforcing contracts – which measures
court costs and attorney fees as a per cent of the debt
value – sourced from the World Bank Doing
Business Indicators.
Firm turnover rate
49. Thus, to further explore the heterogeneous impact of policies, the term (lnPatS*P) is interacted
with a relevant index of sectoral exposure (E) to the policy at hand, to form a triple interaction term in the
following model:
iscttcsi
sisctcisct
j
s
j
ctisct
j
j
isct SPatSCPatSEPPatSY
*)ln(*)ln(**)ln(ln 321
[5]
As is typical in this type of framework, the specification allows the impact of PatS on Y to vary according
to the country and sector by including interaction terms between PatS and: (i) a vector of country dummies

ECO/WKP(2014)23
22
(C); and (ii) a vector of sectoral dummies (S). The specification also controls for firm fixed effects and
sector, country and year fixed effects. The parameter of interest is δ1. For example, if P corresponds to
Employment Protection Legislation (EPL) and δ1<0, then the adverse effect of stringent EPL on the
responsiveness of firm characteristics to patenting is stronger in more exposed sectors – such as those with
high job layoff rates – than less exposed sectors.
50. Industry-level indexes of exposure are taken from the large literature exploiting a similar
framework to infer the relevance of country-level policies on a number of economic outcomes. The
exposure indexes are generally computed from US data to the extent that the United States is generally
perceived to be a low regulation (i.e. “frictionless”) country. Accordingly, the United States is excluded
from the analysis. See Table 3 for details on the country-level policy variables of interest and the
corresponding industry-level exposure variables used in the difference-in-differences estimator.
4.3 Identification concerns
51. Before proceeding, a number of caveats should be kept in mind when interpreting the results.
First, the paper’s primary aim is to highlight some potentially informative cross-country empirical
regularities using the estimation approach in Balasubramanian and Sivadasan (2011), but this approach
does not specifically address the issue of causality. While the instrumental variables estimator described in
Section 4.1.3 makes some progress on this front, the results (discussed in Section 5.1.3) only focus on the
link between patenting and firm size, and do not focus on how public policies might shape this
relationship. That said, an effort is made to reproduce the main policy conclusions using alternative
estimation frameworks – which might be less susceptible to endogeneity problems (such as differences-in-
differences estimation) – in order to improve the credibility of the policy recommendations, though further
work in this area is clearly required.
52. Second, due to the nature of the underlying data, national borders are imposed on firms. For
example, a firm is assigned to each country in which an unconsolidated account is published, and different
accounts in different countries are treated as different firms. Although an alternative patent measure based
on patents at group level is utilised (as described above), the increasingly international dimension of many
businesses may still affect the results. For instance, countries with many multinational enterprises (MNEs)
may see most of the occupational gains from patenting to occur in production sites located abroad, and the
intensity of this effect may correlate negatively with the country’s size and openness (assuming that small
open economies are more likely to offshore production). Since an exploration of the within-firm and
cross-country effect of patenting is beyond the scope of this paper, the effects studied in this paper are thus
bounded by national borders, although as discussed in Section 6, we do make an (albeit crude) attempt to
control for this issue.
53. Third, the number of variables used to proxy a firm’s inputs and output is limited, and patenting
may affect the firm’s production structure along other unobserved dimensions (e.g. skill intensity, product
scope or the within-firm wage distribution). This issue is difficult to address given existing data sources
and thus the quantification of the extent to which firms adjust to the patent stock is limited to a set of
standard variables.
54. Finally, the extent to which firms react to a change in patent stock may also depend on the quality
of the patent system and the level of enforcement of IP rights. The former source of heterogeneity should
not be a major concern, since the estimates are remarkably stable across specifications based on patents
filed at international or national patent offices, respectively. The latter source of country heterogeneity is
partly dealt with by the inclusion of measures of civil justice efficiency among the policy variables
analysed; however, some countries have specialised courts for IP disputes, whose efficiency may not be
correctly measured by the general civil justice indicators.

ECO/WKP(2014)23
23
5. Empirical results
5.1 Do resources flow to patenting firms?
5.1.1 Baseline results
55. The upper panel of Table 4 shows the estimated sensitivity of firm characteristics with respect to
the patent stock (based on a depreciated patent count).17
The results show a statistically significant link
between patenting and firm size. For example, for the average firm in the sample, the estimates imply that
a 10% increase in the patent stock is associated with about a 1% increase in employment, a 1.3% increase
in the capital stock, a 0.3% increase in capital intensity, a 1.2% increase in turnover, and a 0.5% rise in
value-added. The association between patenting and productivity is small and positive, but not statistically
significant, which is broadly consistent with Balasubramanian and Sivadasan (2011).
Table 4. Sensitivity of firm characteristics with respect to the patent stock: baseline estimates
Selected OECD countries, 2003-2010 using yearly variation
Notes: Robust standard errors clustered at the firm level in parenthesis. Patent stock is calculated as the log(X+1) where X is the cumulated number of USTPO, EPO, or PCT granted patents since the 1980 depreciated at the rate 15% per year. Patent stock - Families stock is calculated as the log(X+1) where X is the depreciated number of individual patent families (INPADOC classification). ***, **, * denotes statistical significance at the 1%, 5% and 10% levels respectively. Data on value added is less widely available than turnover due to missing data on intermediate inputs; the lower coefficient for value-added compared to turnover largely reflects the more limited sample. The TFP estimates are based on Wooldridge (2009) procedure with imputations based on industry averages for missing data; see Gal (2013) for details.
56. As a robustness check of the estimates, equation [1] was re-estimated solely for the United States
manufacturing sector and compared to the estimates in Balasubramanian and Sivadasan (2011). While
analysis in this paper is based on a lower quality data set and refers to a later time period than in the
17 Given the wide set of fixed effects included and the sheer size of the dataset, regressions are incomputable
with a standard PC and traditional panel fixed-effect procedures. Therefore, estimates are obtained through
an algorithm for estimation of a linear regression model with two high dimensional fixed effects
implemented in STATA by Guimaraes and Portugal (2010).

ECO/WKP(2014)23
24
aforementioned study, it is reassuring that the results from this exercise were in the same ballpark to those
presented in Balasubramanian and Sivadasan (2011).18
57. The lower panel of table 4 shows that the estimates are almost identical when an alternative
measure of the patent stock, based on the depreciated count of distinct patent families, is employed. A
patent family is a group of patents, granted by different patent offices, which share the same priority
application.19
Patent families may be a better proxy for innovative ideas, as companies generally tend to
patent the same inventions to many distinct patent offices around the world.
58. Table 5 shows the results from a long difference specification – i.e. just a cross-section of
2009-2003 differences.20
Long differences might better pick up long-run effects to the extent that they are
less subject to measurement error than year-to-year differences or fixed effects specifications, but they may
also exacerbate selection bias since only surviving firms are included. While the coefficient estimates in
the first four columns of Table 5 for employment, capital, capital intensity and turnover are similar or
somewhat larger to the corresponding coefficients in Table 4, the coefficient on value added is two-to-three
times larger in the long difference specification relative to the baseline estimates. At the same time, the
coefficient on the patent stock in the TFP regression becomes statistically significant at conventional
levels. The estimates imply that – for the average firm in the sample – a 10% increase in the patent stock is
associated with a 2-2½% increase in TFP, depending on the specification (see Tables 5 and B3). This
effect is significant at the 5% level in the specification based on the sample for which data is available for
all firms (see Table B3). While these results should be interpreted with caution given the well-known
problems with estimating TFP at the firm-level (see Gal, 2013), they are nonetheless consistent with the
idea that the impact of new ideas on productivity may take some time to be realised, possibly reflecting the
need for organisational restructuring.
18 These results are not presented for sake of brevity and are available from the authors on request.
19 The classification of patent families is based on the INPADOC definition.
20 The year 2009 (rather than the latest available year 2010) was chosen in order to maximise the number of
observations in the long differences equation.

ECO/WKP(2014)23
25
Table 5. Sensitivity of firm characteristics with respect to the patent stock: long differences
Selected OECD countries, 2003-2009
Notes: Robust standard errors clustered at the firm level in parenthesis. All variables are calculated as the difference between the 2009 and the 2003 value, and the sample is limited to firms for which data are available in both years. Patent stock is calculated as the log(X+1) where X is the cumulated number of USTPO, EPO, or PCT granted patents since the 1980 depreciated at the rate 15% per year. Patent stock - Families stock is calculated as the log(X+1) where X is the depreciated number of individual patent families (INPADOC classification). ***, **, * denotes statistical significance at the 1%, 5% and 10% levels respectively. Data on value added is less widely available than turnover due to missing data on intermediate inputs; the lower coefficient for value-added compared to turnover largely reflects the more limited sample. The TFP estimates are based on Wooldridge (2009) procedure with imputations based on industry averages for missing data; see Gal (2013) for details.
59. Table 6 introduces another measure of patent stock based on the patent portfolio of the group the
company belongs to. This is potentially important since firms belonging to the same group may access the
patent stock – and the knowledge base – of other affiliated firms. While the resulting ownership structure is
still likely to be incomplete due to the underlying data limitations, the results of this exercise show that
patents at the group level are indeed positively associated with firm performance, although the coefficients
of the firm’s patent stock are not affected by the inclusion of the new variable. This result suggests that
within-group knowledge flows provide an additional source of comparative advantage for firms belonging
to a group. In fact, it is consistent with a large literature on multinational enterprises, which suggests that
blueprints and knowledge that are replicable at a low cost within the group constitute the key advantage for
these firms over and above the more intensive use of researchers and larger R&D expenditure (Dunning,
1981; Markusen, 2004; Criscuolo et al., 2010).

ECO/WKP(2014)23
26
Table 6. Sensitivity of firm characteristics with respect to the patent stock: group patents
Selected OECD countries, 2003-2009 using yearly variation
Notes: Robust standard errors clustered at the firm level in parenthesis. The patent stock is calculated as the log(X+1) where X is the cumulated number of USTPO, EPO and PCT granted patents since the 1980 depreciated at the rate 15% per year. The group patent variable is calculated in the same way based on the patent stock of other affiliates of the same group. See appendix B for details on the group definition. The sample is limited to the period 2003-2009 as ownership information is not available for the year 2010. ***, **, * denotes statistical significance at the 1%, 5% and 10% levels respectively. The TFP estimates are based on Wooldridge (2009) procedure with imputations based on industry averages for missing data procedure; see Gal (2013) for details.
60. Thus far, the results suggest that patenting is associated with real changes in economic activity at
the firm level across a sample of selected OECD countries. If the observed increases in size are indeed
linked to patenting, it is reasonable to expect a correlation between the magnitude of size increases and the
underlying quality of the patent. To test this idea, an interaction between the patent stock and citation-
based measures of the average quality of patents filed by the firm are added to equation [1]. These
measures include (see Squicciarini et al., 2010): i) “Radicalness”: the number of different International
Patent Classification (IPC) classes cited that are different from the one the patent belongs to (i.e. radical
patents are those who bring insights from different technologies); and ii) the number of citations to the
non-patent literature (NPL), which proxies for the closeness of patents to science.
61. The results are outlined in Table 7 in a relatively smaller sample of countries since it was not
possible to construct patent quality measures for all countries (these estimates are based on EPO patents).
Relative to the baseline estimates that utilise a simple measure of patent counts, the results show that
increases in the radicalness-weighted patent stock is associated with larger increases in each firm
characteristic considered. These results correspond closely to the findings presented later in the paper,
which show that young firms are both more likely to file radical patents and demonstrate a higher
sensitivity of firm size to patenting than older firms (see Table 10, Panel A). At the same time, the
NPL-weighted patent stock is associated with a similar or marginally smaller impact on all size measures
except the capital to labour ratio. Overall, these results are consistent with the interpretation that size
changes accompanying patenting are related to innovation at the firm level.

ECO/WKP(2014)23
27
Table 7. Sensitivity of firm characteristics with respect to the patent stock: controlling for patent quality
European OECD countries, 2003-2010 using yearly variation
Notes: Robust standard errors clustered at the firm level in parenthesis. The patent stock is calculated as the log(X+1) where X is the cumulated number of granted patents since the 1980 depreciated at the rate 15% per year. ***, **, * denotes statistical significance at the 1%, 5% and 10% levels respectively. The TFP estimates are based on Wooldridge (2009) procedure with imputations based on industry averages for missing data procedure; see Gal (2013) for details.
5.1.2 An event study of the extensive margin
62. As a complement to the within-firm analysis presented in Section 5.1.1, this section reports
results from the estimation of equation [2b] which compares the post-patent performance of the first-time
patentees with a control group of non-patentee firms. This model essentially estimates the extensive margin
of patenting, i.e., the change in firm performance associated with the switch from being a non-patentee to
being a patentee firm. It is important to acknowledge that the data requirements of this exercise are quite
stringent and as such, the sample size is much smaller than in the baseline analysis.21
Partly for this reason,
the results from this exercise should be treated only as suggestive and interpreted with some caution.
63. As explained in Section 4.1.2, the extensive margin is estimated by pairing each first time
patentee with an otherwise similar non patentee, and by comparing their performance before and after the
first patent has been filed for by the patentee. If significant differences emerge in the outcome variable
21 The sample is limited to firms that appear at least 6 times between 2002 and 2009 and which belong to
countries with at least 100 observations. Among those, there are 784 first time patentees in the year 2005 or
2006. Each of them is matched to a similar non-patentee; the final sample therefore amounts to 1568 firms
observed over a maximum of 9 years.

ECO/WKP(2014)23
28
from the year in which the patent application is filed – but not in preceding years – this would suggest that
resources tend to flow to firms that patent for the first time (in addition to firms that already patent and
increase the size of their patent stock).
64. The coefficients’ estimates are shown in Table B4 of Appendix B and are more intuitively
illustrated in Figure 2. The figure shows that, one year after the first patent, patentees have on average 5%
more employees and 10% more fixed capital than a non-patentee with similar inputs endowment over the
four previous years. Two years after the first patent, the difference is around 9% for employment, and 12%
for capital. These differences are statistically significant and increase over time, while in the years before
patenting, there a no significant differences in these outcome variables. Overall, these results provide
further support for the idea that the size changes accompanying patenting are related to innovation at the
firm level.
Figure 2. Event study analysis of first time patentees relative to closest peer
Propensity score matching estimator based on first-time patent filers in 2005-2006; average effect across countries in the sample.
A: Employment
B: Capital
Notes: The chart shows the estimated level difference in employment (left pane) and fixed capital stock (right panel) between patentees and non-patentees. Dotted lines report 5% confidence interval. The estimated coefficients are reported in Table B4.
5.1.3 Instrumental variables estimation
65. To check whether the link between patenting and firm size is causal, Table 8 presents the IV
estimates where the firm patent stock is instrumented by the litigation propensity indicator developed in
Section 4.1.3. The first stage regression output in Panel C shows a statistically significant relationship
between the “technological field weighted” exposure of firms to litigation risk and the firm patent stock,
thereby demonstrating the strength of the instrument. The IV estimates in Panel B confirm that there is a
statistically significant relationship between the patent stock and firm size. As discussed in Appendix C,
these results are robust to a falsification test (Panel D of Table 8), which suggests that the second stage
results are unlikely to be biased by a long-run firm specific trend that is correlated with both the
technological specialisation of the firm in the pre-sample period and its economic activity during the period
of analysis. While this suggests that the baseline relationship can be interpreted as causal, the magnitude of
the IV coefficients is larger than the OLS estimates shown in Panel A and the IV estimates are clearly less
precise as demonstrated by the size of the standard errors. Nevertheless, the significance of the IV
estimates is encouraging and future work will focus on further refining this approach.

ECO/WKP(2014)23
29
Table 8. Sensitivity of firm characteristics with respect to the patent stock: instrumental variables estimates
Selected OECD countries, 2003-2010 using yearly variation
Notes: Robust standard errors clustered at the firm level in parenthesis. For computation reasons, the sample is limited only to firms with variation in patent stock over the sample period. The patent stock is calculated as the log(X+1) where X is the cumulated number of USTPO, EPO, and PCT granted patents since the 1980 depreciated at the rate 15% per year. ***, **, * denotes statistical significance at the 1%, 5% and 10% levels respectively.
5.2 Cross-country differences in resource flows to patenting firms
66. The results in Section 5.1 show that on average across a sub-sample of OECD countries,
patenting is associated with real changes in economic activity at the firm level. In this section, the extent to
which resource flows to patenting firms vary across countries is explored. One simple – albeit relatively
crude – way to do this is to interact the patent stock – i.e. PatS in equation (1) – with various country
dummies. The estimated coefficients (reported in Table B5 of Appendix B) capture the average country-
specific relationship between patenting and resource flows over the sample period. Of course, it is
important to note that this exercise is implemented for purely illustrative purposes and provides only an
Capital /
Employment
0.0973*** 0.126*** 0.0294*** 0.0988*** 0.0518*** 0.00927
-0.00747 -0.0118 -0.00982 -0.00935 -0.00808 -0.00658
Firm fixed effects Yes Yes Yes Yes Yes Yes
Country-year fixed effects Yes Yes Yes Yes Yes Yes
Number of observations 72,905 72,700 72,700 70,929 40,809 55,025
0.625** 0.779** 0.178 0.741** 1.113* 0.340
(0.278) (0.372) (0.381) (0.329) (0.600) (0.290)
Firm fixed effects Yes Yes Yes Yes Yes Yes
Country-year fixed effects Yes Yes Yes Yes Yes Yes
Number of observations 72,905 72,700 72,700 70,929 40,809 55,025
Kleibergen-Paap rk Wald F
statistic21.64 21.02 21.02 19.24 5.785 13.52
-1.788*** -1.763*** -1.763*** -1.742*** -1.157** -1.628***
-0.384 -0.384 -0.384 -0.397 -0.481 -0.443
Firm fixed effects Yes Yes Yes Yes Yes Yes
Country-year fixed effects Yes Yes Yes Yes Yes Yes
Number of observations 72,905 72,700 72,700 70,929 40,809 55,025
-0.099 -0.074 -0.074 -0.122 0.124 0.076
-0.307 -0.308 -0.308 -0.313 -0.39 -0.344
Firm fixed effects Yes Yes Yes Yes Yes Yes
Country-year fixed effects Yes Yes Yes Yes Yes Yes
Number of observations 72,905 72,700 72,700 70,929 40,809 55,025
TFPEmploymentCapital
StockTurnover Value added
Placebo IV
PANEL B: INSTRUMENTAL VARIABLES ESTIMATION (SECOND STAGE 2SLS)
PANEL C: FIRST STAGE (Dependent variable: Patent stock)
PANEL D: FALSIFICATION TEST (Dependent variable: Patent stock)
PANEL A: OLS PANEL F.E. ESTIMATION
Patent stock (firm) - OLS
Patent stock (firm) - IV
Patent litigation propensity

ECO/WKP(2014)23
30
average correlation over the period. When identifying the impact of policies in Section 5.3, what generally
matters is how these relationships change over time at the firm level.
67. With the above caveats in mind, Figure 3 uses these estimated coefficients for a selected set of
countries to calculate the association between a 10% change in the patent stock and the change in capital
and employment, for the average firm in our sample. While not all country-specific estimates are
statistically different from one another – that is, the standard errors are relatively wide in some cases –
some interesting cross-country differences nonetheless emerge when the focus in narrowed to the more
precisely estimated effects. For example, a 10% increase in the firm level patent stock is associated with
about a 3% rise in firm capital in Sweden and the United States; a 1½-2% increase in firm capital in the
UK, Japan and Germany; and a ½-¾ % rise in firm capital in Italy (Figure 3; Panel A). Similarly, the ease
with which patenting firms in the United States can attract labour is roughly twice as large as the average
OECD country (Figure 3; Panel B).
Figure 3. Cross-country differences in resource flows to patenting firms?
Change in firm inputs associated with a 10% change in patent stock; selected OECD countries (2003-2010)
A: Capital
B. Employment
Notes: The black dot shows the country-specific point estimate of eq. (1), while the grey bands denote the 90% confidence interval (note that the confidence intervals vary across countries due to differences in the number of observations). The same estimates are reported in Table B5 of Appendix B. The sample is restricted to countries in which at least 300 new patents are granted over the sample period and/or the country-specific coefficients are statistically different from zero.

ECO/WKP(2014)23
31
68. These patterns bear some resemblance to cross-country differences in post-entry employment
dynamics, which illustrate that young firms in the United States – and to a lesser extent, Sweden – exhibit
“up-or-out” dynamics (Haltiwanger et al., 2013; Criscuolo et al., 2014). That is, young firms either:
i) grow very rapidly; or ii) they fail and exit the market rather than remaining in business as low-
performing small firms, suggesting that market selection is very harsh and reallocation significant in such
environments. By contrast, the potential growth of firms in Southern European countries – particularly
Italy – is much lower, which tends to manifest itself in a high share of old and small firms, which tend to
be less innovative. From a policy perspective, this predominance of old and small firms raises the risk that
valuable resources (e.g. human and physical capital) are clogged up in undersized and inefficient firms,
which in turn makes it more difficult for high productivity firms to attract resources and grow (Acemoglu
et al., 2013), bearing on aggregate productivity developments.69. At the same time, a number of somewhat
surprising results emerge which may reflect the limitations of this analysis. For instance, the low sensitivity
of resources to patenting in countries such as Denmark and Finland (see Table B5) may reflect the fact that
firms in small open economies may expand abroad rather than domestically, but it is difficult to capture
this margin of adjustment with the available data. Additional analysis suggests that patenting has a larger
effect on average profitability and wages than firm size in these countries, but this cannot explain all of the
observed differences.
5.3 Role of public policy
5.3.1 Baseline results
70. Table 9 summarises the estimation results of equation [3] for two dependent variables –
employment and capital – when one policy interaction is included at a time. As already mentioned, each
policy variable has been re-scaled to equal zero for the United States. Thus, the coefficient on PatS can be
interpreted as the US-specific effect, while the interaction term PatS*Policy provides an estimate of the
additional effect of an increase in the relevant policy index relative to the United States.
71. Overall, while causality is difficult to establish, the results are consistent with the idea that well
designed framework policies can raise the expected returns to innovative activity, by making it easier for
patenting firms to attract the tangible resources required to implement and commercialise new ideas.
Focusing first on statistical significance, a number of results emerge:
Less efficient judicial systems – as measured by a higher cost of enforcing contracts – are
associated with a lower responsiveness of firm employment and capital to patenting. This is
consistent with research showing that difficulties in enforcing contracts lower the returns to
innovation (Nunn, 2007) and make it more costly to hire the skilled workers necessary to
underpin firm growth (Bloom et. al., 2012).
Bankruptcy regimes that more severely penalise failure – as measured by a higher cost to close a
business – are associated with a lower responsiveness of firm employment and capital to
patenting. This finding provides a dynamic perspective to existing research, which shows that
stringent bankruptcy regimes disproportionately lower static allocative efficiency in sectors with
naturally higher firm turnover rates where regulations affecting exit costs are most likely to bind
(Andrews and Cingano, 2014). More broadly, by lowering the returns to innovation, the adverse
effects of poorly designed bankruptcy regimes on the allocative efficiency could explain why less
debtor-friendly bankruptcy codes have been associated with lower intensity of patent creation,
patent citations and slower growth in countries relatively more specialised in innovative
industries (Acharya and Subramanian, 2009).

ECO/WKP(2014)23
32
Table 9. The impact of framework policies on resource flows to patenting firms: baseline estimates
One policy interaction included in each regression; using yearly variation
Note: Robust standard errors clustered at country-industry level in parenthesis. The patent stock is calculated as the log(X+1) where X is the cumulated number of USTPO, EPO, and PCT granted patents since the 1980 depreciated at the rate 15% per year. Firm fixed effects and country-sector-year fixed effects are included in all regressions. *** significant at 1%, ** significant at 5%, * significant at 10%. The sample is limited to 21 OECD countries for which policy variables are available: Austria, Belgium, Czech Republic, Denmark, Finland, France, Germany, Greece, Hungary, Italy, Japan, Netherlands, Norway, Poland, Portugal, Slovak Republic, Spain, Sweden, Switzerland, United Kingdom and the United States.
More cumbersome product market regulation (PMR) is associated with a lower responsiveness of
firm employment to patenting. This may reflect the tendency for such regulations to raise the cost
structure of inputs that are required by innovative firms to underpin their expansion (Bourlès et
al., 2013). Similarly, in less competitive environments, valuable resources (e.g. skilled labour)
may be more likely to be trapped in inefficient firms, making it more difficult for high potential
firms to expand.
More stringent barriers to trade and investment are associated with a lower sensitivity of firm
capital to changes in the patent stock. This is in line with existing research that shows that across
OECD services sectors, higher restrictions on FDI are associated with lower static allocative
efficiency (Andrews and Cingano, 2014).
More stringent employment protection legislation (EPL) is associated with a lower
responsiveness of firm employment and capital to patenting. This is consistent with existing
research which highlights the adverse effects of stringent EPL on reallocation mechanisms
(Andrews and Cingano, 2014; Bravo-Biosca et al., 2013).

ECO/WKP(2014)23
33
The importance of finance to promoting the growth of patenting firms is affirmed by a number of
results, which is in line with a host of studies that highlight the importance of financial
development for firm growth (Aghion et al., 2007; Bravo-Biosca et al., 2013). For example:
More developed markets for seed and early stage venture capital (VC) are positively
associated with resource flows (as measured by employment and capital) to patenting firms.
The same is true for deeper stock markets with respect to firm employment and VC markets
at the expansion stage with respect to firm capital.22
72. Table B6 explores the robustness of the baseline policy estimates in Table 9 to the inclusion of
selected multiple policy interaction terms. Given the computational burdens involved, we implement a
baseline specification that includes EPL and one product market regulation term (overall PMR for
employment and barriers to trade and investment for capital) and then an additional policy interaction at
time (these policies correspond to finance, bankruptcy and judicial inefficiency). While the baseline policy
results are qualitatively robust to the inclusion of multiple policy interaction terms, in a few instances some
coefficients become insignificant. This presumably reflects a multicollinearity issue, given the relatively
high correlation between some of the policy variables in our analysis. This is particularly the case for the
early stage finance term – strongly correlated with the two product market regulation variables (the
correlation coefficient between this variable and PMR and BTI is around 0.6) – which becomes
insignificant in the employment equation (Panel A, column 3) and in the capital equation (Panel B,
column 2). The same is true for the overall PMR interaction (Panel A, column 2), which loses statistical
significance when the stock market capitalisation interaction is included (the correlation between these two
variables is around 0.7).
73. To provide a sense of the economic significance of these results, the policy experiments in
Figure 4 illustrates how the estimated flow of resources to patenting firms varies with different public
policy settings. Using the coefficients from Table 9, the figure shows the per cent change in employment
and capital associated with a 10% increase in the patent stock when the policy variable of interest is set
equal to the sample minimum, mean and maximum values respectively. For example, Panel A shows that
the sensitivity of firm employment to changes in the patent stock is more than three times larger when
PMR is relatively low (e.g. the United Kingdom), compared to when PMR is very stringent (e.g. in
Poland). To the extent that these relationships can be interpreted as causal, these examples of comparative
statics suggest that framework policies could significantly affect the extent to which patenting firms can
attract the tangible resources required to implement and commercialise new ideas.
22 However, the impact of banking regulation on resource flows to patenting firms is unclear.

ECO/WKP(2014)23
34
Figure 4. Framework policies and resource flows to patenting firms, 2003-2010
A: Change in firm employment associated with a 10% change in the patent stock
B: Change in firm capital associated with a 10% change in the patent stock
Note: The chart shows that the sensitivity of firm employment and capital to changes in the patent stock varies according to the policy and institutional environment. To calculate the policy effects, coefficient estimates from Table 8 are combined with the average values of the policy indicators for each country over the sample period. The labels “Minimum” (“Maximum) denotes the country with the lowest (highest) average value for the given policy indicator over the sample period.
5.3.2 Heterogeneous effects: policies and firm age
74. Thus far, the estimated impact of framework policies on resource flows to patenting firms
pertains to the average firm in the sample. However, to the extent that the characteristics of firms vary
significantly, even within narrowly defined industries (Syverson 2011), policies that appear neutral in
design may have non-neutral impacts on firms because of the diversity of firms characteristics. For
example, firm age might be a particularly relevant characteristic to the extent that regulations that impose a
fixed cost on firms may disproportionately affect young firms that typically have fewer resources to absorb
such a cost. At the same time, emerging research highlights the importance of young firms for employment
creation (see Haltiwanger et al., 2013; Criscuolo et al., 2014) and facilitating the expansion of successful
innovative start-ups is particularly important for long-run growth. This is because firms that drive one
technological wave often fail to continue to do so in the subsequent one, as they tend to concentrate on

ECO/WKP(2014)23
35
incremental improvements (Benner and Tushman, 2002), and young firms possess a comparative
advantage in commercialising radical innovations (Henderson, 1993; Tushman and Anderson, 1986).23
Indeed, these ideas are borne out in Table B7, which documents a robust negative relationship between
firm age and the two indicators of the patent radicalness introduced in Table 7. The estimates in column 2
imply that the number of citations to the non-patent literature (which proxies the closeness of patents to
science) could be expected to be about 16% higher for a relatively young firm aged 5 years compared to a
firm aged 30 years.
Table 10. The heterogeneous impact of framework policies on resource flows to patenting firms: young versus old firms
One policy interaction included in each regression; using yearly variation
Notes: Robust standard errors clustered at country-industry level in parenthesis. The patent stock is calculated as the log(X+1) where X is the cumulated number of granted patents since the 1980 depreciated at the rate 15% per year. Young firms are defined as firms that are 5 years of age or less in 2006 – the midpoint of the sample. Firm and country-sector-year fixed effects are included in all regressions. *** significant at 1%, ** significant at 5%, * significant at 10%.
75. Accordingly, Table 10 explores the extent to which the estimated effects vary with the age of the
firm (e.g. equation 4). The top left panel shows how the relationship between patenting and firm size varies
with the age of the firm. The estimates suggest that the sensitivity of firm size with respect to changes in
the patent stock is around twice as large for young firms than for older firms, and this difference is
statistically significant at the 5% level (as illustrated by the F-test). The remaining panels of Table 10
explore whether the impact of selected policies on the sensitivity of firm size to patenting varies according
to the age of the firm. In most cases, the impact of policies does not vary with the age of the firm (and thus
not all policy variables are reported in the Table). However, young firms appear to be particularly sensitive
to EPL, with the positive effect of a one unit reduction in the OECD EPL Index (on the impact of patenting
on capital) being about three times larger for young firms than older firms (the F-test suggests that this
23 The same is true for implementing innovations that appear relatively incremental from a technological
point of view but require fundamental organisational restructuring (Henderson and Clark, 1990).

ECO/WKP(2014)23
36
difference is statistically significant for capital but not employment).24
This may reflect the idea that young
firms are more sensitive to rigidities in the reallocation process, given that they are more likely to
experiment with uncertain technologies (see Andrews and Criscuolo, 2013). The same is true with respect
to higher stock market capitalisation and, unsurprisingly, young firms are much more sensitive to the
availability of seed and early stage financing than older firms.
5.3.3 Heterogeneous effects: differences-in-differences estimation
76. If framework policies influence the ease with which innovative firms can attract tangible
resources, it is reasonable to expect that the impact of policies should be more evident in sectors that, a
priori, are likely to be more exposed to a given policy, owing to their technological characteristics for
example. Accordingly, Tables 11 and B8 present the differences-in-differences coefficient estimates for the
parameter δ1 on the triple interaction term j
s
j
ctisct EPPatS **)ln( in equation [5] for the firm employment
and capital stock regressions respectively. To the extent that this specification is particularly demanding
from a computational perspective, we limit the differences-in-differences estimation to focus on the subset
of policy interaction terms that are statistically significant in Table 9. Since we are interested in testing the
robustness of our baseline policy estimates, we focus on the sign and statistical significance of the
differences-in-differences coefficient estimates, as opposed to their economic magnitude (which are more
difficult to infer given that they measure indirect effects).
77. This exercise confirms many of the baseline findings from Table 9, and provides some useful
insights into the channels through which our baseline policy effects may operate. For example:
In sectors that are particularly dynamic and have more intense reallocation needs (i.e. those with
more firm entry, job layoffs and firm turnover rates), patenting firms can more easily attract
resources in environments where: i) EPL is less stringent (see Columns 1-2 of Tables 11 and B8);
ii) markets for seed and early stage venture capital are more developed (see Column 3 of Tables
11 and B8); iii) bankruptcy legislation is less punishing of business failure (see Columns 4-5 of
Tables 11 and B8); iv) judicial systems are more efficient (Column 6 of Table 11); and v) product
market regulations are less cumbersome (Column 7 of Table 11).
In sectors more dependent on external financing, resource more readily flow to patenting firms in
environments where stock market capitalisation to GDP is higher (Column 8 of Table 11) and
bankruptcy legislation is less punishing of business failure (Columns 5 of Tables 11 and B8).
Finally, in sectors with higher trade intensity, more stringent barriers to international trade and
investment are associated with a lower sensitivity of firm capital to patenting relative to other
sectors (Column 7 of Table B8).
24 A one unit reduction in the EPL index (on regular contracts) roughly corresponds to the difference between
Switzerland and the United States in 2008.

ECO/WKP(2014)23
37
Table 11. The impact of framework policies on employment flows to patenting firms: differences-in-differences estimator
One policy interaction included in each regression; using yearly variation
Notes: Robust standard errors clustered at country-industry level in parenthesis. The patent stock is calculated as the log(X+1) where X is the cumulated number of USTPO, EPO, and PCT granted patents since the 1980 depreciated at the rate 15% per year. Firm fixed effects and country-sector-year fixed effects are included in all regressions. *** significant at 1%, ** significant at 5%, * significant at 10%. The corresponding estimates for the firm capital stock are reported in Table B9.
6. Extensions and robustness tests
78. The baseline results are robust to a number of sensitivity tests, including:25
Addressing the potential bias originating from the log(X+1) transformation. This is done in two
different ways:
Estimating separately the coefficient on patent stock in two subsamples: only firms with a
positive patent stock (Table B2, Panel A), and firms patenting for the first time (Table B2,
Panel B). In the first case, the (always positive) patent stock can be expressed in simple
logarithmic form (without adding one) and the coefficients are estimates of the intensive
margin effect only. In the second case, the main dependent variable is a “patentee” dummy
equal to one if the patent stock is positive, and zero otherwise. The sample is limited to zero-
patent firms and to “switchers”, i.e., firms that change their status from non-patentee to
patentee over the sample period, while always-patentees are dropped. Results are broadly
consistent across the two samples, suggesting that the effect at the intensive and extensive
margin is comparable.
Including a zero patent dummy to the baseline regressions. This method – already used in the
patent literature (Klette, 1996) – tests whether the estimates are robust to accounting for a
25 Some of these results are not reported for sake of brevity, but are available from the authors upon request.

ECO/WKP(2014)23
38
potential heterogeneous effect at the intensive and extensive margin, respectively. The
estimates coefficients are very similar to those obtained from the baseline regressions.
Controlling for some potentially confounding country factors that might be correlated with
policies. These include: (a) interactions between the Patent Stock and real GDP (in level and per
capita terms) to control for the possibility that small countries may be more likely to choose a
certain set of policies; and (b) interactions between the patent stock and outward FDI flows to
control for the possibility that in more globally oriented economies, firms might be more likely to
expand their operations offshore following a change in the patent stock. These results are
reported in Table B9, and most policy interactions retain their statistical significance.
Using a measure of the patent stock that is not depreciated and restricting the sample to the set of
firms for which employment, capital, turnover, and valued added are all available.
Controlling for firm-level R&D expenditures: if the within-firm variation in R&D expenditures is
positively correlated with changes in other inputs (namely employment and capital), then the
estimated (positive) relationship between these variables and patenting activity could be partly
spurious given the well-documented positive correlation between R&D and patenting.
Unfortunately, R&D data in ORBIS are very incomplete (data are only available for about 35 000
firm*year observations) so is not possible to control for R&D in the baseline specification.
Nevertheless, estimation performed on this limited sub-sample of firms indicates that while the
impact of R&D expenditures is positive and statistically significant, the coefficient on the patent
variable is unaffected by either the sample reduction or the inclusion of the additional control.
7. Conclusions
79. This paper exploits a novel cross-country OECD database on firm performance and patenting
activity to explore what happens when firms patent. The results suggest that changes in patenting are
associated with real changes in economic activity at the firm level and new evidence is presented to
suggest that the link between patenting and firm size is causal.
80. In turn, the paper highlights some interesting cross-country differences in patterns of reallocation
toward patenting firms. Important differences emerge in the ease with which patenting firms can attract the
tangible resources required to underpin the implementation and commercialisation of new ideas. Although
patenting is an imperfect measure of innovation, these results points to a more general assessment of the
role of national policies and framework condition in shaping the flow of resources to the most innovative
firms. For instance, one interpretation is that the returns to innovation vary across OECD countries and the
econometric analysis indicates that cross-country differences in the functioning of product, labour and
capital markets, in the efficiency of judicial systems and in the design of bankruptcy laws can provide
some explanation of why the expected returns from patenting activities may vary. The benefits of well-
designed policies in these areas are partly realised through stronger competitive pressures and more
efficient reallocation, which make it easier for successful firms to implement and commercialise new ideas
and, by lowering the costs of failure, encourage firms to experiment with uncertain growth opportunities.
81. To the best of our knowledge, this is the first paper to explore cross-country differences in
resource flows to patenting firms and further research on this issue is required. Indeed, a number of
avenues for future research emerge. First, the data underlying the current paper is based on matching
administrative data on patents and the commercial database ORBIS. As discussed this raises issues related
to sample representativeness and coverage, and it warrants some caution when interpreting some of the
results presented, e.g. on young firms. Therefore, one avenue for further research is to use information

ECO/WKP(2014)23
39
from matching patent data with business register data, which cover the whole population of businesses and
survey data based on stratified random samples from National Statistical Offices.
82. Second, the paper currently considers only two specific characteristics of firms’ patent portfolio:
radicalness, defined as the number of different IPC classes cited, and closeness to science. Current OECD
research (Squicciarini et al., 2013) is developing additional indicators of novelty and radicalness as well as
other features of patents, such as scope and originality.
83. Third, the data used in this analysis only allow an investigation of the growth of firms within
national boundaries. However, firms might grow and expand abroad, especially if they operate in small
open economies and if they can replicate their ideas at a low cost. As discussed in the previous section, the
relationship between patenting and firm size does not vary consistently with the extent of outward Foreign
Direct Investment (FDI) at the aggregate level, but clearly firm-level data on FDI is required to test this
hypothesis properly.

ECO/WKP(2014)23
40
REFERENCES
Acemoglu, D. and J. Linn (2004), “Market Size in Innovation: Theory and evidence from the
Pharmaceutical Industry,” Quarterly Journal of Economics 119(3), pp. 1049–1090.
Acemoglu, D., U. Akcigit, N. Bloom and W. Kerr (2013), “Innovation, Reallocation and Growth” NBER
Working Paper No. 18993.
Aghion, P., P. Howitt and D. Mayer-Foulkes (2005), "The Effect Of Financial Development On
Convergence: Theory And Evidence," Quarterly Journal of Economics, 120(1), pp. 173-222.
Aghion, P., T. Fally and S. Scarpetta (2007), “Credit Constraints as a Barrier to the Entry and Post Entry
Growth of Firms: Theory and Evidence”, Economic Policy 22(52), pp.731-779.
Andrews, D. and C. Criscuolo (2013), “Knowledge-Based Capital, Innovation and Resource Allocation”,
OECD Economics Department Working Papers, No.1046.
Andrews, D. and F. Cingano (2014), “Public Policy and Resource Allocation: Evidence from firms in
OECD countries” Economic Policy, Issue 74 April.
Andrews, D. and A. de Serres (2012), “Intangible Assets, Resource Allocation and Growth: A Framework
for Analysis”, OECD Economics Department Working Papers, No.989.
Acharya, V.V. and K.V. Subramanian (2009), “Bankruptcy Codes and Innovation”, Review of Financial
Studies 22 (12): 4949-4988.
Arnold, J., G. Nicoletti and S. Scarpetta (2011), “Regulation, Resource Reallocation and Productivity
Growth”, Nordic Economic Policy Review, Issue 2.
Balasubramanian, N. and J. Sivadasan (2011), “What Happens when Firms Patent? New Evidence from
U.S. Economic Census Data”, Review of Economics and Statistics, No. 93(1): 126–146.
Baldwin, J.R. and W. Gu (2006), Competition, Firm Turnover and Productivity Growth, Research Paper
Economic Analysis, Research Paper Series, Statistics Canada.
Bartelsman, E.J., P.A. Gautier and J. De Wind (2010), “Employment Protection, Technology Choice, and
Worker Allocation”, IZA Discussion Paper No. 4895.
Bartelsman, E.J. and H.L.F. De Groot (2004), “Integrating Evidence on the Determinants of Productivity”,
in G. Gelauff, L. Klomp, S. Raes, Th. Roelandt (Eds.), Fostering Productivity: Patterns,
Determinants and Policy Implications, Amsterdam e.a.: Elsevier, pp. 160-184.
Bartelsman, E., J. Haltiwanger and S. Scarpetta (2004), "Microeconomic Evidence of Creative Destruction
in Industrial and Developing Countries", IZA Discussion paper No 1374.
Bartelsman, E., J. Haltiwanger and S. Scarpetta (2013). "Cross-Country Differences in Productivity: The
Role of Allocation and Selection," American Economic Review, 103(1): 305-34.

ECO/WKP(2014)23
41
Bas, M., Å. Johansson, F. Murtin and G. Nicoletti (2013), “Do Lower Tariffs on Foreign Intermediate
Inputs Raise Productivity? Panel Data Evidence for OECD Countries”. OECD Economics
Department Working Papers, forthcoming, OECD, Paris.
Bloom, N. and J. Van Reenen (2010), “Why Do Management Practices Differ across Firms and
Countries?”, Journal of Economic Perspectives 24(1), pp. 203–224.
Bloom, N (2012), “Does Management Matter: Evidence from India”, Mimeo.
Bourlès, R., et al. (2010), "Do Product Market Regulations in Upstream Sectors Curb Productivity
Growth?: Panel Data Evidence for OECD Countries", Review of Economics and Statistics, 95(5), pp.
1750-1768
Bravo-Biosca, A. (2010a), Growth Dynamics: Exploring business growth and contraction in Europe and
the US, NESTA and FORA, London.
Bravo-Biosca, A., C. Criscuolo and C. Menon (2013),"What Drives the Dynamics of Business Growth?",
STI Working Paper, forthcoming.
Criscuolo, C., J. Haskel and M.J. Slaughter (2010), "Global engagement and the innovation activities of
firms," International Journal of Industrial Organization, vol. 28(2), pages 191-202.
Criscuolo, C, P. Gal, C. Menon (2014), “The Dynamics of Employment Growth: New Evidence from
17 Countries” OECD STI Policy Papers No. 14.
David, P.A. and G. Wright (2003), “General Purpose Technologies and Productivity Surges: Historical
Reflections on the Future of the ICT Revolution,” in The Economic Future in Historical Perspective,
Edited by P. A. David and M. Thomas, Oxford University Press for the British Academy.
Disney, R, J. Haskel and Y. Heden (2003), Restructuring and Productivity Growth in UK Manufacturing,
Economic Journal 113, 666-694.
Dunning, J.H. (1981), International Production and the Multinational Enterprise George, Allen, and
Unwin, London.
Eisfeldt, A.L. and A.A. Rampini (2006), ““Capital Reallocation and Liquidity”, Journal of Monetary
Economics, No. 53, pp. 369-399.
Fabbri, D. (2010), “Law enforcement and Firm Financing: Theory and evidence”, Journal of the European
Economic Association 8(4): 776 -816.
Foster, Lucia, Haltiwanger, John, and C.J. Krizan (2001). “Aggregate Productivity Growth: Lessons from
Microeconomic Evidence.” in Edward Dean, Michael Harper and Charles Hulten eds. New
Developments in Productivity Analysis, Chicago: University of Chicago Press.
Foster, L., J.C. Haltiwanger and C. J. Krizan (2006), Market Selection, Reallocation, and Restructuring in
the U. S Retail Trade Sector in the 1990s, Review of Economics and Statistics 88, 748-758
Gal, P. (2013), “Measuring Total Factor Productivity at the Firm Level using OECD-ORBIS”, OECD
Economics Department Working Papers, forthcoming, OECD, Paris.
Garicano L, C. LeLarge J. Van Reenen (2011), “Firm Size Distortions and the Productivity Distribution:
Evidence from France” NBER Working Paper No. 18841.

ECO/WKP(2014)23
42
Goolsbee, Austen (1998), "Does R&D Policy Primarily Benefit Scientists and Engineers?" American
Economic Review (Papers and Proceedings), 88(2), May 1998, 298 - 302.
Gonnard, E and A. Ragoussis (2013), “The OECD-ORBIS database: treatment and benchmarking
procedures”, STD Working Paper, Forthcoming.
Goto, A., Nagata, A. (1997). “Technological Opportunities and Appropriating the Returns from
Innovation”. National Institute of Science and Technology Policy NISTEP Report no.48 (March)
Griliches, Z., (1990). Patent Statistics as Economic Indicators: A Survey, Journal of Economic Literature,
American Economic Association, vol. 28(4), pages 1661-1707, December.
Griliches, Z. (1998). Patent statistics as economic indicators: a survey. In R&D and productivity: the
econometric evidence (pp. 287-343). University of Chicago Press.
Guimaraes P, and P. Portugal (2010). A Simple Feasible Alternative Procedure to Estimate Models with
High-Dimensional Fixed Effects, Stata Journal, 10(4), 628-649, 2010.
Hall, B. H., A. B. Jaffe, and M. Trajtenberg (2005), “Market Value and Patent Citations,” Rand Journal of
Economics, 36, 16–38
Hall, B.H. and J. Lerner (2009), "The Financing of R&D and Innovation", NBER Working Paper
No. 15325.
Haltiwanger, J.J., S. Scarpetta and H. Schweiger (2006), “Assessing Job Flows across Countries: The Role
of Industry, Firm Size and Regulations”, World Bank Policy Research Working Paper No. 3613,
October.
Haltiwanger, J. (2011), "Firm Dynamics and Economic Performance", mimeo.
Haltiwanger, J, R. Jarmin and J. Miranda (2013), “Who Creates Jobs: Small vs Large vs Young” Review of
Economics and Statistics 95(2), pp. 347-61.
Hsieh, C-T. and P. Klenow (2009), "Misallocation and Manufacturing Productivity in China and India,"
Quarterly Journal of Economics, 124(4), pp. 1403-1448,
Jappelli, T., M. Paganoand M. Bianco (2005). Courts and banks: Effects of judicial enforcement on credit
markets, Journal of Money, Credit and Banking 37(2): 223-44.
Jovanovic, B. and P.L. Rousseau (2002), “The Q-Theory of Mergers”, American Economic Review Papers
and Proceedings 91, pp. 336–341.
Klette, T. J. (1996). R&D, Scope Economies, and Plant Performance, RAND Journal of Economics, The
RAND Corporation, vol. 27(3), pages 502-522, Autumn.
Kogan, L., D. Papanikolaou, A. Seru and N. Stoffman (2012), “Technological Innovation, Resource
Allocation and Growth”, NBER Working Paper No. 17769.
Lentz, R. and D.T. Mortensen (2008), “An Empirical Model of Growth Through Product Innovation”,
Econometrica, 76(6), pp. 1317–1373.
Markusen, J.R (2004), Multinational Firms and the Theory of International Trade, MIT Press Books, The
MIT Press.

ECO/WKP(2014)23
43
Nagaoka S., K. Motohashi, A. Goto, (2010) Patent Statistics as an Innovation Indicator, In: Bronwyn H.
Hall and Nathan Rosenberg, Editor(s), Handbook of the Economics of Innovation, North-Holland,
Volume 2, Pages 1083-1127.
Nunn, N. (2007), “Relationship-Specificity, Incomplete Contracts and the Pattern of Trade", Quarterly
Journal of Economics, (122) 2, pp. 569-600.
OECD (2003), The Sources of Economic Growth in OECD Countries, OECD Publishing.
doi: 10.1787/9789264199460-en
OECD (2010), Innovation Strategy OECD, Paris.
Olley, G.S and A. Pakes (1996), "The Dynamics of Productivity in the Telecommunications Equipment
Industry", Econometrica, 64(6), pp. 1263-97.
Pakes, A., and Z. Griliches (1980). Patents and R&D at the firm level: A first report. Economics
Letters, 5(4), 377-381.
Pozzi, A., and F. Schivardi (2012), “What drives firm growth? The role of demand and TFP shocks,” paper
presented at Society for Economic Dynamics Meeting.
Restuccia, D. and R. Rogerson (2008), "Policy Distortions and Aggregate Productivity with Heterogeneous
Plants," Review of Economic Dynamics, 11(4), pp. 707-720.
Schmookler, J (1966), Invention and Economic Growth (Cambridge, MA: Harvard University Press).
Syverson, C. (2004), "Substitutability and Product Dispersion," Review of Economics and Statistics,
86 (2), pp. 534-550.
Syverson, C. (2011), “What Determines Productivity?” Journal of Economic Literature, 49(2), pp. 326–
365.
Van Zeebroeck, Nicolas and Graham, J. H.Stuart (2011), “Comparing Patent Litigation Across Europe: A
First Look” Available at SSRN: http://ssrn.com/abstract=1924124 .

ECO/WKP(2014)23
44
APPENDIX A: A SIMPLE ALGORITHM TO DEFINE GROUPS IN ORBIS
1. This note describes the procedure implemented to refine the information available in the OECD-
ORBIS (June 2011) dataset on firms’ ownership structure with the aim to create a group identifier. The
identifier allows to significantly refining the information of firms’ patenting, for several reasons. First, it is
plausible to assume that firms belonging to a group can also access the patent stock – and the relative
knowledge base – of other affiliated firms. Second, firms belonging to a group may be different from
singleton firms in their ability to attract resources; this may be particularly relevant in the case of
multinational groups. Third, identifying group patents may also limit the bias originating from the firm-
patent matching procedure. Such a matching is based on a probabilistic similarity score and whenever a
patent is matched with similar probability to two firms some disambiguation rules need to be applied. One
of these rules says that, in the case in which the disambiguation involves a headquarters and its affiliate,
the former becomes the owner of the patent. This may introduce a relevant bias if the analysis is based on
unconsolidated accounts (as it is the case in this paper).
2. The ORBIS June 2011 dataset contains information on ownership; however, further elaboration
on this data is needed in order to obtain a meaningful, although approximate, group identifier for most
companies. This appendix describes the procedure which was developed for this purpose.
3. ORBIS ownership information is organised in year-specific tables containing the following
columns: the identifier of the owned firm (BVD_ID), the identifier of the shareowner firm (SH_BVD_ID),
the kind of linkage (LINK_TYPE), the share of direct ownership (DIRECT), and the share of total
ownership (TOTAL). Individual owned companies can have more than a shareholder, and owned-
shareholder pairs can appear with different linkages and ownership shares. LINK_TYPE can take the
following values: GUO (global ultimate owner), DUO (domestic ultimate owner), ISH (intermediate
shareholder), and ACT (active).
4. A first issue to address is that not all the owned companies are matched to a GUO; around 40%
are matched to an ISH. However, some of those ISHs are listed themselves as owned companies; this
implies that their ultimate owner is also the ultimate owner of the company they own. An example may
clarify the problem: A is owned by B, and B is an ISH, not a GUO. In the ownership table there are no
other owners of A listed companies. However, a few lines below, a record shows that B is owned by C, and
C is defined as a GUO (see table A1). It logically follows that C is also the GUO of A, and that A, B, C all
belong to the same group. It would therefore be useful to create a table like Table 2.
Table A1 – Original table example
BVD_ID SH_BVD_ID LINK_TYPE
A B ISH
B C GUO
Table A2 – Final desired output
BVD_ID GUO GROUP ID
A C 1
B C 1
C 1

ECO/WKP(2014)23
45
5. In this simple case, only one step is needed to find the ultimate owner for company A. However,
it could also be possible that the steps are more than one, because the owner of the first company is itself
owned by an intermediate shareholder, and so on. Furthermore, each company can have more than one
intermediate shareholder, thus different alternative paths may lead to different ultimate GUOs. As a
consequence, if the ownership structure is not simplified at every step, the web of links may growth
exponentially and the process may become unmanageable, also considering the sheer dimension of the
dataset, which makes the whole procedure very computing intensive.
6. Therefore, the algorithm is based on three main assumptions aimed at simplifying the ownership
structure. These assumptions are necessary to keep the process manageable but they are not neutral, and
they should be customised according to the different scopes the grouping process. They could also be
related to the size of the dataset: smaller datasets allow weaker assumptions, are the need to reduce the
number of links by simplifying the ownership structure is less stringent.
7. In the specific case of the group identifier developed for this paper, the assumptions are the
following: direct and total ownership conveys the same message; all the ownership links below a set
threshold (25%) of ownership rate, or with missing information, are considered to be irrelevant and are
therefore dropped; in the case of multiple ownership links defined as “ultimate” (i.e., where the owner is
either a DUO or a GUO), only the one with the highest share (direct or total) is kept.
8. The algorithm is composed by three steps which are sequentially performed and are iteratively
repeated until all companies have a final GUO, i.e., a non-owned owner, listed.
– The first step simplifies the ownership links, by performing the following operations:
a. All links where direct and total ownership shares are both below 25% are dropped.
b. If there are multiple BVD_ID – SH_BVD_ID combinations and one of these is a GUO link,
only the latter is kept.
c. If there are multiple BVD_ID – SH_BVD_ID combinations and none of these is a GUO link,
the one(s) with the highest total ownership share are kept.
d. If there are multiple owners for the same BVD_ID and one of these is a GUO link, only the
latter is kept.
– The second step stores the BVD_ID which have a listed GUO already.
– The third step joins the list of all companies which do not have a GUO yet with itself and with
the list of all companies with a GUO which have been previously stored. The number of times
each company is listed in the new joined table is equal to the number of owners of their owners:
i.e., if company A has N owners which in turn have K owners each, it appears in N*K rows in the
dataset. This step also updates the ownership shares (direct and total) with the product of the
share of the first linkage with the share of the second linkage.
– The procedure then restarts from step one.

ECO/WKP(2014)23
46
APPENDIX B: ADDITIONAL EMPIRICAL TABLES AND CHARTS
Figure B1. Litigation propensity varies significantly across time and IPC
Human Necessities
Performing Operations, Transporting
Chemistry, Metallurgy
Fixed Constructions
Mechanical Engineering, Lighting, Heating, Weapons & Physics
Electricity

ECO/WKP(2014)23
47
Table B1. Sample composition by year and country
Notes: the table reports the number of firm-level observations for which the employment variable is not missing by country and year.

ECO/WKP(2014)23
48
Table B2. Intensive and Extensive margins
Selected OECD countries, 2003-2010 using yearly variation
Notes: Robust standard errors clustered at the firm level in parenthesis. Patent stock is calculated as the log(X) where X is the cumulated number of USTPO, EPO, or PCT granted patents since the 1980 depreciated at the rate 15% per year. Patentee dummy is equal to one if the firm’s patent stock is positive, and zero otherwise. Panel A regressions are limited to firms with a positive patent stock. Panel B regressions include all available observation except firms that are patentees since the beginning of the sample period. ***, **, * denotes statistical significance at the 1%, 5% and 10% levels respectively. The TFP estimates are based on Wooldridge (2009) procedure with imputations based on industry averages for missing data; see Gal (2013) for details.

ECO/WKP(2014)23
49
Table B3. Sensitivity of firm characteristics with respect to the patent stock: long difference in common sample
Selected OECD countries, 2003-2009
Notes: Robust standard errors clustered at the firm level in parenthesis. All variables are calculated as the difference between the 2009 and the 2003 value, and the sample is limited to firms for which data are available in both years. Patent stock is calculated as the log(X+1) where X is the cumulated number of USTPO, EPO, or PCT granted patents since the 1980 depreciated at the rate 15% per year. Patent stock - Families stock is calculated as the log(X+1) where X is the depreciated number of individual patent families (INPADOC classification). ***, **, * denotes statistical significance at the 1%, 5% and 10% levels respectively. Data on value added is less widely available than turnover due to missing data on intermediate inputs; the lower coefficient for value-added compared to turnover largely reflects the more limited sample. The TFP estimates are based on Wooldridge (2009) procedure with imputations based on industry averages for missing data; see Gal (2013) for details.
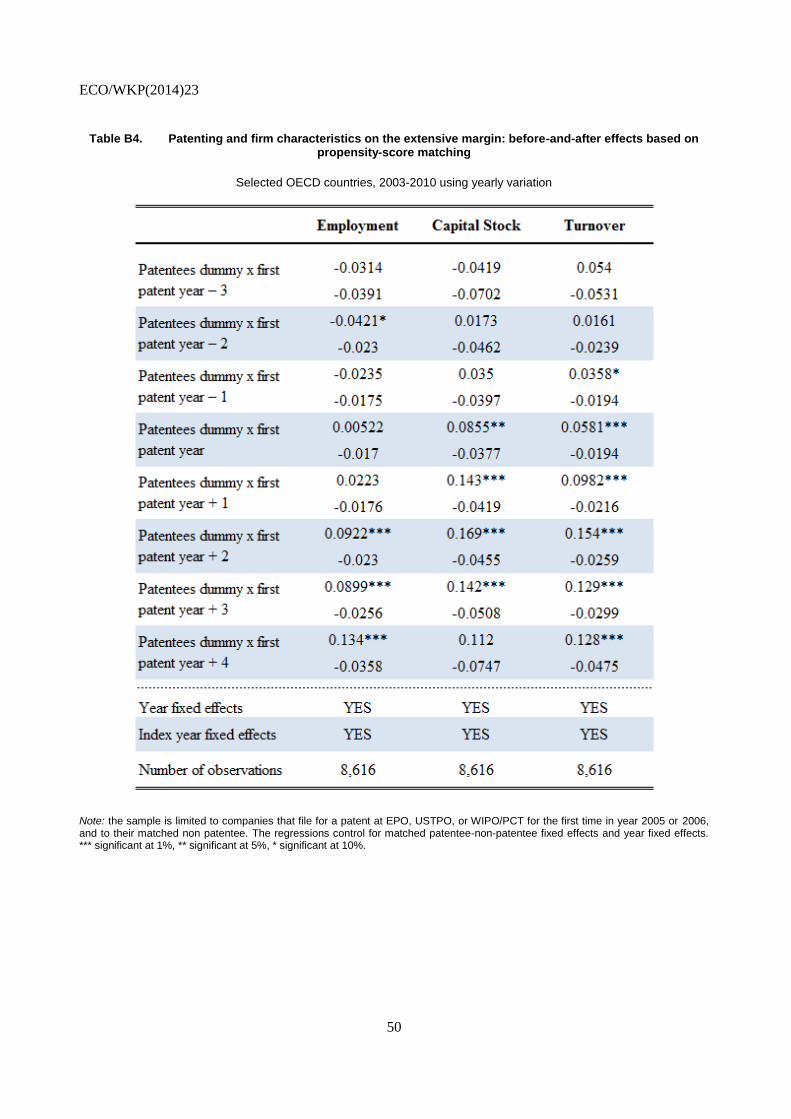
ECO/WKP(2014)23
50
Table B4. Patenting and firm characteristics on the extensive margin: before-and-after effects based on propensity-score matching
Selected OECD countries, 2003-2010 using yearly variation
Note: the sample is limited to companies that file for a patent at EPO, USTPO, or WIPO/PCT for the first time in year 2005 or 2006, and to their matched non patentee. The regressions control for matched patentee-non-patentee fixed effects and year fixed effects. *** significant at 1%, ** significant at 5%, * significant at 10%.

ECO/WKP(2014)23
51
Table B5. Country specific coefficient estimates of the sensitivity of firm characteristics with respect to the patent stock
Selected OECD countries, 2003-2010 using yearly variation
Note: the coefficients refer to the patents or patent families stock interacted with a country dummy. The sample includes countries with at least 300 firms patenting at least once over the period of analysis. Robust standard errors in parenthesis. The patent stock is calculated as the log(X+1) where X is the cumulated number of granted patents since the 1980 depreciated at the rate 15% per year. Firm fixed effects and country-sector-year fixed effects are included in all regressions. *** significant at 1%, ** significant at 5%, * significant at 10%.

ECO/WKP(2014)23
52
Table B6. The impact of framework policies on resource flows to patenting firms: robustness
Multiple policy interaction included in each regression; using yearly variation
Note: Robust standard errors clustered at country-industry level in parenthesis. The patent stock is calculated as the log(X+1) where X is the cumulated number of granted patents since the 1980 depreciated at the rate 15% per year. Firm fixed effects and country-sector-year fixed effects are included in all regressions. *** significant at 1%, ** significant at 5%, * significant at 10%..

ECO/WKP(2014)23
53
Table B7. Young firms’ patent stock is more radical and closer to science
European OECD countries, 2003-2010 using yearly variation
Notes: Robust standard errors clustered at the firm level in parenthesis. The patent stock is calculated as the log(X+1) where X is the cumulated number of USTPO, EPO, and PCT granted patents since the 1980 depreciated at the rate 15% per year. ***, **, * denotes statistical significance at the 1%, 5% and 10% levels respectively. As discussed in the main text with respect to Table 7, radicalness refers to the number of different International Patent Classification (IPC) classes cited different from the one the patent belong to (i.e. radical patents are those who bring insights from different technologies); and the number of citations to the non-patent literature (NPL), proxies for the closeness of patents to science.

ECO/WKP(2014)23
54
Table B8. The impact of framework policies on employment flows to patenting firms: differences-in-differences estimator
Selected OECD countries, 2003-2010 using yearly variation
Notes: Robust standard errors clustered at country-industry level in parenthesis. The patent stock is calculated as the log(X+1) where X is the cumulated number of USTPO, EPO, and PCT granted patents since the 1980 depreciated at the rate 15% per year. Firm fixed effects and country-sector-year fixed effects are included in all regressions. *** significant at 1%, ** significant at 5%, * significant at 10%. The corresponding estimates for firm employment are stored in Table 11.

ECO/WKP(2014)23
55
Table B9. The impact of framework policies on resource flows to patenting firms: robustness check
One policy interaction included in each regression, controlling for FDI and GDP using yearly variation
Note: Robust standard errors clustered at country-industry level in parenthesis. The patent stock is calculated as the log(X+1) where X is the cumulated number of granted patents since the 1980 depreciated at the rate 15% per year. Firm fixed effects and country-sector-year fixed effects are included in all regressions. *** significant at 1%, ** significant at 5%, * significant at 10%.

ECO/WKP(2014)23
56
APPENDIX C: FALSIFICATION TEST FOR INSTRUMENTAL VARIABLES STRATEGY
1. One potential challenge to the validity of the IV strategy is the presence of a possible long-run,
firm-specific trend that is correlated with both the technological specialisation of the firm in the pre-sample
period (before 2003) and with its economic activity during the period of analysis (post 2003). This in turn
would imply that the technology share weights used to build the instrumental variable and the output
variable in the second-stage regression are correlated, violating the exclusion restriction. We therefore
design a falsification test which, although not conclusive, may give an indication whether this could
actually be an issue in our data. The test involves regressing the endogenous variable on a placebo
instrumental variable. The latter is calculated as the interaction of the vector of a firm’s technological
shares with a randomly sorted vector of litigation propensity by technological class; i.e., while in the real
IV each share is multiplied by the litigation propensity in the same technology, in the placebo IV the
technological classes do not (necessarily) match:
∑ [4]
2. If the unobserved firm-specific trend is driving some of the correlation between the patent stock
and the IV, then the placebo IV should turn out to be significant in the first-stage regressions. However, as
reported in Panel D of Table 8, this is never the case.

ECO/WKP(2014)23
57
WORKING PAPERS
The full series of Economics Department Working Papers can be consulted at www.oecd.org/eco/workingpapers
1126. Macroprudential policy tools in Norway: Strengthening financial system resilience
(June 2014) by Yosuke Jin, Patrick Lenain and Paul O’Brien
1125. Strengthening competition in Poland
(June 2014) by Balász Égert and Antoine Goujard
1124. Making the labour market work better in Poland
(June 2014) by Hervé Boulhol
1123. Enhancing competition and the business environment in Hungary
(June 2014) by Alvaro Pina
1122. Tackling labour mismatches and promoting mobility in Hungary
(June 2014) by Stéphane Sorbe
1121. Local public finances and municipal reform in Finland
(June 2014) by Christophe André and Clara Garcia
1120. The economic consequences of ageing: the case of Finland
(June 2014) by Christine de la Maisonneuve, Christophe André, Clara Garcia
and Vincent Koen
1119. Making the most of skills in Denmark
(June 2014) by Stéphanie Jamet and Vincent Koen
1118. Trade specialisation and policies to foster competition and innovation in Denmark
(June 2014) by Müge Adalet McGowan
1117. Policies for making the Chilean labour market more inclusive
(June 2014) by Aida Caldera Sanchez
1116. Spillover effects from exiting highly expansionary monetary policies
(May 2014) by Łukasz Rawdanowicz, Romain Bouis, Jérôme Brezillon, Ane Kathrine
Christensen and Kei-Ichiro Inaba
1115. Economic policies and microeconomic stability: A literature review and some empirics
(April 2014) by Paula Garda and Volker Ziemann
1114. How to improve Israel’s health-care system
(April 2014) by Philip Hemmings
1113. How to improve taxes and transfers in Israel
(April 2014) by Philip Hemmings
1112. New evidence on the determinants of industrial specialisation
(April 2014) by Asa Johansson and Eduardo Olaberria

ECO/WKP(2014)23
58
1111. Economic growth from the household perspective: GDP and income distribution developments
across OECD countries
(April 2014) by Orsetta Causa, Sonia Araujo, Agnès Cavaciuti, Nicolas Ruiz and Zuzana
Smidova
1110. Would a growth slowdown in emerging markets spill over to high-income countries? A
quantitative assessment
(April 2014) By Patrice Ollivaud, Elena Rusticelli and Cyrille Schwellnus
1109. Short-term indicator models for quarterly GDP growth in the BRIICS: A small-scale bridge
model approach
(April 2014) by Thomas Chalaux and Cyrille Schwellnus
1108. The prudential regulation of financial institutions: why regulatory responses to the crisis might
not prove sufficient
(March 2014) by William R. White
1107. OECD forecasts during and after the financial crisis: a post mortem
(March 2014) by Nigel Pain, Christine Lewis, Thai-Thanh Dang, Yosuke Jin and
Pete Richardson
1106. Fairly sharing the social impact of the crisis in Greece
(January 2014) by Vassiliki Koutsogeorgopoulou, Manos Matsaganis, Chrysa Leventi and
Jan-David Schneider
1105. Dividing the pie in Brazil: income distribution, social policies and the new middle class
(January 2014) by Jens M. Arnold and João Jalles
1104. New indicators of competition law and policy in 2013 for OECD and non-OECD countries
(December 2013) by Enrico Alemani, Caroline Klein, Isabell Koske, Cristiana Vitale and
Isabelle Wanner
1103. The effect of government debt, external debt and their interaction on OECD interest rates
(December 2013) by David Turner and Francesca Spinelli
1102. The state of the banking sector in Europe (December 2013) by Dirk Schoenmaker and Toon Peek
1101. Getting Irish youth on the job track
(December 2013) by Alberto González Pandiella
1100. New econometric estimates of long-term growth effects of different areas of public spending
(December 2013) by Omar Barbiero and Boris Cournède
1099. Cross-country spillovers from fiscal consolidations
(December 2013) by Antoine Goujard
1098. Informal employment in Russia: definitions, incidence, determinants and labour market
segmentation
(December 2013) by Hartmut Lehmann and Anzelika Zaiceva

ECO/WKP(2014)23
59
1097. Capacity needs in the automobile industry in the short- to medium run
(November 2013) by Caroline Klein and Isabell Koske
1096. Environmental policies and productivity growth - a critical review of empirical findings
(November 2013) by Tomasz Koźluk and Vera Zipperer
1095. Green growth challenges and the need for an energy reform in Mexico
(November 2013) by Carla Valdivia de Richter
1094. From bricks to brains: increasing the contribution of knowledge-based capital to growth in
Ireland
(November 2013) by David Haugh
1093. China’s march to prosperity: reforms to avoid the middle-income trap
(November 2013) by Vincent Koen, Richard Herd and Sam Hill
1092. Multi factor productivity with natural capital
(November 2013) by Nicola Brandt, Paul Schreyer and Vera Zipperer
1091. Growth-promoting policies and macroeconomic stability
(November 2013) by Douglas Sutherland and Peter Hoeller
1090. Policies for inclusive urbanisation in China
(October 2013) by Vincent Koen, Richard Herd, Xiao Wang and Thomas Chalaux
1089. Fiscal devaluation – can it help to boost competitiveness?
(October 2013) by Isabell Koske
1088. How to achieve growth- and equity-friendly fiscal consolidation? A proposed methodology for
instrument choice with an illustrative application to OECD countries
(October 2013) by Boris Cournède, Antoine Goujard and Álvaro Pina
1087. Improving school-to-work transition in New Zealand
(September 2013) by Alexandra Bibbee
1086. The agri-food situation and policies in Switzerland
(September 2013) by Peter Jarrett and Charlotte Moeser
1085. Japan’s challenging debt dynamics
(August 2013) by Yvan Guillemette and Jan Strasky
1084. Transitions in and out of unemployment among young people in the Irish recession
(August 2013) by Elish Kelly, Seamus McGuinness, Philip O’Connell, David Haugh and
Alberto González Pandiella


![Unbiased Testing Under Weak Instrumental Variables€¦ · Unbiased Testing Under Weak Instrumental Variables Abstract ThispaperfindsunbiasedtestsusingthreeofNagar’s[1959]k-classestimators:](https://static.fdocuments.us/doc/165x107/5e9970e0d7bf8a424c633a60/unbiased-testing-under-weak-instrumental-variables-unbiased-testing-under-weak-instrumental.jpg)

