Do Now Consider statistics. How is it relevant to real-life? What are some applications we can use...
19
Do Now Consider statistics. How is it relevant to real-life? What are some applications we can use it for? Give examples.
-
Upload
kerry-kelly -
Category
Documents
-
view
213 -
download
0
Transcript of Do Now Consider statistics. How is it relevant to real-life? What are some applications we can use...

Do Now
Consider statistics. How is it relevant to real-life? What are some applications we can use it for? Give examples.

Think
Looking at the data your class provided based on time to break toothpicks, what do you think the average time is for non-dominant hands?
How big is this population?
2 min

How to Describe Data

Today We Will…
Determine how to calculate mean, median, range, and mode of a data set
Determine how to calculate standard deviation

Mean You calculate the mean (also referred to as the average
or arithmetic mean) by summing all the data points in a data set (ΣX) and then dividing this number by the total number of data points (N):
this is the sample mean
What scientists want to understand is the mean of the entire population, which is represented by μ. They use the sample mean, represented by 𝑥̅�, as an estimate of μ.
Again, our sample gives us the best representation of our POPULATION

Example: Mean
Students in a biology class planted eight bean seeds in separate plastic cups and placed them under a bank of fluorescent lights. Fourteen days later, the students measured the height of the bean plants that grew from those seeds and recorded their results in Table 1.

Mean—example
Find the sum of the heights:7.5 + 10.1 + 8.3 + 9.8 + 5.7 + 10.3 + 9.2 + 8.7 = 69.6 centimeters
Count the number of height measurements: There are eight height measurements.
Divide the sum of the heights by the number of measurements to compute the mean: mean = 69.6 cm/8 = 8.7 centimeters
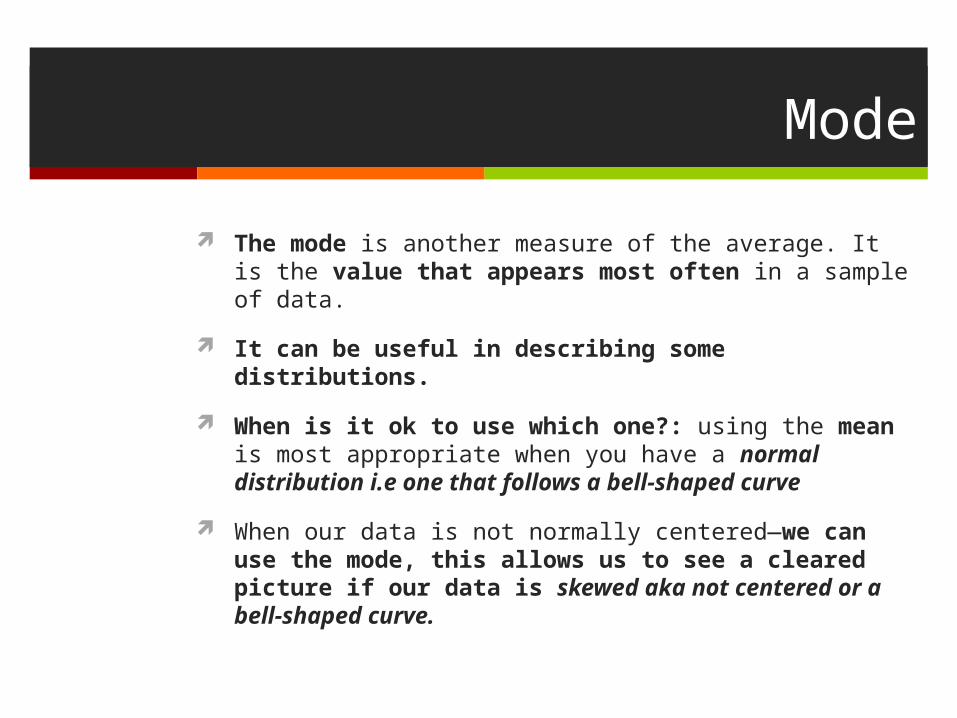
Mode
The mode is another measure of the average. It is the value that appears most often in a sample of data.
It can be useful in describing some distributions.
When is it ok to use which one?: using the mean is most appropriate when you have a normal distribution i.e one that follows a bell-shaped curve
When our data is not normally centered—we can use the mode, this allows us to see a cleared picture if our data is skewed aka not centered or a bell-shaped curve.

Median
The median is the data that falls directly in the center. If we were to list our data points in ascending order, we would find the number that lies directly in the center of our distribution.
Simply place the numbers in order and count the number that is directly in the middle of the list

Range The range tells us our spread: what is the
difference between the highest and lowest number in our data set?
1. Identify the largest and smallest values in the data set
2. To determine the range, subtract the smallest value from the largest value: range = 10.3 centimeters – 5.7 centimeters = 4.6 centimeters
Range cont’d
For any data, a larger range value indicates a greater spread of the data—in other words, the larger the range, the greater the variability

Do Now
Calculate the mean, median, mode, and range of the following data set:
45, 60, 96, 22, 33, 45,67 45, 88, 97, 36,56, 52

Toothpicks
How long will it take you to break 10 toothpicks with your non-dominant hand? Time your partner before doing your own investigation?.
Then when you’re done, break the 10 toothpicks with your dominant hand
Time yourself and place the time you got on the board in seconds.
Today we will…
Determine how to calculate standard deviation

Standard Deviation
The standard deviation provides a measure of the spread of the data from the mean.
The sample standard deviation is an estimate of the standard deviation in the larger population.

Standard Deviation Steps:
1. Calculate the mean ( ) of the sample. 𝑥̅ 2. Find the difference between each measurement (xi) and the sample mean (xi-
mean )
3. Square the difference (xi-mean)2
4. Add up (sum, Σ(xi- )2 all the squared differences
5. Divide by the degrees of freedom, which is 1 less than the sample size (n-1)
6. Take the square root
Sample standard deviation can either increase or decrease as a sample size gets larger.

Stdev Example
Salary Frequency
$3500 5
$4000 8
$4200 5
$4300 2
The following table shows the frequency and salary of 20 people total. Using the data table below, calculate the mean, median, mode, range, and standard deviation
Follow with example on the board.

Active Practice 1. The batting averages for 10 members of a baseball team are
0.234, 0.256, 0.321, 0.333, 0.290. 0.240, 0.198, 0.222, 0.300, and 0.276. Find the median batting average. Compare your mean to your median, which is larger?
2. One of the events in the Winter Olympics is the Men’s 500-meter Speed Skating. The times for this event are show to the right. Find the mean, median, and mode times. Find the range of the data set.
3. Look at your class data for the amount of time it took you and your classmates to break apart toothpicks with both their dominant and non-dominant hand. Calculate the mean, standard deviation, and range. Compare the two data sets and describe any variability that may have affected your standard deviation for both sets. Are there any patterns worth noticing, why?

Exit Slip
20, 24, 32, 22, 23, 32, 25
The numbers above are the ages for tenants within a building.
Find the mean, median, mode, range, and standard deviation for the particular data set of ages. Make sure you specifically state the units (age).