Do Natural Resources In uence Who Comes to Power, and...
27
Do Natural Resources Influence Who Comes to Power, and How? An Analysis of Oil Price Shocks, Elections and Conflict in Colombia * Maria Carreri † Oeindrila Dube ‡ July 2014 Abstract Do natural resources impair institutional outcomes? We examine this question with two innovations. First, existing work studies how natural resources influence the be- havior of leaders in power. In contrast, we study how they influence who comes to power. Second, past work has relied primarily on cross-country approaches. However, we use a within-country approach to better identify this relationship. In particular, we assess how oil price shocks affect local democracy in Colombia, a country mired in civil conflict. We show that when the price of oil rises in international markets, electoral participation and competition deteriorate more in oil-producing municipali- ties. Moreover, oil price hikes differentially alter the political equilibrium, increasing legislators affiliated with right-wing paramilitary groups, while reducing legislators af- filiated with leftist guerrillas. These effects are larger in conflict-ridden locations. Our findings highlight how natural resources undermine democracy by distorting elections, and suggest that conflict leaves the political sector more vulnerable to the resource curse. * We are grateful to Juan Vargas for sharing data on the party affiliation of legislators, and to Pablo Querubin for sharing data on mayoral elections. We thank Stephen Haber, Sendhil Mullainathan and David Stasavaage for useful discussions and suggestions. † New York University ([email protected]) ‡ New York University
Transcript of Do Natural Resources In uence Who Comes to Power, and...

Do Natural Resources Influence Who Comes to Power, and How?
An Analysis of Oil Price Shocks, Elections and Conflict in Colombia∗
Maria Carreri† Oeindrila Dube‡
July 2014
Abstract
Do natural resources impair institutional outcomes? We examine this question with
two innovations. First, existing work studies how natural resources influence the be-
havior of leaders in power. In contrast, we study how they influence who comes to
power. Second, past work has relied primarily on cross-country approaches. However,
we use a within-country approach to better identify this relationship. In particular,
we assess how oil price shocks affect local democracy in Colombia, a country mired
in civil conflict. We show that when the price of oil rises in international markets,
electoral participation and competition deteriorate more in oil-producing municipali-
ties. Moreover, oil price hikes differentially alter the political equilibrium, increasing
legislators affiliated with right-wing paramilitary groups, while reducing legislators af-
filiated with leftist guerrillas. These effects are larger in conflict-ridden locations. Our
findings highlight how natural resources undermine democracy by distorting elections,
and suggest that conflict leaves the political sector more vulnerable to the resource
curse.
∗We are grateful to Juan Vargas for sharing data on the party affiliation of legislators, and to PabloQuerubin for sharing data on mayoral elections. We thank Stephen Haber, Sendhil Mullainathan and DavidStasavaage for useful discussions and suggestions.†New York University ([email protected])‡New York University
1 Introduction
Do natural resources spur development? Paradoxically, some have argued that they actually
hinder development (Sachs and Warner 1995 and 2001; Sala-i-Martin and Subramanian
2013; Gelb 1988). A key reason for this hindrance may lie in how natural resources affect
politicians’ incentives (Ross 1999; Robinson et al. 2006; Caselli and Cunningham 2009;
Mehlum et al. 2006). For example, they may lower accountability by reducing taxation
(Madhavy 1970; Huntington 1991; and Morrison 2007), increasing repression (Caselli and
Tesei 2011) or enabling leaders to buy off the opposition (Acemoglu et al. 2004).
Given these possible distortions in the political sector, many empirical papers have tried
to assess how natural resources affect democracy. These studies have relied primarily on
cross-country variation and found mixed results, including: negative effects (Barro 1999;
Ross 2001; Jensen and Wantchekon 2004; Ramsay 2006; Aslaksen 2008; Tsui 2011; Bruckner
Ciccone and Tesei 2011); heterogenous effects (Dunning 2008; Caselli and Tesei 2011; Ross
2012; and Andersen and Ross 2012); and insignificant effects (Herb 2005; Alexeev and Conrad
2009; Haber and Menaldo 2011; Wacziarg 2011).1
Our paper has two innovations. First, existing work examines how natural resources
affect politicians’ behavior once in power.2 However, our work examines how they affect who
comes to power. After all, the desire to control windfall revenues from natural resources
may motivate influential groups to restrict electoral participation and alter election outcomes.
In addition, these groups may turn to violence in the fight for power. To investigate these
issues, we discern how natural resources affect electoral competition and the type of candidate
elected to office. We additionally examine the role of violence.
Our second innovation builds on the observation that it is difficult to identify causal
relationships between natural resources and democracy using cross-country data. As Haber
and Menaldo (2011) point out, it is inappropriate to pool countries together given their
heterogeneity. To sidestep this concern, we conduct a within-country analysis, and implement
a study design that addresses key identification challenges in the cross-country literature.
In particular, we examine how oil price shocks influence local elections in Colombia. Our
analysis harnesses panel data on the election of mayors and local councils in over 1,000
municipalities, covering the 1997-2007 period. We focus on electoral competition and politi-
cian selection, as measured by the political affiliation of winning candidates. Our empirical
strategy assesses whether movements in the international oil price, which are exogenous to
1Past work has also shown that nontax revenue, including oil revenue, exerts postive effects on regimestability (Morrison 2009).
2An exception is Caselli and Cunnginham (2009) who theorize that greater rents will incentivize morecandidates to run for office, increasing electoral competition.
1

Colombia’s production, influence these outcomes differentially in oil-dependent municipali-
ties. Oil dependence is measured by the amount of oil produced in each municipality prior
to the start of our sample period.
Colombia is the ideal context for examining this topic. Its long internal conflict has
bred many illegal armed groups that seek to control rents from natural resources and are
politically motivated. During our study period, left-wing guerrillas fought the state, and
right-wing paramilitary groups tried to counter these insurgents. Both types of groups em-
ployed politically-targeted violence to achieve their goals. But the paramilitaries additionally
engaged in direct electoral intervention. For example, evidence suggests that they intimi-
dated voters and channeled funds to politicians in exchange for favorable policies (Acemoglu
et al. 2013).
Our results show that rising oil value reduces the competitiveness of local elections and al-
ters the political affiliation of elected legislators differentially in oil-dependent areas. Positive
oil price shocks lower voter turnout; reduce the number of candidates and political parties
running in elections; and widen the vote margin with which officials get elected. They also
increase the election of mayors affiliated with right-wing paramilitary groups, and decrease
the share of local councilors from extreme left parties affiliated with the guerrillas. In short,
oil price shocks alter the political equilibrium.
Does violence play a role in these distortions? We uncover two pieces of evidence
suggesting it does. First, price shocks exert significant effects on the presence of armed
paramilitaries in oil-rich areas. This is consistent with an account in which illicit groups
try to control territories flush with resource rents, and intervene in elections to achieve con-
trol. Second, the presence of conflict in the years preceding our sample period serves as an
important moderating variable. In conflict locations, higher oil value reduces electoral com-
petition and determines who comes to office. In non-conflict locations, it has opposite effects,
increasing competition without affecting elections outcomes. These results support the idea
that resource revenue generally attracts more political contenders (Caselli and Cunningham
2009), unless armed groups suppress opponents, offsetting this effect. Overall, the findings
indicate that violence is a part of the story — something prior work on natural resources
and democracy has largely ignored.
Our within-country analysis has the disadvantage that it draws on data from one institu-
tional context. But this very feature offers at least three advantages for causal identification
relative to cross-country analysis in this area. First, cross-national measures of democracy
such as Polity and Freedom House rely on subjective assessments of political freedoms, which
may not be directly comparable across countries. In contrast, we employ objective measures
of participation in elections, which are clearly comparable across sub-national units. Second,
2

if natural resources are correlated with other unmeasured characteristics that influence insti-
tutional outcomes, these omitted variables may bias the estimates. Since characteristics are
more constant across municipalities relative to countries, municipal-level analysis minimizes
risk of potential omitted variables bias. Also, our analysis includes municipality fixed ef-
fects, which sweep out time-invariant municipal features potentially correlated with natural
resources and democratic outcomes. Finally, our difference-in-differences strategy uses two
sources of variation — cross-sectional variation across municipalities in oil production and
variation over time in the international price of oil. Importantly, this oil price is exogenous
to the production of any individual country such as Colombia, which holds a small share of
the world oil market. In contrast, this assumption is implausible for large producers in a
cross-country sample.
Our paper is complementary with two other within-country studies of the political re-
source curse. Both examine the effect of oil revenue in Brazil. Caselli and Michaels (2013)
show that municipal governments spend more but do not provide more public goods. Mon-
teiro and Ferraz (2012) find that mayors increase public employment and enjoy a short run
incumbency advantage. The biggest difference between our work and these papers is that
they focus on the behavior of leaders already in office, while we focus on competition and
who comes to office.3 In the remainder of the paper, we describe Colombia’s institutions, oil
production and internal conflict; detail the empirical strategy and data; present the results;
and conclude.
2 Democracy and Local Government in Colombia
Colombia has functioned primarily as a democracy since its independence in 1819, with the
exception of two periods of military intervention. One occurred during the mid-nineteenth
century. Another occurred in response to La Violencia, a violent confrontation between
the two traditional political parties, the Liberals and Conservatives, which took place over
1948-1958. National elections have occurred with regularity since that second period, and
the country’s polity-IV score of seven today places it within the democracy range.
The direct popular election of local officials, including mayors, governors and local coun-
cils was introduced in 1988. Since then, local elections have taken place at regular pre-
determined intervals of either two, three or four years. Our analysis focuses on elections of
mayoral and local councils, as these positions vary at the municipality level, and we aim to
3Monteiro and Ferraz (2012) also look at competition, but using a cross-sectional specification whichdiffers from their strategy in examining other outcomes. They also look at candidate characteristics such aseducation and occupation, but do not focus on party affiliation.
3

identify how municipal oil dependence influences local electoral outcomes.4 In our sample
period, these elections were held in 1997, 2000, 2003 and 2007.
Notably, mayors are not allowed to run for immediate re-election (Davila 2009), which
minimizes the extent of incumbency in this context.5 Mayors are also considered far more
powerful as compared to the local councils. Councils are essentially designed to assist mayors
in various activities such as planning public works projects. Yet, their functions and powers
are limited,6 and there has even been recent debate about whether these entities should be
abolished.7 The size of the local council varies based on municipal population, and each
municipality typically elects between seven and 21 councilors.8
Although Colombia’s electoral regime is functional, and basic rights to vote and run for
office are guaranteed by its Constitution, scholars have qualitatively noted that the ongoing
conflict and electoral manipulation by armed groups threatens to limit these freedoms, par-
ticularly in rural areas (Aviles 2006; Bejarano and Pizarro 2002). In this paper, our goal is
to identify how an important natural resource, and its interaction with the ongoing conflict,
shape Colombian democracy dynamics.
3 The Oil Sector
Colombia became a net exporter of oil in the mid-1980s, with the discovery of 2 billion barrels
of high-quality oil at the Cusiana and Cupiagua fields (ANH). Oil is in fact the country’s
largest export, though Colombian oil exports constitute a small fraction of the world oil
market.
Municipalities receive revenue from oil production based on the following allocation pro-
cess. Foreign oil companies operating in Colombia are required to pay the government
royalties amounting to 50 percent of their oil export values. An explicit revenue sharing
agreement divides these royalties across the central, departmental and municipal govern-
ments.9 The amount given to each municipality is proportional to its production level. As of
1996, royalty revenues from oil and other natural resources, which are termed ”regalias”, are
categorized separately under the fiscal accounts. As we detail below, revenue from natural
4Governors are department level positions. Over 1,000 Colombian municipalities are aggregated into 33departments.
5Non-consecutive re-election is also relatively uncommon, occurring in only 5 percent of the electionsevents in our sample.
6http://www.citymayors.com/mayors/colombian-mayors.html.7http://www.eltiempo.com/archivo/documento/MAM-13057168The exception is the capital city of Bogota, which elects 45 councilors.9The government places 80 percent of the oil royalties into an Oil Stabilization Fund. As codified in
Law 141, of the remaining amount, 32 percent goes to the central government, 47.5 percent goes to thedepartment, and 12.5 percent goes to the municipality.
4

resources such as oil has played an important role in the Colombian conflict.
4 The Colombian Conflict
The Colombian civil war has its roots in La Violencia. The power sharing agreement that
ended this confrontation was perceived to exclude representation of the rural poor and other
political forces. It thus contributed to the formation of revolutionary leftist guerrilla groups,
which launched a communist insurgency during the 1960s. The 1980s saw the rise of a
first generation of right-wing paramilitary groups, formed by drug lords and the rural elite
in response to guerrilla extortion and violence. The conflict remained low intensity during
this decade when it effectively served as a Cold War proxy, but escalated sharply during
the 1990s for a number of different reasons, including the growth of paramilitary groups in
their second incarnation. These were illegal armed groups for the period we analyze: they
were not formally affiliated with the government, and received no official state support in
their formation. Thus, for our sample period, the conflict can be characterized as three-
sided, with the government military, the guerrillas and the paramilitary groups fighting one
another. Typically, however, the state and the paramilitary groups have been unofficially
allied in fighting the guerrillas.
4.1 The Guerrillas
The insurgency today is led by the largest and oldest of the guerrilla groups, the Armed Rev-
olutionary Forces of Colombia (FARC) and the National Liberation Army (ELN), which
were both formed in 1964. These groups had 16,000-20,000 and 4,000-6,000 combatants re-
spectively during our sample period.10 Both groups fight with the stated aim of overthrowing
the government, and also claim to represent the rural poor by supporting policies such as
land redistribution. Despite the stated ideological motivation, the guerrillas are perceived to
be economically motivated, and profit from their involvement in the conflict (Richani 1997).
A number of other revolutionary movements such as M-19 (the Movement of April 19) and
Quintın Lame also joined the insurgency during the 1980s. However, most of these other
groups demobilized and formed political parties during the early 1990s. For example, the
M-19 movement formed the M-19 Democratic Alliance political party. In contrast, FARC
and ELN continued as insurgents.
10Both organizations have seen their membership fall in the post-2005 period.
5

4.2 The Paramilitaries
Independent paramilitary groups emerged separately across different regions of Colombia
during the late 1980s and early 1990s, but the organizations shared the same underlying
view of violently opposing the guerrillas and left-leaning politicians affiliated with these
insurgents. The disparate paramilitary groups started becoming a consolidated force in 1994,
with the launch and expansion of the Peasant Self-Defense Forces of Cordoba and Uraba
(ACCU), a paramilitary group formed by brothers Fidel, Carlos and Vicente Castano, whose
father had been killed by the FARC. The ACCU began crafting regional alliances, and in
1997 an umbrella organization called the United Self-Defense Forces of Colombia (AUC) was
launched under the leadership of Carlos Castano. The start of the AUC has been dubbed
the initiation of a second generation of paramilitarism. At peak strength in 2003, the AUC
had approximately 15, 000 members. The paramilitary consolidation marked the beginning
of more direct paramilitary intervention in electoral politics. It also accords with a sharp
upturn in civilian killings, which was an explicit strategy employed by these groups.
In 2003, President Alvaro Uribe began negotiating the demobilization of the paramil-
itaries. The AUC declared a partial cease-fire, and most paramilitary groups signed an
agreement to disarm in 2005, in exchange for de facto amnesty and lenient sentencing. The
demobilization process generated much controversy around whether the paramilitary units
actually disarmed. Human rights groups have documented continued paramilitary violence
and the emergence of new paramilitary groups since that time.11
4.3 Armed Group Financing and Predation
Both the guerrillas and paramilitaries have sought territorial dominance via warfare and
targeted political killings. Both groups also rely heavily on the cocaine trade for financing
purposes. Correspondingly, increases in the cocaine production have been shown to increase
violence in rural Colombia (Angrist and Kugler 2008; Mejıa and Restrepo 2014).
Natural resources also play a central role in the conflict: revenues generated by these
resources act as a prize, increasing the value of controlling the territories where they are
located. As shown by Dube and Vargas (2013), exposure to commodity price shocks is a
key determinant of violent attacks by armed groups, with different actors specializing in
the predation over different natural resources. Paramilitary groups are documented to be
particularly strong in the oil region. Audits show that oil and gas royalties are often missing
from municipal coffers where they exert influence (Human Rights Watch 2005). Revenue
11See “Evaluation of the Paramilitary Demobilization in Colombia,” 2006 conference pro-ceedings from Corte a Impunidad - Colombia en la Mira de la Corte Penal Internacional.http://www.kolko.de/downloads/evaluation demobilization.pdf.
6

predation takes places as armed groups extort resources under threat of force, for example,
by kidnapping and assassinating mayors (El Tiempo 2007). This form of budgetary predation
became especially important after a major decentralization in 1991 transferred more fiscal
resources to local governments (Sanchez and Palau 2006).12
The guerrillas are also known to target infrastructure in oil regions by blowing up oil
pipelines. This represents another way in which the presence of oil and conflict are connected
in this context, though these guerrilla attacks don’t appear to be connected to changes in
the value of oil (Dube and Vargas 2013).
5 Paramilitary Intervention in Electoral Politics
Paramilitary groups have sought to influence political outcomes through different methods
during different phases. In the mid-1980s, the first generation paramilitaries violently tar-
geted candidates from the Union Patriotica (UP) (Dudley 2004) – a political party formed
by the FARC that successfully fielded candidates in both national and local elections. By
1988, the UP reported that over 500 of its members had been assassinated, including four
Congressman and the party’s presidential candidate. The paramilitaries also targeted other
extreme left groups such as the left-wing M-19 Democratic Alliance Party, whose leader was
assassinated on the orders of Carlos Castano (El Espectador, 2012).
Evidence suggests that when the AUC formed in 1997, the second generation paramilitary
groups made a strategic decision to influence electoral outcomes. As a part of this strategy,
they formed explicit pacts with politicians to support particular candidates. For example,
the Pacto de Ralito called for a “refounding of the country” and was signed by prominent
paramilitary leaders and more than 50 politicians including senators, MPs, mayors and
local councilors (Lopez and Sevillano 2008). The large number of links between paramilitary
groups and politicians were revealed by the media after 2006, in what came to be termed
the para-politics scandal. Much of the qualitative documentation on these links stems from
the confiscation of a laptop belonging to the paramilitary leader Rodrigo Tovar Pupo, also
known as “Jorge 40” (Semana 2006).13
The evidence indicates that paramilitary organizations used many strategies to achieve
their political ends. This included providing illegal financing to favored politicians, or aiding
their campaigns by eliminating opponents via assassinations (Lopez 2010). As an example,
Jorge 40’s computer revealed a recording of Carlos Maria Garcia Davila, a fellow paramili-
12As such, decentralization of fiscal resources to the municipal level has been shown to increase conflict(Chacon 2014).
13http://www.semana.com/on-line/articulo/el-computador-jorge-40-puede-inicio-nuevo-proceso-8000/81379-3
7

tary member, coordinating with politicians on important electoral campaign in the Caribe
Coast (Pedraza Saravia and Olaya 2011). Paramilitary groups also engaged in a number of
electorally fraudulent practices such as vote buying, ballot stuffing and the use of voter IDs
among the deceased (Valencia 2007).
Yet another strategy was to coerce voters by threatening violence or carrying out mas-
sacres. These efforts were aimed at both obtaining votes for particular candidates, and
preventing people from voting (BBC, 2002). One example of this type of voter suppression
comes from the elections in La Jagua de Iberico in the department of Cesar.14
Who were the candidates supported by the paramilitary groups? Acemoglu et al. (2013)
posit that the small new political parties that emerged in Colombia during the 2000s were
actually those associated with paramilitary groups. These authors show that where paramil-
itaries were present, vote shares for these third parties increased. Fergusson et al. (2013)
also present evidence that greater media exposure did not necessarily improve accountability
— politicians exposed in the para politics scandal prior to elections appeared to receive the
same vote share as politicians exposed after.
6 Mechanism
In this section, we highlight the pathway through which oil price shocks are linked to electoral
outcomes. We begin with the premise that when the price of oil increases, more revenue
accrues to oil-producing municipalities, increasing the value of controlling these areas. Since
armed groups seek political control of valuable territory, a rise in the oil price should increase
their incentives to intervene in elections in oil-rich areas. For example, these groups may
seek to install favored candidates in local governments.
Armed groups can accomplish this goal through several strategies. First, they can intim-
idate the electorate, implying that positive oil price shocks should dampen voter turnout.
Second, they can finance aligned politicians and threaten or assassinate non-aligned politi-
cians, implying that positive oil price shocks should decrease electoral competition and reduce
the number of candidates and political parties represented in elections.
Both of these effects also should also influence the political affiliation of legislators elected
to office. What types of candidates can we expect to observe getting selected into office? In
the Colombian context, both the guerrillas and paramilitaries have sought to control valuable
territory. But the paramilitaries in particular have operated disproportionately in oil areas
and intervened in elections. This generates two additional testable implications. So, third,
if electoral intervention is the work of paramilitaries, then positive oil price shocks should
14‘Un Abrebocas de estas Elecciones” by Cristina Velez in Votebien.com, February 2006.
8
increase the set of officials affiliated with paramilitary groups and reduce the set of officials
from extreme left parties affiliated with the guerrillas. Moreover, fourth, it should increase
the presence of paramilitary groups in the oil producing areas. It is worth noting that all of
these effects should be strongest in the more oil-producing municipalities, which is implicit
in our predictions since positive oil price increases will be, by definition, larger in those areas.
Finally, the decision to intervene in elections forcefully may interact with the presence of
armed conflict. For example, if violent groups already have a base of operations in locations
where conflict has taken place, this may lower the cost of electoral intervention in these
places. This account implies a fifth testable implication — the impact of oil price shocks on
election outcomes should be larger in the locations that have previously experienced conflict.
7 Empirical Strategy
We use a difference-in-differences empirical strategy to test our predictions linking oil prices
to elections. In particular, we assess whether changes in the international oil price exert
differential impacts on institutional outcomes among municipalities that produce more oil.
Our sample encompasses the 1997-2007 period.
The cross-sectional variation in our empirical strategy is the amount of oil produced
in each municipality in 1993. 57 municipalities produced oil during that year. Figure 1
shows the quartiles of oil production across municipal locations. This variable circumvents
endogeneity concerns for a number of reasons. It reflects the spatial distribution of oil reserves
and precedes the start of the sample period. Thus, it does not reflect potentially endogenous
oil discovery or extraction undertaken in response to electoral outcomes. It also precedes the
1997 election by several years, which minimizes concerns that it reflects extraction decisions
made with the aim of influencing political outcomes in the direct run-up to the first election
in the sample. Finally, the measure precedes paramilitary consolidation which started with
the expansion of ACCU in 1994, and culminated in the formation of the AUC in 1997 (as
detailed in the section on the Colombian conflict).
The time variation in this empirical strategy is the international price of oil. Importantly,
this price is exogenous to Colombia’s production, as the country holds less than one percent
of the world oil market. Figure 2 shows the oil price dynamics over our sample period.
The estimating equation that represents our empirical strategy is:
yjrt = αj + βt + δrt + Cocajrtγ + (Oilprod jr × OilPricet)λ + Xjrtφ+ εjrt (1)
9
where yjrt are elections-related outcomes in municipality j, region r and year t;15 αj
are municipality fixed effects; βt are year fixed effects; and Xjrt are time-varying controls
which always include the natural log of population. Oilprod jr is the oil production level in
municipality j and region r during 1993; OilPricet is the natural log of the international
price of oil in year t. λ captures the differential effect of the oil price on political outcomes
in municipalities producing more oil. Note that the constituent terms do not appear in
equation (1) since municipality fixed effects absorb the municipality level Oilprod jr variable
while year effects absorb the annual level OilPricet variable.16
δrt are linear time trends in the four major regions. These account for potential omitted
variables since natural resources may be concentrated in particular regions, and institutional
outcomes may vary across regions based on factors such as varying economic growth rates
or geographic shifts in the presence of armed groups. For example, oil is concentrated in the
Southeastern region, and armed group presence is held to have increased there in the latter
part of our sample period, when the government seized control of the Demobilized Zone
(DMZ), pushing the FARC eastward toward Venezuela.17 Cocajr is an indicator that equals
one if the municipality was cultivating coca in 1994, and Cocajrt are linear time trends in
the coca and non-coca municipalities. These trends also mitigate potential omitted variable
bias since coca may be correlated with oil, and attract predatory armed groups who utilized
drug crops as a source of financing.
We estimate equation (1) using OLS. We also account for potentially endogenous bound-
ary changes over this period. In particular, new municipalities were carved out of pre-existing
units. We therefore aggregate municipalities to their boundaries in 1988, a year preceding
our sample period. We use a boundary mapping developed by Dube and Vargas (2013). In
all specifications, standard errors are clustered at this original municipality level, to control
for serial correlation over time within a municipality.
8 Data
In order to estimate the impact of oil price shocks on electoral outcomes, we utilize data on
oil production, prices and a number of elections related outcomes.
Data on mayoral and local council elections in 1997, 2000, 2003 and 2007 come from the
15The four major geographical regions of Colombia are Andean, Caribbean, Southeastern and Pacific.16We examine the effect of prices in levels versus growth since a growth specification may lead to an excess
focus on short-run effects by capturing only year-to-year changes.17The DMZ comprises five municipalities in Southern Colombia that the FARC were allowed to administer
over 1999-2002. This was a concession by the government of President Andres Pastrana as a part of peacenegotiations.
10

Colombian national elections council, the Registradurıa Nacional del Estado Civil.18 The
standard electoral data source typically excludes elections that did not occur on the official
election day. We also avoid using these irregular elections since the timing of re-scheduled
elections may be endogenous.
This data gives us a count of the number of votes cast in each election. We use the
log of this variable as a measure of voter turnout. We also use the Registradurıa data to
generate several different metrics of political competition. One measure is simply the (log)
number of candidates running in each election. A second is the effective number of political
parties competing in each election as specified by Golosov (2010). This index is computed
as: NG =∑
isi
si+s21+s2i, where si is the vote share of political party i and s1 is the vote share
of the largest party.19 We take the log of this index. For mayoral elections, we can also
calculate the margin of victory. This is defined as the difference in the vote share between
the elected candidate and the runner-up in each race.
To gauge impacts on electoral outcomes, we define whether municipal officials elected to
office are affiliated with the paramilitaries. These measures are based on an original event-
based dataset collected by Fergusson et al. (2013). This data records all news events from El
Tiempo, Colombia’s leading newspaper, in which politicians are accused of collaborating with
paramilitaries over 1997-2010. We combine this information with data from the Registradurıa
to code the share of the local council that comes from pro-paramilitary parties, and whether
the mayor is from a pro-paramilitary party. We also designate similar measures for whether
elected legislators are from extreme left political parties. Extreme left parties are those that
have typically been associated with the guerrillas such as the UP, M19, the Revolutionary
Independent Labour Movement, or the Quintin Lame Movement.
We also use data on natural resource regalias and on paramilitary and guerilla activity,
which are available from 1997-2005. We define a measure of whether the paramilitaries and
guerillas are active in a municipality in a given year based on data from the Center for Study
of Economic Development (CEDE). This dataset originates from the Observatory of Human
Rights of the Vice-Presidency of Colombia and is constructed on the basis of reports from
the Administrative Department of Security (DAS), the Colombian security agency. Our
measure of paramilitary and guerilla activity captures any aggressive event coded by CEDE
as involving either a paramilitary or a guerilla group. The range of activities include arson,
18http://www.registraduria.gov.co/19The Golosov index poses an advantage over the canonical Laakso-Taagepera (1979) index, which tends
to overstate the effective number of parties when there is one dominant party, as when the largest party’svote share exceeds 50%. We opt to use the Golosov index as the largest vote share is greater than 50% inhalf of our elections sample. See Golosov (2010) for a more in-depth discussion of the respective strengthsand weaknesses of these indices.
11
attacks on private property, kidnappings, blocking transport routes, injuring members of the
armed forces, or carrying out political homicides. Data on regalias at the municipality level
is obtained the National Planning Department (NPD).
Our conflict data is from Dube and Vargas (2013) and originates from the Conflict Analy-
sis Resource Center (CERAC). This data covers war-related episodes in over 950 Colombian
municipalities over 1988-2005. It is event-based, drawing from 25 major newspapers, and
oral reports on political violence from a network of Catholic priests operating in rural ar-
eas. We use four measures: paramilitary attacks, guerrilla attacks, total clashes between the
armed groups and the armed groups and the state, as well as total war-related casualties.
In terms of our independent variables, our measure of oil production comes from the
Ministry of Mines and Energy (MME).20 It is defined as the average daily production of
barrels of crude oil, in hundreds of thousands of barrels, in each municipality in 1993. The
international price of crude oil is obtained from the International Financial Statistics (IFS)
and is measured in thousands of 2012 pesos per barrel.
In addition, we use data on coca production in 1994 from the Direccion Nacional de
Estupefacientes (DNE), and obtain data on municipal population from Departamento Ad-
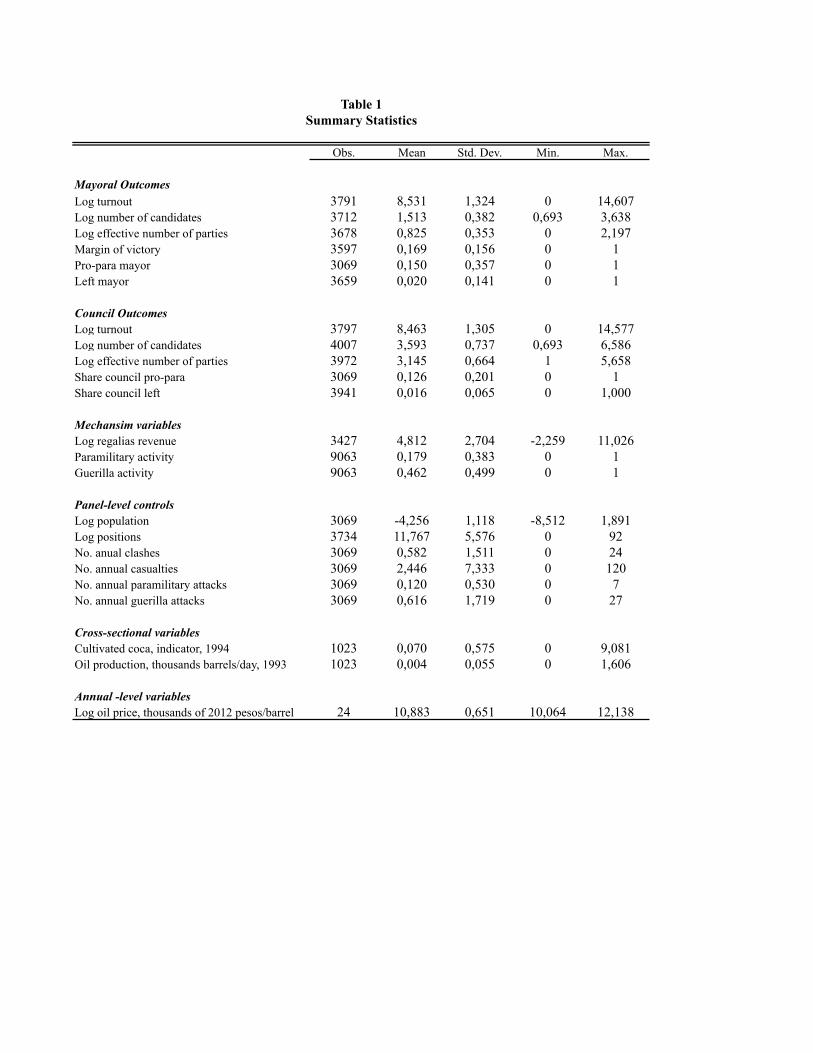
ministrativo Nacional de Estadıstica (DANE).21 Table 1 presents the descriptive statistics
of the key variables in the analysis.
9 Results
9.1 Oil Price Shocks and Elections Outcomes
We examine the impact of oil price shocks on institutional outcomes by estimating equation
(1) . We begin by testing our first three empirical predictions, which focus on electoral
participation, competition, and the political affiliation of elected legislators.
Table 2 looks at mayoral elections. The coefficient in column (1) documents a negative
relationship between exposure to oil price changes and political participation, as measured by
voter turnout. To gauge the magnitude of the implied effect, consider average oil production
and the rise in oil prices over this period. The average oil municipality produced .079
hundred thousand barrels of oil per day in 1993. The price of oil rose by 1.3 in log terms, or
approximately 130% over 1997-2007 (see Figure 2). Thus, the coefficient of -.451 implies that
this price increase reduced turnout by 4.63% more in the average oil-producing municipality,
relative to a non-oil municipality.
20http://www.minminas.gov.co/21https://www.dane.gov.co/
12
The next three columns also demonstrate that positive oil price shocks reduced the com-
petitiveness of local elections, as measured by the number of candidates and parties rep-
resented in elections, and the margin with which mayors are elected. The coefficients in
columns (2) and (3) imply that the 130% price increase reduced the number of candidates
running for office by 3.4% more, and reduced the number of effective political parties by
5.08% more in the average oil municipality.22 Column (4) tells us that the price increase
expanded the margin of victory by .011 more. The mean of this variable is .169. Thus, the
estimated effect represents a 6.3% percent expansion above the mean.
Were there discernible impacts on who was elected to office? The estimates in columns
(5)-(6) indicate that the oil interaction significantly increased the likelihood that mayors
with paramilitary affiliation were elected to office, without exerting significant impacts on
the election of mayors from extreme left parties. The coefficient of .394 in column (5) implies
that the 130% oil price rise boosted the probability of a pro-paramilitary mayor by .04, which
represents a 27% increase above the .15 mean of this variable.
In Table 3, we examine the impact of oil value on local council elections. Column (1)
again shows significant decreases in voter turnout. The next two columns both determine
the impact on the number of candidates running for council elections. In column (3), we
control for the number of council seats over which the election is held, since this can vary
across municipalities. Both columns indicate that the oil price interaction significantly
reduced the number of candidates. The coefficient in column (3) implies a 3.12% differential
decrease in this outcome in the average oil producing municipality owing to the 130% oil
price increase over this period. Columns (4)-(5) examine effects on the effective number of
parties represented in the council elections, with and without controlling for the number of
positions up for election. The coefficient in column (5) suggests a 4.53% differential decrease
in the effective number of political parties represented in local council elections. Thus, as
with the mayoral outcomes, these results also document a significant reduction in political
competitiveness owing to changes in oil value.
Next, we examine impacts on the fraction of councilors that are affiliated with the
paramilitaries and leftist parties. As shown in column (6), the oil interaction exerted no sig-
nificant effects on the share of pro-paramilitary councilors. However, columns (7)-(8) show
that it significantly reduced the share of extreme left councilors. Since the pro-paramilitary
variable is available only through 2003, column (7) examines the left share outcome to 2003.
The significant impact in this column provides assurance that sample differences aren’t driv-
ing the different effects on the pro-paramilitary and left share variables. Column (8) examines
22This result is robust to measuring the effective number of parties in levels. We opt for the log specificationsince it reduces the influence of potential outlying observations.
13
the left share outcome by extending the sample period to 2007. The coefficient of -.069 in
this column implies that the 130% increase in the oil price reduced the fraction of extreme
left council members by .007 more in the mean oil municipality, as compared to a non-oil
municipality. Since the mean of the left share variable is .011, this represents a substantial
43.8% reduction in extreme left representation, but relative to a low base rate.
Overall, these result provide support for our first three predictions. In particular, they
accord with the idea that higher oil value leads paramilitary groups to intervene in local elec-
tions, reducing both electoral participation and competition differentially in the oil-producing
areas. In addition, they show that oil price shocks increase the election of pro-paramilitary
mayors and reduce the election of extreme left local councilors. The reason we observe in-
creased election of pro-paramilitary mayors without increased election of pro-paramilitary
councilors may be because mayorships are more powerful relative to local councils. The
power differential suggests that it would be strategic for paramilitary groups to target in-
tervention more toward mayoral positions. At the same time, the fall in competition over
council positions and the decrease in the share of left-leaning councilors accords with the idea
that paramilitary groups carry out intimidation of candidates aligned with the guerrillas. In
short, both types of elections appear to be affected by paramilitary intervention in electoral
politics. Since extreme left candidates are if anything excluded from office, our results also
correspond to relatively little electoral targeting by guerrilla groups over this period (Avila
Martinez, 2010).23
Do the effects on elections outcomes reflect the work of armed groups seeking political
control in revenue rich areas? To answer this question, we gauge whether oil price shocks
influence regalias revenue within municipal accounts, and determine the presence of paramil-
itary and guerrilla groups. Table 4 presents these estimates. The coefficient in column (1)
implies substantial effects on regalias revenue. Note that this estimate is only marginally
insignificant with a p-value of .11. The coefficient of 1.347 suggests that a 1% increase in
the price of oil increased municipal revenue by .106% more in the average oil municipality,
relative to a non-oil municipality. Thus, the 130% oil price increase over this period boosted
regalias revenue by 13.83% more in these locations. To examine if this oil revenue attracted
armed groups, columns (2) and (3) examine the impact on guerrilla and paramilitary pres-
ence, as measured by activities undertaken by these groups. The results show a clear pattern:
23An alternative account for why the extreme left vote share declines in response to the oil shock stems fromthe idea that there may be electoral backlash against the guerrillas for their role in blowing up oil pipelines.If this destruction reduces the appeal of left-leaning candidates, this might reduce the left parties’ incentivesfor fielding potential candidates, ultimately reducing their representation on the councils. However, if theoil price shock actually led to more guerrilla activities in the oil region, we should observe a correspondingincrease in the guerrilla presence variable, which we do not (in Table 4). Moreover, note that the reductionin voter turnout observed in Table 3 could not be explained by this account.
14

the oil price shock induced differential impacts on paramilitary presence, without affecting
guerrilla presence. The 130% price increase implies that paramilitary activity increased by
.056 more in the average oil producing municipality. This represents a 32% increase above
the mean of .177. This result is in line with our fourth empirical prediction. Overall, the
effects on paramilitary presence, increased election of pro-paramilitary legislators, and re-
duced election of extreme-left legislators provide strong support for the idea that oil price
shocks led to increased electoral intervention by these illicit armed groups.
9.2 The Role of Conflict
To what extent do the documented effects on elections relate to armed conflict? Paramilitary
groups may target elections disproportionately in areas that already have ongoing violence,
if they already have an infrastructure for carrying out forceful intervention in these locations.
To test this fifth prediction, we examine heterogeneous impacts based on conflict prior
to the start of our study period. We divide our sample based on whether a municipality
experienced any conflict event (attack, clash or casualty) between 1988, the first year for
which conflict data is available, and 1992, the year prior to our 1993 oil production measure.24
By this metric, approximately 40% of the municipalities in our sample were peaceful, while
60% had already experienced some type of conflict.
It is worth noting that there are more oil producing municipalities in conflict locations.
Of 57 municipalities producing oil in 1993, seven are in the peace sample, while 50 are in the
conflict sample. Although there are relatively few oil dependent municipalities in the peace
sample, these counts demonstrate that there is cross-sectional variation in oil production in
both sub-samples. Moreover, our identification stems from assessing differential responses
to oil price increases across municipalities of varying oil production: the additional use of
time variation minimizes concerns that limited cross-sectional variation hampers our ability
to detect effects in the peace sample.
Table 5 presents the split sample outcomes for mayoral elections. The results in the
conflict locations show that positive oil price shocks significantly reduced turnout and com-
petition, and promoted the election of pro-paramilitary mayors. However, the results in the
peaceful sample display opposite or insignificant effects: competition measured as the num-
ber of candidates running in elections increased, though there were no significant impacts
on who was elected to office, or the vote margin with which they were elected.25 Moreover,
24Specifying this time period enables us to capture the dramatic rise in violence in the first half of the1990s. For example, average total clashes increased 3-fold from .19 to .57 between 1988 and 1992. Thepattern of results also look the same if we measure conflict through 1991 instead.
25The significant increase in candidates also suggests that the extent of oil production in the peace sampledoes not limit our ability to detect a significant relationship between oil rents and elections outcome.
15

there were no significant impacts on voter turnout in these locations.
The estimates in this table should be interpreted based on differing means in the two
samples. The coefficient in column (3) tells us that the 130% oil price increase raised the
number of mayoral candidates running for office differentially by about 24% in the average
peaceful oil producing municipality. In contrast, the estimate in column (4) indicates a
differential decrease of 5% in the average oil producing municipality that experienced conflict.
Table 6 presents the split sample results for local councils. The results again indicate
a clear pattern: rising oil value exerted significant negative impacts on competition and
the left share of councilors in the conflict sample. In contrast, in the peace sample, it
increased competition as measured by both the number of candidates and effective number
of parties, without exerting significant effects on who was elected. There were also no
significant decreases in turnout, though the coefficient for this outcome is negative with a
large standard error.
The estimates in columns (5)-(6) tell us that the 130% oil price boosted the number of
candidates by 12% in peaceful locations, while reducing it by 4 % in the conflict locations.
Equivalently, columns (9)-(10) tell us that the price rise augmented the effective number of
parties by about 10% more in the average peaceful oil producing municipality, while reducing
it by about 5% more in the average conflicted oil producing municipality.
The results in Table 6 indicate that there was little electoral manipulation in the peace
sample, since the rise in competition wasn’t accompanied by the election of legislators from
particular political parties or by reduced turnout. Overall, these heterogeneous impacts
suggest that oil rents may attract more candidates as some have suggested (Caselli and
Cunningham 2009), but only in the absence of conflict. However, oil rents may also suppress
political competition when armed groups intervene in elections to seek political control, as
in the presence of conflict.
10 Conclusion
This paper has examined how natural resource dependence influences institutions using
a within-country approach. While much of the past literature has focused on incumbent
behavior, we ask whether resource reliance can influence the electoral process, and determine
who comes to power.
Exploiting oil price shocks in Colombia, we find that increases in oil value lower voter
participation, diminish electoral competitiveness and alter election outcomes differentially
in more oil-dependent municipalities. In particular, we observe increased election of legis-
lators affiliated with right-wing pro-paramilitary parties, and reduced election of legislators
16

from leftist parties affiliated with the guerrillas. We also document that these effects are
driven primarily by locations experiencing conflict. The impacts, if anything, are opposite
in peaceful locations.
Our results suggest that where armed groups predate on natural resources, and are posi-
tioned to intervene in elections forcefully, resource rents will undermine institutions as these
groups act to constrict political participation. As such, the combined effect of conflict and
the presence of natural resources may prove particularly inimical to local democracy.
References
[1] Acemoglu, Daron, James Robinson and Rafael J. Santos-Villagran. 2013, ”The
Monopoly of Violence: Evidence from Colombia.” Journal of the European Economic
Association 11(s1): 5-44.
[2] Acemoglu, Daron, James Robinson and Thierry Verdier. 2004, “Kleptocracy and divide-
and-rule: a model of personal rule.” Journal of the European Economic Association
2(2-3): 162-192.
[3] Alexeev, Michael and Robert Conrad. 2009, “The Elusive Curse of Oil.” The Review of
Economics and Statistics 91(3): 586-598.
[4] Andersen, Jørgen J. and Michael L. Ross. 2014, “The Big Oil Change: A closer look at
the Haber-Menaldo analysis.”’ Comparative Political Studies November 2014.
[5] Angrist, Joshua D., and Adriana Kugler. 2008, “Rural Windfall or a New Resource
Curse? Coca, Income and Civil Conflict in Colombia.” The Review of Economics and
Statistics. 90(2): 191–215.
[6] ANH, Agencia Nacional de Hidrocarburos, Colombia. http://www.anh.gov.co/
portalregionalizacion/Paginas/antecedentes-historicos.aspx, last accessed:
July 4, 2014.
[7] Aslaksen, Silje. 2010, “Oil and democracy: More than a cross-country correlation?.”
Journal of Peace Research 47(4): 421-431.
[8] Avila Martinez, Ariel F. 2010, “Injerencia Politica de los Grupos Armados Ilegales.” in
Claudia Lopez H. (ed.) Y Refundaron la Patria: de como mafiosos y politicos reconfigu-
raron el Estado Colombiano, Corporacion Nuevo Arco Iris, Random House Mondadori,
Bogota.
17
[9] Aviles, William. 2006, “Paramilitarism and Colombia’s Low-Intensity Democracy,”
Journal of Latin American Studies 38: 380.
[10] Barro, Robert J. 1999, “Determinants of Democracy.” Journal of Political Economy
107(6): 158-183.
[11] BBC. 2002, “Intimidacion amenaza elecciones.” May 26. http://news.bbc.co.uk/hi/
spanish/latinamerica/newsid2008000/2008716.stm, last accessed: July 3, 2014.
[12] Bejarano, Ana Marıa and Eduardo Pizarro, “From ‘Restricted’ to ‘Besieged: The
Changing Nature of the Limits to Democracy in Colombia,” (University of Notre Dame,
Helen Kellogg Institute for International Studies, Working Paper no. 296, April 2002):
5.
[13] Bruckner, Markus, Antonio Ciccone and Andrea Tesei. 2011, “Oil Price Shocks, Income
and Democracy.” Review of Economics and Statistics 94(2): 389-399.
[14] Caselli, Fancesco and Tom Cunningham. 2009, “Leader behaviour and the natural re-
source curse.” Oxford Economic Papers 61: 628-650.
[15] Caselli, Francesco and Andrea Tesei. 2011, “Resource Windfalls, Political Regimes, and
Political Stability.” Working Paper, Serie Documentos Cede, 2013-14.
[16] Caselli, Francesco and Guy Michaels. 2013, “Do Oil Windfalls Improve Living Stan-
dards? Evidence from Brazil.” American Economic Journal: Applied Economics 5(1):
208-238.
[17] Chacon, Mario L. 2013, “In the Line of Fire: Political Violence and Decentralization in
Colombia.” Working Paper.
[18] Citymayors.com. 2012, “Colombian mayors and local government.” August 12. http:
//www.citymayors.com/mayors/colombian-mayors.html, last accessed: July 3, 2014.
[19] Davila, Julio D. 2009, “Being a mayor: the view from four Colombian cities.” Environ-
ment and Urbanization 21(1): 37-57.
[20] Dube, Oeindrila and Juan Vargas. 2013, “Commodity Price Shocks and Civil Conflict:
Evidence from Colombia.” Review of Economic Studies 80(4): 1384-1421.
[21] Dudley, Steven S. 2004. Walking Ghosts: Murder and Guerrilla Politics in Colombia.
New York: Routledge.
18

[22] Dunning, Thad. 2008, Crude Democracy: Natural Resource Wealth and Political
Regimes New York: Cambridge University Press.
[23] El Espectador. 2012, “El crimen de Carlos Pizarro Leongomez.” October
19th. http://www.elespectador.com/especiales/el-crimen-de-carlos-pizarro-leongomez-
articulo-381843, last accessed: July 4, 2013.
[24] El Tiempo. 2007, “Mancuso admitio responsabilidad en asesinato de alcaldes para
extender dominio de paras.” January 16th. http://www.eltiempo.com/archivo/
documento/CMS-3402097, last accessed: July 28, 2012.
[25] El Tiempo. 2000. “Donde Estan los Concejos?.” September 2nd. http://www.
eltiempo.com/archivo/documento/MAM-1305716, last accessed: July 3, 2014.
[26] Fergusson, Leopoldo, Juan F. Vargas and Mauricio A. Vela. 2013, “Sunlight Disinfects?
Free Media in Weak Democracies.” Working Paper.
[27] Gelb, Alan H. 1988, Windfall Gains: Blessing or Curse?. Oxford University Press, New
York.
[28] Golosov, Grigorii. 2010. ”The Effective Number of Parties: A New Approach,” Party
Politics 16: 171-192.
[29] Haber, Stephen and Victor Menaldo. 2011, “Do Natural Resources Fuel Authoritarian-
ism? A Reappraisal of the Resource Curse.” American Political Science Review 105(1):
1-26.
[30] Herb, Michael. 2005, “No Representation without Taxation? Rents, Development, and
Democracy.” Comparative Politics 37: 297- 317.
[31] Human Rights Watch. 2005, Smoke and Mirrors: Colombia’s Demobilization of
Paramilitary Groups. New York: Human Rights Watch.
[32] Huntington, Samuel. 1991, The Third Wave: Democratization in the Late Twentieth
Century. Norman: University of Oklahoma Press.
[33] Laakso, Markku and Rein Taagepera. 1979, “‘Effective Number of Parties: A Measure
with Application to West Europe.”, Comparative Political Studies 12: 3-27.
[34] Jensen, Nathan and Leonard Wantchekon. 2004, “Resource Wealth and Political
Regimes in Africa.” Comparative Political Studies 37(7): 816-841.
19

[35] Lopez, Claudia. 2010, Y refundaron la patria. . . De como mafiosos y polıticos reconfig-
uraron el Estado colombiano. Bogota: Random House Mondadori.
[36] Lopez, Claudia and Oscar Sevillano. 2008, “Balance Politico de la Parapolitica.” Cor-
poracion Nuevo Arco Iris, Bogota.
[37] Mahdavy, Hossein. 1970, “Patterns ad Problems of Economic Development in Rentier
States: The Case of Iran”, in Cook, M.A. (ed.) Studies in the Economic History of the
Middle-East, Oxford University Press.
[38] Mehlum, Halvor, Karl Moene and Ragnar Torvik. 2006, “Cursed by Resources or Insti-
tutions?.” The World Economy 29(8): 1117-1131.
[39] Mejıa, Daniel and Pascual Restrepo. 2014, “Bushes and Bullets: Illegal Cocaine Markets
and Violence in Colombia.” Documento CEDE No. 2013-53.
[40] Monteiro, Joana and Claudio Ferraz. 2012, “Does Oil Make Leaders More Accountable?
Evidence from Brazil’s offshore oil boom.” Working Paper.
[41] Morrison, Kevin. 2007. ”Natural Resources, aid and democratization: A best-case sce-
nario”, Public Choice 131: 365-386.
[42] Morrison, Kevin. 2009. ”Oil, Nontax Revenue, and the Redistributional Foundations of
Regime Stability,” International Organization 63: 107-38.
[43] Pedraza Saravia, Hernan and Angela Olaya. 2011, “Regalıas, Cooperativas y Finanzas
Paramilitares en la Costa Caribe”, in Romero Vidal, Mauricio (ed.), La Economıa de los
Paramilitares: redes de corrupcion, nogocios y polıtica, Corporacion Nuevo Arco Iris,
Bogota.
[44] Perez Salazar, Bernardo (2011), “Historias de la Captura de Rentas Publicas en los
Llanos Orientales,” in Mauricio Romero Vidal (ed.), La Economıa de los Paramilitares:
redes de corrupcion, negocios y polıtica, Corporacion Nuevo Arco Iris, Bogota.
[45] Ramsay, Kristopher W. 2011, “Revisiting the Resource Curse: Natural Disasters, the
Price of Oil, and Democracy.” International Organization 65: 507-529.
[46] Richani, Nazih. 1997, “The Political Economy of Violence: The War-System in Colom-
bia.” Journal of Interamerican Studies and World Affairs 39(2): 37-81.
[47] Robinson, James A., Ragnar Torvik and Thierry Verdier. 2006, “Political foundations
of the resource curse.” Journal of Development Economics 79: 447-468.
20

[48] Ross, Michael L. 1999, “The Political Economy of the Resource Curse,” World Politics
51: 297-322.
[49] Ross, Michael L. 2001, “Does Oil Hinder Democracy?.” World Politics 53(3): 325-361.
[50] Ross, Michael L. 2012, The Oil Curse: How Petroleum Wealth Shapes the Development
of Nations, Princeton: Princeton University Press.
[51] Sala-i-Martin, Xavier X. and Arvind Subramanian, 2013, “Addressing the Natural Re-
source Curse: An Illustration from Nigeria.” Journal of African Economies, Centre for
the Study of African Economies (CSAE) 22(4): 570-615.
[52] Sachs, Jeffrey D. and Andrew M. Warner. 1995. revised 1997, 1999. “Natural resource
abundance and economic growth.” National Bureau of Economic Research Working
Paper No. 5398, Cambridge, MA.
[53] Sachs, Jeffrey D. and Andrew M. Warner. 2001, “The curse of natural resources.” Eu-
ropean Economic Review, 45(46): 827-838.
[54] Sanchez, Fabio, and Marıa Palau. 2006,“Conflict, Decentralization and Local Gover-
nance in Colombia, 1974-2004.” CEDE Working Paper No. 2006-20.
[55] Tsui, Kevin K.. 2010, “More Oil, less Democracy: Evidence from Worldwide Crude Oil
Discoveries.” The Economic Journal 121: 89-115.
[56] Valencia, Leon. 2007, “Los Caminos de la Allianza entre Los Paramilitaries y los
Polıticos.” in Romero Mauricio (ed.) Para Polıtica: La Ruta de la Expansion Paramil-
itar y los Acuerdos Polıticos, Corporacion Nuevo Arco Iris and Intermedio Editores,
Bogota.
[57] Wacziarg, Romain A. 2012, “The First Law of Petropolitics.” Economica 79: 641-657.
21
Obs. Mean Std. Dev. Min. Max.
Mayoral OutcomesLog turnout 3791 8,531 1,324 0 14,607Log number of candidates 3712 1,513 0,382 0,693 3,638Log effective number of parties 3678 0,825 0,353 0 2,197Margin of victory 3597 0,169 0,156 0 1Pro-para mayor 3069 0,150 0,357 0 1Left mayor 3659 0,020 0,141 0 1
Council OutcomesLog turnout 3797 8,463 1,305 0 14,577Log number of candidates 4007 3,593 0,737 0,693 6,586Log effective number of parties 3972 3,145 0,664 1 5,658Share council pro-para 3069 0,126 0,201 0 1Share council left 3941 0,016 0,065 0 1,000
Mechansim variablesLog regalias revenue 3427 4,812 2,704 -2,259 11,026Paramilitary activity 9063 0,179 0,383 0 1Guerilla activity 9063 0,462 0,499 0 1
Panel-level controlsLog population 3069 -4,256 1,118 -8,512 1,891Log positions 3734 11,767 5,576 0 92No. anual clashes 3069 0,582 1,511 0 24No. annual casualties 3069 2,446 7,333 0 120No. annual paramilitary attacks 3069 0,120 0,530 0 7No. annual guerilla attacks 3069 0,616 1,719 0 27
Cross-sectional variablesCultivated coca, indicator, 1994 1023 0,070 0,575 0 9,081Oil production, thousands barrels/day, 1993 1023 0,004 0,055 0 1,606
Annual -level variablesLog oil price, thousands of 2012 pesos/barrel 24 10,883 0,651 10,064 12,138
Table 1Summary Statistics

(1) (2) (3) (4) (5) (6)
Log turnout
Log number of candidates
Log effective number
of partiesMargin
of victoryPro-para mayor
Left mayor
Oil production × log oil price -0.451** -0.331*** -0.495*** 0.104*** 0.394*** 0.106[0.210] [0.097] [0.096] [0.030] [0.079] [0.122]
Election years in sample 1997-2007 1997-2007 1997-2007 1997-2007 1997-2007 1997-2007Observations 3,701 3,712 3,678 3,597 3,659 3,659Number of municipalities 964 967 960 957 959 959
Table 2Oil Price Shocks and Mayoral Elections Outcomes
Notes. Standard errors clustered at the municipality level are shown in parentheses.Variables not shown include municipality fixed effects, year fixed effects, linear trends byregion and municipalities cultivating coca in 1994, and log of population. Election years in the sample are 1997, 2000, 2003 and 2007. *** is significant at the 1% level, ** issignificant at the 5% level, * is significant at the 10% level.

(1) (2) (3) (4) (5) (6) (7) (8)
Log turnout
Log number of candidates
Log number of candidates
Log effective number
of parties
Log effective number
of parties
Sharecouncil
pro-paral
Sharecouncil
left
Sharecouncil
left
Oil production ! log oil price -0.465** -0.398*** -0.304*** -0.473*** -0.441*** 0.160 -0.107*** -0.069**[0.200] [0.080] [0.064] [0.074] [0.073] [0.154] [0.037] [0.030]
Log positions Y YElection years in sample 1997-2007 1997-2007 1997-2007 1997-2007 1997-2007 1997-2003 1997-2003 1997-2007Observations 3,797 4,007 3,961 3,972 3,957 3,069 2,922 3,941Number of municipalities 1,004 1,006 1,006 1,006 1,006 1,023 975 999
(1) (2) (3)Log
regalias revenueParamilitary
activityGuerrilla activity
Oil production ! log oil price 1.347 0.545*** -0.029[0.863] [0.140] [0.081]
Years in sample 1997-2005 1997-2005 1997-2005Observations 3,427 9,063 9,063Number of municipalities 683 1,007 1,007Notes. Standard errors clustered at the municipality level are shown in parentheses. Variables not showninclude municipality and year fixed effects, linear trends by region and municipalities cultivating coca in 1994,and log of population. *** is significant at the 1% level, ** is significant at the 5% level, * is significant at the10% level.
Table 4Oil Price Shocks, Revenue and the Presence of Armed Groups
Table 3Oil Price Shocks and Local Council Elections Outcomes
Notes. Standard errors clustered at the municipality level are shown in parentheses.Variables not shown include municipality fixed effects, year fixed effects, linear trends by region and municipalities cultivating coca in 1994, andlog of population. In columns 6-7, election years in the sample are 1997, 2000 and 2003. In all other columns, election years also include 2007. *** is significant at the 1% level, ** is significant at the 5% level, * is significant atthe 10% level.

(1) (2) (3) (4) (5) (6) (7) (8) (9) (10) (11) (12)
Log turnout
Log turnout
Log numberof candidates
Log numberof candidates
Log effectivenumber
of parties
Log effectivenumber
of partiesMargin
of victoryMargin
of victoryPro-paramayor
Pro-paramayor
Left mayor
Left mayor
Oil production × log oil price 5.164 -0.392** 62.454** -0.380*** 34.309 -0.521*** -2.723 0.109*** 0.422 0.364*** 7.216 0.094[23.508] [0.198] [28.685] [0.108] [21.284] [0.102] [5.439] [0.030] [20.188] [0.082] [7.112] [0.118]
Sample No conflict Conflict No conflict Conflict No conflict Conflict No conflict Conflict No conflict Conflict No conflict ConflictObservations 1,444 2,257 1,449 2,263 1,440 2,238 1,410 2,187 1,429 2,230 1,429 2,230Number of municipalities 373 591 375 592 373 587 373 584 373 586 373 586Notes. Standard errors clustered at the municipality level are shown in parentheses. Variables not shown include municipality fixed effects, year fixed effects, linear trends by region and municipalities cultivating coca in 1994, and log of population. "No conflict" identifies the sample ofmunicipalities which experienced no paramilitary attacks, guerrilla attacks, clashes or casualties over 1988-1992. "Conflict" identifies the municiplaities which experienced either paramilitary attacks, guerrilla attacks, clashes or casualties over 1988-1992. *** is significant at the 1% level, ** issignificant at the 5% level, * is significant at the 10% level.
Table 5Oil Price Shocks, Conflict and Mayoral Elections Outcomes

(1) (2) (3) (4) (5) (6) (7) (8) (9) (10) (11) (12)
Log turnout
Log turnout
Log numberof candidates
Log numberof candidates
Log numberof candidates
Log numberof candidates
Log effectivenumber
of parties
Log effectivenumber
of parties
Log effectivenumber
of parties
Log effectivenumber
of parties
Sharecouncil
left
Sharecouncil
left
Oil production × log oil price -19.027 -0.380** 39.479*** -0.410*** 31.134*** -0.305*** 32.028*** -0.453*** 25.926** -0.419*** 0.319 -0.065**[14.626] [0.189] [9.935] [0.092] [9.191] [0.073] [11.272] [0.076] [10.686] [0.075] [3.719] [0.029]
Log positions Y Y Y YSample No conflict Conflict No conflict Conflict No conflict Conflict No conflict Conflict No conflict Conflict No conflict ConflictObservations 1,493 2,304 1,568 2,439 1,555 2,406 1,557 2,415 1,553 2,404 1,551 2,390Number of municipalities 393 611 393 613 393 613 393 613 393 613 392 607
Table 6Oil Price Shocks, Conflict and Local Council Elections Outcomes
Notes. Standard errors clustered at the municipality level are shown in parentheses. Variables not shown include municipality fixed effects, year fixed effects, linear trends by region and municipalities cultivating coca in 1994, and log of population. "No conflict" identifies the sample ofmunicipalities which experienced no paramilitary attacks, guerrilla attacks, clashes or casualties over 1988-1992. "Conflict" identifies the municiplaities which experienced either paramilitary attacks, guerrilla attacks, clashes or casualties over 1988-1992. *** is significant at the 1% level, ** issignificant at the 5% level, * is significant at the 10% level.