Do features of public open spaces vary according to neighbourhood socio-economic status?
5
Health & Place 14 (2008) 889–893 Short Report Do features of public open spaces vary according to neighbourhood socio-economic status? David Crawford a, , Anna Timperio a , Billie Giles-Corti b , Kylie Ball a , Clare Hume a , Rebecca Roberts a , Nick Andrianopoulos a , Jo Salmon a a Centre for Physical Activity and Nutrition Research, Deakin University, 221 Burwood Highway, Burwood 3125, Australia b School of Population Health, University of Western Australia, Australia Received 19 July 2007; received in revised form 4 November 2007; accepted 5 November 2007 Abstract This study examined the relations between neighbourhood socio-economic status and features of public open spaces (POS) hypothesised to influence children’s physical activity. Data were from the first follow-up of the Children Living in Active Neighbourhoods (CLAN) Study, which involved 540 families of 5–6 and 10–12-year-old children in Melbourne, Australia. The Socio-Economic Index for Areas Index (SEIFA) of Relative Socio-economic Advantage/Disadvantage was used to assign a socioeconomic index score to each child’s neighbourhood, based on postcode. Participant addresses were geocoded using a Geographic Information System. The Open Space 2002 spatial data set was used to identify all POS within an 800 m radius of each participant’s home. The features of each of these POS (1497) were audited. Variability of POS features was examined across quintiles of neighbourhood SEIFA. Compared with POS in lower socioeconomic neighbourhoods, POS in the highest socioeconomic neighbourhoods had more amenities (e.g. picnic tables and drink fountains) and were more likely to have trees that provided shade, a water feature (e.g. pond, creek), walking and cycling paths, lighting, signage regarding dog access and signage restricting other activities. There were no differences across neighbourhoods in the number of playgrounds or the number of recreation facilities (e.g. number of sports catered for on courts and ovals, the presence of other facilities such as athletics tracks, skateboarding facility and swimming pool). This study suggests that POS in high socioeconomic neighbourhoods possess more features that are likely to promote physical activity amongst children. r 2007 Elsevier Ltd. All rights reserved. Keywords: Children; Play; Parks; Playgrounds; Social disadvantage; Deprivation Introduction Given the known benefits of physical activity for health (US Department of Health and Human Services, 1996), low rates of physical activity participation amongst persons of low socio-economic status (SES) (Gidlow et al., 2006) are of concern. One potential explanation for these socio-economic in- equalities is that there are fewer opportunities for physical activity in socio-economically disadvantaged neighbourhoods. Various features of neighbourhood environments, such as access to destinations, foot- paths and walking trails, have been identified as correlates of physical activity (Owen et al., 2004; ARTICLE IN PRESS www.elsevier.com/locate/healthplace 1353-8292/$ - see front matter r 2007 Elsevier Ltd. All rights reserved. doi:10.1016/j.healthplace.2007.11.002 Corresponding author. Tel.: +61 9244 6616; fax: +61 9244 6091. E-mail address: [email protected] (D. Crawford).
-
Upload
david-crawford -
Category
Documents
-
view
218 -
download
0
Transcript of Do features of public open spaces vary according to neighbourhood socio-economic status?

ARTICLE IN PRESS
1353-8292/$ - se
doi:10.1016/j.he
�Correspondfax: +619244 6
E-mail addr
Health & Place 14 (2008) 889–893
www.elsevier.com/locate/healthplace
Short Report
Do features of public open spaces vary according toneighbourhood socio-economic status?
David Crawforda,�, Anna Timperioa, Billie Giles-Cortib, Kylie Balla, Clare Humea,Rebecca Robertsa, Nick Andrianopoulosa, Jo Salmona
aCentre for Physical Activity and Nutrition Research, Deakin University, 221 Burwood Highway, Burwood 3125, AustraliabSchool of Population Health, University of Western Australia, Australia
Received 19 July 2007; received in revised form 4 November 2007; accepted 5 November 2007
Abstract
This study examined the relations between neighbourhood socio-economic status and features of public open spaces
(POS) hypothesised to influence children’s physical activity. Data were from the first follow-up of the Children Living in
Active Neighbourhoods (CLAN) Study, which involved 540 families of 5–6 and 10–12-year-old children in Melbourne,
Australia. The Socio-Economic Index for Areas Index (SEIFA) of Relative Socio-economic Advantage/Disadvantage was
used to assign a socioeconomic index score to each child’s neighbourhood, based on postcode. Participant addresses were
geocoded using a Geographic Information System. The Open Space 2002 spatial data set was used to identify all POS
within an 800m radius of each participant’s home. The features of each of these POS (1497) were audited. Variability of
POS features was examined across quintiles of neighbourhood SEIFA. Compared with POS in lower socioeconomic
neighbourhoods, POS in the highest socioeconomic neighbourhoods had more amenities (e.g. picnic tables and drink
fountains) and were more likely to have trees that provided shade, a water feature (e.g. pond, creek), walking and cycling
paths, lighting, signage regarding dog access and signage restricting other activities. There were no differences across
neighbourhoods in the number of playgrounds or the number of recreation facilities (e.g. number of sports catered for on
courts and ovals, the presence of other facilities such as athletics tracks, skateboarding facility and swimming pool). This
study suggests that POS in high socioeconomic neighbourhoods possess more features that are likely to promote physical
activity amongst children.
r 2007 Elsevier Ltd. All rights reserved.
Keywords: Children; Play; Parks; Playgrounds; Social disadvantage; Deprivation
Introduction
Given the known benefits of physical activity forhealth (US Department of Health and HumanServices, 1996), low rates of physical activity
e front matter r 2007 Elsevier Ltd. All rights reserved
althplace.2007.11.002
ing author. Tel.: +619244 6616;
091.
ess: [email protected] (D. Crawford).
participation amongst persons of low socio-economicstatus (SES) (Gidlow et al., 2006) are of concern. Onepotential explanation for these socio-economic in-equalities is that there are fewer opportunities forphysical activity in socio-economically disadvantagedneighbourhoods. Various features of neighbourhoodenvironments, such as access to destinations, foot-paths and walking trails, have been identified ascorrelates of physical activity (Owen et al., 2004;
.

ARTICLE IN PRESSD. Crawford et al. / Health & Place 14 (2008) 889–893890
McCormack et al., 2004). Furthermore, area-levelSES has been associated with physical activity(Sundquist et al., 1999; Kavanagh et al., 2005).A limited number of studies have also shown that thedistribution of recreational facilities or spaces variesby area-level SES, although findings are equivocal(Macintryre et al., 1993; Estabrooks et al., 2003;Giles-Corti et al., 2003; Smoyer-Tomic et al., 2004;Cradock et al., 2005; Ellaway et al., 2007; Pearceet al., 2007).
Public open spaces (POS) (parks) have beenidentified as an important venue for physicalactivity (Bedimo-Rung et al., 2005; Krenichyn,2005), particularly for children (Veitch et al.,2006). In a previous study, we found that theavailability of POS (the density and total areaof parks) did not vary by neighbourhood SES(Timperio et al., 2007). However, like much of theprevious research, that study considered onlyavailability of parks, and not the park features thatmay explain socio-economic variations in physicalactivity. Incorporating park features has beenshown to be an important predictor of high levelsof walking in adults (Giles-Corti et al., 2005). Thispaper examines associations between neighbour-hood SES and the features of parks that mightpromote physical activity in children. To ourknowledge no previous studies have investigatedthis issue.
Methods
Data in this study were drawn from the ChildrenLiving in Active Neighbourhoods (CLAN) Study,which is a longitudinal study examining individual,social and environmental influences on children’sphysical activity, sedentary behaviours and weight.The CLAN study commenced in 2004 and involveda follow-up of families of 5–6-year-old and 10–12-year-old children who had participated in a study offamily influences on physical activity in 2001.Recruitment of the baseline sample has beendescribed previously (Timperio et al., 2004).Briefly, 1210 families of 5–6-year-old and 10–12-year-old children were recruited from 19 stateelementary schools in high and low socio-economicareas of metropolitan Melbourne, Australia. Asubset of 540 families (n ¼ 167 younger childrenand n ¼ 373 older children) agreed to be recon-tacted in the future for further research and weresubsequently invited to participate in the 2004follow-up.
Identification of public open spaces
Participant addresses were geo-coded using aGeographic Information System (GIS). The OpenSpace 2002 spatial data set (provided by theAustralian Research Centre for Urban Ecology)was used to identify all free or reserved access(limited public access) POS within an 800m radiusof each participant’s home, excluding educationalinstitutions and golf courses. A radius of 800m wasselected since parents have previously indicated thisto be a reasonable walking distance for their child(Timperio et al., 2004). All spatial analyses wereconducted using ESRI ArcView 3.3 and extensions.A total of 1497 POS were visited over a 3-monthperiod by members of the project team and an auditof the features present was completed for each POS.
Measures
Neighbourhood socio-economic status
The Socio-Economic Index For Areas (SEIFA)Index of Relative Socio-Economic Advantage/Dis-advantage (Australian Bureau of Statistics, 2003),compiled from the 2001 Census of Population andHousing, was used to assign an SES index score toeach child’s neighbourhood, based on their post-code. A high SEIFA score reflects a neighbourhoodwith a low proportion of people with low incomesand relatively few unskilled people in the workforceand a high proportion of people with high incomesand a skilled workforce. Neighbourhoods werestratified into quintiles of SES for analyses. The1497 POS audited were approximately equallydistributed across the five neighbourhood levelSES quintiles. The lowest SES quintile had 314POS, quintile two had 307, quintile three had 288,quintile four had 303, and quintile five (highest SES)had 285 POS.
Public open space audit
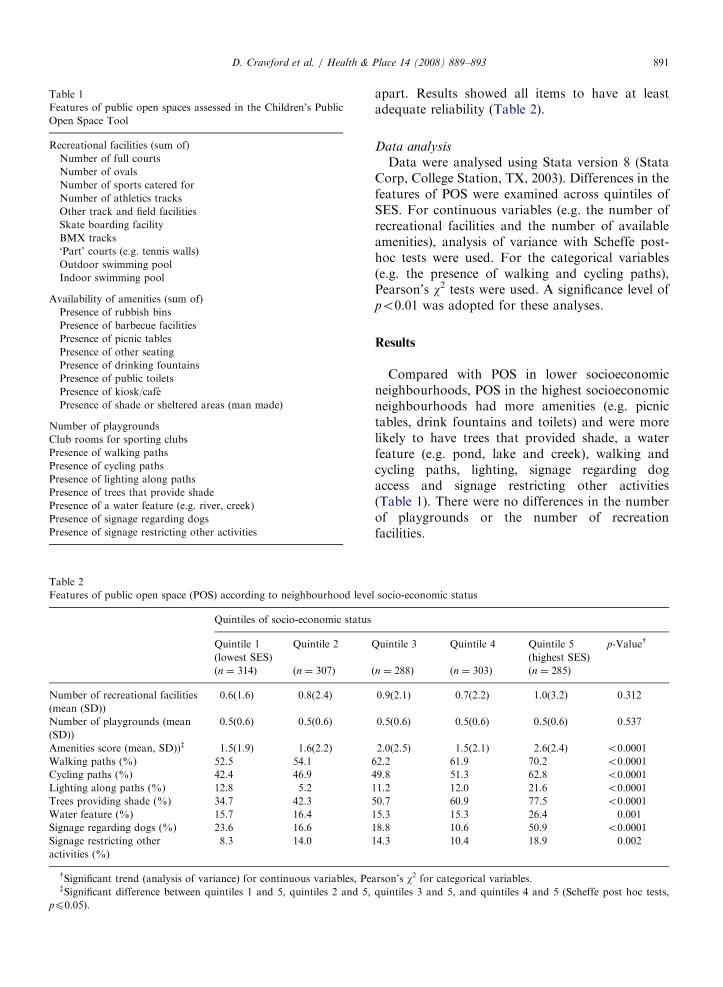
An audit tool (the Children’s POS Tool, orC-POST) was developed to assess features of POSthat were hypothesised, based on previous litera-ture, to be potentially important in influencingchildren’s physical activity (a copy of the auditinstrument is available from the authors). Featuresassessed in the audit tool are listed in Table 1. Theintra- and inter- rater reliability of the audit toolwas tested on a random selection of 19 POS that 10auditors assessed on two occasions, at least 1 week
ARTICLE IN PRESS
Table 1
Features of public open spaces assessed in the Children’s Public
Open Space Tool
Recreational facilities (sum of)
Number of full courts
Number of ovals
Number of sports catered for
Number of athletics tracks
Other track and field facilities
Skate boarding facility
BMX tracks
‘Part’ courts (e.g. tennis walls)
Outdoor swimming pool
Indoor swimming pool
Availability of amenities (sum of)
Presence of rubbish bins
Presence of barbecue facilities
Presence of picnic tables
Presence of other seating
Presence of drinking fountains
Presence of public toilets
Presence of kiosk/cafe
Presence of shade or sheltered areas (man made)
Number of playgrounds
Club rooms for sporting clubs
Presence of walking paths
Presence of cycling paths
Presence of lighting along paths
Presence of trees that provide shade
Presence of a water feature (e.g. river, creek)
Presence of signage regarding dogs
Presence of signage restricting other activities
Table 2
Features of public open space (POS) according to neighbourhood leve
Quintiles of socio-economic status
Quintile 1
(lowest SES)
Quintile 2
(n ¼ 314) (n ¼ 307)
Number of recreational facilities
(mean (SD))
0.6(1.6) 0.8(2.4)
Number of playgrounds (mean
(SD))
0.5(0.6) 0.5(0.6)
Amenities score (mean, SD))z 1.5(1.9) 1.6(2.2)
Walking paths (%) 52.5 54.1
Cycling paths (%) 42.4 46.9
Lighting along paths (%) 12.8 5.2
Trees providing shade (%) 34.7 42.3
Water feature (%) 15.7 16.4
Signage regarding dogs (%) 23.6 16.6
Signage restricting other
activities (%)
8.3 14.0
ySignificant trend (analysis of variance) for continuous variables, PezSignificant difference between quintiles 1 and 5, quintiles 2 and 5,
pp0.05).
D. Crawford et al. / Health & Place 14 (2008) 889–893 891
apart. Results showed all items to have at leastadequate reliability (Table 2).
Data analysis
Data were analysed using Stata version 8 (StataCorp, College Station, TX, 2003). Differences in thefeatures of POS were examined across quintiles ofSES. For continuous variables (e.g. the number ofrecreational facilities and the number of availableamenities), analysis of variance with Scheffe post-hoc tests were used. For the categorical variables(e.g. the presence of walking and cycling paths),Pearson’s w2 tests were used. A significance level ofpo0.01 was adopted for these analyses.
Results
Compared with POS in lower socioeconomicneighbourhoods, POS in the highest socioeconomicneighbourhoods had more amenities (e.g. picnictables, drink fountains and toilets) and were morelikely to have trees that provided shade, a waterfeature (e.g. pond, lake and creek), walking andcycling paths, lighting, signage regarding dogaccess and signage restricting other activities(Table 1). There were no differences in the numberof playgrounds or the number of recreationfacilities.
l socio-economic status
Quintile 3 Quintile 4 Quintile 5
(highest SES)
p-Valuey
(n ¼ 288) (n ¼ 303) (n ¼ 285)
0.9(2.1) 0.7(2.2) 1.0(3.2) 0.312
0.5(0.6) 0.5(0.6) 0.5(0.6) 0.537
2.0(2.5) 1.5(2.1) 2.6(2.4) o0.0001
62.2 61.9 70.2 o0.0001
49.8 51.3 62.8 o0.0001
11.2 12.0 21.6 o0.0001
50.7 60.9 77.5 o0.0001
15.3 15.3 26.4 0.001
18.8 10.6 50.9 o0.0001
14.3 10.4 18.9 0.002
arson’s w2 for categorical variables.quintiles 3 and 5, and quintiles 4 and 5 (Scheffe post hoc tests,
ARTICLE IN PRESSD. Crawford et al. / Health & Place 14 (2008) 889–893892
Discussion
This study aimed to examine socio-economicdifferences in features of POS in metropolitanMelbourne, Australia. The study shows that inmetropolitan Melbourne, POS in higher SES neigh-bourhoods were more likely than those in low SESneighbourhoods to possess a number of featuresthat are likely to support children’s physicalactivity. A strength of this study is that it reliedon objective audit data regarding a large number ofPOS from socio-economically diverse neighbour-hoods; although the study involved only a sample ofparks, not all parks in Melbourne, it is possible thatsome additional parks may have been created afterdata in the Open Space spatial data were collected.Additionally, SEIFA may not be sensitive enoughto capture the variation in SES within neighbour-hoods. However, as far as we are aware this is thefirst study to examine differences in POS features byneighbourhood SES in children.
Our findings are generally consistent with pre-vious research (Estabrooks et al., 2003; Macintryreet al., 1993; Giles-Corti et al., 2003) and support thehypothesis that persons of lower socio-economicposition may be less active partly because there arefewer opportunities for recreational physical activityin socioeconomically disadvantaged neighbour-hoods. However, in the present study the numberof playgrounds and recreational facilities was notlower in POS in low SES areas. Our data do notallow us to determine whether the quality of thesefacilities varies with neighbourhood SES. It may be,for example, that playgrounds in the POS in lowSES areas were older, less attractive or had brokenequipment, and this may partly explain SESgradients in physical activity. This is worthy offuture research.
It could be argued that low SES neighbourhoodsare likely to be found in higher density inner cityarea and, therefore, have fewer picnic tables,fountains, ponds and bike paths, and other featureslargely due to available space rather than to SES. InMelbourne (and other Australian capital cities) lowSES neighbourhoods are distributed throughout thegreater metropolitan region—i.e. there may be somenear the inner city area (along with some high SESneighbourhoods) but low SES neighbourhoods arealso found on the outer metropolitan fringe. Ourdata therefore suggest that POS in low SESneighbourhoods have fewer features that supportchildren’s physical activity. These findings should be
considered by those involved in urban planning anddesign, particularly those working in low SES areas.
Although this study shows features of parkshypothesized to be important in influencing chil-dren’s physical activity variation by neighbourhoodSES, it remains to be determined whether POSfeatures predict physical activity, or explain SESdifferences in physical activity. Future researchshould examine relations between the quality ofparks, as well as park features, and other keydeterminants of children’s physical activity (e.g.parental support) and children’s use of these spacesand their physical activity.
Acknowledgements
This project was supported by a grant from theNHMRC (ID 274309). David Crawford and AnnaTimperio are supported by Public Health ResearchFellowships from the Victorian Health PromotionFoundation. Kylie Ball and Billie Giles-Corti aresupported by Career Development Awards from theNational health and Medical Research Council/National Heart Foundation. Jo Salmon is sup-ported by a Career Development Award from theNational Heart Foundation.
References
Bedimo-Rung, A., Mowen, A., Cohen, D., 2005. The significance
of parks to physical activity and public health. American
Journal of Preventive Medicine 28, 159–168.
Cradock, A., Kawachi, I., Colditz, G., Hannon, C., Melly, S.,
Weicha, J., Gortmaker, S., 2005. Playground safety and
access in Boston neighbourhoods. American Journal of
Preventive Medicine 28, 357–363.
Ellaway, A., Kirk, A., Macintyre, S., Mutrie, N., 2007. Nowhere
to play? The relationship between location of outdoor play
areas and deprivation in Glasgow. Health and Place 13,
557–561.
Estabrooks, P.A., Lee, R., Gyuresik, N., 2003. Resources for
physical activity participation: does availability and accessi-
bility differ by neighbourhood socioeconomic status. Annals
of Behavioural Medicine 25, 100–104.
Gidlow, C., Halley Johnston, L., Crone, D., Ellis, N., James, D.,
2006. A systematic review of the relationship between socio-
economic position and physical activity. Health Education
Journal 65, 338–367.
Giles-Corti, B., Macintyre, S., Clarkson, J.P., Pikora, T.,
Donovan, R.J., 2003. Environmental and lifestyle factors
associated with overweight and obesity in Perth, Australia.
American Journal of Health Promotion 18, 93–102.
Giles-Corti, B., Broomhall, M., Knuiman, M., Collins, C.,
Douglas, K., et al., 2005. Increasing walking: how important
is distance to, attractiveness, and size of public open space?
American Journal of Preventive Medicine 28, 169–176.
ARTICLE IN PRESSD. Crawford et al. / Health & Place 14 (2008) 889–893 893
Kavanagh, A.M., Goller, J.L., King, T., Jolley, D., Crawford, D.,
Turrell, G., 2005. Urban area disadvantage and physical
activity: a multilevel study in Melbourne, Australia. Journal
of Epidemiology and Community Health 59, 934–940.
Krenichyn, K., 2005. The only place to go and be in the city:
women talk about exercise, being outdoors, and the meanings
of a large urban park. Health and Place 12, 631–643.
Macintryre, S., MacIver, S., Sooman, A., 1993. Area, class and
health: should be focusing on places or people? Journal of
Social Policy 22, 213–234.
McCormack, G., Giles-Cort, iB., Lange, A., Smith, T., Martin,
K., Pikora, T., 2004. An update of recent evidence of the
relationship between objective and self-report measures of the
physical environment and physical activity behaviours.
Journal of Science and Medicine in Sport 7, 74–80.
Owen, N., Humpel, N., Leslie, E., Bauman, A., Sallis, J.F., 2004.
Understanding environmental influences on walking; review
and research agenda. American Journal of Preventive
Medicine 27, 67–76.
Pearce, J., Witten, K., Hiscock, R., Blakely, T., 2007. Are
disadvantaged neighbourhoods deprived of health-related
community resources? International Journal of Epidemiology
36, 348–355.
Smoyer-Tomic, K.E., Hewko, J., Hodgson, M., 2004. Spatial
accessibility and equity of playgrounds in Edmonton,
Canada. The Canadian Geographer 48, 287–302.
Sundquist, J., Malmstrom, M., Johansson, S., 1999. Cardiovas-
cular risk factors and the neighbourhood environment: a
multilevel analysis. International Journal of Epidemiology 28,
841–845.
Timperio, A., Crawford, D., Telford, A., Salmon, J., 2004.
Perceptions about the local neighborhood and walking and
cycling among children. Preventive Medicine 38, 39–47.
Timperio, A., Ball, K., Salmon, J., Roberts, R., Crawford, D.,
2007. Is availability of public open space equitable across
areas? Health and Place 13, 335–340.
US Department of Health and Human Services, 1996. Physical
activity and health: a report of the Surgeon General.
Department of Health and Human Services, Centers for
Disease Control and Prevention, National Center for Chronic
Disease and prevention, International Medical Publishing,
Altanta.
Veitch, J., Bagley, S., Ball, K., Salmon, J., 2006. Where do
children usually play? A qualitative study of parents’
perceptions of influences on children’s active free-play. Health
and Place 12, 383–393.