Do cross-border acquisitions cause convergence in ...efmaefm.org/0EFMAMEETINGS/EFMA ANNUAL...
44
Do cross-border acquisitions cause convergence in executive compensation? Evidence from U.K. acquisitions of U.S. targets Paul Guest * Abstract We examine the impact of cross-border acquisitions of U.S. targets on the executive pay of the foreign acquirer. In particular, we examine the level of cash compensation and its sensitivity to performance for the highest paid director of U.K. acquirers. We find that acquisitions of U.S. targets result in significantly greater compensation increases than acquisitions of domestic targets or cross-border targets outside the US. However, we find no evidence of greater pay- performance sensitivity following U.S. acquisitions. Our results are consistent with the argument that cross-border acquisitions of U.S. targets do cause convergence in international pay levels, but not pay-performance sensitivities. JEL Classification: G34; J33 Keywords: Executive compensation; Mergers and acquisitions; Convergence; U.S. targets; Cross-border * Centre for Business Research, Judge Business School, University of Cambridge, Trumpington Street, Cambridge CB2 1AG, U.K. Tel.: (+44) 01223-338185. E-mail address: [email protected].
Transcript of Do cross-border acquisitions cause convergence in ...efmaefm.org/0EFMAMEETINGS/EFMA ANNUAL...

Do cross-border acquisitions cause convergence in executive
compensation? Evidence from U.K. acquisitions of U.S. targets
Paul Guest *
Abstract
We examine the impact of cross-border acquisitions of U.S. targets on the executive pay of the
foreign acquirer. In particular, we examine the level of cash compensation and its sensitivity to
performance for the highest paid director of U.K. acquirers. We find that acquisitions of U.S.
targets result in significantly greater compensation increases than acquisitions of domestic
targets or cross-border targets outside the US. However, we find no evidence of greater pay-
performance sensitivity following U.S. acquisitions. Our results are consistent with the argument
that cross-border acquisitions of U.S. targets do cause convergence in international pay levels,
but not pay-performance sensitivities.
JEL Classification: G34; J33
Keywords: Executive compensation; Mergers and acquisitions; Convergence; U.S. targets;
Cross-border
* Centre for Business Research, Judge Business School, University of Cambridge, Trumpington
Street, Cambridge CB2 1AG, U.K. Tel.: (+44) 01223-338185. E-mail address:

2
1. Introduction
Acquisitions of U.S. firms over the 1980s and 1990s included a higher proportion of foreign
acquirers than ever before (UNCTAD, 2000). Some of these mergers, such as Daimler-Chrysler,
BP-Amoco, and Vodafone-AirTouch, highlighted very important international differences in
executive pay policies between foreign acquirers and their U.S. targets. Relative to most other
countries, U.S. executive compensation levels are very high and closely tied to performance.
These international differences have a potentially very important impact on the post-acquisition
level and structure of executive compensation of foreign acquirers.
There is anecdotal evidence of large increases in foreign acquirer executive compensation
following cross-border U.S. acquisitions. CEOs of acquiring firms have experienced large
increases in their compensation. For example, following the cross-border acquisitions of
Mannesmann and AirTouch by Vodafone in 2000, Vodafone CEO Chris Gent was awarded a
£10m special bonus. In its defence of the bonus payment, Vodafone argued that its executives
were poorly paid compared with those in America, and should be entitled to “catch up”
payments.1 There have also been substantial pay increases associated with maintaining the much
higher pre-acquisition compensation of U.S. target directors who are subsequently employed by
the acquirer following acquisition. For example, following the Daimler-Chrysler and BP-Amoco
mergers, executives from the target firms continued to earn pre-merger pay levels as directors on
the acquiring company board.2
If such increases in compensation following U.S. acquisitions are widespread, there are
important implications. Firstly, cross-border acquisitions of U.S. targets may lead to a
convergence in international corporate pay systems towards U.S. norms (Murphy, 1999;
Cheffins and Thomas, 2004). Secondly, if acquisitions of U.S. targets result in higher
compensation for existing CEOs regardless of performance effects, then this potentially has
important implications for the motivation of cross-border acquisitions in the U.S. The empirical
1 “Vodafone’s Folly”, The Economist, July 15, 2000, pp. 20-21.

3
evidence of the performance effects of cross-border acquisitions shows that cross-border deals
underperform domestic ones3 and this apparent divergence between compensation and
performance effects warrants a closer look at the relationship between cross-border acquisitions
and executive pay. Executive pay increases following cross-border acquisitions could be
consistent with executive compensation rewarding managerial skill in carrying out value
enhancing cross-border acquisitions. However, if managers experience higher compensation
gains from cross-border acquisitions, irrespective of performance impacts, distorted incentives
to make cross-border acquisitions may exist.
In this paper we empirically examine the impact of U.S. acquisitions by U.K. acquirers on the
cash compensation of the highest paid director of the acquiring firms. Our sample of U.K.
acquirers provides the most appropriate setting to examine this topic for several reasons. Firstly,
U.K. acquirers were by far the most active acquirers of U.S. targets, either in terms of number or
value, over the 1980s and 1990s. Secondly, U.K. firms have significantly lower pay levels and a
significantly lower pay-performance link compared to U.S. firms. Thirdly, relative to other
countries which carry out a large number of U.S. acquisitions, information on executive pay is
more readily available in the U.K. over our sample period. Lastly, relative to other countries the
U.K. is very similar to the U.S. in other aspects of its corporate governance system (i.e.,
minority shareholder protection). It therefore provides the most comparable set of data to the
U.S., and U.K. firms above all others are most likely to experience a convergence to U.S. pay
norms.
We examine the compensation effects of a sample of over 487 acquisitions of U.S. targets
(public and private) over the period 1985-1998 by U.K. public acquirers. We compare and
contrast these effects with a sample of 2,614 domestic acquisitions and over 502 other cross-
border (non-US) acquisitions. We find that acquisitions of U.S. targets result in significantly
greater compensation increases than acquisitions of domestic targets or cross-border targets
2 On DaimlerChrysler see: “DaimlerChrysler Pay Scale To Lean Toward US”, The Wall Street Journal, August 7, 1998, page A3. On BP-Amoco see: BP-Amoco Annual Report 1998. 3 On the performance of U.K. acquirers see Conn et al., (2005), and for U.S. acquirers see Moeller et al., (2005).

4
outside the US. However, we find no evidence of greater pay-performance sensitivity following
U.S. acquisitions. Despite finding evidence of a significantly higher increase in pay levels
following U.S. acquisitions, we find no evidence that these pay increases are linked to the
common explanations given for such increases.
This paper contributes to three existing literatures. Firstly, it contributes to the debate on
convergence in executive pay systems (Murphy, 1999; Cheffins and Thomas, 2004), by
examining a precise mechanism by which different systems are argued to converge. Testing
whether cross-border acquisitions of U.S. targets result on average in higher compensation gains
than other cross-border acquisitions will provide important evidence on the strength of this
particular determinant of convergence. Secondly, although a number of studies in both the U.S.
and U.K. have examined the effect of domestic acquisitions on executive pay (reviewed in
Section 2 below), none have examined the impact of cross-border acquisitions. Given the large
amount of cross-border acquisition activity, previous literature is clearly only examining one
aspect of total takeover activity. To the extent that differences exist between domestic and cross-
border acquisitions, the generality of previous findings may be questionable. Lastly, this paper
contributes to the literature on multinationality and executive pay (reviewed in Section 2.3
below), which does not distinguish between the different forms of geographic expansion, or
whether the expansion is value creative or not.
The paper proceeds as follows: Section 2 provides a review of the literature and presents the
main research hypotheses. Section 3 describes the data and variable formation. In Section 4 we
present the empirical results. Section 5 concludes.
2. Literature review and research hypotheses
In this Section we provide a review of the literature and present the main research
hypotheses. In Section 2.1 we carry out a review of the literature on firm size and compensation.
In Section 2.2 we review the findings of previous empirical studies on mergers and executive
compensation. Finally, in Section 2.3 we examine the impact of multinationality on executive
pay, international differences in executive pay, and present the main research hypotheses.

5
2.1. Firm size and compensation
There is a large empirical literature on the determinants of executive pay, which is reviewed
thoroughly by Murphy (1999). The empirical results that have received the most attention are
the relationships between executive pay and performance, and executive pay and size. The
statistical relationship between executive compensation and firm performance is positive
although small, weak and sensitive to methodology used. Most studies report substantially larger
elasticities for accounting rates of return than for stock market performance variables. A large
theoretical literature based on principal-agent theory shows how to account for the moral hazard
problem when designing the compensation contract and predicts that pay will be determined by
performance. The positive connection between compensation and firm size has a long and
consistent history and various explanations have been put forward to explain it (Rosen, 1992).
For example, complexity increases with size, and the management of complex organizations
places great demands on the executive requiring more skill and experience than does the
management of simpler organizations, which leads to a compensation premium.4 Labor market
theory suggests that the size-pay relation is the outcome of matching more talented executives
with larger firms in which their managerial product is maximized. Alternatively, tournament
theory suggests that compensation can be used to motivate effort among lower-level managers
who view the top job as spoils that go to the winner of an intra-firm tournament. A bigger firm
represents a larger tournament, and therefore demands a commensurate prize.
These explanations for the correlation between compensation and size imply that making a
firm larger by acquisition could increase the compensation of an existing manager, regardless of
whether the acquisition creates value or not. This could be because the new firm or the merger
integration process is more complex and requires more work. The acquiring firm’s CEO must
identify and realize sources of potential cost savings and revenue enhancements, restructure
assets, and reconfigure the organization. None of these changes or the requisite decisions will
4 Rose and Shepard (1997) and Berry et al., (2005) find that salaries of CEOs of diversified firms are larger than those of similarly-sized but less-diversified firms. Based on additional evidence they infer that this relation is due to greater task complexity and higher managerial product for the diversified firms.

6
occur by themselves; managerial effort must be expended and managerial discretion and skill
must be carefully exercised (Demsetz, 1995). Since there is evidence to suggest that a majority
of takeovers do not on average benefit acquirer shareholders,5 this has led many authors to argue
that acquisitions are carried out to increase size in an attempt to increase compensation (see, e.g.,
Jensen, 1986), and has been the starting point for the majority of studies that have examined the
impact of takeovers on executive compensation.
2.2. Acquisitions and compensation
A number of U.S. and U.K. studies have examined the impact of acquisitions on executive
pay. In this section we review the key findings of these studies.
The first conclusion one can draw from these studies is that acquisitions on average result in
an increase in the executive compensation of the acquiring firm. Khorana and Zenner (1998)
examine a sample of 27 U.S. acquirers over 1982-1986. They find that average cash
compensation increases from $344,000 in the year prior to acquisition to $502,000 in the year
following acquisition, whilst stock-based compensation increases from $134,000 to $327,000.
These changes are much larger than those for non-merging control firms. The authors note that
there appears to be no substitution effect between cash and stock compensation changes
following acquisition, and that increases in each are correlated with one another. Bliss and
Rosen (2001) examine a sample of 16 merger active U.S. banks over 1986-1995, and find that
annual cash compensation growth is 12%, significantly higher than that for less merger active
banks (7.7%). Anderson et al., (2002) examine a sample of 97 U.S. bank mergers between 1990
and 1997, and find that CEO cash compensation increases from $1,361,000 in the year prior to
acquisition to $1,792,000 in the year following acquisition, whilst total compensation increases
from $2,646,000 to $4,023,000. Girma et al., (2005a) find that for a sample of UK acquisitions
over 1981-96, CEO compensation is £53,000 prior to acquisition and £111,000 following
acquisition, whilst the growth rate in CEO compensation increases from 9% to 11%. Harford
and Li (2005) examine a examine a sample of 370 U.S. mergers between 1993 and 2000, and
5 For reviews see Hughes (1989), Agrawal and Jaffe (2002), and Bruner (2003).

7
find that CEO median cash compensation increases from $1,144,000 in the year prior to
acquisition to $1,167,000 in the year following acquisition, whilst total compensation increases
from $2,449,000 to $3,464,000. Grinstein and Hribar (2004) find that 39% of acquiring firms
state that they compensate CEOs for acquisitions, and that the compensation comes mainly in
the form of a cash bonus. In summary, these studies suggest that companies carrying out
acquisitions are, on average, rewarded with higher compensation both in terms of cash and stock
based compensation.
Given the strong empirical finding between sales and compensation, and given that
acquisition increases the size of the acquirer, one may perhaps expect the increase in
compensation following acquisition reported above. Therefore many studies have examined
whether the increase in compensation is greater than or less than that expected given the increase
in size. Firth (1991), Conyon and Gregg (1994), Khorana and Zenner (1998), and Girma et al.
(2005a) find that acquirers experience a significantly higher change in compensation after
controlling for changes in size. In contrast, Avery et al. (1998), Bliss and Rosen (2001),
Anderson et al., (2002), and Harford and Li (2005) find no evidence that mergers increase
compensation once increase in sales has been controlled for. In summary, evidence on whether
the increases in executive pay arising from acquisition are greater than those from internal
growth is mixed.
Many studies have examined whether it is only those deals which are successful that result in
higher compensation. The latter is usually measured by abnormal returns over the announcement
window. Lambert and Larcker (1987), Khorana and Zenner (1998), and Girma et al. (2005)
show that wealth destructive acquirers do not experience a significant increase in compensation,
whereas wealth enhancing acquirers do, and the difference between the two is significant.
Anderson et al., (2002) find that both types of acquirer experience a significant increase, but that
good acquirers experience a larger increase. In contrast, Firth (1991), Avery et al. (1998), and
Bliss and Rosen (2001) find that both types resulted in a significantly positive impact and that
there is no significant difference between the two. Harford and Li (2005) find no significant

8
difference between the two. Similarly, Grinstein and Hribar (2004) show there is no positive
relation between M&A bonus compensation and short run abnormal returns. Therefore the
evidence on whether the change in compensation depends upon the success of the acquisition is
mixed.6
If wealth destructive acquisitions result in positive compensation effects, as frequently
appears the case, then this appears to be a manifestation of agency problems. Consequently,
some studies have examined how the compensation effects vary with measures of managerial
power. Grinstein and Hribar (2004) show that CEOs receive significantly larger cash bonuses
when the CEO is also the chairman and when the CEO also sits on the nominating committee. In
contrast, Anderson et al. (2002), find no evidence that increases in compensation are linked to
either the stock ownership or tenure of the CEO. A number of other studies have examined
whether the link between compensation and acquisition performance differs according to board
power. Kroll et al., (1990) examine a sample of 50 acquisitions by U.S. acquirers between 1979-
86, and show that cash compensation changes are only linked to acquisition performance when
either a large external blockholder or the management owns a large stake in the acquirer. In
other cases, compensation effects are not related to acquisition performance. Kroll et al., (1997)
find the same result, examining a sample of 209 acquisitions by U.S. acquirers between 1982-
91. Wright et al., (2002) examine a sample of 171 acquisitions by U.S. acquirers between 1993-
1998 and show that cash compensation changes are only linked to acquisition performance when
there is vigilant monitoring of the acquirer in the form of both high analyst following and
institutional investor presence. Therefore, there is some evidence that compensation changes are
both lower and more closely tied to acquisition performance when manager power is lower.
6 The finding that pay increases regardless of wealth creation does not establish that current compensation practices are suboptimal. Such correlation might be produced by boards following the advice of compensation consultants urging compensation levels equal to (or exceeding) those at other companies with a similar market capitalization. However, such a correlation might also result from optimal contracting by boards and managers. For example, the experience obtained from running a larger firm might improve the manager’s outside options and thus require a pay raise to retain the manager. Thus, even though a connection between ex post compensation and larger size might distort managers’ ex ante choices, having such a connection might be necessary or optimal overall.

9
Some studies have examined whether the increase in compensation is offset by the negative
impact of the abnormal return on the CEOs stock ownership and hence whether CEOs actually
experience an increase in overall wealth. Lambert and Larcker (1987) find that for wealth
destroying acquisitions, the effect on CEO compensation is insignificantly positive whilst the
effect on CEO wealth is negative although not significantly so. In contrast, Firth (1991) finds
that even with wealth destroying acquisitions, the highest paid director of acquirers significantly
increases her wealth. Bliss and Rosen (2001) find that 77% of CEOs had an increase in total
wealth, despite the average CAR being negative.
Given the above finding that even wealth destructive acquisitions can increase CEO
compensation and wealth, a small number of studies have directly examined the impact of
compensation on acquisition probability. Khorana and Zenner (1998) find that acquirers have a
relatively strong pay-sales link prior to acquisition, but that this disappears following
acquisition. They interpret this as suggesting that the strong link encouraged acquirers to make
the acquisition. Rosen (2005) finds that acquirers who have started a merger program and are
paid above normal, are more likely to make further acquisitions. There is therefore some
evidence that compensation levels and structure do effect motivations for acquisition.
Two studies have examined the effect of acquisition on the pay-performance link, something
of particular interest to our study. Conyon and Gregg (1994) find no evidence that pay is more
or less closely linked to shareholder returns following acquisition. However, Harford and Li
(2005) find that the link between pay and poor performance (share returns) is significantly
weakened following acquisition. However, this only holds when the acquirer has a weak board,
defined by the long length of CEO tenure.
None of the above studies differentiate sample acquisitions according to the type of
acquisition or the characteristics of the target company, and in particular by national
geographical location. A number of studies do however examine whether diversifying
acquisitions and non-diversifying acquisitions have a different impact on compensation changes.

10
However, the studies by Avery et al., (1998), Khorana and Zenner (1998), Bliss and Rosen
(2001), and Anderson et al., (2002) find no difference between these different acquisition types.
In summary, previous studies examining the effect of acquisitions on executive compensation
show that acquisitions have a large positive impact on compensation. This increase appears
similar or somewhat larger than that expected given the increase in size associated with
acquisition. The increase in compensation does not appear strongly linked to acquisition
performance and acquirers appear to experience an increase even if the acquisition destroys
shareholder value. There is some evidence that board power leads to larger compensation effects
and a weaker link with acquisition performance.
2.3. International pay differences and cross-border acquisitions
Our focus in this paper differs from the studies reviewed in Section 2.2, none of which has
examined the impact of cross-border acquisitions on executive compensation. Our primary
interest is the effect of the national differences that exist in the levels of executive compensation
and the relation between pay and performance In particular, we are interested in the significant
differences that exist between executive compensation in the U.S. and in most other countries.
U.S. pay is significantly higher, bonus payments account for a higher proportion of cash
compensation, there is a higher level of incentive holdings, and overall therefore a much
stronger link between pay and performance (see, e.g., Abowd and Bognanno, 1995; Murphy,
1999; Conyon and Murphy, 2000). Comparisons between the U.S. and other countries in terms
of levels of pay and proportions of performance pay are shown for 1999 in Fig. 1 below. A large
pay gap clearly exists between American CEOs and those in equivalent positions at foreign
firms.
With regard to specific differences with the UK, these were documented in a comparative
study of executive compensation between the U.S. and the U.K. by Conyon and Murphy (2000).
They surveyed pay arrangements in over 1,600 publicly quoted U.S. corporations and the U.K’s
largest 510 companies. They found that, as of 1997, U.S. CEOs were paid on average
£3,565,000 in total compensation, whereas U.K. CEOs received only £589,000. U.S. CEOs

11
received a much smaller percentage of their pay in fixed compensation with an average of 29%
(£1,033,850) of their pay in the form of base salaries, compared to 59% (£347,510) for U.K.
CEOs. The percentage of CEOs receiving bonuses was roughly the same in the two countries.
American CEOs’ average annual bonuses totaled £606,050, compared to £106,020 for English
CEOs. Therefore the link between cash compensation and performance is stronger in the U.S.
than the U.K., because bonus forms a larger part of cash compensation (37% versus 23%). With
regard to long term incentives, the average American CEO received 42% (£1,497,300) of her
total pay in the form of option grants whilst U.K. executives received only 10% (£58,900) of
their total compensation in the form of stock options. Long term incentives in the U.K. therefore
form a much smaller part of compensation than in the U.S.
It is argued that executive pay in foreign countries including the U.K. will over time converge
towards U.S. pay levels structures (Murphy, 1999; Cheffins and Thomas, 2004). With regard to
the U.K., there appears to be some evidence of convergence in terms of cash compensation and
its link to performance. For example, in 1999, the base pay of British CEOs rose 11%, whilst in
the U.S. it rose just 3%. Similarly, bonus levels rose more sharply in Britain than they did in the
U.S., which arguably reflects a general trend in Europe of linking cash compensation more
closely with performance.7 However, there has been little evidence of convergence in terms of
long term incentives. In contrast to cash compensation which increased dramatically over our
sample period, the number of options in U.K. firms decreased over the 1990s (Conyon and
Murphy, 2000) and the growth in long term incentives for U.S. firms far outstripped that for
U.K. firms. The reasons for convergence in executive pay levels are numerous. Cheffins and
Thomas (2004) list evolving share ownership patterns, cross-border hiring, growth of
multinationals, and cross-border takeovers as key determinants. It is this latter explanation with
which we are primarily interested and which we now explore further.
In cross-border acquisitions of U.S. targets, relative to domestic or other cross-border
acquisitions, executive compensation in the acquiring firm is expected to rise higher than in
7 “Managing Change: Pay for U.K. CEOs Trails U.S”, The Wall Street Journal Europe, June 6, 2000.
12
domestic or other cross-border acquisitions for the following reasons. Firstly, U.S. acquisitions
may give U.K. executives the American experience necessary to become contenders for top
positions at U.S. firms and hence compete for the higher American remuneration packages. In
order to keep such managers, these U.K. companies would need to restructure managerial
compensation along American lines to compete. Indeed in the UK, significant general increases
in executive pay have sometimes been defended on such grounds (Cheffins and Thomas, 2004).
Secondly, an important part of the pay setting process in the U.K. is the selection of comparable
companies whose pay is used as a benchmark. For example, the Hay Group, an executive
compensation consultancy, states that it works on pay benchmarking with 77 of the FTSE 100 in
the U.K. In the case of U.S. acquisitions, the companies selected by the U.K. acquiring firms for
peer group pay benchmarking may change following acquisition to include higher pay U.S.
companies, or to include U.K. companies with a similar U.S. presence. Lastly, if the acquirers’
level of pay is lower than that of the acquiree, and if directors of the target firm are subsequently
employed by the acquirer, they may be unwilling to accept pay cuts to do so and may demand
pre-acquisition pay levels. However, maintaining separate wage scales for acquirer executives
and U.S. subsidiary managers could be difficult and interfere with integration of the operations
of the combined firms. Post-merger equality in compensation systems may be easier to achieve
through pay rises than through pay cuts (Murphy, 1999). Murphy (1999) argues that, “foreign
companies acquiring U.S. subsidiaries face huge internal pay inequities, often resolved by
increasing home-country executive pay” (p.8). Therefore, in such cases there may be a tendency
for the U.K. directors pay levels to gravitate towards U.S. levels following acquisition. The key
empirical prediction that emerges is that directors pay in the acquiring firm will increase
relatively more following U.S. acquisitions than other acquisitions.
In examining the impact of U.S. acquisitions on executive compensation, the correct
counterfactual is not just domestic acquisitions but also cross-border acquisitions in other
countries than the U.S. Cross-border acquisitions may have a positive impact on executive pay
relative to domestic acquisitions, because expanding the scope of the firm internationally with a
13
cross-border acquisition may result in a more complex organisation relative to a domestic
acquisition. Multinational firms face informational complexities due to geographic dispersion,
multiple currencies, high auditing costs, differing legal systems, and cultural and language
differences (Duru and Reeb, 2002). The matching theory would predict that multinational firms
bid up the compensation of highly skilled executives because their managerial product is higher
at such firms. Consistent with this, studies show that CEO pay is positively related to
international scope (Persons, 2001; Duru and Reeb, 2002; and Ramcharran, 2002). Making a
cross-border acquisition may increase the compensation of an existing manager, by confirming
the multinational talent of the manager and putting it to the test at the newly merged entity or
because directors might choose other multinational firms as peer comparisons for executive pay
levels and this may result in an immediate increase in executive pay. Because cross-border
takeovers may have a more positive impact on executive compensation than domestic
acquisition, we compare U.S. acquisitions not just with domestic acquisitions but with all cross-
border non-U.S. acquisitions. Our first Hypothesis is therefore as follows:
Hypothesis 1: Cross-border takeovers of U.S. targets have a more positive impact on
compensation than domestic acquisitions or other cross-border acquisitions
Acquisitions of U.S. targets may not only affect the level of compensation of U.K. acquirers
but also its structure, and in particular the link between pay and performance. Since the link
between total cash compensation and performance is stronger for U.S. firms than for U.K. firms,
it is possible that U.K. acquirers will have a stronger pay-performance link following U.S.
acquisitions. In particular, if the acquirer achieves post-merger equality in compensation systems
through pay rises to the target company level of cash compensation, it is also feasible that they
may move to a similar proportion of bonus to base salary. This leads to our second hypothesis:
14
Hypothesis 2: Cross-border takeovers of U.S. targets result in a stronger post-
acquisition pay- performance link than domestic acquisitions or other cross-border
acquisitions
3. Sample and variable formation
3.1. Sample
We examine a sample of acquisitions of domestic and cross-border, private and public target
companies by U.K. public companies, completed between January 1, 1984 and December 31,
1998. The sample acquisitions are drawn from the Thomson Financial SDC Mergers Database
and the Thomson Financial magazine Acquisitions Monthly. Acquisitions are defined as
occurring when the bidder owns less than 50% of the target’s voting shares before the takeover,
and increases its ownership to at least 50% as a result of the takeover. We exclude acquisitions if
the U.K. bidder is not a publicly traded firm and included on the Datastream Database, with
financial information available for both the accounting years immediately prior to and following
the takeover completion date. Many acquisitions involve relatively small targets that may not be
expected to have a material effect on the acquirer. We therefore adopt a materiality constraint
that limits our sample to acquisitions in which the target’s acquisition value is at least 5% of the
acquiring firm’s market value in the acquisition month. We exclude acquisitions for which the
acquisition value was not reported.
The final sample and its annual breakdown are reported in Table 1. Our final sample of 3,603
acquisitions consists of 487 acquisitions of U.S. targets, 2,614 acquisitions of domestic targets
and 502 acquisitions of non-U.S. targets. These figures highlight the importance of U.S. targets
in the cross-border acquisition activity of U.K. acquirers. Of the other 502 cross-border
acquisitions, 79% of the targets are from Europe. Acquisition activity is clustered most heavily
in the merger intense years of 1987-1989 and 1994-1997, for both U.S., domestic and other
cross-border acquisitions. Many of the sample acquirers engaged in multiple acquisitions during
the sample period. The 3,603 acquisitions were carried out by 1,217 acquirers, an average
number of three acquisitions per acquirer.

15
Table 2 reports various firm and transaction characteristics for the sample acquisitions
according to whether the acquisition target is a U.S., U.K., or other cross-border acquisition. The
total amount spent on U.S. targets is £254 billion, compared to £371 billion on U.K. targets and
£114 billion on other cross-border targets. The average U.S. target size is £222 million which is
significantly larger than the average for other cross-border acquisitions (£114 million), which is
in turn larger than that for domestic U.K. targets (£85 million). U.K. acquirers that acquire U.S.
targets are on average significantly larger in market value (£535 million) than acquirers of other
cross-border targets (£360 million), which are in turn significantly larger than acquirers of U.K.
targets (£173 million). The average relative size of U.S. acquisitions (calculated as the
transaction value divided by acquirer market value) is 0.56 and therefore these acquisitions
represent major investments for acquirers. The average relative size is similar in other cross-
border acquisitions at 0.52. It is much higher in U.K. acquisitions (0.86) but this is distorted
somewhat by some very large values since the median relative size is 0.38 and very similar to
the U.S. acquisition median of 0.36. The average announcement abnormal return for U.S.
acquisitions is 0.26%, compared to 0.53% in U.K. acquisitions and 0.58% in other cross-border
acquisitions. Average long run abnormal returns 8 are -8.09% in U.S. acquisitions, -7.64% in
U.K. acquisitions, and -18.84% in other cross-border acquisitions. These results are consistent
with the findings of Conn et al., (2005) that over the long run, cross-border acquisitions
underperform domestic acquisitions, but that this effect is lessened where the target country is of
a similar culture to the U.K., as is the case with U.S. acquisitions. A higher proportion of both
U.S. and U.K. acquisitions are for publicly listed targets (14% and 19% respectively) compared
to other cross-border targets (7%). Secondly, the proportion of hostile acquisitions is 2% for
U.S. acquisitions, 3% for U.K. acquisitions, and 1% for other cross-border acquisitions. Thus,
8 Long-run returns are buy-and-hold abnormal returns, beginning the month following completion through the end of the 36-month period following the completion month, or until the sample firm is delisted. The counterfactual is the same measure for non-acquiring control firms matched on size and market-to-book ratio. The control firms are selected by first dividing all UK stocks listed on Datastream into ten equal sized portfolios based on their market values at the beginning of each calendar year. Those control firms that carried out a sample acquisition within the preceding or subsequent five years are then excluded. Each sample firm is then matched with the non-merging firm from its size portfolio that has the closest market-to-book ratio at the beginning of the calendar year. This procedure is repeated for each post-takeover calendar year using a fresh grouping by size decile for the year in question.

16
friendly acquisitions dominate our samples. Third, roughly 30% of target companies are
majority owned by another company at the time of acquisition. Fourth, a very small proportion
of acquisitions involve competing bids, 2% for U.S. and U.K. acquisitions, and 1% for other
cross-border acquisitions. Fifth, acquisitions between firms in related industries (defined as the
same 2-digit SIC code) occur in 39% of U.S. acquisitions, 36% of U.K. acquisitions, and 47% of
other cross-border acquisitions. Finally, cash is the primary medium of payment in acquisitions
of all target types, but is much more prevalent in cross-border acquisitions, both of U.S. and
other countries. The most prevalent use of stock is found in domestic acquisitions.
3.2. Variable formation
3.2.1. Executive pay
U.K. reporting requirements in the area of top executive pay over most of the sample period
were extremely modest in comparison with the USA. Until 1997 in the UK, the principal
disclosure requirement originated in the 1967 U.K. Companies Act. This demanded that the
company annual report disclose the emoluments (pay plus bonus plus the cash equivalents of
any perquisites but excluding pension contributions) of the Chairman, the highest paid director
(if a different person), and the total emoluments of the entire board which included the total of
directors fees, emoluments for management services, pension fund contributions and following
the introduction of FRS3 (June 1993), compensation for loss of office and ex gratia payments.
Prior to 1997, wider measures of compensation such as stock options or long-term incentive
plans were not typically available because of insufficient information being released regarding
exercise price or vesting periods of options.9, 10
9 The disclosure of executive pay in the U.K. changed following the publication in July 1995 of the Greenbury Report on directors’ remuneration. This Report recommended that the annual report should disclose pay details for all executive directors, including pension provisions, incentive pay, option plans, performance measurements, severance agreements and comparisons with similar companies. Companies should annually outline their compliance with the Greenbury Code, including explanations if they do not comply. This recommendation on the disclosure of individual directors’ remuneration was implemented as a formal requirement in the U.K. Stock Exchange’s Listing Rules. However, disclosure was often less than transparent, and subsequently in 2002 the Directors’ Remuneration Report Regulations (published by the Department of Trade and Industry) were made a statutory requirement. 10 It is worth noting that other major acquiring countries of U.S. targets, such as Canada, and France also had similar low requirements prior to the mid 1990s which then increased substantially following regulation (Cheffins and Thomas, 2004).
17
Given the above data availability, we follow other U.K. executive pay work (see, e.g., Girma
et al., 2005a) by employing the total cash compensation of the highest paid director (Highest
paid director) as our primary measure of executive compensation. Since the identity of the
highest paid director is unknown, we are unable with any certainty to examine the impact of
acquisition on any one individual’s executive pay. However, we are still able to test several
important predictions of the convergence literature.
Firstly, the key prediction of the convergence literature is that the change in the pay of the
highest paid director following U.S. acquisitions is greater than for other types of acquisition,
irrespective of whether the post-takeover highest paid director is that from the pre-takeover
period or an imported director from the target board. We are able to test this. A second
prediction is that the pay-performance link for the highest paid director is stronger post-takeover
compared to pre-takeover, again irrespective of the identity of the highest paid director. Again,
we are able to test this. If we find no evidence for these predictions, then this is clearly
inconsistent with convergence. However, positive evidence is consistent with different
explanations that we can attempt to differentiate between. The first explanation is that the higher
pay occurs because a highly paid U.S. target company director is imported onto the acquirer’s
board following acquisition. The post-acquisition increase in pay of the highest paid director
occurs either because the new imported U.S. director is the new highest paid director, or because
the pay of the pre-takeover highest paid director is increased in line with the new U.S. director.11
The alternative explanation is that pay increases are higher following U.S. acquisitions because
of other reasons such as the inclusion of U.S. companies in peer group comparisons. If the latter
explanation is to hold, then any increase in pay should occur regardless of whether target
directors are promoted to the acquirer board or not.12 Highest directors pay is provided by
Datastream.
11 We are unable to differentiate between these two explanations because we do not know the identity of the highest paid director. 12 The latter test essentially answers the question of whether pre-acquisition directors benefit from the takeover, the question with which previous studies in this area have focused on.

18
The lack of available data on long term incentives means that we do not examine every aspect
of executive compensation. However, the effect of U.S. acquisitions on the granting of long term
incentives is considered to be of much less importance than the effect on salary and bonus. As
described above in Section 2, long term incentives in the U.K. form a much smaller part of
compensation than in the U.S. and this grew much less than for U.S. firms over the period.
Therefore a given percentage increase in salary and bonus is likely to dwarf the same percentage
increase in the value of long term incentives. As a result, the effect of U.S. acquisitions on
compensation is expected to be much more important for cash compensation than for long term
incentives. Furthermore, there appears to be no a priori reason why exclusion of long term
incentives will create a bias in our results, since one might expect both cash compensation and
long term incentives to be closely correlated with one another. Lastly, anecdotal evidence has
certainly suggested that the compensation effects following U.S. acquisitions have tended to be
in the form of higher pay rather than increases in long term compensation.
3.2.2. Control variables
In order to examine the impact of acquisitions on director compensation, we regress our
measures of directors pay on acquisition indicator variables and a number of firm characteristics
that have been shown in the compensation literature to have an important impact on
compensation.
Most compensation studies have found a positive relation between compensation and firm
size. We proxy for firm size with sales.13 Agency theories predict that firm performance will be
positively correlated with compensation. We employ two measures for firm performance: the
accounting return on assets (ROA, computed as the ratio of earnings before interest and taxes to
total assets); and the annual stock market return, Return, (computed as the 12-month raw return
of the firm’s stock in the fiscal year).
13 All accounting data has been adjusted for changes in accounting year ends. If an accounting year is shorter or longer than 12 months, then for flow variables (i.e. sales), the figure is divided by the number of months in the accounting year and then multiplied by 12 to get an annualized flow. Stock variables (i.e. assets) are not adjusted.

19
To examine whether changes in compensation are related to takeover performance, we
calculate short run announcement returns (Announcement return) to the acquiring firm. We
employ) standard event study methodology to calculate returns for the 3-day period (-1, 1)
around the announcement date. The abnormal returns are estimated using the market-adjusted
model, where the benchmark return is the contemporaneous return on the Datastream equal
weighted market index.
4. Results
4.1. Univariate analysis
In this section we examine the changes in compensation and their link with performance, in a
simple univariate framework, in the period surrounding the completion of the acquisition.
Panel A of Table 3 shows compensation levels for the highest paid director in the year prior
to and after acquisition. Before merger average (median) cash compensation for the highest paid
director is £260,000 (£223,000) for acquirers of U.S. targets, £174,000 (£138,000) for acquirers
of U.K. targets, and £241,000 (£200,000) for acquirers of other non-U.S. cross-border
acquisitions. Therefore, acquirers of U.S. targets have the highest paid directors, followed by
acquirers of cross-border non-U.S. targets, and then acquirers of U.K. targets. In terms of
changes in compensation following acquisition, we find important differences across the
different acquisition types. Compensation increases by a mean (median) of £33,000 (£23,000)
after US acquisitions, compared to £24,000 (£15,000) in U.K. acquisitions, and £25,000
(£19,000) in other cross-border non-U.S. acquisitions. The differences U.S. deals and the other
two types of deal are statistically significant (using t-tests and Wilcoxon rank sum test) at the
5% level.
Panel B of Table 3 reports the cross-sectional correlation between the change in
compensation and the change in profitability, in the year prior to acquisition and the year
following acquisition. We report this for the three different types of acquisition. The correlation
between pay change and profitability change prior to acquisition is 0.099 for acquirers of U.S.
targets. This declines to 0.088 following acquisition. In acquisitions of U.K. targets, the

20
corresponding figures are 0.102 and 0.127, whilst for other cross-border targets the
corresponding figures are 0.074 and 0.064. There is therefore some evidence that the pay-
performance link increases in U.K. and other cross-border acquisitions but no evidence that
acquisitions of U.S. targets result in a higher pay-performance link than other types of
acquisition.
Our conclusion is that U.S. deals result in higher absolute compensation increases than U.K.
deals and other cross-border non-U.S. acquisitions. However, U.S. deals do not result in a higher
pay-performance link than other acquisitions. The analysis thus far is limited in that it does not
control for other important determinants of pay, such as initial pay levels and changes in size
through acquisition which as we have seen differ significantly amongst the different merger
types. In the next section we incorporate these factors within a multivariate framework.
4.2. Multivariate analysis
We next conduct multivariate regression analysis that relates changes in compensation to
acquisition characteristics and control variables. We employ a pooled cross-section (panel data)
approach where our panel data consists of all U.K. public companies with financial information
available on the Datastream database for at least two successive accounting years during 1985-
98. Our data includes 1,217 acquirers for which we have 11,048 firm year observations,14 and
1,204 non-acquirers for which we have 5,793 firm year observations. In total we have 16,841
firm year observations. For this panel data, we estimate the following regression
∆ Log payit = α0 + find + ft + β1 Log pay-1it + β2 ∆ Log salesit + β3 ∆ ROAit + β4 Return +
β5 Announcement returnit + β6 U.S. target + β7 U.K. target + β8 Other cross-border target
+ eit (1)
14 Of the 11,048 firm year observations for the 1,217 acquirers, there are 2,838 years in which an acquisition is completed. This is lower than the total number of 3,603 acquisitions reported in Tables 1 and 2 because of multiple acquisitions in particular years.

21
where the operator ∆ on any variable X is simply current value X minus last period value (that
is, ∆ X = Xt, - Xt-1) and e is an error term.
The dependent variable is the annual change in the natural log of compensation. This
specification is very similar to that used by a number of the previous studies discussed in
Section 2.3, such as Conyon and Gregg (1994), Avery et al., (1998), Anderson et al., (2002), and
Girma et al., (2005a). The coefficient on lagged log pay, β1, controls for prior pay levels and
provides an estimate of the speed with which pay adjusts over time. Values of β1 in the range -2
< β1 < -1 are consistent with a cyclical convergence in pay towards equilibrium. If -1 < β1 <0 the
convergence is monotonic, with a value of β1 closer to -1 implying faster convergence (Girma et
al., 2005b). Prior levels of pay appear particularly important to control for, given the large
differences that exist between the different acquirer types.
U.S. target is a dummy variable that is given the value one in the fiscal year immediately
following the completion of a U.S. acquisition, zero otherwise. U.K. target is a dummy variable
that is given the value one in the fiscal year immediately following the completion of a U.K.
acquisition, zero otherwise. Other cross-border target is a dummy variable that is given the
value one in the fiscal year immediately following the completion of a cross-border acquisition
outside the U.S., zero otherwise.
We include 38 industry dummies to control for industry differences in the demand for
managerial talent. These industry dummies are based on Datastream Level 4 industry groupings,
which are equivalent to two-digit standard industrial classification codes in terms of detail. Year
dummies are employed to account for economy-wide shocks. The other variables are described
in Section 3.2.2. above.
In order to measure the impact of the different types of acquisition on the pay-performance
link, we interact each of the acquisition dummy variables with the change in profitability
variable. Specifically, we estimate the following regression

22
∆ Log payit = α0 + find + ft + β1 Log pay-1it + β2 ∆ Log salesit + β3 ∆ ROAit + β4 Return +
β5 Announcement returnit + β6 U.S. target + β7 U.K. target + β8 Other cross-border target
+ β9 U.S. target * ∆ ROAit + β10 U.K. target * ∆ ROAit + β11 Other cross-border target * ∆
ROAit + eit (2)
The coefficients, β9, β10, and β11 measure whether the pay-performance sensitivity is greater
following U.S., U.K. and other cross-border acquisitions respectively, in the year following
acquisition compared to other years. This is very similar to the approach employed by Harford
and Li (2005).
Table 4 presents the summary statistics for the variables used in our regressions. The
estimation procedure for all regressions uses Huber-White standard errors that are robust to
clustering at the firm level.
Column (1) of Table 5 reports the results of estimating Eq. (1). The Log pay -1 coefficient is
significantly negative, indicating that changes in pay are negatively related to prior
compensation levels. The coefficients for the ∆ Log sales, ∆ ROA, and Return variables are all
positive and statistically significant at high levels consistent with expectations. The coefficient
for the Announcement return variable is positive but not statistically significant. These results
are very robust and hold throughout the rest of the analysis. The coefficients for the three
dummy variables U.S. target, U.K. target, and Other cross-border target are all significantly
positive. However, the coefficient for U.S. target (0.054) is significantly larger (at the five %
level) than that for U.K. target (0.018), and Other cross-border target (0.018), both of which are
not significantly different from one another. This evidence is consistent with Hypothesis 1, that
U.S. acquisitions result in significantly higher pay changes than either domestic or other cross-
border acquisitions.
Column (2) of Table 5 reports the results of estimating Eq. (2). The coefficient for each of the
interaction terms is statistically insignificant, and does not differ significantly amongst the
23
different types of acquisition. Our conclusion is that U.S. acquisitions do not result in greater
pay-performance sensitivity than either domestic or other cross-border acquisitions.
4.3. Robustness tests
We subject these key conclusions to several robustness tests:
We have focused the analysis on the year immediately following acquisition. However,
changes to the levels and structure of pay may take place over time and not be immediately
apparent in the year following acquisition. We repeat the regression analysis in Table 5 but
instead use acquisition dummy variables which are lagged by one year so that they measure the
impact of merger on pay in the year following the year of completion of the acquisition. Our
results are unchanged by this alternative method. The coefficients for the acquisition dummy
variables are very similar to those in column (1) of Table 5 and the significant differences
remain between the different types of acquisition. Similarly, we find no evidence of increased
pay-performance sensitivity for U.S. acquirers (or other acquirers) in this year either. We also
do the same thing using a lag of two years. None of the coefficients are significantly different
from one another and the pay-performance sensitivity coefficients are not different from zero
nor from one another. We are confident therefore that our results are not affected by this factor.
In the above analysis we controlled for changes in firm size by including in the regression the
change in sales of the acquirer. We did not however allow for any differential pay impacts
between external (merger) growth and internal (organic non-merger) growth. However, if there
is a differential impact between the two forms of growth it could bias our results. For example, if
external growth is rewarded more highly than internal growth, then since U.S. acquisitions are
larger than other acquisitions, this could explain the larger pay increase in U.S. acquisitions. In
order to address this issue we decompose the change in sales of the acquiring company in the
acquisition year into those sales associated with the sales of the acquired company (external
growth) and those associated with the internal sales of the acquirer (internal growth). To do so
we use the same method as Avery et al (1998). Specifically, we define r as the ratio of the

24
acquiring firm’s sales to the sum of the acquiring and target firm 15 sales in the year before the
acquisition. We define internal growth as r multiplied by acquirer sales in the acquisition year
minus acquirer sales in the year prior to acquisition. Alternatively, external growth is the
difference between internal growth and the change in sales. The regression results using internal
growth and external growth show that the coefficients for the two measures are close to one
another and not significantly different. Furthermore, the U.S. acquisition dummy coefficient
remains significantly positive and significantly larger than the acquisition dummy coefficients
for U.K. and other cross-border acquisitions. We are therefore confident that are results are not
driven by the larger size of U.S. acquisitions.
There are other potential determinants of executive compensation which we have not
controlled for in the above model and which may affect our results. Firstly, we have not
included firm risk in the analysis, which captures both the firm’s information environment and
operating environment and has been shown to be an important determinant of executive pay
(see, e.g., Core et al., 1999). We measure firm risk as the standard deviation of share returns
measured over the fiscal year. Secondly, we have not controlled for growth opportunities which
we incorporate by using the firms market-to-book value. Inclusion of these two variables in
Table 5 regressions, results in an insignificant coefficient for the change in market-to-book value
and a significantly negative coefficient for the change in the standard deviation of firm stock
returns. The magnitude and statistical significance of our acquisition dummy variables and
change in profit interaction variables are unchanged.
4.4. What factors drive the large increases in pay after U.S. acquisitions?
The key conclusion so far is that pay levels are on average significantly increased following
U.S. acquisitions. In this section we seek to explore whether this higher pay can be explained by
15 Target company sales data is available from SDC and Acquisitions Monthly for 2,051 of the 3,603 sample acquisitions. For the remaining 1,552 targets for which sales is unavailable, we estimate their sales as follows: Firstly, we estimate the median transaction value to sales multiple for the 2,051 acquisitions, which is equal to 1.65. Secondly, for the 1,552 targets we divide their transaction value by 1.65 for the estimated sales value. As a check on the robustness of our results, recalculated our results only using the 2,051 acquisitions for which actual target sales data was available and we also used the transaction value of the target and the market value of the acquirer to estimate r. Our results were unchanged by these alternative methods.

25
the explanations for convergence in executive pay given in Section 2. In particular we examine
the impact of prior pay levels, order or acquisition, target organizational form, and board
changes following acquisition.
4.41. Prior acquirer pay levels
If the large pay increase in U.S. acquisitions is the result of convergence in the form of either
subsequent U.S. peer group inclusion or pay integration with U.S. subsidiary managers, we may
expect both explanations to have less of an impact when acquiring management is already
earning relatively high compensation because pay will need to increase relatively less to be
comparable to U.S. levels for a given firm size. In order to test this we adopt an approach similar
to Cosh and Hughes (1997), and for each year of the analysis we run a regression of
compensation on company size for all firms to estimate the size pay relationship for that year.
We then compare the predicted pay with the actual pay level for each company in each year, and
subsequently split acquirers into two subsamples according to whether their pay is higher or
lower than it should be in the year prior to acquisition year. The changes in compensation
around acquisition for these two subsamples of acquirers are reported in Panel A of Table 6. The
change in pay for acquirers of U.S. targets is £33,000 irrespective of whether the pay level prior
to acquisition was above or below the expected value. In contrast, in both domestic acquisitions
and acquisitions of other targets, the change in pay is significantly higher for acquirers with
initial low pay levels. These results appear contrary to what we would expect and provide no
evidence that pay increases in acquisitions of U.S. targets depend on initial pay levels.
4.42. Order of acquisition
One explanation for the increases in pay following U.S. acquisitions is that managers are
subsequently able to claim U.S. level pay because they are operating in the U.S. market. If this
were indeed the case, we would perhaps expect to observe a much larger impact for acquirers
upon their first acquisition in the US, relative to later acquisitions. We therefore compare the pay
increase for first U.S. acquisitions with subsequent U.S. acquisitions. The changes in

26
compensation around acquisition for these two subsamples of acquirers are reported in Panel B
of Table 6. There is no difference in the pay impact of first and later deals for either U.S.
acquisitions or other cross-border deals. In the case of domestic acquisitions, later deals have a
more positive impact.16
4.43. Target organizational form
To test the pay integration hypothesis we ideally require target CEO pay. However, CEO pay
data is not available for many of our target firms because they are unlisted. We can however,
sort the target firms according to factors that may be associated with higher CEO pay. In
particular, our sample of U.S. acquisitions can be split according to target organizational form.
There are several reasons why we may expect higher pay increases for acquisitions of public
targets vis-à-vis private targets, irregardless of geographical location. Principal-agent theory
suggests that in public companies, diffuse private owners will find it harder than large private
owners to monitor executive effort, and will therefore need to pay more to induce optimal effort
levels and link pay to performance more strongly. The higher pay levels may cause acquirer pay
to increase following public acquisitions in an attempt to equalise pay structures.17 There is
virtually no evidence on pay levels in U.S. private firms, and we can not therefore make
comparisons with U.K. private firms. There are however, various reasons why pay for the
former will be higher. Thomas (2005) argues that U.S. CEOs may be paid more because they
contribute more to their firms’ value (American firms have greater growth opportunities and
have greater resources to be deployed), play a much larger role in the decision making process,
and face higher opportunity costs because of better access to capital markets for financing their
own start-up businesses. These arguments appear to apply in equal measure to CEOs of both
private and public targets. However, this international pay difference may be further magnified
16 We also restricted the analysis to those acquirers who make more than one U.S. acquisition, U.K. acquisition or other acquisition, and we split in each subsample according to whether the acquisition is the first or a later deal. The results were unchanged. As a further test, we combine the previous two measures and compare those acquirers with low pay levels in their first acquisition with other acquisitions. We find no evidence that pay increases in U.S. acquisitions are different between these subgroups. 17 Alternatively, acquisitions of public targets could result in higher wages because they are harder to transact and more high profile.

27
in public companies because in addition to the above, CEOs in U.S. public companies have
more power than foreign CEOs because of higher dispersed share ownership and greater
bargaining power in the face of hostile takeovers (Thomas, 2005). Therefore, if integration of
pay systems is an important explanation for the U.S. acquisition pay premium, we expect to
observe a larger increase in pay in acquisitions of public compared to private targets, relative to
U.K. and other acquisitions.
The changes in compensation around acquisition for the subsamples of private and public
acquisitions are reported in Panel C of Table 6. Pay increases are significantly higher in public
acquisitions compared to private acquisitions, for both U.S. and U.K. acquisitions, although not
for other cross-border acquisitions. Although the difference between U.S. acquisitions and other
acquisitions is greater in public acquisitions, the difference is still statistically significant for
private acquisitions also, at least in the case of U.K. acquisitions. Given these significant
univariate differences, we also carry out multivariate analysis. We rerun regression (1) of Table
5, including dummy variables set equal to one if the acquisition is of a publicly listed target for
the particular geographical location. The results, not tabulated,18 show that the coefficients for
U.S. public acquisitions and U.K. public acquisitions are both significantly positive, although
the coefficient for other cross-border public acquisitions is not significant. However, these
coefficients are not significantly different from one another, suggesting that the higher pay
increase difference between U.S. public acquisitions and U.S. private acquisitions is no different
than that for U.K. public and private acquisitions. In contrast, even with the inclusion of these
additional dummy variables, the coefficient for the U.S. acquisition dummy is significantly more
positive than those for both the U.K. and other cross-border acquisition dummy variables.
Therefore, the greater impact of U.S. acquisitions is not restricted to acquisitions of public
targets, the high pay levels for which have been well documented. It also extends to private
targets. The results suggest that the impact of acquisition on compensation differs significantly
18 The tabulated results are available from the author on request.

28
according to the targets organizational form, but that U.S. acquisitions result in significantly
higher pay regardless of this effect.
4.44. Acquirer board changes following acquisition
According to the pay-integration hypothesis, pay increases will be larger, ceteris paribus,
when the CEO of the U.S. acquired unit is employed post-acquisition. Because of data
availability, this explanation is very difficult to test precisely. Firstly, data on whether target
CEOs are subsequently employed by the acquiring firm at below board level is generally
unavailable as is their post-acquisition pay level. A potential proxy for subsequent CEO
employment is whether they are promoted to the acquirer board or not. In such cases (because
the highest paid director’s identity is unknown), the highest paid director could be the pre-
acquisition highest paid director or the newly recruited target company CEO. However, one
could argue that the highest paid director’s identity is not relevant from the perspective of
convergence. There is no electronic data source for U.K. public firm board members and their
backgrounds over our sample period. Datastream does however, report the number of directors
each year for our sample firms and we employ this measure, splitting acquirers into those in
which the board size increases in the year of the acquisition, and those for which the board size
does not increase.19 Our reasoning is that acquirers with a board size increase are more likely to
have recruited target directors than those acquirers whose board size does not increase.20
The changes in compensation around acquisition for these subsamples of acquisitions are
reported in Panel D of Table 6. Pay increases are significantly higher for acquirers in which
board size increases in the year of acquisition. However, the same pattern exists not just for U.S.
acquisitions but also for U.K. and other cross-border acquisitions. The positive difference
between U.S. acquisitions and U.K./other cross-border acquisitions are somewhat larger for
acquirers with board changes, although the significance levels are similar for both types of
19 For U.S. acquisitions, there is a board increase in 155 out of 441 deal years. For U.K. acquisitions the number is 732 out of 2,122, and for other cross-border acquisitions the number is 148 out of 467. Alternatively, for all non-deal years (14,007) there are 3,608 years in which there is a board increase.
29
acquirer. The results suggest that the large pay increases in U.S. acquisitions are not solely
associated with changes in board size, but they may be relatively larger as a result. In order to
explore this further we again carry out multivariate analysis. Again, we rerun regression (1) in
Table 5, including additional dummy variables which are the particular acquisition type
dummies set equal to one if there is a board increase in the year of acquisition, and a board
increase dummy variable, designed to pick up any general effect for all firms of a board
increase. The results, not tabulated,21 show that the coefficients for the additional U.S.
acquisition board increase dummy variable and the U.K. acquisition board increase dummy
variables are both significantly positive, although the coefficient for other cross-border board
increase acquisitions is not significant. However, these coefficients are not significantly different
from one another, suggesting that the higher pay increase difference between U.S. board
increase acquisitions and U.S. non-board increase acquisitions is no different than that for U.K.
board increase and no board increase acquisitions. In contrast, even with the inclusion of these
additional dummy variables, the coefficient for the U.S. acquisition dummy is significantly more
positive than those for both the U.K. and other cross-border acquisition dummy variables.
Therefore, the greater impact of U.S. acquisitions is not restricted to acquisitions in which the
board size increases. It also extends to acquisitions in which board size does not increase. U.S.
acquisitions result in significantly higher pay regardless of board size effects. We tentatively
interpret this result as suggesting that the U.S. pay increase can not solely be explained by the
recruitment and subsequent high pay of target executives. Since the large pay increases in U.S.
acquisitions holds for boards which remain unchanged following acquisition, this suggests that
the pay increases accrue to the highest paid director that was in place before the acquisition and
is therefore important from the perspective of motivations for U.S. acquisitions.22, 23
20 Of course, this is very much an imperfect measure because it is possible that acquirers with no board increase may have recruited target directors and sacked their previous directors. Although we argue that this is less likely to be the case, the tests should be interpreted in this light. 21 The tabulated results are available from the author on request. 22 In the case of public targets, it is much more likely that target CEOs will sit on the acquirer board if they remain with the target firm, and therefore much more likely that an increase in board size reflects a target director coming on board. When we analyse public firms only, we find that there is no difference in the pay increase according to

30
4.45. Are pay-performance links stronger after U.S. acquisitions when certain conditions hold?
The arguments in Sections 4.42 to 4.44 apply not just to increases in pay levels but equally to
expected pay-performance increases in U.S. acquisitions as well. We expect the pay-
performance link to be stronger post-U.S. acquisition when the acquisition is the first of a series
of U.S. deals, when the target company is public, and when board size increases following
acquisition. We therefore carry out further tests to examine whether the pay-performance link is
more likely to increase following U.S. acquisitions when these conditions hold. In each case, we
rerun regression (2) of Table 5 including additional interactive dummy variables which are equal
to the acquisition type multiplied by the change in profitability (as in Table 5) further interacted
with dummy variables equal to one if the acquisition type is the first in a merger series, the
acquisition target is public, and if board size increases following acquisition. These additional
interactive variables will inform on whether the change in pay following acquisition is more
closely linked to the change in profitability under these three separate conditions. The results
from this analysis, not tabulated,24 show little evidence that this is the case. For none of these
coefficients does the U.S. acquisition category differ significantly from either U.K. or other
cross-border acquisitions. Therefore, we conclude that the link between pay and profitability is
not significantly stronger following U.S. acquisitions, even under conditions where we would
expect convergence effects to be strongest.
4.5. Are the U.S. pay increases following acquisition the result of managerial power?
Either of the two explanations given above for the high increase in pay following U.S.
acquisitions could be interpreted as efficient contracting. However, an alternative view, which
can be referred to as the managerial power approach, argues that CEOs have the power to
whether board size increases or not. In both cases there is a significant increase in pay, and no significant difference between the two. 23 One potential problem here is that with acquisition accounting only the revenues and expenses associated with the fiscal year since acquisition are incorporated, the pay may be lower for target directors than it would be in the second full year following acquisition. Similarly, one potential problem here is that in the year of acquisition, the pay of a target firm director may be linked to target performance but not acquirer performance. We therefore rerun Table 7 using acquisition dummies for 2 years following the acquisition, and also examine the ROA interaction variable in the 2nd year following acquisition. Our results are unchanged for regression (1). For regression (2)

31
influence board decisions including compensation decisions (see, e.g., Bebchuk and Fried,
2003). The likelihood of adopting a compensation arrangement that is favorable to executives
but suboptimal for shareholders will depend not only on the power that the CEO has but also on
how the arrangement is perceived by shareholders. If the shareholders perceive the arrangement
as a blunt expropriation, they are likely to act against it. This argument implies that CEOs who
want to maximize rent extraction might try to find justifiable reasons for their compensation. A
U.S. acquisition could provide such a justification, since the CEO could use any of the above
hypotheses as a justification for additional compensation. For example, a U.S. acquisition could
allow U.K. CEOs to call for pay parity with U.S. directors (whether recruited to the acquirer
board or otherwise). Under the managerial power approach, there should be a positive
correlation between the change in compensation around U.S. acquisitions and the level of
managerial power in the firm.
In order to test this hypothesis we create a managerial power dummy variable for each sample
firm year. To measure the impact of managerial power on the U.S. acquisition pay premium, we
then interact the managerial power dummy with the three acquisition dummy variables. We
experiment with a range of managerial power dummy measures. Firstly, we set it equal to one if
the board size is greater than the median board size over the sample period (seven), zero
otherwise. The results, not tabulated,25 show that board size has a significantly positive impact
on the change in pay but the interactive dummies are all insignificantly different from zero and
each other. Secondly, we set the managerial power measure equal to one if both the median
board is less than seven and the proportion of non-executive directors is less than the median
(0.40). Again, none of the interactive dummy variables are significantly different from zero or
each other. These results suggest that the high increase in pay following U.S. acquisitions is not
the result of managerial power.
neither U.S. ROA interactive coefficients are different from one another or from domestic and other cross-border coefficients. 24 The tabulated results are available from the author on request. 25 The tabulated results are available from the author on request.

32
5. Conclusion
In this study we examined the impact of a large sample of 487 acquisitions of U.S. targets by
U.K. public acquirers on executive compensation. We compared this sample with 2,900
domestic acquisitions and 502 acquisitions of other cross-border targets. Our long sample time
period from 1984-1998 covers two merger waves which can be differentiated relative to
previous waves by the high proportion of cross-border deals. U.K. acquirers played a pivotal
role in this emerging international market for corporate control, and were the most active
acquirers of U.S. targets. Such cross-border acquisitions have the potential to cause important
differences in corporate governance systems. In particular, given the high pay levels and pay-
performance links in the US, U.S. acquisitions may cause convergence towards the U.S.
paradigm. It is this issue that we directly address.
Relative to the US, disclosure requirements for U.K. public firms over this important period
of merger activity was limited, being restricted to the cash compensation of the highest paid
director. However, analysis of this variable has, we believe, enabled us to reach some robust and
important conclusions. Firstly, acquisitions of U.S. targets result in a large and significant
increase in the cash compensation of the highest paid director, compared to both domestic and
other cross-border acquisitions. Secondly, the link between cash compensation and firm
performance is not increased following acquisitions of U.S. targets.
We examined whether the pay increases in U.S. acquisitions were greater under certain
conditions which, a priori, we expect to have a greater impact. We may have expected those
acquirers with lower initial pay levels to experience larger increases in pay following U.S.
acquisitions. We found no evidence of this. Secondly, we may have expected pay increases to be
greater for first acquisitions in the U.S. compared to later acquisitions. We found no evidence of
this. Thirdly, we expected the pay increases in U.S. acquisitions to be greater in acquisitions of
public targets compared to private targets, relative to other types of acquisition. Although we
found that pay increases are significantly higher following public acquisitions, this appears to be
a general finding which applies equally to domestic acquisitions. Lastly, we expected the pay

33
increases in U.S. acquisitions to be greater when board size increases, since this could reflect the
recruitment of a higher paid target director. Again, we found no evidence of this. Finally, we
examined whether the pay increases in U.S. acquisitions were higher where there was more
managerial power in the acquiring firm. We found no evidence to support this. In summary,
although we find evidence of higher pay changes following U.S. acquisitions, we find no
evidence that the increases are consistent with explanations for higher pay that the convergence
literature has put forward.
Finally, since 1997, disclosure requirements for U.K. firms are now comparable to those in
the US. More detailed precise questions that were not possible to address for our time period can
now be addressed, albeit inevitably with much smaller samples. Firstly, although we uncover a
large pay increase following U.S. deals, we do not know the precise form of the increase and
whether it is an increase in base salary or bonus. Secondly, since we do not know the identity of
the highest paid director, we were unable to ascertain whether the pay increase accrues to the
CEO that initiated the U.S. acquisition. Similarly, we were unable to address what happens to
the compensation of U.S. target directors that become acquirer directors, and, if higher paid than
acquirer CEOs, what happens over time to the pay of the acquirer CEOs. Thirdly, we concluded
that the cash pay-performance link was not strengthened following U.S. acquisitions, but lack of
data availability meant we were unable to consider long term incentives such as share options.
These three issues can now be addressed with post-1997 data. Understanding them is important
from the perspective of convergence of international pay levels, the motivations for cross-border
acquisitions of U.S. companies, and ultimately the performance effects of such acquisitions.

34
References
Abowd, J., Bognanno, M., 1995. International differences in executive and managerial
compensation. In: Freeman, R., Katz, L., (Eds.), Differences and Changes in Wage
Structures. University of Chicago Press, Chicago, pp. 67-103.
Agrawal, A., Jaffe, J., 2002. The post-merger performance puzzle. In: Cooper, C., Gregory, A.,
(Eds.), Advances in Mergers and Acquisitions. Elsevier Science, New York, pp. 7-41.
Anderson, C., Becher, D., Campbell II, T., 2004. Bank mergers, the market for bank CEOs, and
managerial incentives. Journal of Financial Intermediation 13, 6-28.
Avery, C., Chevalier, J., Schaefer, S., 1998. Why do managers undertake acquisitions? an
analysis of internal and external rewards for acquisition. Journal of Law, Economics and
Organization 14, 24-43.
Bebchuk, L., Fried, J., 2003. Executive compensation as an agency problem. Journal of
Economic Perspectives 17, 71-92.
Berry, T., Bizjak, J., Lemmon, M., 2005. Organizational complexity and CEO labor markets:
evidence from diversified firms. Journal of Corporate Finance, Forthcoming.
Bliss, R., Rosen, R., 2001. CEO compensation and bank mergers. Journal of Financial
Economics 61, 107-139.
Bruner, R., 2003. Does M&A pay? a survey of evidence for the decision-maker. Journal of
Applied Finance 12, 48-69.
Cheffins, B., 2003. Will executive pay globalise along American lines? Corporate Governance:
An International Review 11, 8-24.
Cheffins, B., Thomas, R., 2004. The globalization (Americanization) of executive pay. Berkeley
Business Law Journal 1, 233-289.
Conyon, M., Gregg, P., 1994. Pay at the top: a study of the sensitivity of top director
remuneration to company specific shocks. National Institute Economic Review 149, 83-
93.

35
Conyon, M., Murphy, K., 2000. The prince and the pauper? CEO pay in the United States and
United Kingdom. Economic Journal 110, 640-671.
Conn, R., Cosh, A., Guest, P., Hughes, A., 2005. The impact on U.K. acquirers of domestic,
cross-border, public and private acquisitions. Journal of Business Finance & Accounting
32, 815-870.
Core. J., Holthausen, R., Larcker, D., 1999. Corporate governance, CEO compensation, and firm
performance. Journal of Financial Economics 51, 371-406.
Cosh, A., Hughes, A., 1987. The anatomy of corporate control: directors, shareholders and
executive remuneration in giant U.S. and U.K. corporations. Cambridge Journal of
Economics 11, 285-313.
Cosh, A., Hughes, A., 1997. Executive remuneration, executive dismissal and institutional
shareholdings. International Journal of Industrial Organization 15, 469-492.
Demsetz, H., 1995. Management compensation and tournament theory. In: Demsetz, H., The
Economics of the Firm: Seven Critical Commentaries. Cambridge University Press,
Cambridge. pp. 110-136.
Duru, A., Reeb, D., 2002. Geographic and industrial corporate diversification: the level and
structure of executive compensation. Journal of Accounting, Auditing and Finance 171,
1-24.
Firth, M., 1991. Corporate takeovers, stockholder returns and executive rewards. Managerial and
Decision Economics 12, 421-28.
Girma, S., Thompson, S., Wright, P., 2005a. The impact of merger activity on executive pay in
the UK. Economica, Forthcoming.
Girma, S., Thompson, S., Wright, P., 2005b. Corporate governance reforms and executive
compensation determination: evidence from the UK. Unpublished working paper.
University of Nottingham.

36
Grinstein, Y., Hribar, P., 2004. CEO compensation and incentives: evidence from M&A
bonuses. Journal of Financial Economics 73, 119-144.
Harford, J., Li, K., 2005. Decoupling CEO wealth and firm performance: evidence from
acquisitions and capital expenditures. Journal of Finance, Forthcoming.
Hughes, A., 1989. Mergers and economic performance in the UK: a survey of the empirical
evidence 1950-1990. In: Bishop, M., Kay, J., (Ed.), European Mergers and Merger
Policy. Oxford University Press, Oxford.
Jensen, M., 1986. Agency costs of free cash flow, corporate finance, and takeovers. American
Economic Review 76, 323-329.
Kroll, M., Simmons, S., Wright, P., 1990. Determinants of chief executive officer compensation
following major acquisitions. Journal of Business Research 20, 349-366.
Kroll, M., Wright, P., Toombs, L., Leavell, H., 1997. Form of control: a critical determinant of
acquisition performance and CEO rewards. Strategic Management Journal 18, 85-97.
Khorana, A., Zenner, M., 1998. Executive compensation of large acquirers in the 1980s. Journal
of Corporate Finance 4, 209-240.
Lambert, R., Larcker, D., 1987. Executive compensation effects of large corporate acquisitions.
Journal of Accounting and Public Policy 6, 231-43.
Moeller, S., Schlingemann, F., 2005. Global diversification and bidder gains: a comparison
between cross-border and domestic acquisitions, Journal of Banking and Finance 29,
533-564.
Murphy, K., 1999. Executive compensation. In: Ashenfelter, O., Card, D., (Eds.), Handbook of
Labor Economics. North Holland, Amsterdam, pp. 2,485-2,563.
Persons, O., 2001. The relationship between foreign vs. domestic earnings and executive
compensation. Mid-Atlantic Journal of Business 37, 123-137.
Ramcharran, H., 2002. Firm size and executive compensation: the impact of the foreign
operations on U.S. companies. Multinational Business Review 9, 138-145.
37
Rose, N., Shepard, A., 1997. Firm diversification and CEO compensation: managerial ability of
executive entrenchment? Rand Journal of Economics 28, 489-514.
Rosen, R., 2005. Betcha can’t acquire just one: merger programs and compensation.
Unpublished working paper. Federal Reserve Bank of Chicago, Chicago.
Rosen, S., 1992. Contracts and the market for executives. In: Wein, L., Wijker, H., (Eds.),
Contract Economics. Blackwell, Cambridge, MA, pp. 181-211.
Ryan, H., Wiggins III, R., 2001. The influence of firm- and manager-specific characteristics on
the structure of executive compensation. Journal of Corporate Finance 72, 101-23.
Thomas, R., 2005. Explaining the international CEO pay gap: board capture or market driven?
Vanderbilt Law Review 57, 1,171-1,268.
Thompson, S., Girma, S., Wright, P., 2002. Multinational activity and CEO remuneration.
Weltwirtschaftliches Archiv 138, 653-680.
Tuschke, A., 2003. The impact of executive compensation on the post-merger integration of
U.S. and German firms. Schmalenbach Business Review 55, 60-78.
United Nations Conference on Trade and Development (UNCTAD)., 2000. World Investment
Report 2000. United Nations: New York and Geneva.
Wright, P., Kroll, M., Elenkov, D., 2002. Acquisition returns, increase in firm size, and chief
executive officer compensation: the moderating role of monitoring. Academy of
Management Journal 45, 599-610.

38
-
200
400
600
800
1,000
1,200
Country
CEO
pay
(US$
thou
sand
s)
Bas ic co mpens a tio n Variable bo nus Lo ng-te rm incentives Other
Fig. 1. International comparison of CEO pay levels and structures. Data from Towers Perrin’s Worldwide Total Reward report, 1999. Data reflects Towers Perrin’s estimate of competitive CEO pay as of April 1999 for industrial companies with approximately U.S. $250 million in annual revenues. Local currency amounts are converted into U.S. dollars using April 1999 exchange rates. Basic compensation includes base salary plus other regular payments (such as vacation pay, 13th month pay, and regular bonuses unrelated to performance). Variable bonus includes target performance-based cash awards. Long-term incentives include the grant-date expected value of option grants and annualized targets from long-term incentive plans. Other includes both voluntary and compulsory company contributions and the value of perquisites.

39
Table 1
Number of sample acquisitions by year
This table gives the breakdown of sample acquisitions by year of completion date. The sample acquisitions are those completed by U.K. public firms between 1st January 1984 and 31st December 1998 identified on either the Thomson Financial SDC merger database or the Thomson Financial publication Acquisitions Monthly. To be included, the acquirer must be included on the Datastream Database, with financial information available for both the fiscal year immediately prior to and following the acquisition completion date. The acquisition value must be at least five % of the acquirer’s market value at the start of the announcement month (acquisition values in foreign currencies were converted to sterling using the exchange rate at the end of the announcement month). Columns 2-4 report the year distribution for subsamples, stratified according to the target firm’s geographical location (U.S., U.K., or other cross-border). The breakdown of non-U.S. cross-border deals by country is as follows: Australia (38), Austria (2), Belgium (23), Bermuda (2), Burma (1), Canada (33), Cayman Islands (1), Chile (1),China (1), Denmark (14), Eire (11), Finland (3), France (97), Germany (73), Greece (1), Hong Kong (5), India (2), Hungary (1), Iceland (1), Italy (21), Luxembourg (4), Malaysia (3), Mexico (4), Netherlands (74), New Zealand (6), Norway (6), Pakistan (1), Panama (1), Portugal (3), Singapore (2), South Africa (5), Spain (26), Sri Lanka (2), Sweden (23), Switzerland (11).
Year U.S. targets U.K. targets Other cross-border targets 1984 1 5 1 1985 21 77 4 1986 39 142 10 1987 48 206 21 1988 63 306 41 1989 60 255 56 1990 41 192 46 1991 20 141 32 1992 19 140 29 1993 21 157 31 1994 25 216 38 1995 34 185 44 1996 34 213 45 1997 34 218 59 1998 27 161 45 Total 487 2,614 502

40
Table 2
Descriptive statistics on sample acquisitions
This table reports descriptive statistics for the sample acquisitions. Total deal value is the total value of all transactions. Deal size is the value of the transaction. Acquirer size is the acquirer’s market value at the start of the announcement month (acquisition values in foreign currencies were converted to sterling using the exchange rate at the end of the announcement month). These values are expressed in 1998 sterling values deflated using the U.K. Retail Price Index. Relative size is Acquisition size divided by Acquirer size. Announcement return is the cumulative abnormal return measured over the three day period surrounding the acquisition announcements (-1 to +1 where day 0 is the announcement date), measured relative to the FT All Share Index. Long run return is the buy-and-hold abnormal return for acquirers over the 36 months following the completion month, computed with respect to non-acquiring control firms matched on size and market-to-book ratio. Days to complete is the length of the announcement period, from announcement day to completion day. Hostile acquisitions are those in which the initial offer is rejected by target management. Subsidiary acquisitions are those in which the target is majority owned by another company. Competed acquisitions are those in which more than one bid is made for the target company. Horizontal acquisitions are those in which the acquirer and target share the same primary two digit SIC code. Method of payment is defined according to whether the offer is a pure 100% cash offer (All cash), a pure 100% stock offer (All stock), some combination of stock and cash (Stock and cash) or some alternative payment method (Other). There are 83 sample acquisitions for which the method of payment is unknown. All continuous variables except Total deal value are winsorized at the five % level to remove influential outliers.
Year U.S. targets U.K. targets Other cross-border targets Observations 487 2,612 502 Total deal value (£ billion) 254 371 86 Deal size (£ million) mean 222 85 114 Deal size (£ million) median 76 16 29 Acquirer size (£ million) mean 535 173 360 Acquirer size (£ million) median 194 40 107 Relative size mean 0.56 0.85 0.52 Relative size median 0.36 0.38 0.24 Announcement return (%) mean 0.26 0.53 0.58 Announcement return (%) median 0.00 0.00 0.11 Long run return (%) mean -8.09 -7.64 -18.84 Long run return (%) median -3.07 -4.45 -8.29 Days to complete mean 35 20 30 % of acquisitions Public 14 19 7 Hostile 2 3 1 Subsidiary 33 30 36 Competed 2 2 1 Horizontal 39 36 47 Method of payment All cash 74 45 69 All stock 3 13 7 Stock and cash 10 33 16 Other 8 8 6

41
Table 3
Changes in pay levels and pay-performance for acquirers around acquisition
This table reports pay levels and pay-performance correlations for acquiring firms in the period surrounding the acquisition. Pre-acquisition is the fiscal year ending prior to the acquisition completion date and post-acquisition is the fiscal year following the acquisition completion date. Panel A reports pay levels pre- and post-acquisition and the difference between the two. Pay level is the cash compensation (salary plus bonus) of the highest paid director. It is expressed in 1998 sterling values (thousands). Panel B reports the cross-sectional correlation coefficient between changes in pay levels and changes in profitability, pre-acquisition and post-acquisition. The change in pay levels is the difference between the cash compensation (salary plus bonus) of the highest paid director in the current fiscal year and the previous fiscal year. The change in profitability is the difference between profit before interest and taxation divided by total assets in the current fiscal year and the previous fiscal year. All variables are winsorized at the five % level to remove influential outliers.
Variable U.S. targets
U.K. targets
Other cross-border targets
p-values for t- and Wilcoxon tests
U.S. vs. UK
U.S. vs. Other
U.K. vs. Other
Panel A: Pay levels pre- and post-acquisition Pre-acquisition mean 260 174 241 Pre-acquisition median 223 138 200 Post-acquisition mean 295 199 267 Post-acquisition median 250 156 216 Mean difference pre- and post-acquisition 33 24 25 0.00 0.02 0.77 Median difference pre- and post-acquisition 23 15 19 0.00 0.03 0.79 Observations 441 2,122 467 Panel B: Correlation between pay and profitability pre- and post-acquisition Pre-acquisition 0.099 0.102 0.074 Post-acquisition 0.088 0.127 0.139 Difference pre- and post-acquisition -0.011 0.024 0.064 Observations 424 1,927 440
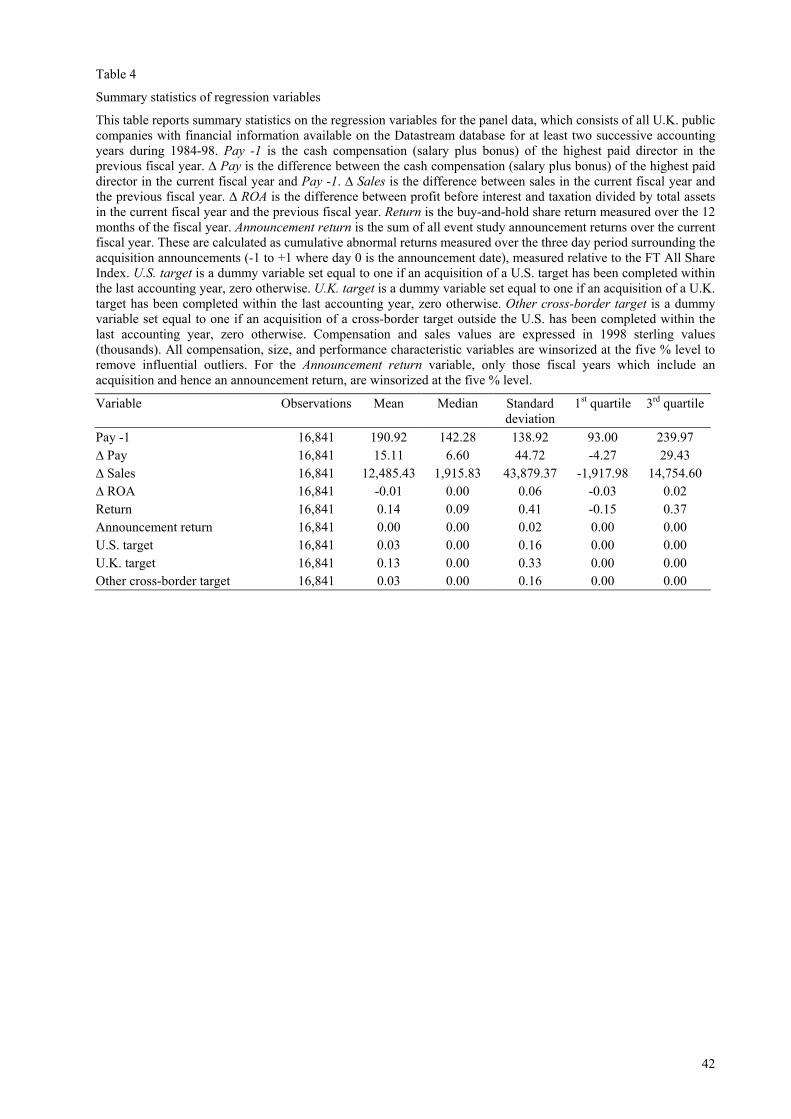
42
Table 4
Summary statistics of regression variables
This table reports summary statistics on the regression variables for the panel data, which consists of all U.K. public companies with financial information available on the Datastream database for at least two successive accounting years during 1984-98. Pay -1 is the cash compensation (salary plus bonus) of the highest paid director in the previous fiscal year. ∆ Pay is the difference between the cash compensation (salary plus bonus) of the highest paid director in the current fiscal year and Pay -1. ∆ Sales is the difference between sales in the current fiscal year and the previous fiscal year. ∆ ROA is the difference between profit before interest and taxation divided by total assets in the current fiscal year and the previous fiscal year. Return is the buy-and-hold share return measured over the 12 months of the fiscal year. Announcement return is the sum of all event study announcement returns over the current fiscal year. These are calculated as cumulative abnormal returns measured over the three day period surrounding the acquisition announcements (-1 to +1 where day 0 is the announcement date), measured relative to the FT All Share Index. U.S. target is a dummy variable set equal to one if an acquisition of a U.S. target has been completed within the last accounting year, zero otherwise. U.K. target is a dummy variable set equal to one if an acquisition of a U.K. target has been completed within the last accounting year, zero otherwise. Other cross-border target is a dummy variable set equal to one if an acquisition of a cross-border target outside the U.S. has been completed within the last accounting year, zero otherwise. Compensation and sales values are expressed in 1998 sterling values (thousands). All compensation, size, and performance characteristic variables are winsorized at the five % level to remove influential outliers. For the Announcement return variable, only those fiscal years which include an acquisition and hence an announcement return, are winsorized at the five % level.
Variable Observations Mean Median Standard deviation
1st quartile 3rd quartile
Pay -1 16,841 190.92 142.28 138.92 93.00 239.97 ∆ Pay 16,841 15.11 6.60 44.72 -4.27 29.43 ∆ Sales 16,841 12,485.43 1,915.83 43,879.37 -1,917.98 14,754.60 ∆ ROA 16,841 -0.01 0.00 0.06 -0.03 0.02 Return 16,841 0.14 0.09 0.41 -0.15 0.37 Announcement return 16,841 0.00 0.00 0.02 0.00 0.00 U.S. target 16,841 0.03 0.00 0.16 0.00 0.00 U.K. target 16,841 0.13 0.00 0.33 0.00 0.00 Other cross-border target 16,841 0.03 0.00 0.16 0.00 0.00

43
Table 5
Do acquisitions of U.S. targets result in larger pay increases and stronger pay-performance than other acquisitions?
This table reports regression results examining the changes in cash compensation of the highest paid director in all U.K. public companies with financial information available on the Datastream database between 1985 and 1998. The dependent variable is the change in the log value of cash compensation (salary plus bonus) of the highest paid director, between the current and the previous fiscal year. Log pay -1 is the log value of cash compensation (salary plus bonus) of the highest paid director in the previous fiscal year. ∆ Log sales is the difference between the log value of sales in the current fiscal year and the previous fiscal year. ∆ ROA is the difference between profit before interest and taxation divided by total assets in the current fiscal year and the previous fiscal year. Return is the buy-and-hold share return measured over the 12 months of the fiscal year. Announcement return is the sum of all event study announcement returns over the current fiscal year. These are calculated as cumulative abnormal returns measured over the three day period surrounding the acquisition announcements (-1 to +1 where day 0 is the announcement date), measured relative to the FT All Share Index. U.S. target is a dummy variable set equal to one if an acquisition of a U.S. target has been completed within the last accounting year, zero otherwise. U.K. target is a dummy variable set equal to one if an acquisition of a U.K. target has been completed within the last accounting year, zero otherwise. Other cross-border target is a dummy variable set equal to one if an acquisition of a cross-border target outside the U.S. has been completed within the last accounting year, zero otherwise. Compensation and sales values are first converted to 1998 sterling values (thousands). All compensation, size, and performance variables are winsorized at the five % level to remove influential outliers. For the Announcement return variable, only those fiscal years which include an acquisition and hence an announcement return, are winsorized at the five % level. Corresponding p-values from Huber-White robust standard errors are reported in brackets.
(1) (2) Intercept 0.302 0.302 (11.17) (11.18) Log pay -1 -0.062 -0.062 -(19.69) -(19.68) ∆ Log sales 0.193 0.193 (19.92) (19.97) ∆ ROA 0.301 0.279 (8.71) (7.58) Return 0.055 0.055 (11.41) (11.46) Announcement return 0.043 0.044 (0.48) (0.49) U.S. target 0.059 0.060 (7.30) (7.36) U.K. target 0.026 0.026 (6.00) (6.06) Other cross-border target 0.017 0.019 (2.03) (2.23) U.S. target * ∆ ROA 0.116 (0.53) U.K. target * ∆ ROA 0.124 (1.15) Other cross-border target * ∆ ROA 0.287 (1.25) Year and industry dummies Yes Yes Adjusted R2 0.1244 0.1247 Observations 16,841 16,841

44
Table 6 Changes in pay levels for acquirers around U.S. acquisitions conditioned on various factors
This table reports the average change in pay level for acquiring firms between the fiscal year prior to the acquisition completion date and the fiscal year following the acquisition completion date. Pay level is the cash compensation (salary plus bonus) of the highest paid director. It is expressed in 1998 sterling values (thousands) and winsorized at the five % level to remove influential outliers. Panel A reports the change for subsamples of acquirers based on whether pre-acquisition pay levels are lower or higher than expected given the acquirers size. For each year of the sample period we run a regression of compensation on company size for all firms to estimate the size pay relationship for that year. We then compare the predicted pay with the actual pay level for each company in each year, and subsequently split acquirers into two subsamples according to whether their pay is higher or lower than it should be in the year prior to acquisition year. Panel B reports the change for subsamples of acquirers based on whether the particular type of acquisition is the first of a particular type or the 2nd or greater acquisition of a particular type. Panel C reports the change for subsamples of acquirers based on whether the target is a publicly listed company or a private company. Panel D reports the change for subsamples of acquirers based on whether the number of directors on the acquirers board increases in the year of acquisition, and those for which the board size does not increase. The number of observations for each subsample are reported in parentheses.
Variable U.S. targets U.K. targets Other cross-border targets
p-value for t-test
U.S. vs. UK U.S. vs. Other
U.K. vs. Other
Panel A: Pre-acquisition pay level Low 33 26 29 0.02 0.41 0.20 (186) (1,295) (236) High 33 21 20 0.00 0.02 0.83 (255) (827) (231) p-value for t-test 0.93 0.01 0.08 Panel B: Order of acquisition First deal 32 21 24 0.00 0.08 0.28 (278) (1,024) (326) Later deals 35 26 25 0.04 0.19 0.84 (163) (1,098) (141) p-value for t-test 0.55 0.01 0.83 Panel C: Target organizational form Public 54 33 32 0.00 0.05 0.82 (83) (470) (59) Private 30 22 25 0.00 0.26 0.20 (387) (1,761) (439) p-value for t-test 0.00 0.00 0.44 Panel D: Board size increase following acquisition Increase 39 28 29 0.01 0.13 0.71 (155) (732) (148) No increase 29 22 22 0.01 0.13 0.83 (285) (1,387) (319) p-value for t-test 0.07 0.01 0.23