Do ATM-based Internet Exchange Points Make Sense Anymore 1.7
17
DRAFT Do ATM-based Internet Exchange Points Make Sense Anymore? V1.7 W. B. Norton 1 Comments to the Author Welcome Last Update: 2/10/2010 <[email protected]> Do ATM-based Internet Exchange Points Make Sense Anymore? William B. Norton <[email protected]> Abstract During the NSFNET transition 1 from the Authorized Use Policy Internet to the Commercial Internet, several Network Access Points (NAPs) were created to facilitate the traffic exchange between the Internet Service Providers, two of which were ATM-based. Internet Service Providers were initially required to connect to three of the four NAPs in order to receive NSF funds (indirectly through their NSF-sponsored customers) during this transition period. During the years that followed, this requirement was dropped and the cost models of Internet Operations have changed dramatically. Technologies such as Wave Division Multiplexing and Long Haul Fiber Improvements led to a radical decrease in the cost of transport, and a corresponding drop in the price of transit. At the same time, the cost of peering at ATM-based exchange points have not substantially dropped. This leads to a question in the Peering Coordinator Community today: “Do ATM-based Internet Exchange Points make sense anymore?” In this paper we apply the previous Peering Research (peering financial models) to this question, using current market prices for transit, transport, IX fees, and peering equipment,(culled from conversations with about 50 ISPs. Thanks to the input from Peering Coordinator Community, we include in the analysis empirical data regarding ATM cell tax, HDLC framing overhead, and Ethernet framing overhead, to compare the cost of transit against the costs of peering at ATM-based NAPs and Ethernet-based Internet Exchange Points. We build upon the previous research on Peering by introducing the notion of an Effective Peering Range (EPR), a measure of when an Internet Exchange makes sense financially. We also highlight a potentially costly EPR Gap, an interim range between Peering Capacity points where peering is more expensive than transit. The financial models presented (that produced the graphs) are included in the Appendix so that ISPs can apply these cost models to their specific situation. 1 1994-1995, AADS and PacBell were ATM-based and the Sprint NAP was FDDI-based. MAE-East was added later and migrated to an ATM-based IX somewhere around 1999. Introduction An Internet Exchange (IX) provides an interconnection environment for Internet Service Providers (ISPs) to exchange traffic. This is accomplished in a physical environment conducive to the traffic exchange, typically a building with support infrastructure such as backup generators, uninterruptible power supply systems, security systems, air conditioning systems, etc. The exchange point operator is minimally responsible for providing and maintaining 2 this interconnection environment. Within this interconnection environment, Internet Service Providers exchange traffic with one another in Peering 3 (and Transit 4 ) relationships. A measure of value of the IX to an ISP is the degree to which an ISP can reduce its cost of transit by directly sending traffic to the peers participating at the exchange point. Since transit fees are variable (based on usage), any traffic sent to free peering relationships reduces the amount of transit purchased, and therefore the cost of transit. There is a fixed cost of peering however; which can mathematically be defined as: Figure 1 - The Cost of Peering 5 at an IX 2 In Europe the typical Exchange Point separates the collocation from the interconnection responsibilities; exchange point operators tender the collocation, and focus on building the population and switching fabric. 3 Peering is defined as “the business relationship whereby ISPs reciprocally provide access to each others’ customers” in “Internet Service Providers and Peering”, freely available via e-mail to [email protected] . 4 Transit is defined as “the business relationship whereby one ISP provides (usually sells) access to all destinations in its routing table” , ibid. 5 Recurring costs only here, note that there are typically one-time installation/provisioning fees. Note also that transport into an IX may require multiple local loops and a long haul circuit. We treat this as a large potentially expensive local loop in this paper. Scott Sheppard (BellSouth)
Transcript of Do ATM-based Internet Exchange Points Make Sense Anymore 1.7

DRAFT Do ATM-based Internet Exchange Points Make Sense Anymore? V1.7 W. B. Norton
1 Comments to the Author Welcome
Last Update: 2/10/2010 <[email protected]>
Do ATM-based Internet Exchange Points Make Sense Anymore? William B. Norton <[email protected]>
Abstract During the NSFNET transition1from the Authorized
Use Policy Internet to the Commercial Internet, several Network Access Points (NAPs) were created to facilitate the traffic exchange between the Internet Service Providers, two of which were ATM-based. Internet Service Providers were initially required to connect to three of the four NAPs in order to receive NSF funds (indirectly through their NSF-sponsored customers) during this transition period.
During the years that followed, this requirement was dropped and the cost models of Internet Operations have changed dramatically. Technologies such as Wave Division Multiplexing and Long Haul Fiber Improvements led to a radical decrease in the cost of transport, and a corresponding drop in the price of transit. At the same time, the cost of peering at ATM-based exchange points have not substantially dropped. This leads to a question in the Peering Coordinator Community today:
“Do ATM-based Internet Exchange Points make sense anymore?”
In this paper we apply the previous Peering Research (peering financial models) to this question, using current market prices for transit, transport, IX fees, and peering equipment,(culled from conversations with about 50 ISPs. Thanks to the input from Peering Coordinator Community, we include in the analysis empirical data regarding ATM cell tax, HDLC framing overhead, and Ethernet framing overhead, to compare the cost of transit against the costs of peering at ATM-based NAPs and Ethernet-based Internet Exchange Points.
We build upon the previous research on Peering by introducing the notion of an Effective Peering Range (EPR), a measure of when an Internet Exchange makes sense financially. We also highlight a potentially costly EPR Gap, an interim range between Peering Capacity points where peering is more expensive than transit.
The financial models presented (that produced the graphs) are included in the Appendix so that ISPs can apply these cost models to their specific situation.
1 1994-1995, AADS and PacBell were ATM-based and the
Sprint NAP was FDDI-based. MAE-East was added later and migrated to an ATM-based IX somewhere around 1999.
Introduction An Internet Exchange (IX) provides an interconnection
environment for Internet Service Providers (ISPs) to exchange traffic. This is accomplished in a physical environment conducive to the traffic exchange, typically a building with support infrastructure such as backup generators, uninterruptible power supply systems, security systems, air conditioning systems, etc. The exchange point operator is minimally responsible for providing and maintaining2 this interconnection environment.
Within this interconnection environment, Internet Service Providers exchange traffic with one another in Peering3 (and Transit4) relationships.
A measure of value of the IX to an ISP is the degree to which an ISP can reduce its cost of transit by directly sending traffic to the peers participating at the exchange point. Since transit fees are variable (based on usage), any traffic sent to free peering relationships reduces the amount of transit purchased, and therefore the cost of transit. There is a fixed cost of peering however; which can mathematically be defined as:
Figure 1 - The Cost of Peering5 at an IX
2 In Europe the typical Exchange Point separates the collocation
from the interconnection responsibilities; exchange point operators tender the collocation, and focus on building the population and switching fabric.
3 Peering is defined as “the business relationship whereby ISPs reciprocally provide access to each others’ customers” in “Internet Service Providers and Peering”, freely available via e-mail to [email protected] .
4 Transit is defined as “the business relationship whereby one ISP provides (usually sells) access to all destinations in its routing table” , ibid.
5 Recurring costs only here, note that there are typically one-time installation/provisioning fees. Note also that transport into an IX may require multiple local loops and a long haul circuit. We treat this as a large potentially expensive local loop in this paper. Scott Sheppard (BellSouth)

DRAFT Do ATM-based Internet Exchange Points Make Sense Anymore? V1.7 W. B. Norton
2 Comments to the Author Welcome
Last Update: 2/10/2010 <[email protected]>
These Peering and Transit Costs for ATM-based and Ethernet-based IXes are shown graphically in the pictures below.
Figure 2 - Costs of ATM-based Peering
An ISP connecting to an ATM-based IX typically6 leases an ATM circuit into the ATM cloud to connect to the other participants in the cloud7. The ATM IX and circuits are both provisioned by the same carrier (the ATM IX Operator), so this peering model lacks an open market for transport. At the same time, note that the ISP router connects directly to the ATM cloud, so no additional router or rack space is required.
Figure 3 - Costs of Ethernet-based Peering
The cost structure is similar for the Ethernet-based IX solution with a few exceptions. The Ethernet-based IX solution generally requires a router to be collocated in the same building as the Ethernet switch, so collocation rack
6 ATM does not preclude collocation.
7 Note that connecting does not guarantee peering; the other ISP must configure their side of the ATM fabric as well!
space and a router are required. Since the IX operator is typically not a carrier, an open market of transport providers leads to competition and generally lower prices for connectivity into the IX.
In the Ethernet-based IX model, the participants have two different methods of interconnection: Public Peering across the Ethernet switch, or Private Peering over dedicated wires called cross connects. Private Peering is an effective scaling strategy; when any one peering session is using a lot of bandwidth8, ISPs can migrate those high volume peering sessions into high capacity9 private cross connects. This allows the ISPs to control and have complete visibility into the peering interconnection10. In any case, Paul Vixie (ISC, formerly PAIX) argues strongly that the incremental cost of the router and rack space at the IX is offset by the additional capabilities of Private Peering. We ignore these benefits in our analysis, but will incorporate the incremental equipment costs of the routers required for Ethernet-based peering11.
We will also explicitly ignore the general technical benefits of peering (lower latency, more control over routing, incremental revenue from a better performing service, Traffic Aggregation Benefits, etc.) as these are covered more completely in “Internet Service Providers and Peering.” We ignore the political and marketing benefits of peering (desire to be a Tier 1 transit-free ISP, marketing value of good peering, etc.). In this paper we focus only on the financial aspects of peering, highlighting when peering makes sense.
The Peering Breakeven Point We can determine when peering makes sense financially by determining when traffic exchange via peering is less expensive than the traffic exchange via transit12. The
8 Some ISPs contractually obligate each other to migrate to
private cross connects when the total utilization on their public peering ports reaches 40% of the available capacity.
9 Some ISPs dedicate multiple cross connects for private peering, each at Gigabit Ethernet (1000Mbps).
10 With no active electronics between the ISPs, both sides have complete visibility into the capacity used for peering. With Public Peering, the other ISP may have over provisioned his port, a fact that is difficult to diagnose from the other side of the peering session. Waqar Khan (Qwest) pointed this out during the Interconnection Strategies for ISPs research.
11 In past versions of this white paper we punted on equipment costs, due to the wide variety of configurations and price points.
12 Discussed in greater detail in “A Business Case for Peering”, freely available from the author.

DRAFT Do ATM-based Internet Exchange Points Make Sense Anymore? V1.7 W. B. Norton
3 Comments to the Author Welcome
Last Update: 2/10/2010 <[email protected]>
Peering Breakeven Point (where ISPs are indifferent between peering or simply purchasing transit) is the point where the unit costs for either traffic exchange method are equal13:
Figure 4 - Peering Breakeven Point
When it costs less to send traffic to an upstream transit provider, ISPs should rationally prefer to do so14. When the unit cost of sending traffic to an IX is less, ISPs should prefer to use an IX to offload this transit traffic. Beyond the Peering Breakeven Point, all peering costs (circuit into the IX, router, rack, port fees) are completely covered by the cost savings of peering. This is shown in the figure below, highlighting a few points of interest to the Peering Coordinator community.
Figure 5 - Peering Breakeven Analysis
Three key points on this Peering versus Transit graph will be revisited during the analysis in this paper:
Definition: The Effective Peering Bandwidth15 is the maximum bandwidth available for peering, defined as the minimum of the available transport bandwidth and the usable bandwidth on the shared peering fabric. This is the maximum sustainable capacity of the peering infrastructure.
Once the Peering Breakeven Point is reached, the unit cost
13 ibid.
14 Assuming that performance is not an issue with the upstream provider.
15 Defined initially in “The Business Case for Peering”, presented again because of the central role it plays in the logic of the paper.
of traffic exchange decrease until the Effective Peering Bandwidth is reached, at which point the Minimum Cost of Traffic Exchange is realized.
Definition: The Minimum Cost of Traffic Exchange is the unit cost of traffic exchange when the Effective Peering Bandwidth is fully utilized.
Definition: The Effective Peering Range (EPR) is the range in which peering at an Internet Exchange makes sense (financially), measured as the range between the Peering Breakeven Point and the Effective Peering Bandwidth.
We will apply these three definitions as we examine ATM and Ethernet-based exchanges against the price of transit using recent market prices. We now turn to the question at hand: “Do ATM-based Internet Exchange Points make sense anymore?”
Two Real World Regional IXes Let’s apply our Peering Financial Models to two real
world regional IXes: an ATM-based Exchange Point16 and a Gigabit Ethernet Exchange Point17. For the purposes of this analysis we will use representative price quotes from the field, based on initial conversations with about 30 Peering Coordinators and refined through the process of walking dozens more through this analysis.
Medium Scale Peering. We will start with medium-scale peering, using an OC-3 (155 Mbps) circuit into an Internet Exchange. For policy reasons, let’s assume that the ISP in question insists that peering circuits be upgraded when the average utilization reaches 75% of the effective peering bandwidth18. We assume that an ISP that expects to peer at OC-3 is most likely purchasing transit with commitments for 500Mbps, and therefore likely able to obtain a transit price point of $125 /Mbps19. To make this
16 Such as the AADS NAP, MAE-East, MAE-West, PacBell
NAP.
17 In use at Equinix, PAIX, and most European and Asian IXes.
18 Based on the conversations with the ISP Peering Coordinators, this seems to be the current practice. Research shows that some ISPs (Level3 and Qwest for example) upgrade interconnect bandwidth when they reach 40% capacity to minimize the chance of packet loss.
19 These prices are from the field, have wide variance, and are a fairly aggressive prices, but not uncommon in the August 2002 timeframe. Several ISPs cited Tier 1 pricing ranging from $75/Mbps to $150/Mbps, with many pseudo Tier 1 ISPs around $75/Mbps at these volume commitments – Rob Seastrom (inter.net), Dorian Kim (NTT/Verio), others. Appendix D & E include an analysis for when transit=$150 per Mbps.

DRAFT Do ATM-based Internet Exchange Points Make Sense Anymore? V1.7 W. B. Norton
4 Comments to the Author Welcome
Last Update: 2/10/2010 <[email protected]>
example concrete, we will use recent Washington, DC metropolitan Area exchanges (MAE-East ATM and Equinix Ashburn Gigabit Ethernet Exchange Pak) for our peering cost points20, noting that some of these quotes are highly variable.
Peering at ATM IX/OC-3. An ISP wishing to peer at an ATM IX at OC-3 (155 Mbps) capacity has two costs: the OC-3 ATM Transport Circuit and the ATM Port. Based on the MAE-East ATM IX21 we see the following cost points and Peering calculations22:
Figure 6 – ATM-based OC-3 Peering Analysis
We see the ATM cell tax23plays a role in reducing the effective bandwidth available for peering; out of 155Mbps, 120Mbps is assumed usable bandwidth for peering traffic. The assumption that the transport will only be used up to the 75% available capacity point brings the Effective
20 These data points are based on interviews with MAE-East
participants, during the period January 2002-April 2002, For demonstration purposes we will use the full retail price at Equinix.
21 Price points ranged here from $14,000/mo down to just under $10,000/mo, varying most widely based on local loop costs. Other ATM-based exchanges found in this study were less expensive.
22 The spreadsheets for this paper are in Appendix A and available in electronic form from [email protected].
23 Overhead associated with ATM framing. This topic is heatedly debated among ISPs, but proven to be at least 11% and empirically seen to be 20% based on conversations with ISPs (Todd Branning (Level3), Dave McGaugh(ELI), Ingrid Irkman(ICG), Dorian Kim (NTT/Verio), Dan Godling (SockEye), Ian Somerton and Dave Wodelet (Shaw/Big Pipe). See http://www.commweb.com/article/COM20010521S0013. See the VBNS study: K, Thompson, G.J. Miller, R. Wilder, “Wide Area Internet traffic patterns and characteristics”, IEEE Network, 11, no. 6 (Nov/Dec 1997), page 9 empirically finds the same 20% ATM cell tax and 6% SONET overhead. The on-line version is available at http://www.vbns.net/presentations/papers/MCItraffic.ps. There was some pushback from Joe Wood (Accretive Networks) who suggests that 20% is high based on his OC-3 ATM into the AADS NAP (used up to 135Mbps at times), but all agree that the type of the traffic determines where an ISP lies in the 11-20% ATM cell tax range.
Peering Bandwidth down from 120 Mbps down to 90 Mbps.
The Peering Breakeven Point with this ATM IX is 88Mbps; if an ISP doesn’t send at least 88 Mbps to the ATM IX, it is less expensive to purchase transit. Under the best conditions, the peering pipe fills to the 75% (90Mbps) point yielding a Minimum Cost of Traffic Exchange at the ATM peering point of $122/Mbps, that is only slightly below the cost of transit ($125 /Mbps). This is the very narrow range where ATM Peering makes sense, that is, where peering across the ATM-IX is less expensive than transit.
Peering at Fast Ethernet IX/OC-3. Since most Ethernet-based IXes are operated neutrally (i.e. not by a carrier) an open market of local loop providers keep the peering circuit costs relatively low. Over the past four years we have seen OC-3 transport costs drop from $11,400/month to $2500/month or less24. In our model we found the full retail price for Rack Space and a FastE port is $2500/month. To determine the configuration and cost of Routers we looked at the used market and new market for equipment, and determined that an ISP could reasonably choose between a new Juniper M2025 on eBay for $15,000, a used Cisco 7200 for $890026, or a new Juniper M5 for $36,00027. For the financial models, we round the estimate to $18,000, and applied a straight line depreciation to allocate these costs over the useful life of 36 months28, to realize a monthly equipment cost of about $500/month29. (If an ISP wishes to use new equipment
24 In 1998, Interconnection Strategies for ISPs quoted bandwidth
for OC-3 within a region for peering at $11,400/month.
25 This M20 included a gigabit Ethernet port, 4-port OC-3 and 4-port DS-3. This is more than we need but does highlight the availability and relatively low cost of the equipment on the used market. Peter Moyer (Juniper) points out that these prices don’t include support or software. Source: eBay August 21, 2002 item #2046273370
26 Source: Dan Golding who has purchased many of these routers from the used market for his lab
27 This round number estimate is based on a new M5 with 256M RAM, a 4-port FastE and 2 port OC-3 card including SW and Support, which is not included for the used equipment price. Source: Peter Moyer (Juniper)
28 Common practice in the ISP segment is to use 36 months, although some use 24 months and one cash-rich content company used 18 months for these calculations.
29 Lots of variables here including interest rates, deposits, support contracts, software licenses may be required for used equipment, etc. These quotes are round numbers for discussion purposes only.
DRAFT Do ATM-based Internet Exchange Points Make Sense Anymore? V1.7 W. B. Norton
5 Comments to the Author Welcome
Last Update: 2/10/2010 <[email protected]>
(i.e. the M5 price quote), simply double the monthly equipment costs to $1000/month30.) The peering calculations shown in the spreadsheet below31.
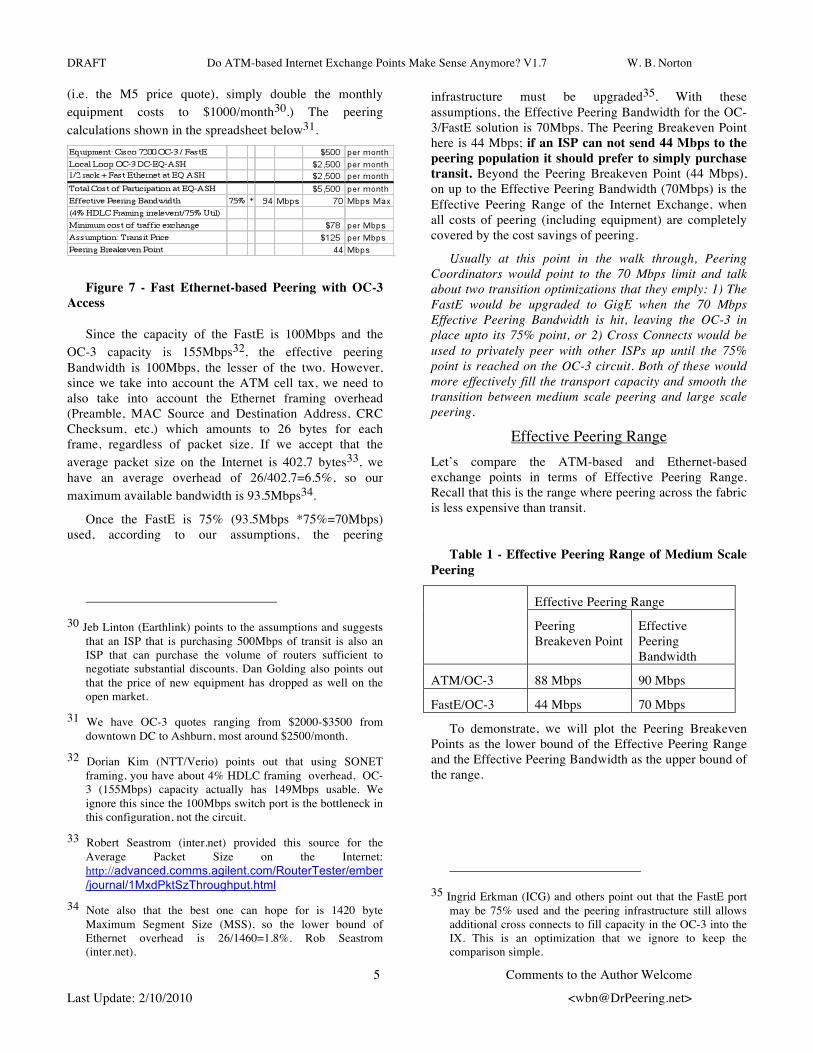
Figure 7 - Fast Ethernet-based Peering with OC-3 Access
Since the capacity of the FastE is 100Mbps and the OC-3 capacity is 155Mbps32, the effective peering Bandwidth is 100Mbps, the lesser of the two. However, since we take into account the ATM cell tax, we need to also take into account the Ethernet framing overhead (Preamble, MAC Source and Destination Address, CRC Checksum, etc.) which amounts to 26 bytes for each frame, regardless of packet size. If we accept that the average packet size on the Internet is 402.7 bytes33, we have an average overhead of 26/402.7=6.5%, so our maximum available bandwidth is 93.5Mbps34.
Once the FastE is 75% (93.5Mbps *75%=70Mbps) used, according to our assumptions, the peering
30 Jeb Linton (Earthlink) points to the assumptions and suggests
that an ISP that is purchasing 500Mbps of transit is also an ISP that can purchase the volume of routers sufficient to negotiate substantial discounts. Dan Golding also points out that the price of new equipment has dropped as well on the open market.
31 We have OC-3 quotes ranging from $2000-$3500 from downtown DC to Ashburn, most around $2500/month.
32 Dorian Kim (NTT/Verio) points out that using SONET framing, you have about 4% HDLC framing overhead, OC-3 (155Mbps) capacity actually has 149Mbps usable. We ignore this since the 100Mbps switch port is the bottleneck in this configuration, not the circuit.
33 Robert Seastrom (inter.net) provided this source for the Average Packet Size on the Internet: http://advanced.comms.agilent.com/RouterTester/ember/journal/1MxdPktSzThroughput.html
34 Note also that the best one can hope for is 1420 byte Maximum Segment Size (MSS), so the lower bound of Ethernet overhead is 26/1460=1.8%. Rob Seastrom (inter.net).
infrastructure must be upgraded35. With these assumptions, the Effective Peering Bandwidth for the OC-3/FastE solution is 70Mbps. The Peering Breakeven Point here is 44 Mbps; if an ISP can not send 44 Mbps to the peering population it should prefer to simply purchase transit. Beyond the Peering Breakeven Point (44 Mbps), on up to the Effective Peering Bandwidth (70Mbps) is the Effective Peering Range of the Internet Exchange, when all costs of peering (including equipment) are completely covered by the cost savings of peering.
Usually at this point in the walk through, Peering Coordinators would point to the 70 Mbps limit and talk about two transition optimizations that they emply: 1) The FastE would be upgraded to GigE when the 70 Mbps Effective Peering Bandwidth is hit, leaving the OC-3 in place upto its 75% point, or 2) Cross Connects would be used to privately peer with other ISPs up until the 75% point is reached on the OC-3 circuit. Both of these would more effectively fill the transport capacity and smooth the transition between medium scale peering and large scale peering.
Effective Peering Range Let’s compare the ATM-based and Ethernet-based exchange points in terms of Effective Peering Range. Recall that this is the range where peering across the fabric is less expensive than transit.
Table 1 - Effective Peering Range of Medium Scale Peering
Effective Peering Range
Peering Breakeven Point
Effective Peering Bandwidth
ATM/OC-3 88 Mbps 90 Mbps
FastE/OC-3 44 Mbps 70 Mbps
To demonstrate, we will plot the Peering Breakeven Points as the lower bound of the Effective Peering Range and the Effective Peering Bandwidth as the upper bound of the range.
35 Ingrid Erkman (ICG) and others point out that the FastE port
may be 75% used and the peering infrastructure still allows additional cross connects to fill capacity in the OC-3 into the IX. This is an optimization that we ignore to keep the comparison simple.

DRAFT Do ATM-based Internet Exchange Points Make Sense Anymore? V1.7 W. B. Norton
6 Comments to the Author Welcome
Last Update: 2/10/2010 <[email protected]>
Figure 8 - Effective Peering Range Diagram
Here we can quickly see that the breakeven point is substantially lower for Fast Ethernet-based peering and that the Effective Peering Range is broader for Fast Ethernet-based peering as well. The Effective Peering Range is critical for capacity planning purposes, for building business plans for peering infrastructure; if a Peering Coordinator keeps traffic within the Effective Peering Range, peering will always be less than transit.
The ATM IX has an extremely narrow Effective Peering Range (88 Mbps-90 Mbps), and has a higher Peering Breakeven Point (88 Mbps) so is harder to justify when an Ethernet-based IX is in the region. We observe that lower transport prices, lower transit prices and relatively higher ATM IX costs have conspired to lead ISPs to prefer using the Fast Ethernet-based IX as a more cost effective peering solution. Transit can play a key role here too, providing access to those routes unavailable at the Ethernet-based IX. Together, Ethernet-based Peering with low cost transit combine to provide a lower cost traffic exchange solution than the ATM-based IX.
To sum up the comparison between OC-3/ATM and OC-3/Fast IXes, consider the Peering vs. Transit graph for both of these solutions in the graph below. The lower cost of peering allows the FastE exchange to always yield a lower unit price for traffic exchange compared with the ATM equivalent.
Figure 9 - ATM/OC3 and FastE/OC-3 Peering vs.
Transit
Large Scale Peering. As the ISP traffic grows past the Effective Peering Bandwidth36, the peering interconnection must be upgraded. Since this ISP now is expecting to peer with hundreds of mbps of traffic, we assume that they are purchasing transit at substantial volume discount, $100 /Mbps37.
Peering with ATM/OC-12. Upgrading the ATM peering from OC-3 (155Mbps) to OC-12 (622Mbps) involves upgrading the circuit and the ATM Port to OC-12. The ATM cell tax brings the total available bandwidth from 622Mbps down to 500Mbps38, and applying our link utilization policy of 75% Effective Peering Bandwidth, we see a total available peering capacity is 375 Mbps. The Price Quotes and Peering Analysis are shown below.
Figure 10 - OC-12 ATM-based Peering Analysis
36 Peering Coordinators track Peering Infrastructure Utilization
very closely in order to predict when to upgrade. Transport has taken several months to years to provision and equipment may also be a gating factor in deployment.
37 Here again, this is an aggressive but not uncommon transit price quote in August 2002, assuming a commitment of 800 Mbps.
38 Based on empirical evidence from Todd Branning and Kevin Epperson (Level 3), verified by Dave McGaugh (ELI) who ran an OC-12 ATM at capacity for a short period of time, seeing the packet loss first hand at about 500Mbps.

DRAFT Do ATM-based Internet Exchange Points Make Sense Anymore? V1.7 W. B. Norton
7 Comments to the Author Welcome
Last Update: 2/10/2010 <[email protected]>
With a participation price of $26,000/month and the Effective Peering Bandwidth of 375Mbps, the Minimum Cost for Traffic Exchange is $69/Mbps, once again, just below the price of transit ($100 /Mbps) as shown in the Peering Tradeoff graph below.
Figure 11 - ATM/OC-12 and GigE/OC-12 Peering
vs. Transit
The Peering Breakeven Point is 260 Mbps, showing that the ATM solution requires a substantial amount of traffic exchange to offset the cost of peering. If an ISP does not expect to send at least 260 Mbps to the OC-12 ATM IX, it should prefer transit.
Peering with GigE/OC-12. Let’s assume that the FastE (100Mbps) switch port is upgraded to a Gigabit Ethernet (1000Mbps) switch port and will be accompanied by a circuit upgrade to OC-12 (622Mbps)39. The equipment for large scale peering replaces the medium scale peering equipment40. For this configuration we found on eBay a Juniper M4041 for $35,000, a new Juniper M5 for about $54,00042, and a new Cisco 730043
39 An optimized transition might occur here, where an ISP
upgrades the FastE port to a GigE, while keeping the circuit at OC-3. After the OC-3 gets to the Effective Peering Utilization, the circuit is then upgraded. For simplicity we’ll assume that both are upgraded at the same time.
40 For simplicity sake we assume the lease term is up on the medium scale peering equipment.
41 This used M40 includes Management card, 3 GigE ports, 4 DS-3 ports, 4 OC-3 ports and 2 power supplies. Source: eBay August 22, 2002 item #2046524403
42 Source: Peter Moyer (Juniper) estimates a 1 Port GigE and 1 Port OC-12 M5 with 256M RAM would cost about $58,000. We expect a negotiated price might be closer to our round number estimate of $54,000, which divides nicely into 36 months as $1500/month. With all of these costs, please adjust them to your circumstances using the financial models in the appendix.
at about $54,000. With some negotiation and the used quote in hand, we expect an ISP could straight-line depreciate this equipment over its 36 month life, resulting in about $1500/month44 in equipment costs.
Since the OC-12 is now the gating factor we must consider the OC-12 transport overhead. According to Dorian Kim (NTT/Verio), the HDLC overhead is estimated to be 4%. After applying the 4% HDLC overhead the 622Mbps capacity circuit has 597Mbps usable, and applying the 75% utilization rule, the Effective Peering Bandwidth of this peering infrastructure is 448 Mbps45. At this point the Minimum Cost for Traffic Exchange is $26 /Mbps, substantially less expensive than the $100 /Mbps transit fee. The Price Quotes and Peering Analysis are shown below46.
Figure 12 - OC-12 Gigabit Ethernet-based Peering Analysis
Note again that the open market for transport and lower cost for the Ethernet-based peering infrastructure leads to a total cost of peering (including equipment) that is less than
43 New Cisco 7300 with 2 Gigabit Ethernet Cards and an OC-12
card is priced at $54,000. Source: Andre Gironda.
44 Assuming 36-month rental or 36-month amortization period. Once again we are using these price points as approximations for discussion purposes only. Note that there will likely be vendor discounts and the used market, if you can find what you need, may be less expensive.
45 Continuing our 75% utilization policy. Interesting side note: the London Internet Exchange (LINX) notifies GigE port customers when they exceed 650Mbps on a port, and encourages them to add additional ports.
46 Price quotes obtained from a large international ISP and are for demonstration purposes. Dave McGaugh (ELI) and John Hardie (Equinix) have recent OC-12 transport quotes for less than $5000/mo with a two-year commit. Here we should apply the 4% HDLC overhead which brings the 622Mbps down to 597Mbps usable.

DRAFT Do ATM-based Internet Exchange Points Make Sense Anymore? V1.7 W. B. Norton
8 Comments to the Author Welcome
Last Update: 2/10/2010 <[email protected]>
half that of the ATM equivalent47. This leads to a Peering Breakeven Point of 115 Mbps, giving the GigE/OC-12 solution an Effective Peering Range of 115 Mbps-448 Mbps. All peering costs (including equipment costs) are completely covered by the cost savings of peering when peering traffic reaches 115 Mbps. It is here where the Effective Peering Range is very illustrative (see below).
Table 2 - Effective Peering Range for Large Scale Peering
Effective Peering Range
Peering Breakeven Point
Effective Peering Bandwidth
ATM/OC-12 260 Mbps 375 Mbps
GigE/OC-12 115 Mbps 448 Mbps
To sum up we compare the Effective Peering Range for each of these four peering solutions presented in this paper in the diagram below.
Figure 13 - Effective Peering Range of ATM and
Ethernet Solutions
The Ethernet-based IX, under both medium and large scale peering scenarios, makes sense over a much broader range than the ATM-equivalent, and does so with a lower Peering Breakeven Point. The cost of the Ethernet-based solution is always less expensive. There is a more damning (and hidden) problem with the ATM-based IX solution
47 Note also that the collocation environment is a richer
interconnection environment, allowing Private Peering at capacities limited only by the speed of the interface cards on either side. The ATM-IX can not effectively scale beyond OC-12 according to Paul Vixie; an ATM-OC-48 card costs upward of $250,000 as compared with OC-48 POS card estimated at $40,000.
that the Effective Peering Range diagram highlights: The Effective Peering Range Gap.
Effective Peering Range Gap The OC-3/ATM solution is effective (preferable over transit) from the 88Mbps to 90Mbps range, however we run into problem as we upgrade the capacity into the ATM fabric from OC-3 to OC-12, a hidden problem called the Effective Peering Range (EPR) Gap.
The EPR Gap is the gap between peering capacity points where the unit cost for peering exceeds the cost of transit. The larger the EPR Gap, the higher traffic exchange costs.
To demonstrate, consider an ISP that is utilizing 90Mbps of traffic of the OC-3 ATM IX and is upgrading to an OC-12 ATM connection. According to our analysis, peering with the OC-12 ATM solution requires 260 Mbps just to break even! The EPR Gap is (260 Mbps - 90 Mbps = 170 Mbps), during which time the cost of traffic exchange in peering relationships exceeds the cost of transit.
Figure 14 - Effective Peering Range Gap
The EPR Gap exists for the Ethernet-based solution as well, but the gap is much smaller (115 Mbps - 70 Mbps = 45 Mbps). The implication is that Ethernet-based peering includes a much smoother economic transition from FastE (100Mbps) to Gigabit Ethernet (1000Mbps), a critical point for those focused on cost effective traffic exchange.
Summary We applied market prices to a Peering Financial Analysis of both ATM and Ethernet-based Internet Exchanges to answer the question: “Do ATM-based Internet Exchange Points Make Sense Anymore?”
From a strictly financial perspective, ISPs should always prefer an Ethernet-based IX solution over an ATM-based solution, assuming that both exist in a region, and given

DRAFT Do ATM-based Internet Exchange Points Make Sense Anymore? V1.7 W. B. Norton
9 Comments to the Author Welcome
Last Update: 2/10/2010 <[email protected]>
today’s market prices. Applying the Peering Financial Models to ATM and Ethernet-based exchange point solutions, we see a very narrow range where ATM peering makes sense, that is, where an ISP can exchange traffic at the IX for less money than purchasing transit. Under the same conditions, Fast and Gigabit Ethernet-based peering is more cost effective over a much broader Effective Peering Range.
Three major factors contribute to this effect.
First, the cost of ATM switching technology is still relatively high while Ethernet technology prices continue to drop. This leads to lower port fees at Ethernet-based IXes.
Second, the cost of circuits into an ATM fabric are generally restricted to the ATM operator circuits. The lack of competition leads to higher prices for the access circuits.
Third, the price of transit has dropped disproportionately to the cost of ATM peering. Since the Peering Costs for Ports and Transport are generally higher for the ATM solution, the unit costs, the Peering Breakeven Point, the Effective Peering Range are all affected negatively.
We introduced the notion of “Effect Peering Range”, starting from the “Peering Breakeven Point” reaching to the “Effective Peering Bandwidth”. The Effect Peering Range demonstrates when Peering makes sense as opposed to transit.
Author’s Notes About 150 copies of this paper have been
disseminated48, and during the process of walking ISPs through the logic of this paper, collecting data points, etc. I noticed five reasons ISPs gave for continuing to peer across at the ATM IXes:
1. Mathematics: "We haven't run the numbers like this yet. Didn't realize the unit costs here." This was the most common response.
2. Performance: "I need to peer with this ISP regardless of the cost of that peering traffic."
3. Contract Term: "We are in the middle of an n-year contract so we are stuck with these economics." (This ISP lost a peering session when the target ISP left the ATM-IX, and is now left with only a small fraction of their peering traffic to justify their peering. Moral: Before signing up with any IX, Make sure your target peers are not planning on moving
48 Different versions were produced as feedback was
incorporated into the drafts.
out!)
4. Perception: "To be a 'player' you have to be at xxx-IX."
5. Let sleeping dogs lie: "If I ask my peer to change the peering session in any way, for example move to another IX, I fear they will use the opportunity to force us to re-qualify for peering.”
For International ISPs, the difficulty in setting up peering in a foreign country (fact finding, negotiation, circuit and install scheduling, etc.) was enough of a headache that they said it would require great pain for them to change from ATM IXes to some place else.
Most folks said that they were glad someone had done the rigorous analysis, that they had come to the same conclusion, and that they knew that today’s ATM-IX is DOA from a Business Case standpoint. A number of folks said the analysis was eye opening/scary, highlighting a very concerning upgrade path on the ATM side. A few folks said that the equipment costs must be included (which are now in place). A couple of Peering Coordinators expressed concern that this analysis points out that Peering doesn’t always make sense.
One detailed discussion with Jeb Linton (EarthLink) pointed out a comparative disparity: in general, Transit is measured on the 95th percentile, yet this paper speaks to upgrading and costing the Peering infrastructure when the average utilization reaches 75%. We define the Minimum Cost of Traffic Exchange using this 75% EFB average utilization figure, but the unit cost of that traffic exchange, at the 95th percentile measure, is lower. Jeb proposed removing the 75% upgrade policy and uniformly applying the 95th percentile measure for each solution, which he calculates will yield a wider Effective Peering Range for each solution.
Acknowledgements As with each of the Peering White Papers, this paper is based upon conversations with many folks in the Internet Operations Community. For this white paper I’d like to thank a few folks in particular for their review, insights, and comments on this paper: Dorian Kim (NTT/Verio), Ingrid Erkman (ICG), Dave McGaugh (ELI), Eric T. Bell (Time Warner Telecom), Chris Parker (StarNet), Lane Patterson, Jay Adelson, Morgan Snyder, and John Hardie (Equinix), David Diaz (BellSouth), Joe Wood (Accretive Networks), Robert Seastrom (inter.net), Kevin Epperson (Level3), Petri Helenius (FICIX), Scott Sheppard (BellSouth), Ralph Doncaster (iStop.com), Leo Bicknell (ufp.org), Paul Vixie (vix.com), Ian Somerton and Dave Wodelet (Shaw/BigPipe), Tony Hain (Cisco), Jeff S. Wheeler (five-elements.com), Cliff Hafen, Dory Liefer, Shannon Lake (Omnivergent), Nenad Trifunovic

DRAFT Do ATM-based Internet Exchange Points Make Sense Anymore? V1.7 W. B. Norton
10 Comments to the Author Welcome
Last Update: 2/10/2010 <[email protected]>
(WorldCom), Andre Gironda (eBay), Jeb Linton (EarthLink), Daniel Golding (SockEye), Peter Moyer (Juniper), Louis Lee (Equinix), Waqar Khan (Qwest), Andrew Odlyzko (UMN), Gary Blankenship (Foundry), and others that preferred no recognition for their contributions to this paper.
About the Author
Mr. Norton’s title is Co-Founder and Chief Technical
Liaison for Equinix. In his current role, Mr. Norton focuses on research on large-scale interconnection and peering research, and in particular scaling Internet operations using optical networking. He has published and presented his research white papers (“Interconnections Strategies for ISPs”, “Internet Service Providers and Peering”, “A Business Case for Peering”, “The Art of Peering: The Peering Playbook”, “The Peering Simulation Game”, “Do ATM-based Internet Exchange Points Make Sense Anymore?”) in a variety of international operations and research forums.
From October 1987 to September 1998, Mr. Norton served in a variety of staff and managerial roles at Merit Network, Inc., including directing national and international network research and operations activities, and chairing the North American Network Operators Group (NANOG) Internet industry forum. Mr. Norton received a B.A. in computer Science and an M.B.A. from the Michigan Business School, and has been an active member of the Internet Engineering Task Force for the past 15 years.
About the White Paper Series - Network Operations Documents (NODs)
The Network Operations Documents (NODs) identify a critical but undocumented area of Internet Operations. We research that area with the Operations Community to document the area definitions, motivations, strategies, etc. The initial drafts are reviewed in “walk throughs”, where Internet Operators provide their views, their data points, their criticisms, and their experience. These are credited in the Acknowledgements section and footnoted where
appropriate for the next walk throughs. After enough walk throughs, the responses tend to migrate from constructive feedback to nods of acceptance, at which time a draft to is made available to the broader Internet Operations community. The papers are never “done” but rather are considered living documents, evolving with input from the community, hopefully reflecting the current practices in the previously undocumented area. Here are the NODs available from the author:
1. Interconnection Strategies for ISPs documents two dominant methods ISPs use to interconnect their networks. Over 200 ISPs helped create this white paper to identify when Internet Exchange Points make sense and the Direct Circuit interconnect method makes sense. Financial Models included in the paper quantify the tradeoffs between these two methods. All relevant data points are footnoted as to source.
2. Internet Service Providers and Peering answers the questions: “What is Peering and Transit? What are the motivations for Peering? What is the ISP Peering Coordinators Process for obtaining peering? What are criteria for IX selection?”
3. A Business Case for Peering builds upon the previous white papers but focuses on the questions important to the Chief Financial Officer: “When does Peering make sense from a financial standpoint? When do all the costs of Peering get completely offset by the cost savings?”
4. The Art of Peering: The Peering Playbook builds on the previous white papers by asking the Peering Coordinators to share the “Tricks of the Trade”, methods of getting peering where otherwise they might not be able to get peering. These 19 tactics range from the straight forward to the obscure, from the clever to the borderline unethical. Nonetheless, Peering Coordinators might be interested in field-proven effective ways of obtaining peering in this highly controversial white paper.
5. The Peering Simulation Game finishes up my half day Peering Tutorial by engaging the audience in the role of the Peering Coordinator. Each ISP in turn rolls the dice, expands their network, collects revenue for each square of customer traffic, and pays transit fees to their upstream ISP. They quickly learn that if they peer with each other, the costs of traffic exchange are much less, but they need to negotiate how to cover the costs of the interconnect. ISP Peering coordinators have commented on how close the peering simulation game is to reality in terms of the dialog that takes place.
6. Do ATM-based Internet Exchange Points Make Sense Anymore? Applies the “Business Case for Peering” financial models to ATM and Ethernet-based

DRAFT Do ATM-based Internet Exchange Points Make Sense Anymore? V1.7 W. B. Norton
11 Comments to the Author Welcome
Last Update: 2/10/2010 <[email protected]>
IXes using current market prices for transit, transport, and IX Peering Costs.

DRAFT Do ATM-based Internet Exchange Points Make Sense Anymore? V1.7 W. B. Norton
12 Comments to the Author Welcome
Last Update: 2/10/2010 <[email protected]>
Appendix A – Peering Breakeven Analysis Data Points

DRAFT Do ATM-based Internet Exchange Points Make Sense Anymore? V1.7 W. B. Norton
13 Comments to the Author Welcome
Last Update: 2/10/2010 <[email protected]>
Appendix B – Peering Breakeven Analysis ATM/OC-3 vs FastE/OC-3

DRAFT Do ATM-based Internet Exchange Points Make Sense Anymore? V1.7 W. B. Norton
14 Comments to the Author Welcome
Last Update: 2/10/2010 <[email protected]>
Appendix C – Peering Breakeven Analysis ATM/OC-12 vs. GigE/OC-12

DRAFT Do ATM-based Internet Exchange Points Make Sense Anymore? V1.7 W. B. Norton
15 Comments to the Author Welcome
Last Update: 2/10/2010 <[email protected]>
Appendix D – Graphs when Transit is $150/Mbps->$125/Mbps
In this appendix we run the Peering Models demonstrating Peering at OC-3, where an ISP is expected to also be purchasing a large volume of transit (500Mbps) at an average transit price of $150/Mbps.
Next we assume an OC-12 transport into an ATM and
Gigabit Ethernet IXes, assuming volume transit prices are obtainable at $125/Mbps. Raw data points are shown in Appendix E.
The ISPs we spoke with helped recalibrate the models with their recent price quotes using Tier 1 ISP transit price points: $125Mbps to $100Mbps.

DRAFT Do ATM-based Internet Exchange Points Make Sense Anymore? V1.7 W. B. Norton
16 Comments to the Author Welcome
Last Update: 2/10/2010 <[email protected]>
Appendix E – Peering Model data when transit is $150/Mbps

DRAFT Do ATM-based Internet Exchange Points Make Sense Anymore? V1.7 W. B. Norton
17 Comments to the Author Welcome
Last Update: 2/10/2010 <[email protected]>
Appendix F – Religious Arguments This paper focused primarily on the financial aspects of
peering on ATM and Ethernet based Internet Exchanges. There were however several technical arguments that may be of interest to the reader regarding the applicability of Ethernet or ATM to the Internet Exchange. I will try and characterize these two viewpoints as I heard them.
ATM Advocate: First off, make sure you mention that
ATM solves the key problem with “Broadcast Domain Internet Exchanges”. Broadcast Domain Issues refers to problems when all ISP attachments are on the same Ethernet segment. Broadcast storms and other anomalies caused by one attached customer can adversely affects all others. Ethernet-based IX operators try and solve this problem administratively with MOUs Memorandum of Understanding (see the Appendix of the http://www.linx.net/joining/mou.thtml for an example of this) but it is solved in ATM by the private nature of PVCs, yielding a more stable peering infrastructure.
Ethernet Advocate: Ethernet-based IXes can address
these “Broadcast Domain” issues technically via private VLANs and direct cross connects between members. The “nature” of ATM as you describe it has a high overhead associated with it, specifically, by statically allocating bandwidth to a peering session with a historically spiky cyclical traffic characteristic. This static allocation of bandwidth prevents the multiplexing benefits of aggregation of lots of peering traffic sources.
In addition to Ethernet-IXes being generally less expensive than ATM-based IXes, Ethernet interfaces are generally less expensive. This reduces the total peering costs, breakeven points, and increases the attractiveness of the Ethernet-based IX and therefore its likelihood of succeeding.
Finally, Ethernet is what ISPs know, it is what they love. This ubiquity of and familiarity with Ethernet reduces the costs of operation, since operations folks only need to know how the Ethernet stuff works.
ATM Advocate: Most Ethernet-based IXes primarily
use the default LAN and are therefore subject to the “Broadcast Domain” issues.
Ethernet may be less expensive but it is not shaping the traffic as ATM does. You pay for that functionality and stability.
As for the operations argument, naturally one
technology is easier to support than multiple technologies. This isn’t a specific fault of ATM or Ethernet but rather and indication that choosing one and sticking with one is advantageous.
Ethernet Advocate: In the Ethernet-based IX model, private cross connects allow one to scale beyond OC-12, the maximum reasonable capacity of ATM. The OC-48 ATM cards cost $250K, making it unreasonably expensive for the exchange of Internet Peering traffic.
At the same time, the Ethernet-based model allows collocated folks to interconnect at Gigabit Ethernet, 10-GigE, whatever the peers choose. These direct connects are typically not allowed (for policy reasons) to occur at collocated ATM IXes.