DO ADS INFLUENCE EDITORS? ADVERTISING AND BIAS IN THE FINANCIAL MEDIA
29
DO ADS INFLUENCE EDITORS? ADVERTISING AND BIAS IN THE FINANCIAL MEDIA † Jonathan Reuter and Eric Zitzewitz Quarterly Journal of Economics (forthcoming) Current Draft: August 2005 Abstract The independence of editorial content from advertisers’ influence is a cornerstone of journalistic ethics. We test whether this independence is observed in practice. We find that mutual fund recommendations are correlated with past advertising in three personal finance publications but not in two national news- papers. Our tests control for numerous fund characteristics, total advertising expenditures, and past mentions. While positive mentions significantly increase fund inflows, they do not successfully predict returns. Future returns are similar for the funds we predict would have been mentioned in the absence of bias, suggesting that the cost of advertising bias to readers is small. † The authors would like to thank Susan Athey, George Baker, Brad Barber, David Beim, Jeremy Bulow, John Chalmers, Diane Del Guercio, Alexander Dyck, Ray Fisman, Kenneth Fuller, Ronald Gilson, Shane Greenstein, Ro Gutierrez, Larry Harris, Chris Mayer, Cynthia Montgomery, Wayne Mikkelson, Theodore Miller, David Musto, Megan Partch, Avri Ravid, John Rea, Nancy Rose, Greg Spears, Joel Waldfogel, David Yoffie, Steve Zeldes, four anonymous referees, Edward Glaeser (the editor), and seminar participants at the Columbia Graduate School of Business, Harvard Business School, the U.S. Securities and Exchange Commission, Stanford, University of California at Berkeley, University of Oregon, the second annual International Industrial Organization Conference, the 2004 Wharton Conference on Household Financial Decision-Making and Portfolio Choice, and the 2004 NBER Industrial Organization Summer Institute for helpful suggestions and comments. Caroline Baylon provided excellent research assistance. Any remaining errors are our own.
Transcript of DO ADS INFLUENCE EDITORS? ADVERTISING AND BIAS IN THE FINANCIAL MEDIA

DO ADS INFLUENCE EDITORS?
ADVERTISING AND BIAS IN THE FINANCIAL MEDIA†
Jonathan Reuter and Eric Zitzewitz
Quarterly Journal of Economics (forthcoming)
Current Draft: August 2005
Abstract
The independence of editorial content from advertisers’ influence is a cornerstone of journalistic ethics.We test whether this independence is observed in practice. We find that mutual fund recommendationsare correlated with past advertising in three personal finance publications but not in two national news-papers. Our tests control for numerous fund characteristics, total advertising expenditures, and pastmentions. While positive mentions significantly increase fund inflows, they do not successfully predictreturns. Future returns are similar for the funds we predict would have been mentioned in the absenceof bias, suggesting that the cost of advertising bias to readers is small.
†The authors would like to thank Susan Athey, George Baker, Brad Barber, David Beim, Jeremy Bulow, John Chalmers,Diane Del Guercio, Alexander Dyck, Ray Fisman, Kenneth Fuller, Ronald Gilson, Shane Greenstein, Ro Gutierrez, Larry Harris,Chris Mayer, Cynthia Montgomery, Wayne Mikkelson, Theodore Miller, David Musto, Megan Partch, Avri Ravid, John Rea,Nancy Rose, Greg Spears, Joel Waldfogel, David Yoffie, Steve Zeldes, four anonymous referees, Edward Glaeser (the editor), andseminar participants at the Columbia Graduate School of Business, Harvard Business School, the U.S. Securities and ExchangeCommission, Stanford, University of California at Berkeley, University of Oregon, the second annual International IndustrialOrganization Conference, the 2004 Wharton Conference on Household Financial Decision-Making and Portfolio Choice, andthe 2004 NBER Industrial Organization Summer Institute for helpful suggestions and comments. Caroline Baylon providedexcellent research assistance. Any remaining errors are our own.

I. Introduction
Recently, there has been considerable interest in political media bias (Groseclose and Milyo [2004],
Baron [2005], and Mullainathan and Shleifer [2005]). There is also growing interest in whether the media
biases its content to benefit advertisers.1 For their part, media outlets tend to strongly deny that such
a pro-adviser bias exists. For example, a 1996 article in Kiplinger’s Personal Finance printed statements
from editors at a number of personal finance publications (including the three in our study) claiming that
advertisers have no influence over published content.2 Despite the important role that the media plays
in generating and disseminating information to consumers and investors, we are aware of few systematic
attempts to test the accuracy of these claims.3
In this paper, we test for advertising bias within the financial media. Specifically, we study mutual
fund recommendations published between January 1997 and December 2002 in five of the top six recipients of
mutual fund advertising dollars. Controlling for observable fund characteristics and total family advertising
expenditures, we document a positive correlation between a family’s lagged advertising expenditures and
the probability that its funds are recommended in each of the personal finance publications in our sample
(Money Magazine, Kiplinger’s Personal Finance, and SmartMoney). While we consider several alternative
explanations below, the robustness of the correlation leads us to conclude that the most plausible explanation
is the causal one, namely, that personal finance publications bias their recommendations—either consciously
or subconsciously—to favor advertisers. In contrast, we find no such correlation between advertising and
content in either national newspaper (the New York Times and Wall Street Journal).
1For example, Baker [1994] and Hamilton [2004] both argue that the media biases its content to benefit advertisers, andEllman and Germano [2005] model this bias as arising from advertisers committing to punish publications that run negativestories. A related bias is posited by Dyck and Zingales [2003], who document a positive correlation between the way earningsannouncements are reported in a press release and the way they are reported in the media and argue that the correlation isconsistent with reporters biasing articles in exchange for access to private information.
2Goldberg, Steven, “Do the ads tempt the editors? (influence of mutual fund advertising on personal finance publicationeditors),” Kiplinger’s Personal Finance, May 1996. The article was written in response to an earlier article in Fortune accusingForbes of “turning downbeat stories into upbeat stories in order to keep advertisers happy—even at the risk of misleading theirown readers.”
3One exception is Reuter [2002], who asks whether advertising biases wine ratings. We briefly discuss his findings below.Another exception is Miller [2004], who examines a sample of firms that the SEC found guilty of accounting fraud and findsthat the media is no less likely to break stories about firms in the 15 industries with the highest propensity to advertise, butacknowledges that the use of industry-level advertising data may reduce the power of this test. More generally, our work relatesto other studies of correlations between expert opinion and business interests. For example, Lin and McNichols [1998] andMichaely and Womack [1999] find that sell-side analysts’ buy and sell recommendations favor the companies with which theiremployers do investment banking business. Zitzewitz [2005] finds that figure skating judges are nationalistically biased and“sell” bias to colleagues by engaging in vote trading.
1

Mutual funds recommendations are a good laboratory in which to test for advertising bias. Product
recommendations are a form of content that advertisers might expect to benefit most from biasing. Mutual
funds are numerous and because they are financial assets their ex-ante and ex-post quality is relatively
easy to observe. The availability of detailed data on funds’ objective characteristics helps us control for
differences in schools of thought about product quality in a way that would be difficult in other settings.
For example, suppose we found that GM advertised more and received better reviews than Toyota in Muscle
Cars. Here one might conclude that Muscle Cars simply likes muscle cars, and GM advertises there to
reach its readers.4 With mutual funds, differences in schools of thought about fund selection are largely over
the relative importance of variables we observe in our data, such as past returns and expenses. What we
interpret as possible evidence of bias is when, controlling for these and other factors, a publication is more
likely to recommend funds from the mutual fund families that have advertised the most within its pages.
For mutual fund families to benefit from biased recommendations, at least some set of investors must
rely upon them. Therefore, after testing for bias, we examine the impact that the mentions in our sample have
on fund flows. controlling for past media mentions and a variety of fund characteristics, a single additional
positive media mention for a fund is associated with inflows ranging from 7 to 15 percent of its assets over
the following 12 months. While investors appear to respond to the media mentions, we find that the media
mentions have little ability to predict future returns. Interestingly, this is not due to the pro-advertiser bias.
When we predict which funds would have been mentioned in the absence of bias, we find little difference
in future returns. However, we do find that the personal finance publications would perform significantly
better by simply recommending funds with the lowest expense ratios in their investment objectives.
It is a puzzle why readers respond to recommendations that do not predict future returns. Conditional
on their behavior, however, publications selecting funds to mention from the large number available have
a valuable set of favors to bestow. In deciding whether to reward an advertiser, publications trade off the
benefits (encouraging future advertising) with the costs (harming one’s reputation by mentioning a lower-
quality fund). When there is a wide selection of advertisers’ funds to recommend, the cost of advertising bias
4Reuter [2002] finds that advertisers in Wine Spectator receive slightly higher ratings than non-advertisers, controlling forratings in Wine Advocate, which does not accept advertising. While Wine Spectator claims to use blind tastings to rate wines—aclaim intended to increase reader confidence in the ratings—approximately half of the ratings difference is associated with theselective retasting of advertisers’ wines. The rest of the rating difference may, in fact, be due to different schools of thoughtabout how to rate wines.
2

may not be that large, especially if one does not internalize the reputational spillover to ones peers. This is
precisely why the journalism profession developed an ethical sanction against advertising bias, because the
returns to favoring advertisers might otherwise be high.
II. Data
Our tests for advertising bias require data on advertising expenditures, media mentions, and mutual
fund characteristics. Data on monthly mutual fund advertising expenditures by publication and fund family
were purchased from Competitive Media Research (CMR).5 According to these data, the mutual fund in-
dustry’s annual advertising expenditures averaged approximately $307 million during our 1996-2002 sample
period, with $80 million (26%) going to national newspapers and $119 million (39%) going to consumer
magazines.
The publications we study include five of the six top recipients of mutual fund advertising between 1998
and 2002: the Wall Street Journal ($48.5 million per year), Money ($22.1 million), New York Times ($14.0
million), Kiplinger’s Personal Finance ($12.2 million), and SmartMoney ($8.7 million). (We attempted to
gather media mentions for Mutual Funds ($14.0 million) but were unable to access its content electronically.)
In total, the publications in our sample account for approximately 45 percent of the mutual fund industry’s
advertising expenditures. Naturally, mutual fund advertising is a more important source of revenue for the
personal finance publications than the national newspapers. Whereas mutual fund advertising accounts for
3.8 percent of advertising revenues at the Wall Street Journal and 1.1 percent at the New York Times, it
accounts for 15 percent at Money, 16 percent at SmartMoney, and 28 percent at Kiplinger’s. We also gather
media mentions from Consumer Reports, which does not accept advertising.
The media mention data vary across publications and are summarized in Table I. Since these data had
to be hand collected, for several publications we restrict attention to particular articles or columns. For the
New York Times, we track funds mentioned in a column from the Sunday Business section titled “Investing
With.” The column spotlights a particular fund, interviewing fund managers and providing details such
5For print publications, CMR tracks the size of each advertisment and estimates a dollar cost for the advertisement basedon the publication’s quoted advertising rates and any likely discount. Comparing CMR’s estimates of total print advertisingrevenue for the New York Times and Wall Street Journal to figures reported in the parent companies’ 10K filings, the CMRestimates often differ from the actual revenues by less than 10 percent.
3

as past returns, expense ratios, and the fund family’s contact information. For Money, we focus on the
composition of the Money 100 list, a list of recommended mutual funds published once a year between 1998
and 2002. Similarly, for Consumer Reports we focus on articles listing recommended equity funds, bond
funds, or both. For each of these publications, we classify the mutual fund mentions as positive.
Since Kiplinger’s Personal Finance and SmartMoney do not publish lists of recommended funds anal-
ogous to the Money 100 list, for these two publications we analyze every article containing the word “fund.”
For articles that focus on mutual funds (rather than mention them in passing), we classify the article as
making recommendations across investment objectives, within a particular investment objective, or within
a particular mutual fund family. We also classify each mutual fund mention as positive or negative. As
suggested by the representative article titles reported in Table I, this rarely involved close judgment calls.
When we could not determine whether a mention was positive or negative, we dropped the mention from our
sample; we did this for 8 of the 783 mentions in Kiplinger’s and 16 of the 2,417 mentions in SmartMoney.
Finally, for the Wall Street Journal, we focus on a daily column titled “Fund Track,” that mentions funds
either because they are the subject of news (such as manager turnover) or because their managers are being
quoted on an issue. In the (pre-scandal) time period we study, being quoted on an issue in the Wall Street
Journal is presumably positive exposure for the manager’s fund. However, since “Fund Track” rarely rec-
ommends a course of action for fund investors, mentions in the Wall Street Journal are potentially different
from mentions in the other publications we study. At a minimum, mentions in the Wall Street Journal can
be viewed as proxies for the news coverage of specific funds.
Data on U.S. mutual fund returns and characteristics come from CRSP. The unit of observation is
fund i in month t and the sample period is January 1996 through December 2002.6 Table II reports summary
statistics for the full sample of mutual funds and for funds receiving mentions from a given publication in
month t.7 Univariate comparisons indicate that funds receiving positive media mentions tend to be larger,
6Our sample includes all domestic equity funds, international equity funds, hybrid funds (which invest in debt and equity),and bond funds, but excludes money market funds because they are rarely mentioned in the publications we study. For mutualfunds with multiple share classes, we calculate fund-level returns, inflows, and other characteristics, and include one observationper fund per month in our sample. Also, since we merge the media mention data with the CRSP Survivor-Bias Free US MutualFund Database using ticker, our sample is limited to funds for which we were able to locate a ticker for at least one share class.
7Because magazines are typically available on the newsstand in the month prior to the month stated on their cover, we codementions in the month t + 1 issue of Money, Kiplinger’s, SmartMoney, and Consumer Reports as occurring in month t. Forexample, we code mentions in the June 1998 issue of Money as occurring in May 1998. In contrast, mentions in a June 1998issue of the Wall Street Journal or New York Times are coded as occurring in June 1998.
4

come from larger fund families, and have higher returns and inflows over the prior 12 months than their
peers. They are less likely to charge investors a sales commission (load), but their expense ratios are roughly
comparable. Relative to the actual distribution of mutual funds across investment objectives, mentions in
the publications we study focus disproportionately on general domestic equity funds.
Funds receiving positive mentions belong to families that spend a greater percentage of family assets
on both print and non-print advertising and, since these families are larger, spend much more than average
in absolute terms. Interestingly, the sample of funds recommended by Consumer Reports also come from
families that spend an above-average amount on advertising. This suggests that advertising may be corre-
lated with characteristics that are unobservable to the econometrician but that the financial media uses to
rank funds. Consequently, our tests for advertising bias control for fund families’ general level of advertis-
ing. Examining the share of print advertising by publication reveals that funds receiving mentions from a
publication tend to come from families with higher than average levels of advertising in that publication.
III. Does Advertising Influence the Media?
A. Motivation and Empirical Framework
To motivate our tests for advertising bias, consider the mutual funds that appear on Money magazine’s
annual Money 100 list during our sample period. In an average year, 83.8 percent of families that spent
more than $1 million on advertising in Money over the prior 12 months are mentioned on the Money 100
list at least once. In contrast, only 7.2 percent of families that did not advertise in Money over the prior 12
months are mentioned. This difference partially reflects the fact that heavy advertisers tend to manage more
mutual funds than non-advertisers. However, an individual fund from a heavy advertiser is more than twice
as likely to be included on the Money 100 list as an individual fund from a non-advertiser (3.0 percent versus
1.3 percent). This difference is consistent with pro-advertiser bias, but obviously does not control for any
of the mutual fund or mutual fund family characteristics that might lead publications to rank one mutual
fund over another. In particular, one might worry that “high quality” mutual funds are both more likely to
advertise and more likely to receive positive media mentions [Milgrom and Roberts, 1986]. To address this
concern, we turn to multivariate tests for advertising bias.
5

Our general approach is to ask whether lagged publication-level advertising expenditures are correlated
with the probability of receiving a media mention, controlling for all of the mutual fund and mutual fund
family characteristics that publications might reasonably use to rank funds. Consider predicting positive
mentions in a particular publication using the following specification:
Mentioni,t = α + γ(Own-Publication Advertisingi,t−1) + βZi,t−1 + δk,t + εi,t, (1)
where Mentioni,t equals one if fund i receives a positive mention in the publication in month t and zero
otherwise, Own-Publication Advertising i,t−1 measures lagged advertising expenditures in the publication by
fund i’s family, Zi,t−1 contains numerous control variables, δk,t is an investment objective-by-month fixed
effect, and εi,t is a fund-by-month disturbance term. To test whether advertising and content are related,
we estimate equation (1) and test whether γ̂ is statistically different from zero. The identifying assumption
required to give this test a causal interpretation is that advertising within a publication be uncorrelated
with any unobserved fund characteristics that would cause its readers to want the publication to mention
the advertiser’s fund. For products whose quality is partially or totally subjective, the fact that advertising
is endogenous would lead us to seriously question this assumption. However, in the context of mutual
funds, where ex post product quality is objective and easily quantified, we believe the assumption may be
reasonable.
From a financial perspective, mutual fund investors should seek to maximize risk-adjusted returns on
an after-expense basis. Therefore, within each investment objective, publications should seek to identify
those funds with the highest expected future returns and the lowest expenses. Since Carhart [1997] finds
low fund expenses to be a good predictor of future returns, we control for fund i’s lagged expense ratio. As
other potential predictors of future returns, we include fund i’s log return over the prior twelve months, its
lagged log return squared, and its Morningstar rating at the end of the prior calendar year.8
In addition to predictors of future returns, publications should also focus on the form of distribution
8Mutual funds with multiple share classes can earn a different Morningstar rating for each share class. Therefore, to controlfor Morningstar rating we begin with five dummy variables that indicate whether one or more of fund i’s share classes earneda Morningstar rating of one, two, three, four, or five stars. We then scale each dummy variable by the fraction of dollars undermanagement receiving each rating.
6

that most appeals to their readers. For example, to the extent that personal finance publications appeal to
investors who prefer to purchase direct-marketed funds rather than employ a broker and pay a load, these
publications should be more likely to recommend no-load funds. Since families of no-load funds should then
be more likely to advertise in the personal finance publications, Z includes a dummy variable indicating
whether fund i charges a load; it also includes the level of fund i’s 12b-1 (marketing and distribution) fee.
As additional measures of potential investor interest in fund i, we include log dollars under management
within both fund i and the fund family to which it belongs, log net inflows into fund i over the prior twelve
months, and the number of mentions in each of the other publications in our sample over the prior twelve
months. Since mutual fund families that advertise may differ systematically from those that do not—either
because advertisers have systematically higher expected future returns or because investors are more likely
to value reviews of funds from families they learned about through advertising—Z also includes total print
and non-print advertising expenditures by fund i’s family over the prior 12 months.
B. Testing for Advertising Bias
In Table III, we estimate equation (1) separately for each type of media mention. For example, the dependent
variable in the column titled “SmartMoney Positive” equals one if we coded fund i as receiving a positive
mention in SmartMoney in month t and zero otherwise. Estimation is via logit and includes a separate
fixed effect for each investment objective-by-month combination. The number of observations in this column
reflects the number of mutual funds each month with the same investment objectives as those receiving a
positive mention in SmartMoney.9 The explanatory variable of interest is advertising expenditures by fund i’s
family within SmartMoney over the prior 12 months, which we refer to as “own-publication advertising”
expenditures. Standard errors are reported below the coefficients and cluster on mutual fund family [Moulton
1990].
Looking across the columns in Table III, the coefficents on own-publication advertising are positive and
9Because funds with investment objectives that are not mentioned in the publication in month t are excluded from theestimation, our tests for advertising bias effectively condition on the investment objectives that publications choose to focus oneach issue and ask, within these investment objectives, whether advertising expenditures influence which funds are mentioned.Since we observe advertising expenditures at the mutual fund family level and many families offer funds that span the set ofinvestment objectives, we have insufficient statistical power to test whether the choice of investment objectives favors advertisers.
7

statistically significant at the 1-percent level for positive mentions in all three personal finance publications.10
The coefficients are also economically significant. For Money, the marginal effect of $1 million in family
advertising expenditure is to increase the probability a of positive mention for each of its funds by 0.2%
compared with a predicted probability (at sample means) of 0.5%. For Kiplinger’s, those probabilities are
0.1% and 0.08%, respectively, and for SmartMoney they are 0.2% and 0.2%. Put differently, variation in
own-publication advertising has more explanatory power for positive mentions in each of the personal finance
publications than variation in fund expenses, and about the same explanatory power as past returns.
As another way of gauging the economic significance of our findings, we use the coefficients reported
in Table III to predict the set of funds we would expect each publications to mention, first including the
influence of own-publication advertising and then excluding it. For example, if SmartMoney mentioned 10
aggressive growth funds favorably in month t, we treat the 10 aggressive growth funds with the highest
predicted values based on our estimates of equation (1) as predicted mentions that include the influence
of own-publication advertising. We then repeat this exercise, setting the coefficient on own-publication
advertising equal to zero. For the Money 100 list, the overlap in the two sets of predicted mentions is 91.5%,
suggesting that 8-9 funds were replaced on the list by advertisers’ funds that had otherwise just missed the
cutoff. For positive mentions in Kiplinger’s and SmartMoney, the overlap is 77.0% and 77.9%, respectively.
In contrast to the results for the personal finance publications, the coefficient on own-publication adver-
tising is a precisely estimated zero for the Wall Street Journal and negative, but statistically indistinguishable
from zero, for the New York Times. Since the three personal finance publications receive between a much
larger share of their advertising revenues from mutual funds than the newspapers, our findings are consistent
with advertising expenditures influencing fund rankings in those publications relatively more dependent on
mutual fund advertising. Of course, for Wall Street Journal, the lack of a statistically significant correlation
between advertising and mentions could also reflect that mentions in the “Fund Track” column are a mixture
of positive and negative, and driven primarily by news.
With respect to negative mentions, advertising bias predicts that γ will be negative, making publica-
tions less likely to include advertisers’ funds in negative mentions. Here, evidence of bias is weaker. For
10The correlations between advertising and content reported in Tables III and IV are robust to the inclusion of additionalfund characteristics, such as fund age, manager turnover, and the standard deviation of fund returns over the prior 36 months.
8

negative mentions in Kiplinger’s, the coefficient on own-publication advertising is negative but statistically
indistinguishable from zero; for negative mentions in SmartMoney, the coefficient is also negative and statis-
tically insignificant, but quite close to zero. Nevertheless, for both publications, we can reject the hypothesis
that the marginal effects of own-publication advertising are equal for positive and negative mentions (at
the 5-percent level). This fact casts doubt on one alternative explanation for our findings. Namely, if past
advertising in a publication directly increases reader demand for information on advertiser’s funds, we would
expect advertising to predict more positive mentions and more negative mentions. However in Table III, we
find evidence that advertising expenditures increase positive mentions more than negative mentions.
Before exploring the robustness of our main results, several of the coefficients on the control variables
deserve mention. First, counter to our expectations, few of the coefficients on the total print and non-print
advertising expenditure variables are statistically significant. The fact that the coefficients on total print
advertising expenditures are positive for both types of negative mentions, suggests that Kiplinger’s and
SmartMoney may be responding to subscriber demand for negative reviews on funds they’ve seen advertised
in general (rather than specifically in Kiplinger’s or SmartMoney). Second, the probability of receiving both
positive and negative mentions is increasing in the size of fund i and decreasing in the size of its family.
Third, the probability of receiving both positive and negative mentions is increasing in the level of the
fund i’s expense ratio for every publication except Consumer Reports. Fourth, funds experiencing inflows,
good returns, and (though not reported) favorable Morningstar ratings over the prior 12 months are more
likely to receive positive mentions, while outflows and low returns and ratings are associated with negative
mentions. Fifth, with the exception of the New York Times, the probability of receiving a positive mention
is lower for load funds than for no-load funds.11
11As discussed above, load fund families are less likely to advertise in publications catering to do-it-yourself investors, andthese publications are less likely to mention their funds. Including a load dummy variables controls for this effect, but as anadditional robustness check, we restrict our sample to no-load funds and re-estimate equation (1) for mentions in the threepersonal finance publications. For positive mentions, the estimated coefficients on own-publication advertising are uniformlylarger than those reported in Table III, and statistically significant at the 1-percent level. For negative mentions, both coefficientsremain negative but statistically indistinguishable from zero.
9
C. Robustness
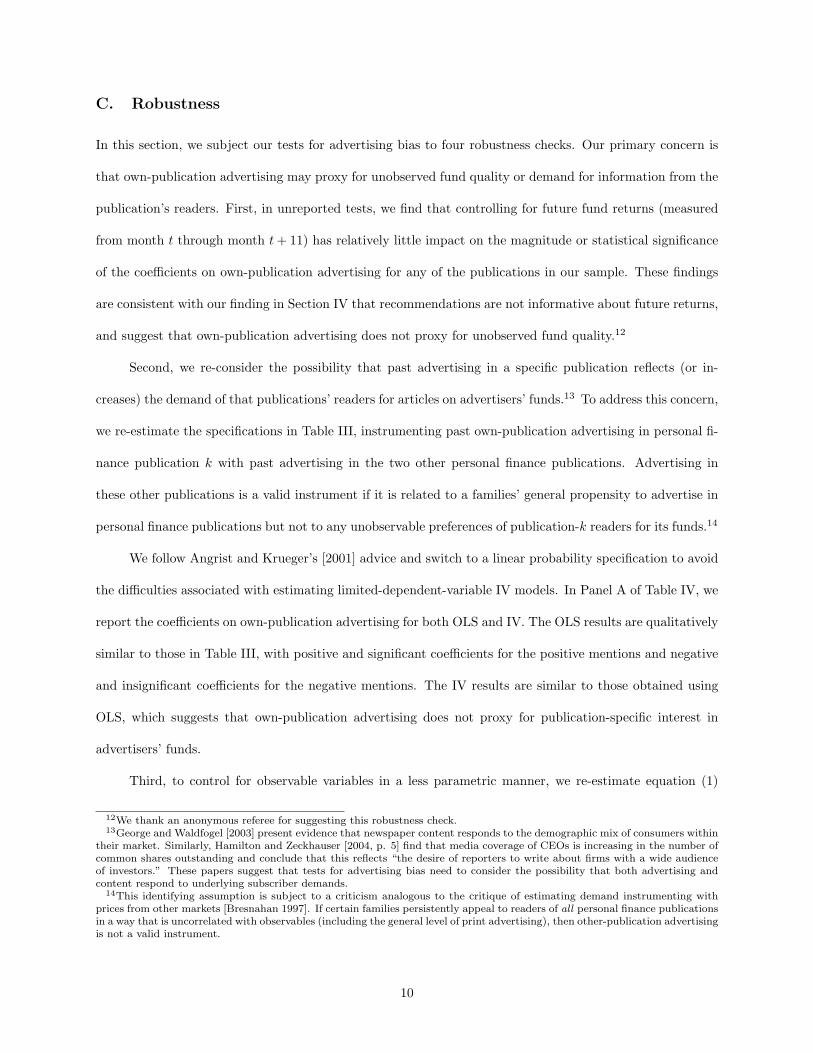
In this section, we subject our tests for advertising bias to four robustness checks. Our primary concern is
that own-publication advertising may proxy for unobserved fund quality or demand for information from the
publication’s readers. First, in unreported tests, we find that controlling for future fund returns (measured
from month t through month t + 11) has relatively little impact on the magnitude or statistical significance
of the coefficients on own-publication advertising for any of the publications in our sample. These findings
are consistent with our finding in Section IV that recommendations are not informative about future returns,
and suggest that own-publication advertising does not proxy for unobserved fund quality.12
Second, we re-consider the possibility that past advertising in a specific publication reflects (or in-
creases) the demand of that publications’ readers for articles on advertisers’ funds.13 To address this concern,
we re-estimate the specifications in Table III, instrumenting past own-publication advertising in personal fi-
nance publication k with past advertising in the two other personal finance publications. Advertising in
these other publications is a valid instrument if it is related to a families’ general propensity to advertise in
personal finance publications but not to any unobservable preferences of publication-k readers for its funds.14
We follow Angrist and Krueger’s [2001] advice and switch to a linear probability specification to avoid
the difficulties associated with estimating limited-dependent-variable IV models. In Panel A of Table IV, we
report the coefficients on own-publication advertising for both OLS and IV. The OLS results are qualitatively
similar to those in Table III, with positive and significant coefficients for the positive mentions and negative
and insignificant coefficients for the negative mentions. The IV results are similar to those obtained using
OLS, which suggests that own-publication advertising does not proxy for publication-specific interest in
advertisers’ funds.
Third, to control for observable variables in a less parametric manner, we re-estimate equation (1)
12We thank an anonymous referee for suggesting this robustness check.13George and Waldfogel [2003] present evidence that newspaper content responds to the demographic mix of consumers within
their market. Similarly, Hamilton and Zeckhauser [2004, p. 5] find that media coverage of CEOs is increasing in the number ofcommon shares outstanding and conclude that this reflects “the desire of reporters to write about firms with a wide audienceof investors.” These papers suggest that tests for advertising bias need to consider the possibility that both advertising andcontent respond to underlying subscriber demands.
14This identifying assumption is subject to a criticism analogous to the critique of estimating demand instrumenting withprices from other markets [Bresnahan 1997]. If certain families persistently appeal to readers of all personal finance publicationsin a way that is uncorrelated with observables (including the general level of print advertising), then other-publication advertisingis not a valid instrument.
10

on matched samples. For each publication, we match funds from families that advertised over the prior 12
months to non-advertiser funds with approximately the same propensity to be mentioned (based on predicted
values from equation (1) when we set the coefficient on own-publication advertising to zero). In unreported
tests, the coefficients on own-publication advertising are economically and statistically significant for positive
mentions in all three personal finance publications.
Fourth, we attempt to control for any long-run affinity of a publication’s readers for a particular fund
family by analyzing changes in advertiser status. We classify a family as starting to advertise in publication k
in month t if the family has positive advertising expenditures in the publication in month t but not in months
t − 5 through t − 1. Similarly, we classify a family as stopping advertising in publication k in month t if
the family has positive advertising expenditures in month t− 5 but not in months t− 4 to t. In unreported
tests, we find that families that start advertising in Money in the six months prior to the Money 100 list are
more likely to appear on the list than families that do not start advertising.15 Similarly, we find evidence
that families that start advertising in SmartMoney in month t are more likely to receive positive mentions in
SmartMoney over the following six months relative to families that do not advertise. Finally, we find weak
evidence (at the 20-percent level in a two-sided test) that families that stop advertising in Kiplinger’s are
less likely to receive positive mentions over the following six months.
Overall, our findings are consistent with own-publication advertising expenditures influencing fund
rankings at the three personal finance publications in our sample. Without purely exogenous variation in
advertising, we cannot entirely eliminate the possibility that the correlations we observe are being driven
by the endogeneity of advertising. However, based on the robustness of the positive correlation between
own-publication advertising and content for the personal finance publications—and the absence of a positive
correlation for the newspapers, which receive considerably less advertising revenues from mutual funds and
otherwise serve as a falsification test—we believe that the most likely explanation is the causal one.
15As an alternative robustness test suggested by an anonymous referee, we examined whether Money receives a dispropor-tionate share of mutual fund print advertising in the months preceeding the publication of the Money 100, as one might expectif adverters were attempting to influence its composition. We find that Money receives 8.9% of advertising in the three monthsprior to the publication of the list, 11.7% in the publication month, and 7.7% in the three months after. The difference betweenthe pre and post-list window is statistically significant and robust to window lengths of 1, 2, and 4 months, or to the inclusionof month fixed effects (that we can identify since the month the list is published varies from year to year).
11

IV. Does Advertising’s Influence on Content Matter?
A. Do Investors Respond to Media Mentions?
Studies on the determinants of flows into U.S. mutual funds typically focus on the relation between measures
of past performance and other characteristics and future inflows (see, for example, Ippolito [1992] and
Chevalier and Ellison [1997]). However, as Sirri and Tufano [1998] argue, it is costly for investors to gather
and process information on the universe of available funds, suggesting that the media may play an important
role in disseminating this information. Consistent with investors having lower search costs for mutual funds
they have been exposed to through the media, Sirri and Tufano find that mutual funds receiving more
media attention receive correspondingly higher inflows. Similarly, Jain and Wu [2000], Cronqvist [2004],
and Gallagher, Kaniel, and Starks [2005] provide evidence that mutual fund flows respond to fund-level and
family-level advertising, while Del Guercio and Tkac [2005] provide evidence that flows respond to changes in
Morningstar ratings. Collectively, these papers suggest that investors rely on both advertising and the media
when deciding which mutual funds to buy. Since media mentions are only valuable to mutual fund families
to the extent that they influence investor behavior, in this section, we ask whether the media mentions we
study have a significant impact on mutual fund inflows.
In Table V, we estimate the impact of media mentions on fund inflows using Fama-MacBeth [1973] style
regressions. Each month between January 1997 and December 2001, we estimate a separate cross-sectional
regression. We then report the time-series means and standard errors associated with these cross-sectional
estimates. Our dependent variable measures net inflows into fund i between months t and t+11. The number
of media mentions that fund i receives in month t−1 is measured separately for positive and negative mentions
in each publication. To test whether family-level advertising expenditures are systematically related to fund-
level inflows, we include advertising expenditures on print and non-print media over the prior twelve months,
normalized by the average dollars under management within the fund family over this period. In addition
to the fund characteristics used to predict media mentions in Table III, we also control for the raw return
of fund i between months t and t + 11. Finally, we include fixed effects for each investment objective within
each monthly cross-sectional regression.
12

Since the control variables are highly persistent, we estimate their standard errors from the time-series
of estimated coefficients via Newey-West [1987] and allow 12 monthly lags. Since media mentions within
a publication are not persistent across months, and since for many of the media mentions we are unable
to estimate a coefficient for each of the 60 months, we estimate the standard errors for the media mention
variables via White [1980]. (When we estimate standard errors for mentions in the Wall Street Journal and
positive mentions in SmartMoney via Newey-West with 12 lags, they are quantitatively quite similar to those
reported in Table V.)
Looking across the columns in Table V, we see that media mentions are associated with future flows
in the direction we would expect. The magnitudes are largest in our baseline specification in column (2) and
decline slightly when we control for fund i’s lagged Morningstar rating (column (3)), fund i’s prior media
mentions (column (4)), and the prior media mentions of other funds in fund i’s family (column (5)). Overall,
positive mentions in personal finance publications and Consumer Reports are associated with an economically
significant 7-8 percent increase in fund size over the next 12 months, while a positive mention in the New
York Times is associated with a 15 percent increase. Negative media mentions in both Kiplinger’s and
SmartMoney yield estimated future outflows of 1–2 percent, but neither coefficient is statistically significant.
The estimated coefficients on the control variables are largely consistent with those in the existing
literature. For example, the positive and statistically significant coefficients on past fund returns and past
fund returns squared capture the convex relation between inflows and performance first documented by
Ippolito [1992]. Interestingly, while fund-level inflows are increasing in non-print advertising expenditures,
they do not appear to be increasing in print advertising expenditures; in none of the columns is the coefficient
on the print advertising ratio statistically different from zero. If we interpret the correlations in Tables III
and V causally, this suggests that the returns to print advertising by mutual funds may be coming largely
via biased content.
B. Do Media Mentions Contain Information About Future Returns?
In this section, we compare the future returns of funds receiving media mentions to those of other funds.
The question of interest is whether investors can benefit from buying funds that receive positive mentions
13

and selling (or avoiding) funds that receive negative mentions.
As such, we contribute to a large literature that seeks to predict future mutual fund performance using
lagged fund and fund manager characteristics, and measures of past fund performance. Beginning with
Jensen [1968], this literature generally finds it difficult to identify funds that will persistently outperform
others.16 That said, recent academic research provides some evidence of predictability, suggesting that
full-time industry experts should be able to identify better than average future performers. For example,
funds with the highest expenses persistently underperform funds with low expenses [Elton, Gruber, Das,
Hlavka, 1993]. Chevalier and Ellison [1999] find that some fund manager characteristics are associated
with consistently higher risk-adjusted returns. Carhart [1997] finds some persistence of past performance,
especially of bad past performance, and Kacperczyk, Sialm, and Zheng [2005] find that their ability to predict
underperformance increases if they focus on holdings-adjusted returns (i.e., the difference between actual
returns and the returns of the fund’s initial holdings). Therefore, it is an open question whether the media
mentions in our sample help investors to choose funds with above average future returns.
We begin by calculating the relative return of fund i in month t as its monthly return minus the equal-
weighted average monthly return of funds with the same investment objective. This measure is positive
when fund i outperforms the average fund in its asset class and negative when it does not. For each type of
media mention, we then regress monthly relative returns on a dummy variable that indicates whether fund i
received the specified media mention at least once over the past twelve months. Specifically, for the personal
finance publications and Consumer Reports, which are typically available shortly before the month listed on
their cover, we assume that investors purchase funds on the first trading day of the month the issue is dated
(for example, June 1, 1998 in the case of the first Money 100 list) and sell them on the last trading day
of the month twelve months later (May 31, 1999). For mentions in the Wall Street Journal and New York
Times, which occur throughout the month, we assume that investors purchase funds on the first trading day
of the month after the mention and hold them for twelve months.
In Table VI, we report estimated coefficients for the media mention holding period dummy variables
16For example, Jain and Wu [2000] find little evidence that funds which advertise in Barron’s or Money earn higher futurereturns than non-advertisers, and Blake and Morey [2000] find little evidence that Morningstar ratings help predict future fundperformance.
14

using relative returns from January 1997 through December 2002. Panel A focuses on the full sample of U.S.
mutual funds; the top of Panel B focuses on the sample of domestic equity funds.17 Standard errors cluster
on investment objective and month. Looking across publications, we find that funds mentioned in the New
York Times outperform their peers by 22–33 basis points per month (significant at the 5-percent level), while
funds receiving negative mentions in SmartMoney underperform their peers by 21–36 basis points per month
(significant at the 1-percent level). In other words, based on relative returns, it appears that investors would
have benefited from using positive mentions in the New York Times and negative mentions in SmartMoney to
choose amongst funds. In contrast, for Consumer Reports (which does not accept advertising), the negative
and significant coefficient of -13 basis points per month in Panel B suggests that investors would have earned
higher returns picking domestic equity funds at random. For other publications, the coefficients on the
media mention holding period dummy variables are statistically indistinguishable from zero, implying that
the funds they mention are neither better nor worse than the average fund within each asset class.
Since relative returns ignore possible differences in risk within each investment objective, in the bottom
half of Panel B, we examine the risk-adjusted returns of mentioned funds using portfolio-level returns.
Specifically we adjust returns for correlation with the market (in the “CAPM” specification), as well as for
the the size and book-to-market portfolios of Fama and French [1993] and the momentum portfolio of Carhart
[1997] (in the “Four Factor” specification). Using risk adjusted returns does not affect our conclusion for
negative mentions in Smart Money, but the coefficients for the New York Times and Consumer Reports lose
statistical significance.
To determine whether advertising bias harms investors, Table VII extends the analysis of fund-level
relative returns for positive mentions in the personal finance publications to three sets of predicted mentions.
The first two sets revisit the comparison with and without advertising bias from Section III.B. Comparing the
coefficients in rows (a) and (b), we find that future returns are quite similar across the two sets of predicted
mentions. This suggests that the future returns of mentioned advertisers’ funds are similar to those of funds
we predict would have been mentioned in the absence of any advertising bias. Therefore, it does not appear
17Recall that we exclude money market funds and mutual funds for which CRSP does not report a ticker for at least oneshare class during our sample period. The number of observations is higher than in previous tables because we only requirethat fund i report a return and investment objective in month t.
15

that advertising bias is responsible for the inability of positive mentions to identify funds with above average
future returns.
To test whether investors would benefit from personal finance publications putting more weight on
fund expenses and less weight on other fund characteristics, we consider a third set of predicted mentions
that ranks funds within each investment objective based solely on their expense ratios. In row (c), we see
that these predicted mentions outperformed their equal-weighted peers by a statistically significant margin
for Kiplinger’s and SmartMoney. For Money, the coefficient is negative but close to zero (reflecting the fact
that picking 100 funds in the same month based on expense ratios leads to higher expense ratios than if you
pick 8-9 funds per month). Overall, the failure of the published recommendations to predict returns appears
related not to advertising bias, but to how the publications choose to weight other fund characteristics when
ranking funds.
V. The (Behavioral) Economics of Media Bias
To summarize our results, investors respond to mutual fund recommendations despite the fact that
these recommendations generally fail to predict future returns. Moreover, this failure is not due to advertising
bias, but rather to recommendations overweighting factors such as past returns and Morningstar ratings,
and underweighting expenses. An advantage of this weighting scheme, however, is that it gives publications
a wider selection of funds to recommend, which allows them to more easily accommodate any pro-advertiser
bias. The personal finance publications, who are more dependent on mutual fund advertising (and arguably
have less reputation at stake), exhibit such a bias, while the national newspapers do not.
The greatest puzzle in our results is that investors react to recommendations that are largely uninfor-
mative about future returns. There are at least three possible explanations, but none is fully satisfying. First,
if there are diseconomies of scale in the production of returns, the inflows that follow a mention could drive
down relative fund returns [Berk and Green, 2004]. However, given recent estimates of scale diseconomies in
portfolio management [Chen, Hong, Huang, and Kubik, 2004], the effect of a 7-15 percent inflow on returns
should be quite small. Second, investors may receive entertainment from purchasing recommended funds
along with other magazine readers. Third, some investors may have out-of-equilibrium beliefs about the
16
quality of the recommendations, and you might expect these to be the investors who self-select into reading
and relying on the personal finance publications.
Regardless of its source, investors’ willingness to follow recommendations with little apparent regard
for their quality provides publications with the ability to bestow a favor on someone. When deciding whether
to bestow this favor on a past advertiser, publications must tradeoff the benefits (rewarding past advertisers
and thus encouraging future advertising) with the costs.18 The most obvious cost of recommending the
otherwise less attractive funds of an advertiser is its potential effect on readers’ perceptions about the
magazine’s quality. But there are reasons to suspect that reader learning will be slow. To begin, investors
who have self-selected into reading the personal finance publications are probably the least skeptical about
their value. In addition, returns are noisy. In Table VI, we analyze seven years of data and about 500
recommendations each for Money and Kiplinger’s, and our estimates of the recommended funds’ annualized
relative returns have standard errors of about 1 percent. A typical investor following the performance of
only the recommended funds they invested in would require much more data before drawing any conclusions
about the quality of the recommendations.
Presumably, the more important costs of advertising bias are the ethical costs. Journalists (like aca-
demics) typically earn less money than they could in alternative careers, accepting lower salaries because
they receive utility from providing a public good. For many journalists, consciously biasing coverage in favor
of advertisers would defeat the purpose of being a journalist in the first place. Yet there is probably hetero-
geneity in this distaste for bias, and one might expect journalists with less distaste to sort into publications
where the economic returns to biasing were higher. This might explain why we find such different results for
the national newspapers and the personal finance publications.
Of course, these issues raise the question of the extent to which any bias we document is conscious.19
18Examining the relation between future advertising and past mentions, we find evidence that families that receive positive(negative) mentions in a publication tend to increase (decrease) future advertising in that publication. While consistent withadvertising bias, this tendancy may simply reflect families wanting to reinforce one positive message with another (and notreinforce negative messages). However, we also find evidence that these effects are strongest for families that already advertisein the publication, suggesting that mentioning past advertisers is likely to generate more incremental advertising revenues thanmentioning non-advertisers.
19The line between conscious and unconscious bias may be blurry. For example, a former reporter from one the personalfinance publications in our sample describes a common fund selection procedure as first running database screens and thenselecting which of several eligible funds to include based, in part, on the existence of high-level contacts available for quotation.The reporter noted many large advertisers were fairly proactive about meeting reporters when visiting their offices for businessreasons. In other words, own-publication advertising may proxy for unobserved publication-specific efforts of mutual fundfamilies to establish relationships with their reporters. To the extent that these relationships influence media mentions, they
17

We attempted to determine the mechanism at work by examining how advertiser bias varies by article type
(articles making general fund recommendations, articles about an asset class or investment theme, articles
about a single fund or family). We hypothesized that bias in the latter type of article could be imposed
by an editor or publisher suggesting stories, while bias in the former two types would be more difficult to
impose without reporters’ knowledge. Results were mixed, however. For Kiplinger’s we found the strongest
evidence of bias in single-family articles, but we also found evidence of bias in within-investment-objective
articles, while for SmartMoney we found evidence of bias only in general and within-asset-class articles. We
also tested whether advertising bias increased during the 2001–2002 advertising recession (since mutual fund
advertising declined by 67 percent from 2000 to 2002), perhaps because reporters facing layoffs were more
willing to support efforts to sell adverting. Again the evidence was mixed, we found the strongest evidence
of bias for SmartMoney in 2002, but that evidence of bias in Kiplinger’s and the Money 100 list peaked
during the 1999–2000 boom.
Where we are certain the “bias” is conscious is in the personal finance publications’ emphasis of past
returns over expenses. As one former mutual fund reporter has written: “Mutual fund reporters lead a
secret investing life. By day we write ‘Six Funds to Buy NOW!’ We seem delighted in dangerous sectors
like technology. We appear fascinated with one-week returns. By night, however, we invest in sensible index
funds.”20 The alternative, however, of focusing on low expense funds might make for boring journalism since
the set of low expense funds is relatively stable. It might also depress the returns to advertising, since it
would make investors less responsive to ads for (and media mentions about) high-expense ratio funds. While
we have treated the personal finance publications’ decisions about how to weight fund characteristics as a
potential valid “school of thought,” it might also constitute a form of advertising bias. If we counted it as
such, then our conclusion about advertising bias not harming readers’ returns would change.
VI. Conclusion
We find that the personal finance publications in our sample are more likely to recommend the funds
of their advertisers, even after controlling for the observable fund characteristics that their readers might
clearly generate a pro-advertiser bias. However, whether this bias is conscious or unconscious is unclear.20Anonymous, “Confessions of a Former Mutual Funds Reporter,” Fortune, April 1999.
18

value. Without exogenous variation in advertising, we cannot completely rule out the possibility that the
positive correlations we observe between advertising and content are driven by the endogeneity of advertising.
However, based on the robustness of these correlations for all three personal finance publications—and the
absence of positive correlations for the two national newspapers, which receive much smaller fractions of
their advertising revenues from mutual funds—we believe that the most likely explanation is the causal one.
While positive mentions in these publications significantly increase fund inflows, they do not successfully
predict returns. However, future returns are similar for the funds we predict would have been mentioned in
the absence of bias, suggesting that the cost of advertising bias to readers is small.
Despite the fact that biased mutual fund recommendations may not harm the readers of personal
finance publications, our findings raise questions about the reliability of content in advertiser-supported
media more generally. While ideological media bias has received more popular and academic attention, the
impact of ideological bias is likely to be mitigated by the presence of outlets on both sides of the spectrum
(Dewatripont and Tirole [1999]; Mullainathan and Shleifer [2005]). In contrast, pro-advertiser bias is unlikely
to be offset by anti-advertiser bias. Unfortunately, outside of our carefully chosen setting, many of the most
important questions about advertising bias are extremely difficult to answer.
19

References
[1] Angrist, Josh, and Alan Krueger, “Instrumental Variables and the Search for Identification: FromSupply and Demand to Natural Experiments,” Journal of Economic Perspectives, XV (2001), 69–85.
[2] Baker, C. Edwin, Advertising and a Democratic Press, (Princeton: Princeton University Press, 1994).
[3] Baron, David, “Competing For The Public Through The News Media,” Journal of Economics & Man-agement Strategy, XIV (2005), 339–377.
[4] Blake, Christopher R., and Matthew R. Morey, “Morningstar Ratings and Mutual Fund Performance,”Journal of Financial and Quantitative Analysis, XXXV (2000), 451–483.
[5] Berk, Jonathan B., and Richard C. Green, “Mutual Fund Flows and Performance in Rational Markets,”Journal of Political Economy, CXII (2004), 1269–1295.
[6] Bresnahan, Timothy, “Comment on Valuation of New Goods under Perfect and Imperfect Competition,”in NBER Studies in Income and Wealth Number 58, Timothy Bresnahan and Robert J. Gordon, eds.(Chicago: The University of Chicago Press, 1997).
[7] Carhart, Mark M., “On Persistence in Mutual Fund Performance,” Journal of Finance, LII (1997),57–82.
[8] Chevalier, Judith A., and Glenn Ellison, “Risk-Taking by Mutual Funds as a Response to Incentives,”Journal of Political Economy, CV (1997), 1167–1200.
[9] Chevalier, Judith A., and Glenn Ellison, “Are Some Mutual Fund Managers Better than Others? Cross-sectional Patterns in Behavior and Performance,” Journal of Finance, LIV (1999), 875–899.
[10] Chen, Joseph, Harrison Hong, Ming Huang, and Jeffrey D. Kubik, “Does Fund Size Erode Mutual FundPerformance? The Role of Liquidity and Organization,” American Economic Review, XCIV (2004),1276-1302.
[11] Cronqvist, Henrik, “Advertising and Portfolio Choice,” Working Paper, 2004.
[12] Del Guercio, Diane, and Paula Tkac, 2003, “Star Power: The Effect of Morningstar Ratings on MutualFund Flows,” Working Paper, 2005.
[13] Desai, Hemang, and Prem C. Jain, “An Analysis of the Recommendations of the Superstar MoneyManagers at Barron’s Annual Roundtable,” Journal of Finance, L (1995), 1257–1273.
[14] Dewatripont, Mathias, and Jean Tirole, “Advocates,” Journal of Political Economy, CVII (1999), 1–39.
[15] Dyck, Alexander, and Luigi Zingales, “The Media and Asset Prices,” Working Paper, 2003.
[16] Ellman, Matthew, and Fabrizio Germano, “What Do the Papers Sell?,” Working Paper, 2005.
[17] Elton, Edwin, Martin Gruber, Sanjiv Das, and Matt Hlavka, “Efficiency with Costly Information: AReinterpretation of Evidence from Managed Portfolios,” Review of Financial Studies, VI (1993), 1–22.
[18] Fama, Eugene, and Kenneth French, “Common Risk Factors in the Returns on Stocks and Bonds,”Journal of Financial Economics, XXXIII (1993), 3–56.
[19] Fama, Eugene, and James MacBeth, “Risk, return, and equilibrium: Empirical tests,” Journal ofPolitical Economy, LXXXI (1973), 607–636.
[20] Gallaher, Steven, Ron Kaniel, and Laura Starks, “Madison Avenue Meets Wall Street: Mutual FundFamilies, Competition and Advertising,” Working Paper, 2005.
[21] George, Lisa, and Joel Waldfogel, “Who Affects Whom in Daily Newspaper Markets?” Journal ofPolitical Economy, CXI (2003), 765–784.
20

[22] Groseclose, Tim, and Jeffrey Milyo, “A Measure of Media Bias,” Quarterly Journal of Economics (2004),forthcoming.
[23] Hamilton, James T., All the News That’s Fit to Sell, (Princeton: Princeton University Press, 2004).
[24] Hamilton, James T., and Richard Zeckhauser, “Media Coverage of CEOs: Who? What? Where?When? Why?” Working Paper, 2004.
[25] Ippolito, Richard A., “Consumer Reaction to Measures of Poor Quality: Evidence from the MutualFund Industry,” Journal of Law and Economics, XXXV (1992), 45–70.
[26] Jain, Prem C., and Joanna Shuang Wu, “Truth in Mutual Fund Advertising: Evidence on FuturePerformance and Fund Flows,” Journal of Finance, LV (2000), 937–958.
[27] Jensen, Michael, “The Performance of Mutual Funds in the Period 1945–1964,” Journal of Finance,XXIII (1968), 389–416.
[28] Kacperczyk, Martin, Clement Sialm, and Lu Zheng, “The Unobserved Actions of Mutual Funds,”Working Paper, 2005.
[29] Lin, Hsiou-Wei, and Maureen F. McNichols, “Underwriter Relationships, Analysts Earnings Forecastsand Investment Recommendations,” Journal of Accounting and Economics, XV (1998), 101–127.
[30] Michaely, Roni, and Kent Womack, “Conflict of Interest and the Credibility of Underwriter AnalystRecommendations,” Review of Financial Studies, XII (1999), 653–686.
[31] Milgrom, Paul, and John Roberts, “Price and Advertising Signals of Product Quality,” Journal ofPolitical Economy, XCIV (1986), 796–821.
[32] Miller, Gregory S., “The Press as a Watchdog for Accounting Fraud,” Working Paper, 2004.
[33] Moulton, Brent, “An Illustration of the Pitfalls in Estimating the Effects of Aggregate Variables onMicro Units,” Review of Economics and Statistics, LXXII (1990), 334–338.
[34] Mullainathan, Sendhil, and Andrei Shleifer, “The Market for News,” American Economic Review (2005),forthcoming.
[35] Newey, Whitney, and Kenneth West, “A Simple, Positive Definite, Heteroskedasticity and Autocorre-lation Consistent Covariance Matrix,” Econometrica, LV (1987), 703-708.
[36] Reuter, Jonathan, “Does Advertising Bias Product Reviews? An Analysis of Wine Ratings,” Mas-sachusetts Institute of Technology, Unpublished Dissertation, 2002.
[37] Sirri, Erik, and Peter Tufano, “Costly Search and Mutual Fund Flows,” Journal of Finance, LIII (1998),1589–1622.
[38] White, Halbert, “A Heteroskedasticity-Consistent Covariance Matrix Estimator and a Direct Test forHeteroskedasticity,”Econometrica, XLVIII (1980), 817–830.
[39] Zitzewitz, Eric, “Nationalism in Winter Sports Judging and Its Lessons For Organizational DecisionMaking,” Journal of Economics and Management Strategy (2005), forthcoming.
21

TA
BLE
ISummary
of
Hand-C
ollected
Media
Mentio
nD
ata,1996–2002
Num
ber
Num
ber
of
ofFund
Publica
tion
Art
icle
Type
Conte
nt/
Sam
ple
Tit
leN
atu
reFre
quen
cyA
rtic
les
Men
tions
Wall
Stree
tJourn
al
“Fund
Tra
ck”
colu
mn
Indust
rynew
sand
issu
esN
ews
Daily
1,0
96
3,5
27
New
York
Tim
es“In
ves
ting
Wit
h”
colu
mn
Pro
file
offu
nds
and
manager
sPosi
tive
Wee
kly
201
201
Money
“M
oney
100
Lis
t”R
ecom
men
ded
funds
Posi
tive
Annual
5500
Kip
linge
r’s
All
art
icle
sm
enti
onin
gfu
nds
Vari
es144
783
Gen
eralre
com
men
dations
“B
est
Funds
toB
uy
Now
”Posi
tive
31
295
“H
all
ofSham
e”N
egative
11
63
Within
-ass
et-c
lass
art
icle
s“Six
Ways
toO
wn
the
Worl
d”
Posi
tive
49
300
“T
he
Wild
Bunch
”N
egative
312
Sin
gle
fund/fa
mily
art
icle
s“M
agel
lan’s
Dri
ven
Boss
”Posi
tive
38
69
“Is
ItT
ime
toLea
ve
Magel
lan?”
Neg
ative
12
36
Sm
art
Money
All
art
icle
sm
enti
onin
gfu
nds
Vari
es686
2,4
17
Gen
eralre
com
men
dations
“R
etir
eTen
Yea
rsE
arl
y”
Posi
tive
232
1,0
47
“T
he
Under
ach
iever
sC
lub”
Neg
ative
65
319
Within
-ass
et-c
lass
art
icle
s“Four
Gre
at
Ener
gy
Funds”
Posi
tive
116
453
“It
’sN
ot
Easy
Bei
ng
Gre
en”
Neg
ative
46
188
Sin
gle
fund/fa
mily
art
icle
s“H
ow
Janus
Got
It’s
Gro
ove
Back
”Posi
tive
171
279
“W
hat
isJanus
Thin
kin
g?”
Neg
ative
56
115
Consu
mer
Rep
ort
sM
utu
alfu
nd
revie
wis
sue
Rec
om
men
ded
funds
Posi
tive
Annual
11
812
Med
iam
ention
data
wer
ehand
collec
ted
from
the
Wall
Stree
tJourn
al,
New
York
Tim
es,M
oney
,K
iplinge
r’s,
Sm
art
Money
,and
Consu
mer
Rep
ort
s.D
ata
from
the
Wall
Stree
tJourn
al,
New
York
Tim
es,M
oney
,and
Consu
mer
Rep
ort
sco
me
from
spec
ific,
reocc
uri
ng
art
icle
s;data
from
Kip
linge
r’s
and
Sm
art
Money
com
efr
om
the
univ
erse
ofart
icle
sth
at
focu
son
mutu
alfu
nds.
Ingen
eral,
data
cover
the
per
iod
January
1996
thro
ugh
Dec
ember
2002,although
data
for
Money
and
Consu
mer
Rep
ort
sco
ver
short
erin
terv
als
bec
ause
thei
rm
utu
alfu
nd
art
icle
sappea
rle
ssfr
equen
tly
(as
report
edin
Table
II).
The
num
ber
offu
nd
men
tions
only
counts
the
firs
tm
enti
on
ofea
chm
utu
alfu
nd
within
each
art
icle
.E
ight
ofth
eK
iplinge
r’s
men
tions
and
16
ofth
eSm
art
Money
men
tions
could
not
be
class
ified
as
clea
rly
posi
tive
or
neg
ative.
22

TA
BLE
IISummary
Statis
tic
sfor
Mutual
Funds
Receiv
ing
Media
Mentio
ns,
1996–2002
All
Consu
mer
Sam
ple
:Funds
WSJ
NY
TM
oney
Kip
linge
r’s
Sm
art
Money
Rep
ort
sN
atu
reofM
ention:
New
sPosi
tive
Posi
tive
Posi
tive
Neg
ati
ve
Posi
tive
Neg
ati
ve
Posi
tive
Fund-L
evel
Med
iaM
enti
ons
3,5
27
201
500
664
111
1,7
79
622
812
With
Tic
ker
inC
RSP
2,9
85
185
497
618
106
1,6
94
601
738
With
Tic
ker
and
Lagged
Chara
cter
isti
cs319,0
06
2,6
34
170
474
520
106
1,5
27
542
707
Date
Fir
stM
ention
Collec
ted
Jan-9
6Feb
-96
May-9
8Jan-9
6Jan-9
6Jan-9
6Jan-9
6A
pr-
97
Date
Last
Men
tion
Collec
ted
Dec
-02
Nov-0
2Jul-02
Dec
-02
Nov-0
2N
ov-0
2N
ov-0
2D
ec-0
2
Fund-lev
elch
ara
cter
isti
csLn
Fund
TN
A($
millions)
4.9
06.8
95.8
77.4
86.7
76.1
56.8
76.5
96.7
6Ln
Fam
ily
TN
A($
millions)
8.9
810.0
38.6
79.6
79.2
28.9
59.6
69.7
09.7
2E
xpen
seR
atio
(%)
1.2
91.2
71.3
51.0
71.0
71.8
41.2
01.5
00.9
112b-1
Fee
(%)
0.2
10.1
70.1
80.1
10.0
90.1
20.1
50.1
90.0
2Load
Fund
Dum
my
0.5
50.4
50.4
90.2
80.2
30.3
80.4
10.5
40.1
9Ln
Net
Flo
ws
Over
Pri
or
12
Month
s(%
)11.8
724.0
536.0
121.3
843.4
5-1
4.3
541.2
93.7
722.1
0R
elati
ve
Ret
urn
Over
Pri
or
12
Month
s(%
)-0
.21
12.1
515.3
01.6
88.6
3-1
6.8
417.4
1-1
.33
6.5
2
Fam
ily
Adver
tisi
ng
Expen
diture
sO
ver
Pri
or
12
Month
sD
ivid
edby
Aver
age
Fam
ily
TN
AP
rint
Adver
tisi
ng
Ratio
(basi
spoin
ts)
0.1
10.1
50.1
00.0
90.1
00.1
60.1
80.0
90.1
1N
on-P
rint
Adver
tisi
ng
Ratio
(basi
spoin
ts)
0.0
10.0
20.0
20.0
20.0
10.0
20.0
20.0
20.0
2
Share
ofP
rint
Adver
tisi
ng
by
Publica
tion
(%)
Wall
Stree
tJourn
al
17.4
717.8
714.7
910.9
612.7
220.3
517.6
019.8
920.8
0N
ewYork
Tim
es4.2
83.9
54.4
63.1
73.0
82.1
13.7
24.8
94.3
5M
oney
5.3
08.6
27.0
29.4
48.9
08.7
09.0
97.5
69.2
8K
iplinge
r’s
3.0
64.4
73.1
14.6
75.9
65.2
94.9
03.6
85.5
2Sm
art
Money
2.0
93.4
92.1
63.7
63.5
25.0
84.1
22.9
53.9
1
Share
ofFunds
by
Bro
ad
Ass
etC
lass
(%)
Gen
eralD
om
estic
Equity
40.9
962.7
268.8
273.2
162.1
273.5
859.4
671.2
271.2
9Spec
ialize
dD
om
esti
cE
quity
17.7
917.9
212.3
58.4
411.7
35.6
618.1
415.1
35.8
0In
tern
ati
onal/
Glo
balE
quity
16.0
012.9
116.4
718.3
511.7
39.4
313.8
810.3
313.7
2B
onds
25.2
26.4
52.3
50.0
014.4
211.3
28.5
13.3
29.1
9
This
table
com
pare
sth
ech
ara
cter
istics
ofU
.S.m
utu
alfu
nds
that
rece
ive
med
iam
entions
toa
sam
ple
ofm
utu
alfu
nds
for
whic
hth
eC
RSP
Mutu
alFund
Data
base
report
sall
the
lagged
chara
cter
istics
use
din
our
analy
sis.
We
excl
ude
money
mark
etfu
nds
and
funds
for
whic
hC
RSP
does
not
report
ati
cker
for
at
least
one
share
class
.T
he
unit
of
obse
rvation
isfu
nd
iin
month
t.M
utu
alfu
nd
chara
cter
istics
are
aggre
gate
dacr
oss
share
class
es.
Bec
ause
magazi
nes
are
typic
ally
available
inth
em
onth
pri
or
toth
em
onth
state
don
thei
rco
ver
,w
eco
de
men
tions
inth
em
onth
t+1
issu
eofM
oney
,K
iplinge
r’s,
Sm
art
Money
,orConsu
mer
Rep
ort
sas
occ
urr
ing
inm
onth
t.(F
or
exam
ple
,w
eco
de
the
June
1998
issu
eofM
oney
as
occ
urr
ing
inM
ay
1998.)
We
code
men
tions
inth
eW
all
Stree
tJourn
al
or
New
York
Tim
esin
month
t,as
occ
urr
ing
inm
onth
t.For
men
tions
inm
onth
t,w
ere
port
fund
chara
cter
istics
as
ofm
onth
t-1.
Bec
ause
we
do
not
obse
rve
adver
tisi
ng
expen
diture
sin
1995,th
esu
mm
ary
statist
ics
for
the
lagged
adver
tisi
ng
rati
os
are
report
edfo
rJanuary
1997
thro
ugh
Dec
ember
2002.
The
share
of
pri
nt
adver
tisi
ng
by
publica
tion
isre
port
edfo
rth
esu
bse
tof
funds
bel
ongin
gto
fam
ilie
sw
ith
posi
tive
adver
tisi
ng
expen
diture
sin
one
or
more
publica
tion.
23

TA
BLE
III
Logit
Regress
ions
Predic
tin
gM
edia
Mentio
ns,
1997–2002
Consu
mer
Med
iam
ention
inm
onth
t:W
SJ
NY
TM
oney
Kip
linge
r’s
Sm
art
Money
Rep
ort
sN
atu
reofm
ention:
New
sPosi
tive
Posi
tive
Posi
tive
Neg
ati
ve
Posi
tive
Neg
ative
Posi
tive
Fam
ily-L
evel
Adver
tisi
ng
Expen
dit
ure
sin
Millions
ofD
ollars
(t-1
2to
t-1)
Ow
n-P
ublica
tion
0.0
04
−0.3
61
0.2
94∗∗
∗0.8
19∗∗
∗−
0.2
20
0.7
30∗∗
∗−
0.0
15
(0.0
35)
(0.2
81)
(0.0
88)
(0.2
49)
(0.6
63)
(0.1
36)
(0.2
56)
Tota
lP
rint
0.0
17∗
0.0
17
−0.0
44∗∗
−0.0
04
0.0
70∗∗
∗−
0.0
14
0.0
25∗∗
0.0
26∗
(0.0
09)
(0.0
33)
(0.0
19)
(0.0
13)
(0.0
27)
(0.0
10)
(0.0
12)
(0.0
14)
Tota
lN
on-P
rint
0.0
24
0.0
07
−0.0
45∗∗
−0.0
19∗
−0.0
45
−0.0
15
0.0
29∗∗
0.0
39∗∗
(0.0
15)
(0.0
27)
(0.0
22)
(0.0
11)
(0.0
42)
(0.0
10)
(0.0
13)
(0.0
18)
Ln
Fund
TN
A(t
-1)
0.5
51∗∗
∗0.1
98∗∗
∗1.0
41∗∗
∗0.5
98∗∗
∗0.6
45∗∗
∗0.5
41∗∗
∗0.5
04∗∗
∗0.3
75∗∗
∗
(0.0
36)
(0.0
63)
(0.0
93)
(0.0
80)
(0.1
26)
(0.0
38)
(0.0
53)
(0.0
52)
Ln
Fam
ily
TN
A(t
-1)
−0.0
76
−0.1
38∗∗
∗−
0.3
13∗∗
∗−
0.2
83∗∗
∗−
0.1
74∗∗
−0.1
47∗∗
∗−
0.0
82∗
−0.0
91
(0.0
51)
(0.0
51)
(0.0
61)
(0.0
57)
(0.0
78)
(0.0
56)
(0.0
43)
(0.0
67)
Expen
seR
atio
(t-1
)0.1
53∗∗
∗0.1
70∗∗
∗0.2
91∗∗
∗0.1
72∗∗
∗0.1
56∗∗
∗0.1
46∗∗
∗0.0
96∗∗
∗−
0.0
86
(0.0
24)
(0.0
49)
(0.0
54)
(0.0
38)
(0.0
52)
(0.0
31)
(0.0
16)
(0.2
43)
12b-1
Fee
(t-1
)−
0.3
66
−0.4
85
−1.2
04∗∗
−0.9
50
−1.9
10∗∗
−0.2
30
−0.1
36
−6.1
77∗∗
∗
(0.2
57)
(0.3
37)
(0.5
21)
(0.8
27)
(0.9
34)
(0.3
41)
(0.2
53)
(1.0
37)
Load
Fund
Dum
my
(t-1
)−
0.3
57∗∗
∗0.0
49
−0.8
72∗∗
∗−
0.9
81∗∗
∗−
0.4
86
−0.2
77∗
−0.0
20
−0.6
49∗∗
∗
(0.1
24)
(0.1
73)
(0.2
46)
(0.3
00)
(0.3
14)
(0.1
44)
(0.1
62)
(0.2
56)
Ln
Net
Flo
ws
(t-1
2to
t-1)
0.1
01∗∗
0.2
09∗∗
∗0.1
57∗
0.3
23∗∗
∗−
1.2
53∗∗
∗0.2
93∗∗
∗−
0.3
63
0.4
51∗∗
∗
(0.0
49)
(0.0
87)
(0.0
89)
(0.0
72)
(0.2
71)
(0.0
48)
(0.2
57)
(0.0
88)
Ln
Ret
urn
s(t
-12
tot-
1)
0.5
26∗∗
∗5.4
34∗∗
∗−
0.3
65
2.3
74∗∗
∗−
6.7
78∗∗
∗2.5
12∗∗
∗−
4.4
06∗∗
∗1.7
73∗∗
∗
(0.1
22)
(1.0
26)
(0.3
38)
(0.5
73)
(2.3
84)
(0.4
16)
(0.5
83)
(0.5
83)
Ln
Ret
urn
sSquare
d(t
-12
tot-
1)
1.0
44∗∗
∗−
2.8
01∗∗
∗−
2.7
95∗∗
∗0.1
87
−0.9
68
−0.3
31
−1.4
39∗∗
−1.8
93∗
(0.1
11)
(1.0
87)
(1.0
24)
(0.6
30)
(0.9
15)
(0.4
12)
(0.6
69)
(0.9
88)
Incl
ude
Pri
or
Men
tions
inO
ther
Publica
tions
(t-1
2to
t-1)?
Yes
Yes
Yes
Yes
Yes
Yes
Yes
Yes
Incl
ude
Lagged
Morn
ingst
ar
Rati
ngs?
Yes
Yes
Yes
Yes
Yes
Yes
Yes
Yes
Obje
ctiv
e-by-M
onth
Fix
edE
ffec
ts552
140
33
178
44
420
201
52
Sam
ple
Siz
e197,3
50
71,5
15
13,6
45
74,8
80
20,8
14
154,0
52
79,1
39
19,2
61
Each
colu
mn
report
ses
tim
ate
dco
effici
ents
from
alo
git
regre
ssio
nes
tim
ate
dfo
ra
part
icula
rm
edia
men
tion.
We
incl
ude
ase
para
tefixed
effec
tfo
rea
chin
ves
tmen
tobje
ctiv
eea
chm
onth
.“Ln
Ret
urn
s”(t−
1to
t)is
defi
ned
as
the
natu
rallo
gari
thm
ofone
plu
sth
ere
turn
offu
nd
ibet
wee
nm
onth
st−
1and
t.“Ln
Net
Flo
ws”
(t−
1to
t)is
defi
ned
as
Ln
Fund
TN
A(t
)m
inus
Ln
Fund
TN
A(t−
1)
min
us
Ln
Ret
urn
(t−
1to
t).
Morn
ingst
ar
ratings
from
Dec
ember
ofth
epri
or
yea
rare
use
dto
crea
tefive
dum
my
vari
able
s(c
orr
espondin
gto
ratings
bet
wee
none
and
five
stars
).Sin
ceM
orn
ingst
ar
ratings
are
aw
ard
edat
the
share
class
level
,th
ese
dum
my
vari
able
sare
then
multip
lied
by
the
fract
ion
offu
nd
i’s
dollars
under
managem
ent
that
rece
ive
each
rati
ng.
Sta
ndard
erro
rscl
ust
eron
mutu
alfu
nd
fam
ily
and
are
report
edin
pare
nth
eses
.Sig
nifi
cance
at
the
10-p
erce
nt,
5-p
erce
nt,
and
1-p
erce
nt
level
sare
den
ote
dby
∗,∗∗
,and
∗∗∗.
24
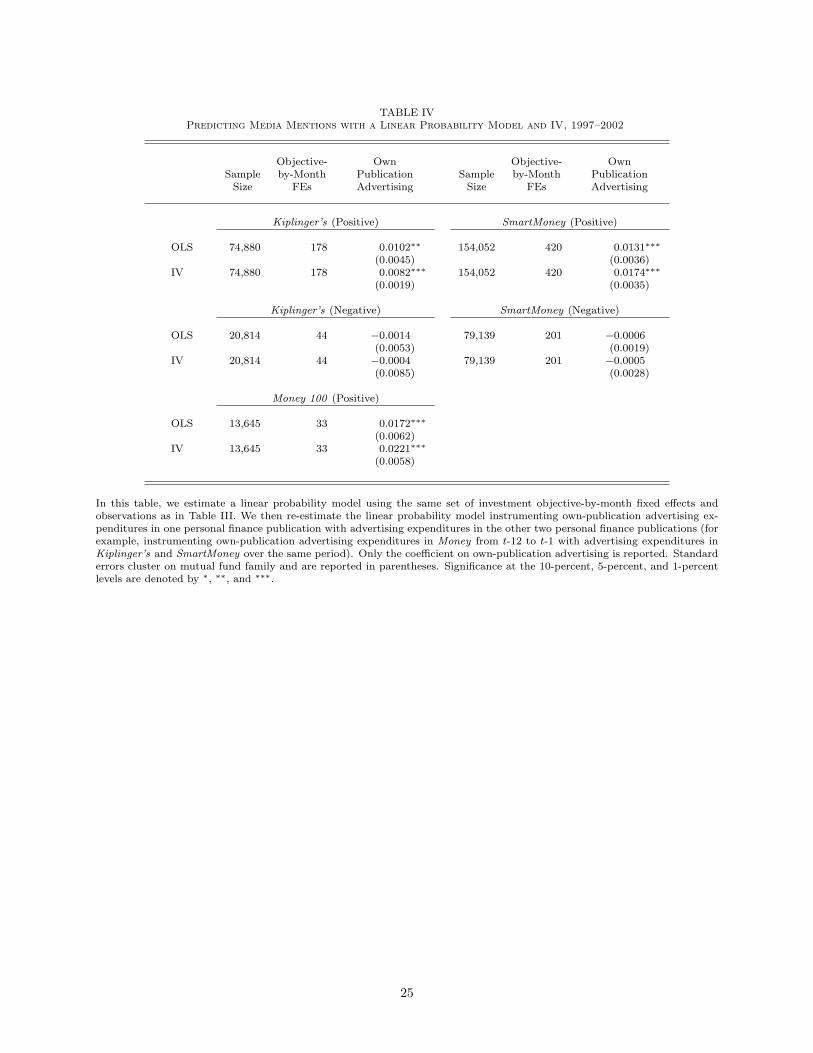
TABLE IVPredicting Media Mentions with a Linear Probability Model and IV, 1997–2002
Objective- Own Objective- OwnSample by-Month Publication Sample by-Month Publication
Size FEs Advertising Size FEs Advertising
Kiplinger’s (Positive) SmartMoney (Positive)
OLS 74,880 178 0.0102∗∗ 154,052 420 0.0131∗∗∗
(0.0045) (0.0036)IV 74,880 178 0.0082∗∗∗ 154,052 420 0.0174∗∗∗
(0.0019) (0.0035)
Kiplinger’s (Negative) SmartMoney (Negative)
OLS 20,814 44 −0.0014 79,139 201 −0.0006(0.0053) (0.0019)
IV 20,814 44 −0.0004 79,139 201 −0.0005(0.0085) (0.0028)
Money 100 (Positive)
OLS 13,645 33 0.0172∗∗∗
(0.0062)IV 13,645 33 0.0221∗∗∗
(0.0058)
In this table, we estimate a linear probability model using the same set of investment objective-by-month fixed effects andobservations as in Table III. We then re-estimate the linear probability model instrumenting own-publication advertising ex-penditures in one personal finance publication with advertising expenditures in the other two personal finance publications (forexample, instrumenting own-publication advertising expenditures in Money from t-12 to t-1 with advertising expenditures inKiplinger’s and SmartMoney over the same period). Only the coefficient on own-publication advertising is reported. Standarderrors cluster on mutual fund family and are reported in parentheses. Significance at the 10-percent, 5-percent, and 1-percentlevels are denoted by ∗, ∗∗, and ∗∗∗.
25

TABLE VFama-MacBeth Regressions of Future Net Inflows on Media Mentions, 1997–2001
Dependent Variable: Ln Net Flows (t to t+11)
N (1) (2) (3) (4) (5)
Ln Fund TNA (t-1) 60 −0.0537∗∗∗ −0.0548∗∗∗ −0.0573∗∗∗ −0.0593∗∗∗ −0.0595∗∗∗
(0.0023) (0.0022) (0.0011) (0.0012) (0.0012)Ln Family TNA (t-1) 60 0.0225∗∗∗ 0.0226∗∗∗ 0.0230∗∗∗ 0.0234∗∗∗ 0.0197∗∗∗
(0.0006) (0.0005) (0.0005) (0.0006) (0.0010)Ln Net Flows (t-12 to t-1) 60 0.1294∗∗∗ 0.1286∗∗∗ 0.1086∗∗∗ 0.1076∗∗∗ 0.1057∗∗∗
(0.0141) (0.0140) (0.0153) (0.0150) (0.0149)Ln Returns (t-12 to t-1) 60 0.6007∗∗∗ 0.5967∗∗∗ 0.5484∗∗∗ 0.5453∗∗∗ 0.5474∗∗∗
(0.0559) (0.0568) (0.0555) (0.0578) (0.0566)Ln Returns Squared (t-12 to t-1) 60 0.7558∗∗ 0.7470∗∗ 0.7136∗∗ 0.7137∗∗ 0.7221∗∗
(0.3579) (0.3556) (0.3294) (0.3302) (0.3343)Ln Returns (t to t+11) 60 0.6682∗∗∗ 0.6687∗∗∗ 0.6996∗∗∗ 0.6977∗∗∗ 0.6972∗∗∗
(0.0619) (0.0615) (0.0522) (0.0531) (0.0540)Expense Ratio (t-1) 60 −0.0185∗∗∗ −0.0189∗∗∗ −0.0107∗ −0.0109∗ −0.0119∗
(0.0052) (0.0052) (0.0063) (0.0065) (0.0066)12b-1 Fee (t-1) 60 0.0814∗∗∗ 0.0829∗∗∗ 0.0828∗∗∗ 0.0858∗∗∗ 0.1005∗∗∗
(0.0108) (0.0111) (0.0104) (0.0112) (0.0133)Load Fund Dummy (t-1) 60 0.0060 0.0076 0.0176∗∗∗ 0.0209∗∗∗ 0.0274∗∗∗
(0.0061) (0.0061) (0.0049) (0.0052) (0.0052)Family Print Advertising Ratio 60 −0.0015 −0.0016 −0.0019 −0.0014 −0.0020
(t-12 to t-1) (0.0022) (0.0022) (0.0022) (0.0021) (0.0018)Family Non-Print Advertising Ratio 60 0.0456∗∗∗ 0.0452∗∗∗ 0.0508∗∗∗ 0.0438∗∗∗ 0.0499∗∗
(t-12 to t-1) (0.0140) (0.0139) (0.0148) (0.0138) (0.0225)
Fund-Level Media Mention (t-1)
WSJ “Fund Track” (News) 60 0.0458∗∗∗ 0.0367∗∗∗ 0.0274∗∗∗ 0.0243∗∗∗
(0.0095) (0.0096) (0.0100) (0.0099)NYT “Investing With” (Positive) 54 0.1845∗∗∗ 0.1507∗∗∗ 0.1480∗∗∗ 0.1504∗∗∗
(0.0332) (0.0323) (0.0322) (0.0321)Money 100 (Positive) 4 0.1138∗∗∗ 0.0944∗∗∗ 0.0849∗∗∗ 0.0840∗∗∗
(0.0096) (0.0083) (0.0108) (0.0086)Kiplinger’s (Positive) 36 0.1214∗∗∗ 0.1002∗∗∗ 0.0832∗∗ 0.0718∗∗
(0.0355) (0.0346) (0.0361) (0.0361)Kiplinger’s (Negative) 13 −0.0082 −0.0063 −0.0210 −0.0107
(0.0664) (0.0711) (0.0773) (0.0800)SmartMoney (Positive) 60 0.1055∗∗∗ 0.0822∗∗∗ 0.0719∗∗∗ 0.0712∗∗∗
(0.0193) (0.0183) (0.0176) (0.0172)SmartMoney (Negative) 49 −0.0065 −0.0108 −0.0176 −0.0212
(0.0154) (0.0150) (0.0158) (0.0164)Consumer Reports (Positive) 6 0.1201∗∗∗ 0.0961∗∗∗ 0.0856∗∗∗ 0.0870∗∗∗
(0.0147) (0.0166) (0.021) (0.0197)
Include Investment Objective Fixed Effects? Yes Yes Yes Yes YesInclude Lagged Morningstar Ratings? – – Yes Yes YesInclude Prior Fund Mentions (t-12 to t-2)? – – – Yes YesInclude Family-Level Mentions (t-12 to t-1)? – – – – Yes
Each month between January 1997 and December 2001 we estimate a separate cross-sectional regression. The dependent variablein our cross-sectional regressions is measured as the percentage change in the size of fund i between months t and t+11, minusthe fund’s return between months t and t+11. All monthly regressions include investment objective fixed effects. FollowingFama and MacBeth [1973], we report the time-series mean and time-series standard error for each estimated coefficient. Sincemany of the control variables are highly persistent, standard errors for the control variables are estimated via Newey and West[1987] with 12 lags. Standard errors for the media mention coefficients are estimated via White [1980]. (“N” indicates thenumber of cross-sectional regressions in which we were able to estimate the coefficient.) Prior mentions for a given publicationare the sum of mentions for fund i in months t-12 to t-1. Family-level mentions exclude mentions for fund i. Significance at the10-percent, 5-percent, and 1-percent levels is denoted by ∗,∗∗ , and ∗∗∗.
26

TABLE VIFuture Returns of Mentioned Funds Relative to their Peers, 1997-2002
ConsumerMedia mention: WSJ NYT Money Kiplinger’s SmartMoney ReportsNature of mention: News Positive Positive Positive Negative Positive Negative Positive
Panel A. Full Sample of Mutual Funds
Fund-Level Analysis
Dependent Variable: Monthly return of fund i minus average return of funds with the same investment objective
Mentioned between −0.069 0.216∗∗ 0.119 0.093 −0.384 0.017 −0.211∗∗∗ −0.055months t-12 and t-1? (0.091) (0.107) (0.095) (0.061) (0.275) (0.076) (0.078) (0.052)
Sample Size 330,674 330,674 261,202 330,674 330,674 330,674 330,674 314,978
Panel B. Domestic Equity Mutual Funds Only
Fund-Level Analysis
Dependent Variable: Monthly return of fund i minus average return of funds with the same investment objective
Mentioned between −0.071 0.327∗∗∗ 0.144 0.041 −0.306 −0.080 −0.356∗∗∗ −0.134∗∗
months t-12 and t-1? (0.076) (0.126) (0.125) (0.077) (0.303) (0.096) (0.092) (0.063)
Sample Size 139,998 139,998 113,027 139,998 139,998 139,998 139,998 134,007
Portfolio-Level Analysis
Dependent Variable: Monthly return of an equal-weighted portfolio of funds mentioned between months t-12 andt-1 minus equal-weighted return of all equity funds
CAPM Alpha −0.061 0.141 0.062 −0.060 0.156 −0.047 −0.459∗∗∗ −0.152∗
(0.093) (0.148) (0.173) (0.089) (0.498) (0.154) (0.134) (0.091)
Four Factor Alpha −0.072 0.133 0.133∗ −0.000 −0.092 −0.026 −0.310∗∗ −0.103(0.052) (0.145) (0.074) (0.090) (0.493) (0.106) (0.123) (0.077)
Sample Size 72 72 55 72 72 72 72 68
Panel A focuses on the full sample of U.S. mutual funds (excluding money market funds and mutual funds for which CRSPdoes not report a ticker for at least one share class during our sample period). Panel B focuses on the subset of domestic equitymutual funds. “Fund-Level Analysis” reports coefficients from an OLS regression of the return of fund i in month t, less theequal-weighted return of funds with the same investment objective, on a dummy variable that equals one if the fund receivedthe media mention between months t-12 and t-1. The dummy variable is defined using media mention data from January1996 through December 2002. The OLS regression is restricted to January 1997 through December 2002 (and slightly shorterperiods in the case of Money and Consumer Reports). Standard errors are reported below coefficients; they are robust toheteroscedasticity and cluster on investment objective-by-month pairs. “Portfolio-Level Analysis” calculates the equal-weightedreturn in month t of funds recommended between months t-12 and t-1, subtracts the equal-weighted monthly return for thesample of domestic equity funds, and regresses these monthly portfolio returns on the market return (in excess of the risk-freerate) and other factors. Hence, for each publication, the number of observations is the number of months between January1997 and December 2002 for which we are able to calculate portfolio returns based on our media mention data. We report theintercepts (alphas) as measures of risk-adjusted returns. Standard errors are reported below coefficients; they are robust toheteroscedasticity. Significance at the 10-percent, 5-percent, and 1-percent levels is denoted by ∗, ∗∗, and ∗∗∗.
27

TABLE VIIEstimating the Impact of Advertising Bias on Mentions, 1997-2002
Media mention: Money Kiplinger’s SmartMoneyNature of mention: Positive Positive Positive
Panel A. Fund-Level Analysis of Relative Monthly Returns, Full Sample
(a) Predicted Mentions Including −0.146∗ −0.238∗∗ −0.194∗
Own-Publication Advertising (0.086) (0.100) (0.115)
(b) Predicted Mentions Excluding −0.158∗ −0.238∗∗ −0.225∗
Own-Publication Advertising (0.093) (0.106) (0.118)
(c) Predicted mentions based −0.029 0.145∗∗ 0.125∗
solely on lowest expense ratios (0.079) (0.063) (0.068)
P-value from Test: (a) = (c) 0.545 0.901 0.331P-value from Test: (b) = (d) 0.209 0.003∗∗∗ 0.045∗∗
Panel B. Overlap in Predicted Mentions
Predicted Mentions (a) and (b) 91.5% 77.0% 77.9%Predicted Mentions (a) and (c) 9.7% 1.0% 2.0%
Panel A replicates the analysis from Panel A of Table VI using (a) predicted mentions including the influence of own-publicationadvertising, (b) predicted mentions excluding the influence of own-publication advertising, and (c) predicted mentions basedsolely on which funds have the lowest expense ratio within each investment objective. Panel B measures the overlap in the setsof funds receiving predict mentions.
28