DNA Lab sample
7
Taylor Hines 1. Introduction As the CMV virus presents a broad health threat, researchers hope to develop an effective vaccine by locating the origin of replication in the virus’s DNA sequence. Due to limited resources, an exhaustive search is impractical; therefore, I seek to use statistical methods to identify a narrow region to focus the search. CMV’s DNA sequence contains 229,354 base pairs, including numerous complementary palindromes of varying length. Based on studies of similar viruses, it is believed that unusual clusters of palindromes may mark the origin of replication. The data set lists the locations of 296 of these palindromes. By developing a probabilistic model for the distribution of palindromes, anomalous clusters that may mark the location of the origin of replication can be identified. II. Methodology In order to evaluate the baseline hypothesis, that the palindromes follow a uniform random scatter distribution, I will generate simulated data to perform a general comparison, both using visual plots as well as quantitative tests. Then, to analyze clustering of the Palindromes, I will seek to fit the data to a Poisson Process: The DNA strand will be divided into segments, such that palindrome counts can be recorded for each segment. The length of the segments is particularly important: if the segments are too short, there is a risk large clusters may be divided into two adjacent segments. If the segments are too large it becomes difficult to statistically test the model (by comparing the observed and expected segment counts) because there may not be enough variation in palindrome counts across segments. Once an appropriate segment size has been selected, the data can be used to estimate the poisson parameter (lambda) and perform a chi-squared goodness of fit test to confirm the data follows a Poisson Process. Parameter estimation is straightforward, as the method of moments specifies that lambda is equal to the sample average, which in this case is simply the observed empirical average. After obtaining a convincing probability model, a custom p-statistic can be developed to test whether any large clusters constitute an abnormality that may mark the location of the origin of replication. III. Results The basic structure of the data is evident in a simple histogram (using counts not density). By specifying the number of bins, we can get a feel for the distribution of counts in the data, as the bins will have a fixed length of DNA pairs. Page of 1 7
-
Upload
taylor-hines -
Category
Documents
-
view
74 -
download
0
Transcript of DNA Lab sample

Taylor Hines
1. Introduction
As the CMV virus presents a broad health threat, researchers hope to develop an effective vaccine by locating the origin of replication in the virus’s DNA sequence. Due to limited resources, an exhaustive search is impractical; therefore, I seek to use statistical methods to identify a narrow region to focus the search. CMV’s DNA sequence contains 229,354 base pairs, including numerous complementary palindromes of varying length. Based on studies of similar viruses, it is believed that unusual clusters of palindromes may mark the origin of replication. The data set lists the locations of 296 of these palindromes. By developing a probabilistic model for the distribution of palindromes, anomalous clusters that may mark the location of the origin of replication can be identified.
II. Methodology
In order to evaluate the baseline hypothesis, that the palindromes follow a uniform random scatter distribution, I will generate simulated data to perform a general comparison, both using visual plots as well as quantitative tests.
Then, to analyze clustering of the Palindromes, I will seek to fit the data to a Poisson Process: The DNA strand will be divided into segments, such that palindrome counts can be recorded for each segment. The length of the segments is particularly important: if the segments are too short, there is a risk large clusters may be divided into two adjacent segments. If the segments are too large it becomes difficult to statistically test the model (by comparing the observed and expected segment counts) because there may not be enough variation in palindrome counts across segments.
Once an appropriate segment size has been selected, the data can be used to estimate the poisson parameter (lambda) and perform a chi-squared goodness of fit test to confirm the data follows a Poisson Process. Parameter estimation is straightforward, as the method of moments specifies that lambda is equal to the sample average, which in this case is simply the observed empirical average.
After obtaining a convincing probability model, a custom p-statistic can be developed to test whether any large clusters constitute an abnormality that may mark the location of the origin of replication.
III. Results
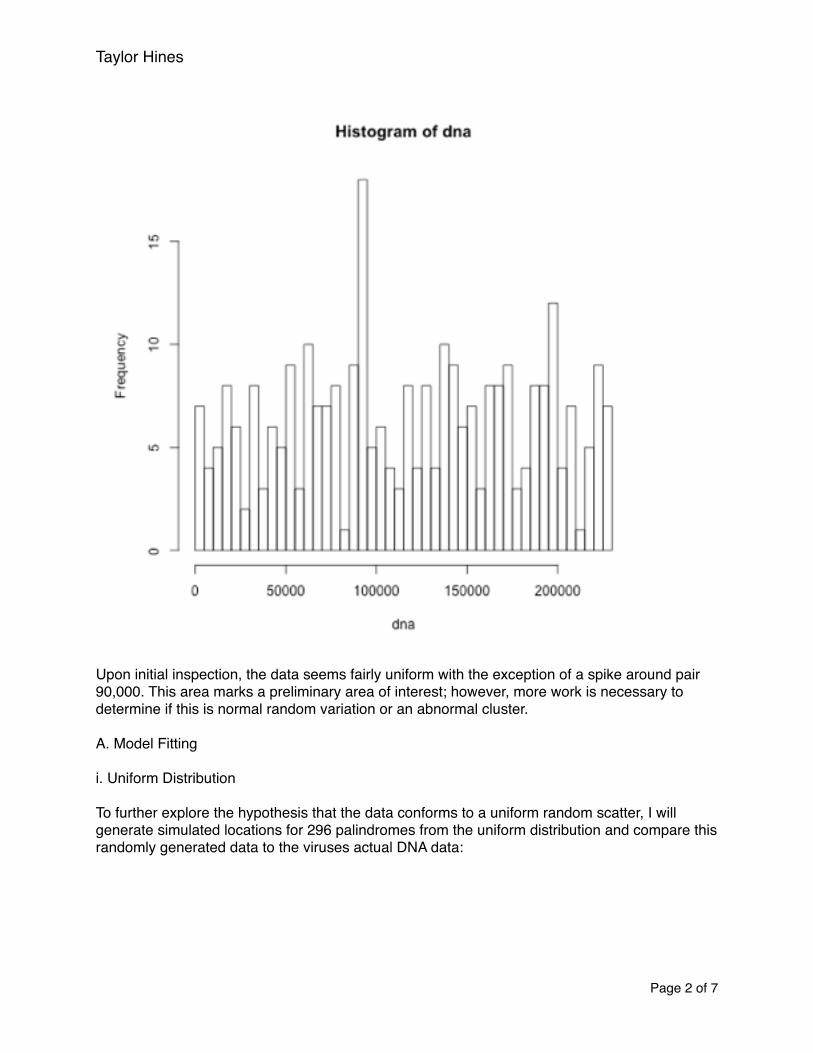
The basic structure of the data is evident in a simple histogram (using counts not density). By specifying the number of bins, we can get a feel for the distribution of counts in the data, as the bins will have a fixed length of DNA pairs.
Page � of �1 7
Taylor Hines
Upon initial inspection, the data seems fairly uniform with the exception of a spike around pair 90,000. This area marks a preliminary area of interest; however, more work is necessary to determine if this is normal random variation or an abnormal cluster.
A. Model Fitting
i. Uniform Distribution
To further explore the hypothesis that the data conforms to a uniform random scatter, I will generate simulated locations for 296 palindromes from the uniform distribution and compare this randomly generated data to the viruses actual DNA data:
Page � of �2 7

Taylor Hines
Visually comparing the two histograms, it certainly seems plausible that the data fits a Uniform distribution. The Q-Q plot (a comparison of the quartiles of both distributions) also shows that the data fits this model pretty well. The next step is to analyze the palindrome counts and see if I can similarly fit this data to the Poisson Distribution.
Page � of �3 7

Taylor Hines
B. Poisson Process
To fit the data to the Poisson Distribution, I can divide the DNA into segments and record the palindrome counts for each segment. The Poisson Distribution provides us with the expected number of segments with a given palindrome count; e.g. the expectation of 4 segments containing 6 palindromes each. If the observed counts deviate substantially than the expected numbers, the Poisson Distribution may not be a good fit.
As noted in the methodology section, a great deal of care was given in selecting the size of the segments. Through experimentation, a segment length of 5,250 pairs (which results in 43 segments) was found to generate good results. As the objective was to minimize the chance that a large cluster would be divided into two adjacent segments, I sought to maximize the palindrome counts relative to the size of the segments. number of palindromes in a given bin, relative to the size of the bin (clearly we would expect dramatically larger bins to contain more palindromes). The palindrome counts for each of the 43 segments are as follows:
7 4 5 10 5 3 8 4 4 7 9 5 11 5 10 2 8 19 5 6 5 2 10 3 8 6 9 8 10 4 6 8 7 7 5 6 10 12 4 7 1 5 9
Using these counts, I can estimate lambda, the poisson parameter. The Method of Moments and MLE both specify that lambda is equal to the the sample average, or in this case, the observed average. As such, this parameter is simply the total number of palindromes divided by the number of bins, or 𝛌 = 6.72
Using this estimate, I can simulate data and visually compare the two:
Page � of �4 7

Taylor Hines
The general shape of these two histograms seem similar with the notable exception of an outlier bin in the observed DNA data (segment 18 has a count of 19 palindromes). If this segment can be quantitatively identified as an outlier, this region is a good candidate for the origin of replication.
C. Chi Squared Goodness of Fit Test
To statistically test whether the data follows a Poisson Distribution, a chi squared goodness of fit test can be performed. By constructing a table with actual and expected segment counts (for a given number of palindromes per segment) I can construct a chi squared statistic to probabilistically test the distribution. For this test, I combined the rows with counts less than 3 bins and those with counts greater than 10. This was to avoid having entries in the table with very low expected and actual counts.
Using this table, the Chi Squared Test yields a p-value of .79, where the null hypothesis is that the data fits a poisson distribution with the estimated value of lambda. This means that we would expect to see this level of deviation of observed counts from the expected in about 79% of cases. The observed variation would have to be much higher for us to conclude that the data does not follow this distribution. While failing to reject the null hypothesis is not affirmative confirmation of the Poisson model, the combined evidence suggests the Poission model fits the DNA data reasonably well.�5
D. Outlier
Having arrived at a reasonable probability model, we can use this model to test the outlier segment to see if it represents an abnormal cluster in the data. The fact that only one outlier has been identified is in itself encouraging, because if 2 or more had been found, there would be multiple candidates for the origin of replication. In addition to the histogram at the beginning of this report, a simple box plot enables us to inspect the distribution of palindrome counts across segments, as well as enabling us to identify any suspect outliers:
Palindrome Count Observed Segments Expected Segments
0 - 3 5 4.2
4 5 4.4
5 8 5.9
6 4 6.6
7 5 6.4
8 5 5.4
9 3 4.0
10+ 8 6.1
Page � of �5 7

Taylor Hines
The above box-plot simply and elegantly identifies the suspect outlier segment. In order to qualitatively assess this outlier, i.e. probabilistically assess this observation, we can pose a series of probabilistic questions:• 1) What is the probability of having 19 palindromes or more in one 5250 pair segment. • 2) In 43 segments, how many segments would we expect to contain at least 19 palindromes • 3) What is the probability that the maximum number of palindromes in 43 segments is 19 or
greater?
The third question constitutes an appropriate p-value for the following statistical test:Is this outlier the result of normal statistical noise from the Poisson Distribution, or rather it represents an abnormal cluster and as such is a candidate for the origin of replication.
The probabilities/expectation are as follows:• 1) the probability of having a count of 19 is 2.55 x10-05 or .0025%• 2) In 43 segments, the expected number of segments with 19 palindromes is only 0.001• 3) The probability that the maximum number of palindromes in 43 segments is 19 or greater
is .00333 or .333 %
These results strongly confirm our suspicion that this outlier is an abnormal cluster of palindromes.
IV. Conclusions
Our hypothesis that the palindrome data conforms to a uniform random scatter was largely confirmed. Both visual inspection of the data, as well as comparisons to simulated data showed
Page � of �6 7

Taylor Hines
that the palindromes were distributed uniformly across the strand. The count data also confirmed that the palindrome locations are consistent with a poisson process. The chi squared test provided strong quantitative evidence of goodness of fit with a p-value of around 80%. When comparing the actual DNA data to the simulated poisson data, the shape of the distribution appeared largely consistent with the notable exception of one large cluster. The boxplot confirmed that the largest cluster, 19 palindromes in one 5250 segment of the DNA, was an outlier. It should also be noted that this was the only outlier, and hence the only abnormal cluster candidate. The p-statistic we used to test the abnormality of this cluster was the likelihood of a maximum value of 19 or more palindromes out of a set of 43 segments. The result of this test allowed us to reject the null hypothesis at a 99.5% significance level, providing strong evidence that this is an abnormal cluster that could indicate the origin of replication. Lastly I identified the location of this cluster as in the region of pairs 89250 – 94500. The bin size was adjusted to maximize the size of the observed cluster, however we cannot be completely certain that the origin of replication is contained in this interval, because the cluster may still overlap with the bin above or below this point. However, the abnormally high number of palindromes (19) in this range indicates that the cluster shouldn’t extend too much farther outside of this range (our test showed we would only expect to see 1/1000 bins with this count). Furthermore the length of this segment only represents 2.3% of the length of the total DNA strand. This represents a significant gain in efficiency over searching the entire strand. My final recommendation is to restrict the search for the origin of replication to this segment and nearby base pairs as resources allow.
Page � of �7 7