DNA-CONJUGATED MAGNETIC NANOPARTICLES FOR BIO-ANALYTICAL AND BIOMEDICAL...
120
1 DNA-CONJUGATED MAGNETIC NANOPARTICLES FOR BIO-ANALYTICAL AND BIOMEDICAL APPLICATIONS By SUWUSSA BAMRUNGSAP A DISSERTATION PRESENTED TO THE GRADUATE SCHOOL OF THE UNIVERSITY OF FLORIDA IN PARTIAL FULFILLMENT OF THE REQUIREMENTS FOR THE DEGREE OF DOCTOR OF PHILOSOPHY UNIVERSITY OF FLORIDA 2011
Transcript of DNA-CONJUGATED MAGNETIC NANOPARTICLES FOR BIO-ANALYTICAL AND BIOMEDICAL...

1
DNA-CONJUGATED MAGNETIC NANOPARTICLES FOR BIO-ANALYTICAL AND BIOMEDICAL APPLICATIONS
By
SUWUSSA BAMRUNGSAP
A DISSERTATION PRESENTED TO THE GRADUATE SCHOOL OF THE UNIVERSITY OF FLORIDA IN PARTIAL FULFILLMENT
OF THE REQUIREMENTS FOR THE DEGREE OF DOCTOR OF PHILOSOPHY
UNIVERSITY OF FLORIDA
2011

2
© 2011 Suwussa Bamrungsap

3
To my family

4
ACKNOWLEDGMENTS
I am truly grateful to a long list of people. None of my success would have been
possible without them. I would like to express my gratitude to my research advisor, Dr.
Weihong Tan, for providing continuous guidance, support, and opportunities for my
research and life throughout my PhD studies. His valuable inspiration and advices
encourage me to have scientific thought which will definitely have a great impact for my
future career and life.
I am pleased to thank my doctoral dissertation committee members, Dr. Alexander
Angerhofer, Dr. Charles Cao, Dr. Gail Fanucci, and Dr. Christopher Batich for the
helpful discussion and constructive comments. I would like to thank Dr. Benjamin Smith
for all help and support during my five-year at University of Florida. I also thank The
Royal Thai government for the graduate stipend and tuition fees during my whole PhD
studies.
This dissertation is a result from successful collaboration with many scientists. I
especially thank Dr. Yu-Fen Huang, Dr. Joshua Smith, and Dr. Colin Medley for
introducing me into the nanomaterial felids, guiding, and training me in the early states
of research. I also would like to express my appreciation to Dr. Kathryn Williams, Dr.
Joseph Phillips, Dr. Ibrahim Shukoor, Dr. Kwame Sefah, Dr. Youngmi Kim, Dr. Arthur
Hebard, and Dr. Swadeshmukul Santra for many helpful research discussions,
experimental help, and all suggestions on different projects. I really appreciate Dr. Yan
Chen, Dr. Zhi Zhu and Hui Wang as being supportive friends and colleagues, as well as
their encouragement during my difficult times.
It has been a great experience to spend several years in the Tan research group
with both previous and current group members. I would like to thank Dr. Marie Carmen

5
Estevez, Dr. Jilin Yan, Dr. Xiaoling Zhang, Dr. Liu Yang, Dr. Heipeng Liu, Dr. Jennifer
Martin, Dr. Huaizhi Kang, Dalia Lopez Colon, Xiangling Xiong, Dimitri Van Simaeys,
Meghan O’Donoghue, Basri Gulbaken, Tao Chen, and others for their help and
friendship.
I also would like to express special thanks to my friends Jean Palmes, Preeyanan
Sriwanayos, Aay Pawinee, Pattaraporn Vanachayangkul, Witcha Imaram, and
Werachart Ratanatharathorn for valuable friendship. I deeply appreciate them for being
supportive during my difficult times, and sharing the good moments.
Finally, without my family, especially my parents, Somkuan and Wasana, none of
this would have been possible. I sincerely thank for their continuous dedication, endless
support, and constant encouragement. Their unconditional love and great attitude
make me become who I am and keep me always moving on.

6
TABLE OF CONTENTS page
ACKNOWLEDGMENTS .................................................................................................. 4
LIST OF TABLES ............................................................................................................. 9
LIST OF FIGURES ........................................................................................................ 10
ABSTRACT .................................................................................................................... 13
CHAPTER
1 INTRODUCTION ..................................................................................................... 16
Impact of Nanoparticles for Bio-analytical Applications ........................................... 16
Magnetic Iron Oxide Nanoparticle Fundamentals .................................................... 18
Synthesis of Iron Oxide Nanoparticles .............................................................. 19
Iron Oxide Nanoparticle Surface Modification and Bioconjugation .................... 21
Size, Shape, Magnetic properties and Surface Characterization ...................... 23
Magnetic Nanoparticles for Magnetic Resonance (MR) Based Assays ................... 24
Basic Concept of Magnetic Resonance Imaging (MRI) ..................................... 26
Magnetic nanoparticles (MNPs) and T2 relaxation ...................................... 27
Magnetic Relaxation Switches (MRSw) ............................................................ 30
Mechanism of magnetic relaxation switches (MRSw) ................................. 31
Instrumentation for MRSw .......................................................................... 32
Nucleic Acid Probes ................................................................................................ 33
Selective Biorecognition Elements .................................................................... 34
DNA Molecular Machines .................................................................................. 37
DNA switches ............................................................................................. 37
DNA walkers ............................................................................................... 38
DNA motors ................................................................................................ 39
Fluorescence Techniques for Signal Transduction .................................................. 40
Jablonski Diagram ............................................................................................ 40
Fluorescence Quenching .................................................................................. 41
Fluorescence Resonance Energy Transfer (FRET) .......................................... 43
2 MOLECULAR PROFILING OF CANCER CELLS USING APTAMER-CONJUGATED MAGNETIC NANOPARTICLES ..................................................... 54
Introduction .............................................................................................................. 54
Experimental Section ............................................................................................... 56
Synthesis of DNA Aptamers .............................................................................. 56
Aptamer-Nanoparticle Conjugation ................................................................... 57
Cells and Culture Conditions ............................................................................. 57
Determination of Conjugated Nanoparticle-Cell Specific Targeting .................. 58
Sample Assays using Spin-Spin Relaxation Time Measurement ...................... 59

7
Results and Discussion .......................................................................................... 59
Magnetic Nanosensor Preparation .................................................................... 59
Specificity of ACMNPs ...................................................................................... 60
Cancer Cells Detection using Spin-spin Relaxation Time Measurement .......... 60
Detection in Complex Biological Media ............................................................. 61
Detection in Mixture of Cells ............................................................................. 62
Cancer Cells Profiling ........................................................................................ 63
Conclusion ............................................................................................................... 64
3 DETECTION OF LYSOZYME USING MAGNETIC RELAXATION SWITCHES BASED ON APTAMER-FUNCTIONALIZED SUPERPARAMAGNETIC NANOPARTICLES .................................................................................................. 72
Introduction .............................................................................................................. 72
Experimental Section ............................................................................................... 74
Synthesis of DNA .............................................................................................. 74
Lys Nanosensor Preparation ............................................................................. 74
Magnetic Relaxation Measurement ................................................................... 75
Cell Samples Preparation ................................................................................. 75
Results and Discussion ........................................................................................... 76
Clusters Formation of Lys Nanosensor ............................................................. 77
Lys-Induced Disassembly of Nanosensors ....................................................... 77
Selectivity and Specificity of Lys Nanosensors ................................................. 78
Quantitative Analysis of Lysozyme ................................................................... 79
Analysis of Lysozyme in Cell Lysates ............................................................... 80
Conclusion ............................................................................................................... 81
4 MAGNETICALLY DRIVEN SINGLE DNA NANOMOTOR ....................................... 87
Introduction .............................................................................................................. 87
Experimental Section ............................................................................................... 88
DNA Molecular Probes Synthesis ..................................................................... 88
Molecular Probes Assays .................................................................................. 89
Immobilization of DNA Molecular Probes on Glass Surface ............................. 90
Construction of DNA Nanomotor ....................................................................... 91
Results and Discussion ........................................................................................... 92
Signal Enhancement of the DNA Molecular Probes by Dnase I Cleavage ........ 93
DNA Nanomotor Driven by Magnetic Field ....................................................... 94
Conclusion ............................................................................................................... 98
5 SUMMARY AND FUTURE DIRECTIONS ............................................................. 105
The Development of DNA-Conjugated Magnetic Nanoparticles for Bio-Analytical and Biomedical Applications .............................................................................. 105
Future Directions ................................................................................................... 107
LIST OF REFERENCES .............................................................................................. 111

8
BIOGRAPHICAL SKETCH .......................................................................................... 120

9
LIST OF TABLES
Table page 2-1 Representative cell lines and binding affinities of their selected aptamers. ......... 71
3-1 List of DNA sequences. ....................................................................................... 86
3-2 The formation of magnetic clusters upon hybridization between complementary strands ....................................................................................... 86
4-1 DNA hairpins and biotinylated linker ................................................................. 104
4-2 The average signal enhancement of nanomotor after repeating several cycles. ............................................................................................................... 104

10
LIST OF FIGURES
Figure page 1-1 Nanoparticle size effects on magnetism. ............................................................. 45
1-2 Scheme representing the StÖber process ........................................................... 45
1-3 Scheme representing a water-in-oil (W/O) microemulsion system. ..................... 46
1-4 Representative bioconjugation schemes for attaching biomolecules to NPs for bioanalysis ..................................................................................................... 46
1-5 Principal of magnetic resonance imaging (MRI) .................................................. 47
1-6 The role of magnetic nanoparticles as contrast agents ....................................... 47
1-7 Magnetic nanoparticle size and dopant effects on mass magnetization (Ms) and MRI contrast enhancement. ......................................................................... 48
1-8 Magnetic nanoparticle aggregation effects on MRI. ............................................ 49
1-9 Principle of magnetic relaxation switches (MRSw). ............................................. 49
1-10 DNA and RNA structures formed by phosphodiester linkages. ........................... 50
1-11 Structure of DNA double helix and base pairing. ................................................. 50
1-12 Schematic representation of DNA aptamer selection using the cell-SELEX strategy ............................................................................................................... 51
1-13 DNA nanomachines ............................................................................................ 52
1-14 Jablonski diagram. ................................................ 53
1-15 Schematic representation of FRET donor and acceptor spectra. ........................ 53
2-1 Schematic representation of magnetic nanosensor for cancer cell detection and profiling ......................................................................................................... 66
2-2 The specific recognition of ACMNPs to their target cells ..................................... 67
2-3 The optimization of magnetic nanosensor concentration in PBS. ....................... 67
2-4 sgc8c-ACMNPs as a nanosensor for the detection of CEM cells in PBS ............ 68
2-5 The dynamic detection range of Ramos cells using magnetic nanosensor in PBS. .................................................................................................................... 68

11
2-6 sgc8c-ACMNPs as a nanosensor for the detection of CEM cells in Fetal Bovine Serum (FBS) ........................................................................................... 69
2-7 The detection of target CEM cells in plasma and whole blood ............................ 69
2-8 The detection of target cells in complex biological media mimics detection in real clinical samples ............................................................................................ 70
2-9 The detection of mixed cell samples for the development of rare tumor cells detection.............................................................................................................. 70
2-10 Profiling of cancer cells. ...................................................................................... 71
3-1 Schematic representation of the magnetic nanosensor for Lys detection based on MRSw. ................................................................................................. 82
3-2 Effect of incubating MNP-Lys aptamer with MNP-Linker at high concentration overnight ............................................................................................................. 82
3-3 A gradual change of ΔT2 upon the addition of Lys .............................................. 83
3-4 Selectivity of the Lys nanosensor. ....................................................................... 83
3-5 Specificity of the Lys nanosensor. ....................................................................... 84
3-6 Changes in T2 relaxation time with increasing concentrations of Lys. ................ 84
3-7 The detection of Lys-spiked human serum using relaxometry measurements. ... 85
3-8 The detection of Lys-spiked human serum using T2-weighted MR images. ........ 85
3-9 Determination of Lys in cell lysates. .................................................................... 86
4-1 Concept of magnetically driven DNA nanomotor ................................................. 99
4-2 Signal enhancement of DNA hairpins in solution after the addition of DNase I. 100
4-3 Signal enhancement of DNA hairpins on the glass surface of micro-channel after DNase I addition ....................................................................................... 101
4-4 Cycles of closed-open state from DNA hairpins with 1.0 µm magnetic beads. . 101
4-5 Cycles of closed-open state from DNA hairpins with 2.8 µm magnetic beads. . 102
4-6 Cycles of closed-open state from DNA hairpins with 0.2 µm magnetic beads. . 102
4-7 Magnetic beads effect on the DNA nanomotor ................................................. 103

12
5-1 Schematic representation of DNAzyme-based magnetic nanosensor for Lys detection. ........................................................................................................... 110

13
ABSTRACT OF DISSERTATION PRESENTED TO THE GRADUATE SCHOOL OF THE UNIVERSITY OF FLORIDA IN PARTIAL FULFILLMENT OF THE REQUIREMENTS FOR THE DEGREE OF DOCTOR OF PHILOSOPHY
DNA-CONJUGATED MAGNETIC NANOPARTICLES FOR BIO-ANALYTICAL AND
BIOMEDICAL APPLICATIONS
By
Suwussa Bamrungsap
August 2011
Chair: Weihong Tan Major: Chemistry
Magnetic nanoparticles (MNPs) can be synthesized to have various sizes, shapes,
and compositions, providing distinctive magnetic, electronic and optical properties
compared to their bulk counterparts. With the dimension similar to biomolecules, MNPs
can be engineered to have specific properties and can be used to pursue an in-depth
understanding of biochemical processes. Due to the strong and specific base-pairing of
nucleic acids, as well as their ability to form self-assembled structural motifs, DNA
conjugated MNPs can serve versatile functions including the investigation of biological
activities and the construction of molecular machines.
First, a magnetic nanosensor prepared by aptamer conjugated MNPs (ACMNPs),
was developed based on magnetic relaxation switches (MRSw) mechanism. The
detection can be achieved by switching between dispersed and aggregated of MNPs
upon binding with target cells resulting in a change in proton spin-spin relaxation times
(ΔT2). Specificity and sensitivity of nanosensors were capitalized by the ability of
aptamers to specifically bind their targets and the large surface area of MNPs to
accommodate multiple binding events. The detection as few as 10 target cells in buffer

14
and 100 cells were obtained in biological samples. Furthermore, by using an array of
ACMNPs, various cell types can be differentiated through recognition patterns, thus
creating a cellular molecular profile and allowing clinicians to accurately identify cancer
cells at the molecular and single cell level.
Additionally, a nanosensor based on MRSw was also demonstrated for protein
detection using Lysozyme (Lys) as a model protein. The nanosensor system consisted
of MNPs aggregates prepared by the hybridization of MNPs conjugated with either
aptamers or linker DNA that could hybridize to the extended part of Lys aptamers,
leading to the cluster formation. In the presence of Lys, the aptamers bind with their
targets, resulting in the disassembly of the clusters, and providing a change in T2
relaxation time. The high selectivity and sensitivity in nanomolar range of the detection
was achieved in both buffer and human serum. The analysis of Lys in cancer cell
lysates was also performed to validate the detection in real clinical samples.
Another area of investigation was the development of a magnetically driven DNA
nanomotor. In particular, DNA hairpins were conjugated to magnetic particles and the
entire conjugation was immobilized to a solid support. The DNA hairpin can be
interpreted as a nanomotor because it switched between “closed” and “open” states.
The applied magnetic field triggered the change of molecular conformation or drove the
movement of molecular probes between closed and open states, which can be
observed by the change of fluorescence. By repetitive shrinking and extending
movements, DNA hairpins were considered as a nanometer-scale motor.
In summary, this research focuses mainly on the development of DNA-conjugated
MNPs for the analysis of biological targets, and the construction of nanomachine.

15
Successful outcomes form these investigations will lead to the improvement in
bioanalytical science, biomedical applications, and bionanomaterial research.

16
CHAPTER 1 INTRODUCTION
Impact of Nanoparticles for Bio-analytical Applications
Over the past few decades, nanoparticles have received considerable attention in
the translation of nanotechnology into advanced biomedical science and other
biotechnological fields. Compared to their bulk counterparts, nanoparticles provide
drastically different properties, including (1) the small size in the sub-100 nanometer
range resulting in high surface-to-volume ratios, (2) the size- and shape-dependent
properties, such as the distinctive light scattering of gold nanoparticle and discrete
luminescent behavior of quantum dots, and (3) the enhancement of physical and
chemical properties of some materials in the nanoregime.1,2 Additionally, with the similar
dimension to biomolecules including oligonucleotides, peptides, proteins, and cells,
nanoparticles can be engineered to construct versatile nano-bio hybrid materials for the
development of bioanalysis tools and the investigation of biological processes.3,4
The demand for rapid and accurate disease screening has driven the development
of novel bioassays having high sensitivity and selectivity with simple detection and
sample preparation. The selectivity of the bioanalysis is achieved by molecular
recognition properties such as receptor-ligand association, antibody-antigen binding,
and oligonucleotide hybridization. In addition, the sensitivity is directly related to the
transduction of the target-probe into the reporting signal. Consequently, the design of
hybrid materials that link molecular probes serving as recognition units and
nanoparticles which can generate measurable signals is very desirable. Generally, the
most common reporting signals are based on optical techniques, including
fluorescence, colorimetry, and Raman spectroscopy.5-7 However, complex biological

17
systems generate high background interference by scattering, absorption and
autofluorescence, which lower the signal/noise ratio and limit the sensitivity of detection.
Therefore, sample purification and multiple preparation steps are needed, requiring
complex instrumentation and time investment. Alternative techniques which are light
independent are of great interest to overcome these drawbacks.
In recent years, considerable effort has been devoted to the design and
construction of molecular machines. One of the most attractive materials chosen for
construction of nanoscale machines is DNA, due to the specific base-pair formation,
sequence programmability, and feasible synthesis.8,9 DNA can be assembled to 2D or
3D structure and utilized as dynamic molecules that duplicate mechanical devices such
as switches, walkers, and motors.10-12 In particular, DNA nanomotors can be achieved
by conformational changes in DNA induced by the energy input from sources such as
DNA fuel strands and ATP molecules.13,14 However, the addition of fuels results in the
generation of waste products, and the accumulation of waste strands after several
cycles of operation results in decreases motor efficiency. Therefore, alternative energy
source such as electromagnetic fields are desired to eliminate the accumulation of
waste products and to produce high efficiency nanomotors.
The ultimate goal of this dissertation is the development of DNA conjugated
magnetic nanoparticles for molecular detection and the construction of DNA
nanomachines. The following section will discuss the synthesis, characterization and
conjugation of magnetic nanoparticles. A brief discussion of nucleic acid probes as
selective recognition elements, including aptamers, and the systematic evolution of
ligands by exponential enrichment (SELEX), as well as DNA nanomachines will follow.

18
Then, the principle of magnetic relaxation switches (MRSw), fluorescence spectroscopy,
and fluorescence resonance energy transfer (FRET) will be reviewed. Finally, the
overall focus of this dissertation will be outlined.
Magnetic Iron Oxide Nanoparticle Fundamentals
In bulk materials, magnetic properties can be determined by multiple parameters
such as susceptibility, coercivity, composition, crystallographic structure, and the
presence of vacancies and defects. However, when the size of a magnetic material is
reduced into the nanoregime, size is the dominant parameter, because the properties of
MNPs are strongly dependent on their dimensions.15,16 Bulk magnetic materials posses
multiple magnetic domains due to the different alignment of electron spins generating
varying magnetic moments. With decreasing size of MNPs below their critical size, they
exist as a single domain with spins aligned unidirectionally (Figure 1-1). However, when
the size is further reduced, the thermal energy effect is significant in the nanoregime
and it is sufficient to tilt the surface spins of the MNPs. Such surface spin-canting leads
to a net magnetization of zero, and this behavior is called superparamagnetism.17,18
Such particles can be magnetized in the presence of a magnetic field and then return to
the original state in the absence of the external field.
Superparamagnetic materials, especially iron oxide nanoparticles (Fe3O4 or
Fe2O3), are extremely attractive in biotechnological research, and their crucial
characteristics avoid undesired particles aggregation. Thus, iron oxide particles have
been used for numerous purposes, including biosensing, bioseparation, magnetic
resonance imaging (MRI), drug delivery, hyperthermia therapy, and tissue
engineering.4,19 Typically, a size smaller than 100 nm and a narrow size distribution are

19
required for biomedical applications. Therefore, the control of synthesis, surface
modification, and biomolecular conjugation are extremely important.
Synthesis of Iron Oxide Nanoparticles
Iron oxide nanoparticles can be synthesized by various techniques:
microemulsions, sol-gel reactions, electrochemical methods, flow injection syntheses,
and electrospray syntheses.18,20 However, the most common methods of iron oxide
nanoparticle synthesis are chemical coprecipitation and thermal decomposition
reactions. The coprecipitation is the simplest way to prepare iron oxide nanoparticles of
magnetite, Fe3O4, or maghemite, Fe2O3. Typically, they are prepared by aging
stoichiometric mixture of ferrous and ferric salts in aqueous medium according to the
reaction
Fe2+ + 2Fe3+ + 8OH- → Fe3O4 + 4H2O (1-1)
In general, complete precipitation of Fe3O4 takes place at pHs between 8 and 14
with a stoichiometric ration of 2:1(Fe3+/Fe2+) in a non-oxidizing environment.21 Fe3O4 is
not very stable and can be transformed to Fe2O3 in the presence of oxygen as follows
Fe3O4 + 2H+ → Fe2O3 + Fe2+ + H2O (1-2)
The advantages of the coprecipitation method are ease of synthesis and the
capability for large-scale production. However, the drawback of this technique is the
non-uniformity of the particles. During the process, two steps are involved: the
nucleation occurs when the concentration of reactive components exceeds saturation
and the subsequent slow growth of nuclei. In order to achieve monodisperse particles,
nucleation should be avoided during the growth phase of nanocrystals. Generally, the
sizes and shapes of iron oxide nanoparticles can be tuned by adjusting the Fe2+/Fe3+

20
ratio, pH, ionic strength, temperature, and nature of the counterions. The size of iron
oxide particles increases with the ratio of Fe2+/Fe3+.22 Higher pHs and ionic strengths
lead to the smaller size of particles, because the chemical composition and electrostatic
surface charge are determined by those parameters. It has also been found that the
nucleation decreases when the temperature is increased.23 Iron oxide naoparticles
prepared by the coprecipitation method can be dispersed in either aqueous media or a
nonpolar solvent suitable for further surface modification.
Superparamagnetic iron oxide nanoparticles can also be prepared by thermal
decomposition of iron organic precursors, such as iron pentacarbonyl, Fe(CO)5, iron
acetylacetonate, Fe(acac)3, or iron(III) chloride, FeCl3, using organic solvents and
surfactants. MNPs with a high level of size control and monodispersity can be obtained
by the control of reaction conditions, including solvent, temperature, and reaction time.
The nucleation steps may be faster than the growths steps at high temperature,
resulting in a decrease of particle size. However, a long reaction time facilitates the
growth steps with other conditions held constant. For example, iron oleate can be
formed by decomposition of Fe(CO)5 in the present of oleic acid and octyl ether at
100°C in an argon atmosphere. Then (CH3)3NO is added and the solution is refluxed at
300°C for the oxidation step. These processes allow the production of highly crystalline
and monodisperse iron oxide nanoparticles with sizes from 4 to 16 nm.24 High uniformity
of iron oxide crystals with sizes ranging from 4 to 20 nm can also be achieved by a high-
temperature reaction of Fe(acac)3 with 1,2-hexadecanediol in the presence of oleic acid
and oleylamine. The hydrophobic particles are highly dispersed in organic solvents and
can be further transformed into a hydrophilic phase by adding bipolar ligands.

21
Iron Oxide Nanoparticle Surface Modification and Bioconjugation
It is essential to modify iron oxide particle surfaces in order to achieve stable
magnetic colloids that do not aggregate in magnetic fields and biological media. Stability
of magnetic colloid results from the equilibrium between attractive and repulsive forces
in suspension. In theory, interparticle interactions can be divided into four types: 1) van
der Waals forces which are short-range isotropic attractions, 2) electrostatic forces
controlled by salt concentration, 3) dipolar forces generated between two particles, and
4) steric repulsion from coated particles.25 For iron oxide nanoparticles, the surface
contains iron atoms which act as Lewis acids and can interact with molecules that
donate a lone-pair of electron. In aqueous solution, iron ions coordinate with water
molecules which can be hydrolyzed resulting in hydroxyl groups on the particle surface.
The hydroxyl groups allow iron oxide particles to be modified using several types of
materials, including polymeric ligands, inorganic materials, and micellar coatings.
Various polymers have been utilized to coat iron oxide nanoparticles, either in situ
or post-synthesis coatings. In the first approach, nanoparticles are coated during the
synthesis, and the most common polymer used is dextran which is a polysaccharide.
The possible mechanism of dextran adsorption on iron oxide might be the hydrogen
bonding between hydroxyl groups on dextran and the particle surface.26 The
advantages of using dextran as a stabilizer are its non-toxicity and biocompatibility. For
the post-synthesis coatings, ligands normally consist of two parts: the region that binds
to particle surface and the hydrophilic region that is exposed to aqueous media.
Polyethylene glycol (PEG) is commonly utilized for the post-synthesis coating due to its
hydrophilic and biocompatible properties. PEG can be modified with thiol, dopamine,
phosphate, or siloxane groups in order to provide iron oxide particles with high stability

22
and solubility as well as to block non-specific adsorption of unwanted molecules on the
particle surface.27
Coating with silica is one of the most common strategies for modifying the
surfaces of iron oxide nanoparticles. This coating not only provides high stability to
particles but also facilitates further surface functionalization. Silica coated MNPs can be
prepared by two general routes: the StÖber and reverse microemulsion methods. The
StÖber method is based on the formation of particles by hydrolysis of a silica precursor
(e.g., tetraethylorthosilicate, TEOS) in ethanol media containing water and ammonia as
the basic catalyst (Figure 1-2). MNPs have been incorporated into the silica matrix, and
the coating process can be completed within a few hours. It was observed that lower
concentrations of iron oxide nanoparticles induce larger colloids due to the presence of
fewer number of particle seeds.28,29 However, this route always yields large and non-
uniform particles.
The alternative method to prepare silica coated MNP is to use a microemulsion or
water-in-oil (W/O) microemulsion system, which has three main components: water, oil,
and surfactant (Figure 1-3).30,31 Water nanodroplets formed in the bulk oil phase act as
a confined medium for the formation of discrete nanoparticles. Iron oxide particles are
entrapped in the water pool and the size of particles can be tuned by controlling the
water-to-surfactant molar ratio (Wo). The microemulsion method takes 24-48 hours to
complete and yields monodispersed and highly uniform particles.
Another role of surface modification is to incorporate recognition elements, such
as, antibodies, oligonucleotides, or peptides that specifically bind with target molecules
for biological applications. Typically, biomolecules can be functionalized on particle

23
surfaces either by physical adsorption or covalent attachment. Physical adsorption
involves electrostatic, hydrophobic, hydrophilic, or van de Waals forces to associate the
desired molecules onto the particle surface. In general, covalent attachment of
biorecognition elements is preferred, not only to avoid desorption from the surface, but
also to control the number and orientation of the immobilized biorecognition probes.32
However, covalent attachment requires chemically reactive functional groups on the
particle surface, including amine, carboxyl, or thiol. These groups can be attached to the
surface either during or after post-coating for particle stabilization.
After naoparticles are functionalized, they can act as scaffolds for biological
moieties as demonstrated in the scheme (Figure 1-4). For example, carboxyl-modified
particles are suitable for covalent coupling of proteins and other amine-containing
biomolecules via cabodiimide chemistry. Disulfide-modified nanoparticles can be
immobilized onto thiol-functionalized particles by disulfide-coupling chemistry. Amine-
modified nanoparticles can be coupled with a wide variety of haptens and drugs via
succinimidyl esters and iso(thio)cyanates.33 After the bioconjugation step, the
nanoparticless can be separated from unbound biomolecules by centrifugation, dialysis,
filtration or other laboratory techniques.
Size, Shape, Magnetic properties and Surface Characterization
Since many properties of nanoscale materials depend on their physical
characteristics, it is necessary to define the size, shape, and polydispersity of
nanoparticles. Transmission electron microscopy (TEM), scanning electron microscopy
(SEM), and atomic force microscopy (AFM) are the most common techniques that are
utilized for size determination.34 The EM techniques can provide details about size,
shape, and size distribution. However, sample preparation can induce aggregation and

24
limited information is achieved for the dispersive nature of particles in solution. In
addition, dynamic light scattering (DLS) is a common technique used to obtain
information about both sizes and dispersion of particles in suspension. The
hydrodynamic radius corresponding to the sphere and the polydispersity of the colloid is
also obtained.35 X-ray diffraction (XRD) can also be used to indicate crystalline
structures of nanoparticles. The proportion of iron oxide particles can be quantified by
the peak intensities of the diffraction pattern compared to the reference peak intensities.
Furthermore, the crystal size can also be calculated from the broadening of the XRD
pattern.36,37
Another important parameter used for particle characterization is the surface
charge or zeta potential (ζ) which is affected by the environment including, pH and ionic
strength. The magnitude of the zeta potential indicates the repulsive force between
particles and can be used to predict the stability of a colloid. Particles in suspension
having high negative or positive zeta potentials tend to repel each other, resulting in a
low tendency to aggregate. Additionally, zeta potential measurement can be used to
verify surface modification or bioconjugation of the naoparticle surface. For example,
during the synthesis and modification processes, nanoparticle surface charge will be
changed according to the charge of the coordinated materials, such as polymers, DNA,
or proteins.
Magnetic Nanoparticles for Magnetic Resonance (MR) Based Assays
The ultimate goal of the development of biosensing platforms is to have far-
reaching implication in point-of-care clinical diagnostics, phamarceutical drug
development, and proteome research. In order to achieve robust, versatile, and high
throughput sensing platforms, the assay methodologies need to meet several

25
requirements: 1) high sensitivity and specificity, 2) minimized sample preparation, 3)
capability to analyze different types of target molecules with the same format and
instrument; and 4) feasibility for both single tube and high-throughput screening
formats.38
Magnetic nanoparticle-based biosensors have gained considerable attention due
to their unique advantages over other techniques. For example, magnetic nanoparticles
can be easily and cheaply synthesized and modified. They are physically and
chemically stable, as well as biocompatible. Additionally, magnetic nanoparticles have
strong magnetic properties, which are not found in biological systems. With no magnetic
background in biological samples, magnetic nanoparticle-based sensors can perform
highly sensitive measurements in turbid or obscured sample without any further
processing. In contrast, optical techniques are always affected by autofluorescence,
scattering, and absorption within samples.
To date, a number of biosensors based on magnetic measurement have been
developed. Several techniques, including superconducting quantum interference
devices (SQUIDs),39 magnetoresistive sensors,40,41 and Hall sensors42 directly detect
magnetic particles. Another technique that has receives considerable attention is
nuclear magnetic resonance (NMR) spectroscopy which can be translated into an
imaging technique called magnetic resonance imaging (MRI). Due to their noninvasive
character, both conventional NMR and MRI have been widely used in medical
applications for sample evaluation and characterization. In MRI, magnetic nanoparticles
are used as contrast agents, which provide signal enhancement as a result of the
interactions with neighboring water protons. Recently, another magnetic technique has

26
been developed to produce a new approach for in vitro diagnostics. This new assay,
termed “magnetic relaxation switches” (MRSw), has led to a new platform for sensors
with high sensitivity, selectivity, and feasibility in immuno- and molecular-diagnostics for
point-of-care detection.
Basic Concept of Magnetic Resonance Imaging (MRI)
When the nuclei of protons are exposed to a strong magnetic field (B0), their spins
align either parallel or antiparallel to the external magnetic field with a small excess
alligned parallel. The aligned spins precess with a net magnetic moment of M and a
Lamor frequency of ω0 = ɤB0 (ɤ is a gyromagnetic ratio of proton = 2.67 x 10⁸ rad·s-1·T-1)
as shown in Figure 1-5A. When a resonance radio frequency (RF) pulse is introduced
perpendicular to B0, the protons absorb energy and are excited to the antiparallel state
which has high energy. Net magnetization M as a vector has the components of Mz and
Mxy(Figure 1-5B). By removal of the RF, the excited spins gradually relax to their initial
or lower-energy state. There are two different relaxation pathways: longitudinal or T1
relaxation involves the recovery of magnetization (Mz) to the initial state by transfering
energy from the excited state to its surrounding (lattice), and transverse or T2 relaxation
involves the disappearances of magnetization in the perpendicular plane (Mxy) from the
loss of phase coherence of the nuclei spins in the xy plane due to spin-spin interactions
(Figure 1-5C and D). The relaxation processes are expressed as follows:
Mz = M(1-e-t/T1) (longitudinal) (1-3)
Mxy = Msin(ω0t + ɸ)e-t/T2 (transverse) (1-4)
where M is the net magnetization, ω0 is the Lamor frequency of protons, and T1 and T2
are the longitudinal and transverse relaxation times, respectively.
27
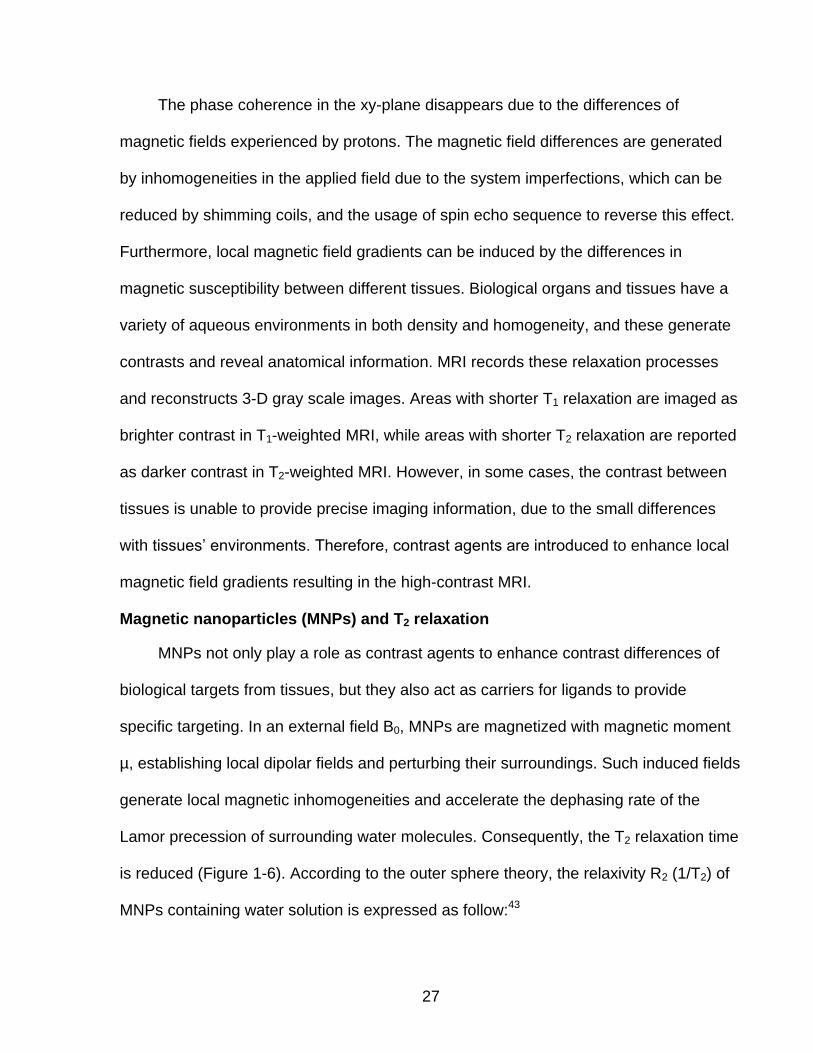
The phase coherence in the xy-plane disappears due to the differences of
magnetic fields experienced by protons. The magnetic field differences are generated
by inhomogeneities in the applied field due to the system imperfections, which can be
reduced by shimming coils, and the usage of spin echo sequence to reverse this effect.
Furthermore, local magnetic field gradients can be induced by the differences in
magnetic susceptibility between different tissues. Biological organs and tissues have a
variety of aqueous environments in both density and homogeneity, and these generate
contrasts and reveal anatomical information. MRI records these relaxation processes
and reconstructs 3-D gray scale images. Areas with shorter T1 relaxation are imaged as
brighter contrast in T1-weighted MRI, while areas with shorter T2 relaxation are reported
as darker contrast in T2-weighted MRI. However, in some cases, the contrast between
tissues is unable to provide precise imaging information, due to the small differences
with tissues’ environments. Therefore, contrast agents are introduced to enhance local
magnetic field gradients resulting in the high-contrast MRI.
Magnetic nanoparticles (MNPs) and T2 relaxation
MNPs not only play a role as contrast agents to enhance contrast differences of
biological targets from tissues, but they also act as carriers for ligands to provide
specific targeting. In an external field B0, MNPs are magnetized with magnetic moment
µ, establishing local dipolar fields and perturbing their surroundings. Such induced fields
generate local magnetic inhomogeneities and accelerate the dephasing rate of the
Lamor precession of surrounding water molecules. Consequently, the T2 relaxation time
is reduced (Figure 1-6). According to the outer sphere theory, the relaxivity R2 (1/T2) of
MNPs containing water solution is expressed as follow:43

28
R2 = 1
T2 = (
32π
405)γ2μ2(
NA M
1000rD)[6.5j
2(ωs) + 1.5j
1(ωi) + 2j
1(0)] (1-5)
where M is the molarity of MNPs, r is the MNP radius, D is the diffusion coefficient of
water, jn(ω) is the spectral density function, µ is transverse component of magnetic
moment of the MNP, ɣi is the gyromagnetic ratio of protons, NA is Avogadro’s number,
and ωs and ωi are the Larmor angular precession frequencies of the MNPs and the
water proton magnetic moments, respectively.
The spin-spin or T2 relaxation time is inversely proportional to the square of the
magnetic moment (µ) of MNPs as demonstrated in equation 1-5. As mentioned
previously, these values can be modulated by controlling characteristics of the MNPs,
such as size, shape, composition, and crystallinity. Smaller particles with higher
surface-to-volume ratios possess weaker magnetic moment due to the significant
canting effect on the surface. Such size effects have been demonstrated by Cheon et.
al. for Fe3O4 iron oxide nanoparticles.16 It was reported that the mass magnetization
value (Ms) increase from 68 to 191 emu/g(Fe) as the particle size increases from 6 to 12
nm (Figure 1-7A).
Compositional effects also have been demonstrated by doping with different
transition metals including Mn, Co, and Ni (Figure 1-7B). For example, the replacement
of octahedral site of Fe2+ in 12 nm iron oxide particles with Mn2+, Co2+, or Ni2+ results in
a change of Ms to 110, 99, to 85 emu/g, respectively. Higher magnetization of MNPs
results in stronger contrast effects and larger R2 relaxivity. As shown in Figure 1-7B,
doped iron oxide particles posses a variety of R2 ranging from 152 to 172, 218, and 358
mM-1s-1 for Ni, Co, Fe, and Mn, respectively.

29
When MNPs are in close proximity and agglomerate, their magnetic moments are
coupled and generate stronger local magnetic fields (Figure 1-8). The magnetic
coupling effect directly influences the MR contrast by accelerating the proton dephasing
rate. The increase of R2 relaxivity is expressed as:43
R2 =1T2
= ( 64π135
)(L(x)μNg
4π)2 CANA
RAD (1-6)
where µ is magnetic moment of MNPs, Ng is number of MNPs in agglomerates, L(x) is
Langevin function, NA is Avogadro’s number, CA is the concentration of agglomerates,
RA is radius of an agglomerate, and D is the water diffusion coefficient.
According to equation 1-6, R2 is proportional to µ and Ng. Consequently, the
magnetic coupling effect significantly improves the sensitivity of magnetic resonance
sensing, where the MR signal contrast changes depending on the relative concentration
of the assembled states of MNPs. Based on this strategy, MNPs have been extensively
used in cancer research. It is well known that nanoparticles can be accumulated
spontaneously in tumor sites by the enhanced permeability and retention (EPR) effect,
which enhances the accumulation of nanoparticles in tumor tissues that have abnormal
blood vessels.44 As a consequence, MNPs have been successfully used to image
tumors without any targeting probes, called “passive targeting”.45 However, in order to
improve imaging efficiency, surfaces of MNPs are conjugated to active targeting probes
such as antibodies, proteins, and aptamers. For example, iron oxide nanoparticles are
conjugated with specific antibodies to image tumors by the interactions with surface
protein receptors that are overexpressed in gliomas,46 breast,47 and colon cancers.
Moreover, multifunctional nanoplatforms fabricated by combining various materials to
perform different functions, allow multimodal imaging, including simultaneous diagnosis

30
and therapy. For example, Fe3O4-Au dumbbell particles were applied to cancer-targeted
MR and reflection imaging.48
Magnetic Relaxation Switches (MRSw)
Recently, Weissleder and coworkers demonstrated MR based assays called
Magnetic Relaxation Switches (MRSw), which allow detection by the change of T2
induced by magnetic particles. The principle of MRSw assays is demonstrated in Figure
1-9. As illustrated, magnetic particles switch between the dispersed and aggregated
states when the target molecule bind with ligands conjugated on magnetic particles’
surfaces. The presence of multiple ligands on particles’ surfaces induces multivalent
affinity, resulting in multiple interactions between the conjugates and their
corresponding targets. The change of spin-spin or T2 relaxation time is associated with
the degree of aggregation similar to conventional MRI. Magnetic particles used for
MRSw assays are either MNPs or micrometer-sized magnetic particles (MMPs). Since
the dispersed and aggregated states of magnetic particles can be reversed by external
stimuli such as pH, salt concentration, and concentration of competing analytes, these
assays are referred to as relaxation switches.
The MRSw provides various unique properties. (1) Because detection is not
dependent on light (no fluorescence, absorbance, turbidity, or chemiluminescence),
analytes interfering with light do not affect the assay, and the experiment can be carried
out in turbid and heterogeneous samples. (2) The washing step is not needed to
remove unbound analytes, thereby minimizing the analysis time. (3) The assay does not
require surface immobilization of biomolecules on a glass slide, thus minimizing the
complexity of the preparation steps. (4) The assay is flexible and can detect various
31
kinds of biomolecular interactions, including protein-DNA interactions, protein-small
molecule interactions, and protein-protein interactions.
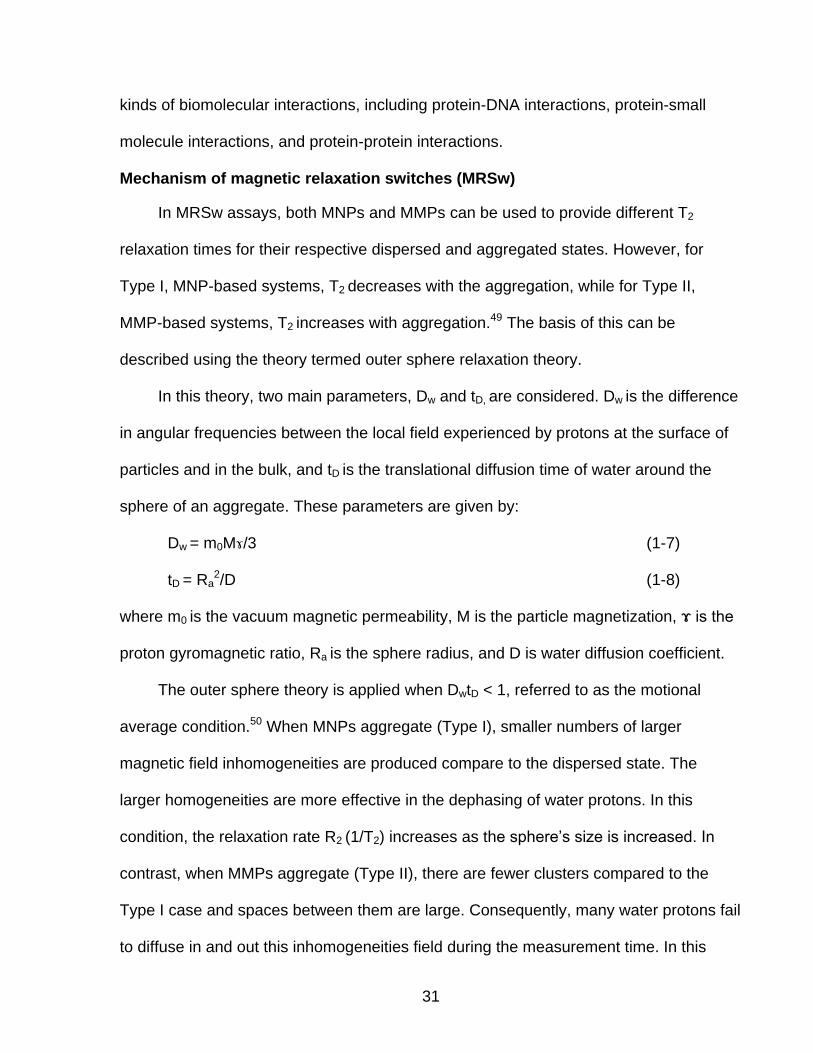
Mechanism of magnetic relaxation switches (MRSw)
In MRSw assays, both MNPs and MMPs can be used to provide different T2
relaxation times for their respective dispersed and aggregated states. However, for
Type I, MNP-based systems, T2 decreases with the aggregation, while for Type II,
MMP-based systems, T2 increases with aggregation.49 The basis of this can be
described using the theory termed outer sphere relaxation theory.
In this theory, two main parameters, Dw and tD, are considered. Dw is the difference
in angular frequencies between the local field experienced by protons at the surface of
particles and in the bulk, and tD is the translational diffusion time of water around the
sphere of an aggregate. These parameters are given by:
Dw = m0Mɤ/3 (1-7)
tD = Ra2/D (1-8)
where m0 is the vacuum magnetic permeability, M is the particle magnetization, ɤ is the
proton gyromagnetic ratio, Ra is the sphere radius, and D is water diffusion coefficient.
The outer sphere theory is applied when DwtD < 1, referred to as the motional
average condition.50 When MNPs aggregate (Type I), smaller numbers of larger
magnetic field inhomogeneities are produced compare to the dispersed state. The
larger homogeneities are more effective in the dephasing of water protons. In this
condition, the relaxation rate R2 (1/T2) increases as the sphere’s size is increased. In
contrast, when MMPs aggregate (Type II), there are fewer clusters compared to the
Type I case and spaces between them are large. Consequently, many water protons fail
to diffuse in and out this inhomogeneities field during the measurement time. In this

32
condition, the motional average is not fulfilled and the relaxation rate decreases with the
formation of aggregates. Here DwtD > 1, referred to diffusion limited case.
MRSw based biosensors achieve the selectivity and specificity for desired
molecular targets by attachment of binding moieties such as antibodies or aptamers to
magnetic particles. Therefore, the basis of the transition between dispersed and
aggregated states is the affinity of ligands on the particles’ surfaces for specific
analytes. The density of ligands can be optimized to achieve fast reaction rates and
high detection sensitivities.51 As in conventional MRI, other parameters such as particle
types, sizes, and concentration also influence the change of T2.
Instrumentation for MRSw
MRSw based sensors can benefit a variety of applications including home and
clinical diagnostics, proteome research, bio-warfare, and industrial analysis. Such
applications require simple, automated, robust, and high throughput instrumentation. A
key component for facilitating successful applications is tailoring the processing and
detection platforms. Currently, most MRSw assays in laboratory and industrial scenarios
depend on bench top relaxometers. High throughput MRSw assays also have been
demonstrated using 384-well plates and an MR scanner for multiplex detections.52
However, the bench top relaxometer and MR scanner are still impractical for point-of-
care detection due to their high cost and bulkiness. Recently, miniaturized MR
relaxometers have been fabricated by Lee and coworkers.53,54 The system consists of a
small palm-sized permanent magnet and on-board NMR electronics and planar
microcoils with integrated microfluidic channels. Multiplexed detection of biomarkers
was demonstrated for high throughput MRSw assays.

33
MRSw based biosensors offer unique advantages over other techniques, such as
a simple assay format, feasibility in biological detection without a separation or
amplification step, high throughput capacity, and board applications to detect and profile
different types of targets. Taking these advantages, this technology has potential
applications in biomedicines, cancer biology and proteomic research. Through the
development of the chip-based MR devices, clinic and other point of care diagnostics
are possible.
Nucleic Acid Probes
Nucleic acids play important roles in transferring genetic information through
generations and act as key elements for proliferation. The main components of nucleic
acids consist of several nucleotides sharing the same backbone structure but different
bases (Figure 1-10). Various sequences generated from different assemblies of bases
contribute to the specific interaction with complementary oligonucleotides forming a
double helix structure. Furthermore, structural folding of single-stranded
oligonucleotides provides molecular recognition abilities for a variety of biological
targets. Particularly, Watson-Crick type hydrogen-bonds, electrostatic forces, π-stacking
bonds, and hydrophobic interactions enable the design of molecular probes for signaling
biomolecular interactions. Compared with traditional recognition, such as host-guest
chemistry, or protein interactions, molecular recognition using nucleic acids is flexible,
and can be easily modified. Consequently, various types of biosensors and medical
diagnostic tools have been developed based upon the special recognition properties of
nucleic acids.55-58 Especially, when combined with the extraordinary properties of
nanoparticles, theses hybrid materials demonstrate broad application as powerful
molecular recognition tools.3,59,60

34
In addition, nucleic acids, especially DNA, are ideal building blocks for the design
and assembly of nanostructures, due to the strong and highly specific base-pairing of A-
T and G-C interactions (Figure 1-11). Besides duplex formation, self-assembled
structural motifs of DNA are also available, such as G-quadruplexes, i-motif, or hairpin
structures.61,62 The diversity of structural patterns allows use of DNA as templates for
the bottom-up construction of 2D and 3D-nanostructures.63,64 Beyond the use of DNA
for nano-assembly, DNA can be utilized as dynamic molecules that duplicate
mechanical devices, e.g., switches, tweezers, and motors.65-68 Because these DNA
nanomachines have the benefits of precise controllability, biocompatibility, and
reproducibility, they can be utilized for the development of synthetic molecular
machines.
The following sections focus mainly on the use of nucleic acids as selective
biorecognition elements. In particular, specific oligonucleotides termed aptamers, and
the selection process called Systematic Evolution of Ligands by Exponential enrichment
(SELEX) will be discussed, as well as DNA probes which can be designed, and
engineered as molecular machines.
Selective Biorecognition Elements
Several diseases, especially cancer, are associated with specific biomarkers. The
key to develop diagnostic and therapeutic tools is an understanding of the molecular
recognition of disease-specific biomarkers. Since potential biomarkers encompass
different types of molecules, ranging from glycolipids to proteins, it is necessary to
identify molecular probes that are able to bind selectively with these molecules.
However, long periods of time and considerable efforts are required for the identification
and separation of biomarkers and their corresponding probes. The two most important

35
classes of biorecognition elements utilized as molecular probes are antibodies and
aptamers.
Antibodies are proteins produced by the immune system when triggered by foreign
proteins or microorganisms defined as antigens.69 Typically, antibodies consist of two
basic structural units, called the heavy and light chains. However, the antigen-binding
sites of each type of antibody are very unique and allow selective binding with a
particular epitope on an antigen. Generally, antibodies can be generated by injecting
antigen into animals and isolating the antibodies from their blood. After isolation and
purification, antibodies are commonly used to identify, locate, and separate both
intracellular and extracellular proteins. They are also utilized to differentiate cell types
according to the expressed proteins. However, the application of antibodies as
molecular recognition elements sometimes is limited due to their lack of reproducibility,
sensitivity to environmental conditions, difficulty in chemical modification, and short shelf
life.
Recently, a new type of selective recognition ligands termed aptamers has been
introduced to identify wide variety of targets. Aptamers are single-stranded
oligonucleotides that can selectively recognize target cells, proteins, peptides, small
molecules, and ions.70,71 The binding affinities of aptamers to their targets are
comparable to those of antibodies and range from 10-12M to 10-8M. The high specificity
of aptamers, which can distinguish even homologous proteins, derives from their
complex three-dimensional structures. Aptamers have shown great promise in
molecular recognition for diagnostic and therapeutic applications. Moreover, aptamers
36
have advantages over antibodies due to their reproducibility, ease of synthesis and
modification, low toxicity or immunogenicity, and long shelf life.
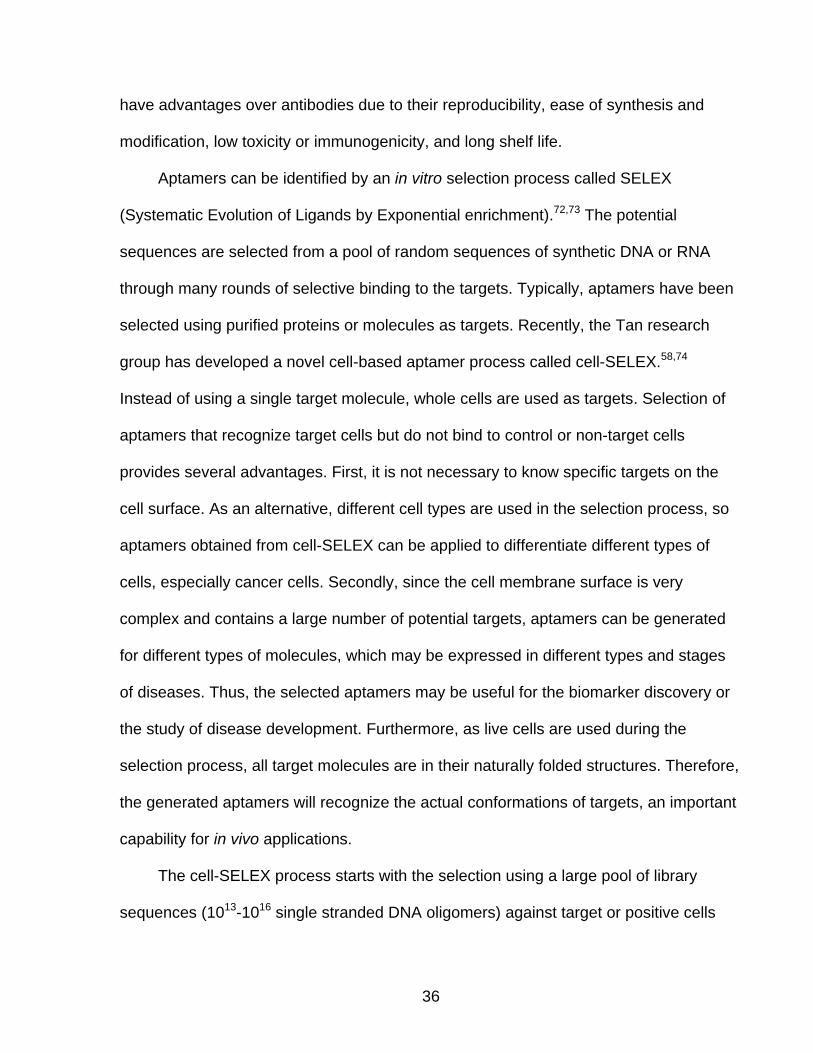
Aptamers can be identified by an in vitro selection process called SELEX
(Systematic Evolution of Ligands by Exponential enrichment).72,73 The potential
sequences are selected from a pool of random sequences of synthetic DNA or RNA
through many rounds of selective binding to the targets. Typically, aptamers have been
selected using purified proteins or molecules as targets. Recently, the Tan research
group has developed a novel cell-based aptamer process called cell-SELEX.58,74
Instead of using a single target molecule, whole cells are used as targets. Selection of
aptamers that recognize target cells but do not bind to control or non-target cells
provides several advantages. First, it is not necessary to know specific targets on the
cell surface. As an alternative, different cell types are used in the selection process, so
aptamers obtained from cell-SELEX can be applied to differentiate different types of
cells, especially cancer cells. Secondly, since the cell membrane surface is very
complex and contains a large number of potential targets, aptamers can be generated
for different types of molecules, which may be expressed in different types and stages
of diseases. Thus, the selected aptamers may be useful for the biomarker discovery or
the study of disease development. Furthermore, as live cells are used during the
selection process, all target molecules are in their naturally folded structures. Therefore,
the generated aptamers will recognize the actual conformations of targets, an important
capability for in vivo applications.
The cell-SELEX process starts with the selection using a large pool of library
sequences (1013-1016 single stranded DNA oligomers) against target or positive cells

37
(Figure 1-12). Subsequently, the negative or non-target cells are used to exclude
oligomers with non-specific interactions, making the selected sequences specific to the
target cells. The selected sequences are washed and purified in order to retain only the
ones binding tightly to the target cells, and eliminate unbound or weakly bound
sequences. Subsequently, the bound sequences are recollected and amplified by the
polymerase chain reaction (PCR) for the next round of selection. After several rounds of
repetitive selection, a group of aptamers will be obtained and further tasted for their
affinity and specificity.
DNA Molecular Machines
Besides the fascinating properties in selective recognition of specific targets, DNA
has also gained attention in material science and nanotechnology. Based on the
structural flexibility, and specific base-pair formation, DNA is programmable and
designable, and thus can be used as a structural building block. Pioneered by Seeman
et.al. in the 1980s, 2D and 3D DNA nanostructures have been assembled.8,63,75 DNA
has also been converted into dynamic molecules that can perform nanoscale
movements. Although, proteins are the naturally selected materials for motions in living
organism, the simplicity of structure, diversity of self-assembly, and automated
synthesis make DNA the most promising molecule that can duplicate machine
functions. DNA-based nanomachines can be delivered into several categories,
depending on their motions as switches, walkers, or motors.
DNA switches
A molecular switch or actuator is one of the simplest nanodevices which can
switch between two conformations. One of the original DNA switches consists of
double-stranded DNA with the sequence (CG)n and can be flipped from the normal

38
right-handed helix (B-DNA) to the left-handed conformation (Z-DNA). This
conformational change is triggered by high salt concentration and low temperature
(Figure 1-13A).76,77 The transition could be tracked by Fӧrster Resonant Energy
Transfer (FRET), since a reporter fluorophore was intercalated in each tile.
Instead of environmental changes, the addition of DNA strands can also induce
the switching of DNA nanostructures. A pair of DNA tweezers with two rigid double-
stranded arms was constructed (Figure 1-13B).10 The additional single-stranded DNA
can bind with the extended tails of both arms and transform the DNA tweezers from the
“open” to the “closed” state. Another “anti-fuel” strand which is a complementary to a
“fuel” strand was added and triggered DNA migration, returning it to the initial open
state.
DNA walkers
One of the most sophisticated tasks of DNA-nanomachine design and construction
is the control of linear motion in a defined direction. To achieve this goal, another type of
molecular device, termed a DNA walker, was created. Typically, a DNA walker is
temporarily bound to a nucleic acid track. By sequential addition of DNA strands,
dissociation and re-association of the walker to the next single-stranded anchor
occurred (Figure 1-13C).12 By appropriate design of the hybridizing nucleic acid allows
stepwise translocation in unidirectional movement. Labeling of the walker’s legs and
footholds with a fluorophore and quencher facilitates the real time visualization of the
DNA walker’s motion, and the movement can also be further confirmed using gel
electrophoresis.

39
DNA motors
Biological motors that use free energy from hydrolysis of adenosine tri-phosphate
(ATP) to drive the movement can move with very fast speeds (up to 60 µms-1) and long
travelling distances (up to 1µm).78 Inspired by biological motors such as myosin,
kinesin, and dynein that move along cytoskeleton networks, DNA nanomotors have
been constructed. Previously, three different energy sources for synthetic DNA
nanomotors including hydrolysis of ATP and the DNA backbone as well as DNA
hybridization, have been explored. Yin and co-workers demonstrated a nanomotor that
passes its cargo autonomously from one anchor to the next by enzymatic ligation and
hydrolysis (Figure1-13D).13 The designed sequences were recognized by restriction
enzymes to provide uni-directional movement and prevent dissociation of the cargo
from the track. In the mean time, DNA nanomotors driven by the catalysis of DNA
hybridization as an energy source were developed (Figure 1-13E).79 Generally, their
operating cycles involve a conformational change triggered by the addition of fuel DNA,
which is later removed by hybridization with the complementary anti-fuel strands. The
duplex between fuel and anti-fuel strands are waste products generated in every cycle
of operations. The entire processes are driven by the decrease in free energy on
forming additional base pairs, much like ATP hydrolysis.80 Furthermore, various DNA
nanomotors have been developed using alternative energy sources, such as ions,
protons, light, and small molecules.81-84
In addition to the construction of stable, powerful, and simple DNA nanodevices,
the most important requirement is to achieve machines that can do practical work.
Currently, DNA has been proven to be a potential material for the realization of synthetic
molecular machines. DNA devices have been designed to perform functions such as,

40
sensing molecules, directing chemical reactions, driving objects, and controlling
released molecules. A future accomplishment could be the combination of a DNA
computer, DNA nano-mechanics, and DNA nano-electronics, etc. The further
development of this field may have great impact in nanobiotechnology and biomedical
applications.
Fluorescence Techniques for Signal Transduction
During the few past decades, fluorescence has played significant roles in
biological sciences. Fluorescence spectroscopy is considered to be a primary research
tool in biotechnology, biomedical diagnostics, and nanotechnology. Because of its high
sensitivity, ease of sample handling, and multiplexing capability, fluorescence is widely
used for signal transduction, as well as cellular and molecular imaging. Fluorescence
results from a multi-stage process involving fluorescent substances called fluorophores.
Jablonski Diagram
The processes involved in fluorescence are illustrated by the Jablonski diagram85
(Figure 1-14), which is named after Professor Alexander Jablonski. In particular, the
singlet ground, first, and second electronic states are depicted by S0, S1, S2,
respectively, while T1 stands for the triplet state. Each of these electronic energy levels
consists of discrete vibrational energy levels with vibrational quantum numbers 0, 1, 2,
etc. A fluorophore is typically excited by photons to a higher vibrational level of either S1
or S2, depending on the magnitude of the absorbed energy. The excitation process
happens in a very short time (ca 10-15s). After light absorption, some molecules in
excited state, S1 for example, rapidly relax to the lowest vibrational level of S1. This
process is called internal conversion which generally occurs within 10-12s. In this
process, energy is transferred as heat by collisions with surrounding molecules. The

41
excited molecules can then relax from the lowest energy vibrational state of S1 to
ground state S0 with emission of photons referred to fluorescence. The average time for
a molecule to stay in an excited state is referred to as the fluorescence lifetime, typically
about 10-8s. Due to the closely spaced vibrational energy levels of the ground state
coupled with thermal motion, a wide range of photon energies is produced during
emission. Consequently, fluorescence is normally observed as emission over a band of
wavelengths instead of a sharp line. Most fluorophores can repeat excitation and
emission up to hundreds or thousands times before the excited state molecules are
destroyed. Molecules in the S1 state can also undergo a spin conversion to the first
triplet state, T1, by a process called intersystem crossing. The relaxation from T1 to S0
with emission of photons is referred to as phosphorescence. Generally, the transition
from the triplet excited state to the singlet ground state is forbidden. Therefore, rate
constants for phosphorescene are several orders of magnitude smaller than those of
fluorescence. Additionally, a small fraction of energy is always lost during vibrational
relaxation, resulting in an energy difference between the absorbed and emitted energy.
Thus, the emission spectrum of a fluorophore generally appears at longer wavelength or
lower energy than absorption. This phenomenon, called the Stoke’s shift,allows the
spectral separation of the excitation and emission of photons for sensitive studies.
Fluorescence Quenching
Fluorescence quenching refers to any process that decreases the fluorescence
intensity of a sample, and can be caused by a variety of molecular interactions.
Basically, there are two main types of quenching: collision or dynamic quenching and
static quenching.85 Both dynamic and static quenching requires molecular contact
between fluorophore and quencher.

42
In the case of dynamic quenching, the quencher diffuses to the fluorophore while it
is in the excited state. By the contact, the fluorophore relaxes to the ground state
without emission of a photon. In general, dynamic quenching occurs without a chemical
reaction. The collisional quenching of fluorescence can be described by the Stern-
Volmer equation:
F0/F = 1+ kqτ0[Q] = 1+ K[Q] (1-9)
where F0 and F are the fluorescence intensities in the absence and presence of
quencher, respectively; kq is the bimolecular quenching constant; τ0 is the lifetime of the
fluorophore in the absence of quencher, and Q is the concentration of quencher. The
Stern-Volmer quenching constant is given by K= kqτ0.
One of the best-known dynamic quenchers is molecular oxygen, which can
quench most of fluorophores. Other types of collisional quenchers include hydrogen
peroxide, nitric oxide, nitroxide.86,87
For static quenching, the mechanism relates to the formation of a nonfluorescent
complex between the fluorophore and the quencher. When the complex absorbs light, it
returns to the ground state immediately without photon emission. The effect of static
quenching is related to the observed fluorescence intensities by:
F0/F = 1+ K[Q] = 1+[FQ]/[F][Q] (1-10)
where K is the complex formation constant; [FQ], [F], and [Q] are the concentrations of
the complex, fluorophore, and quencher, respectively.
The most effective method to distinguish static and dynamic quenching is the
measurement of fluorescence lifetime. In static quenching, the complex fluorophores
are nonfluorescent, and the only observed fluorescence comes from the uncomplexed
43
fluorophores, which are unperturbed. Therefore, the lifetime remains the same as
before quenching. In contrast, dynamic quenching involves depopulation of excited
state, resulting in the equivalent ratio between lifetime and fluorescence intensity (F0/F =
τ0/τ). Another additional method to distinguish static and dynamic quenching is
measurement of the absorption spectra of the fluorophores. For collisional quenching,
only the excited states of fluorophores are affected, hence there is no change in
adsorption spectra. While the complex formation of static quenching causes ground
state perturbations, resulting in changes in absorption bahavior.
Quenching plays a significant role in sensors for molecular biology. A wide variety
of analytes, including oxygen, ions, and heavy metals have been sensed using the
fluorescence quenching mechanism.88,89 Fluorescence quenching can also be utilized to
determine the fraction and conformational change of proteins.90,91 Moreover, target DNA
has been analyzed through fluorescence quenching using a variety of oligonucleotide
probes, such as molecular beacons (MB), ribozymes, and DNAzymes. Many
fluorophore/quencher pairs are intercalated in these probes to track the conformational
changes due to the binding of analytes. Examples of well-known fluorophore/quencher
pairs include tetramethylrhodamine(TMR)/DABCYL, fluorescein/DABCYL,
EDANS/DABCYL, fluorescein/TMR.92
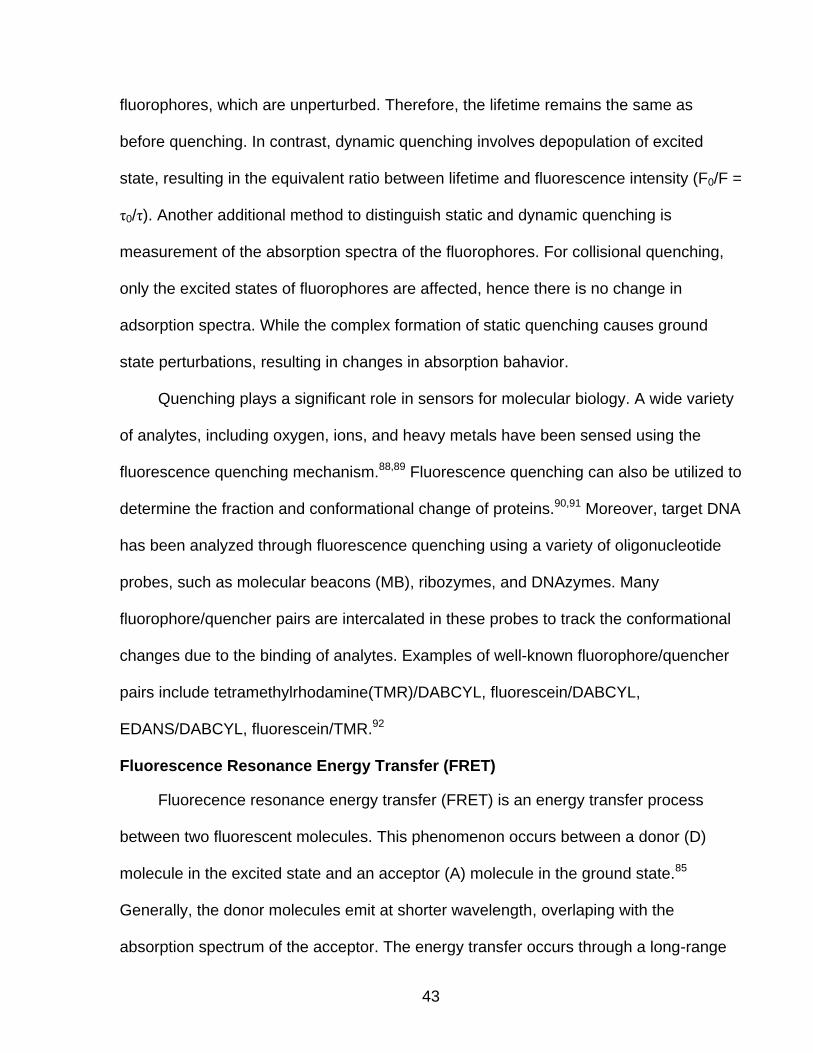
Fluorescence Resonance Energy Transfer (FRET)
Fluorecence resonance energy transfer (FRET) is an energy transfer process
between two fluorescent molecules. This phenomenon occurs between a donor (D)
molecule in the excited state and an acceptor (A) molecule in the ground state.85
Generally, the donor molecules emit at shorter wavelength, overlaping with the
absorption spectrum of the acceptor. The energy transfer occurs through a long-range

44
dipole-dipole mechanism between the donors and acceptors without photon transfer.
The rate of energy transfer depends upon the extent of spectral overlap of the donor
emission with the absorption spectrum of the acceptor, the distance between the donor
and acceptor, the relative orientation of the donor and acceptor transition dipoles, and
the quantum yield of the donor. Typically, the energy transfer occurs within a distance of
100Å. The FRET efficiency is described as followed:
E = R06/( R0
6 + r6) (1-11)
where the Fӧrster radius R0 is the distance at which energy transfer is 50% efficient,
and r is the distance between donor and acceptor.
As shown in equation 1-11, FRET is a distance-dependent process. Generally,
Fӧrster distances range from 20-60 Å, which is comparable to the size of biological
macromolecules. Consequently, FRET has been widely used as a “spectroscopic
ruler”93 to measure the distance between two sites on a macromolecule, especially a
protein. FRET has been used to measure conformational change of proteins, distance
between a site on a protein and a membrane surface, association between protein
subunits, and association of membrane-bound proteins.94-96 Furthermore, FRET is
extensively used in oligonucleotide analysis. Due to the ability to form three-dimensional
structures of DNA and RNA, FRET is used to track the conformational changes. Based
on this strategy, a number of molecular probes, molecular beacon for example, has
been developed using a DNA labeled with a donor/acceptor pair.97-99 DNA hybridization
and many bioaffinity reactions are observed using FRET measurements.

45
A
aligned interior spins
canted surface spins
B nanoparticle
size
canted surface
spins
net magnetic
moment
MRI T2 contrast
effect
Figure 1-1. Nanoparticle size effects on magnetism. (A) Canted spins appear on the surface surrounding core magnetic atoms. (B) Relationship between surface to volume ratio and size, canted surface spins, net magnetic moment, and T2
contrast effect.
Si
OEt
OEt
OEtEtO Si
OH
OH
OHHO Si O Si
condensationhydrolysis
EtOH, NH4OH
doped silica nanoparticle
Figure 1-2. Scheme representing the StÖber process.

46
TEOS
NH4OH
doped silica
nanoparticle
reverse micelle
water pool
(nanoreactor)
Iron oxide
oil
surfactant molecules
Figure 1-3. Scheme representing a water-in-oil (W/O) microemulsion system.
Figure 1-4. Representative bioconjugation schemes for attaching biomolecules to NPs for bioanalysis.33

47
B0
ω0 = ɤB0
ω0 = Larmor frequency
ɤ = gyromagnetic ratio
B0 = magnetic fieldX
Z
Y
MZ
MXY
MZ MXY
tt
Figure 1-5. Principal of magnetic resonance imaging (MRI).100 A) Spins align parallel or antiparallel to the magnetic field; small excel parallel to B0 produces net magnetization in the Z direction. B) After the RF pulse, magnetization of spins changes. C) T1 relaxation and D) T2 relaxation.
Local dipolar
Field perturbation
slow T2 relaxation fast T2 relaxation
weak strong
T2 MRI
contrast
effect
Figure 1-6. The role of magnetic nanoparticles as contrast agents.4 A) T2 relaxation mode without MNPs. B) T2 relaxation in the presence of MNPs.

48
6 9 12 nm
TEM
68 85 101mass
magnetization
(emu/g(Fe))
MRI
MnMEIO (MnFe2O4)
MEIO (FeFe2O4)
CoMEIO (CoFe2O4)
NiMEIO (NiFe2O4)
Ms
(emu/g (M+Fe))
MR
co
ntr
ast
eff
ect,
R2
(m
M-1
s-1
)
Figure 1-7. Magnetic nanoparticle size and dopant effects on mass magnetization (Ms) and MRI contrast enhancement.4

49
nanoparticle
aggregation
magnetic
nanoparticle
strongweakMR
signal
exte
rnal
field
(B
0)
weakly induced
magnetic field
strongly induced
magnetic field
Figure 1-8. Magnetic nanoparticle aggregation effects on MRI.4
Figure 1-9. Principle of magnetic relaxation switches (MRSw).

50
Figure1-10. DNA and RNA structures formed by phosphodiester linkages.
Base pairs
Sugar phosphate
backbone
Figure 1-11. Structure of DNA double helix and base pairing.

51
Figure 1-12. Schematic representation of DNA aptamer selection using the cell-SELEX strategy.74
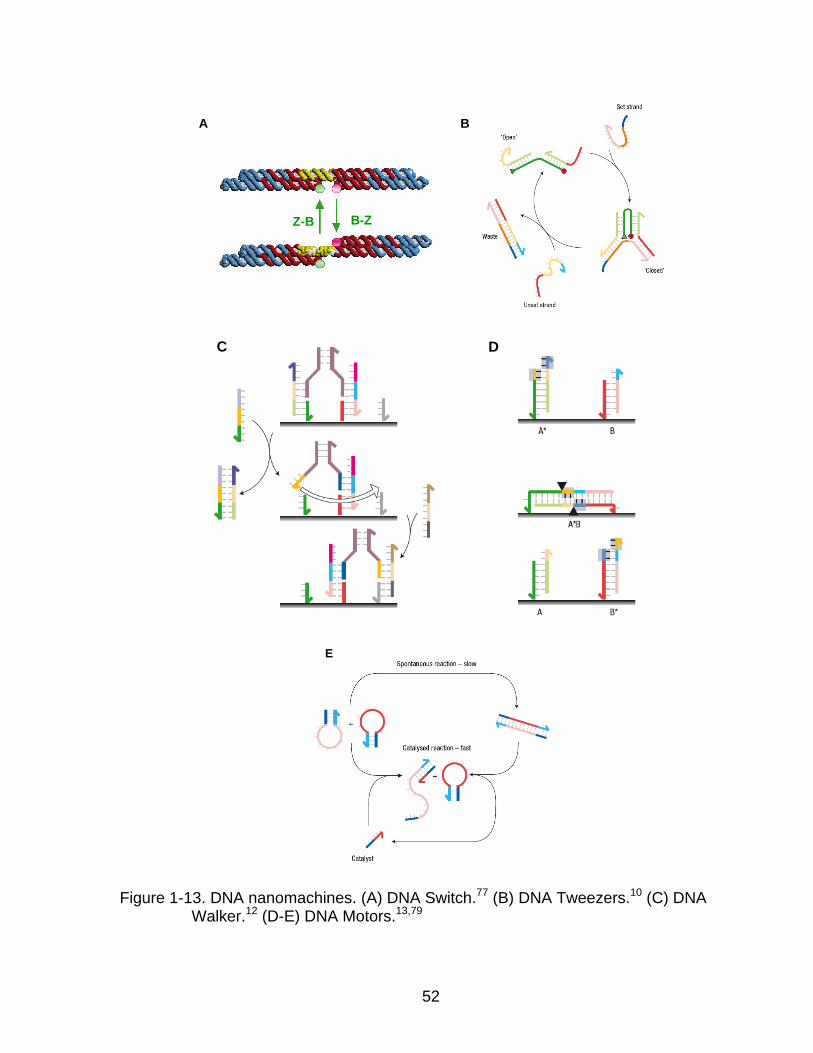
52
A B
Z-B B-Z
C D
E
Figure 1-13. DNA nanomachines. (A) DNA Switch.77 (B) DNA Tweezers.10 (C) DNA Walker.12 (D-E) DNA Motors.13,79

53
3
2
1
0
3
2
1
0
3
2
1
0
3
2
1
0
S0
S1
S2
T1
Absorption
Internal conversion
Intersystem
crossing
Fluorescence
Phosphorescence
Figure 1-14. Jablonski diagram.
Wavelength (λ)
Inte
ns
ity
Donor
AbsorptionDonor
Emission
Acceptor
Emission
Acceptor
Absorption
Overlap
Integral Sensitized
Fluorescence
Donor AcceptorExcitation
Emission
r
FRET
Figure 1-15. Schematic representation of FRET donor and acceptor spectra.

54
CHAPTER 2 MOLECULAR PROFILING OF CANCER CELLS USING APTAMER-CONJUGATED
MAGNETIC NANOPARTICLES
Introduction
Because each type of cancer cell has specific intracellular or extracellular
biomarkers which distinguish it from non-cancerous cells, a detection method must be
able to recognize the given biomarker and bind to it with high sensitivity and specificity.
Recently, a new class of ligands, known as aptamers, has been isolated and identified
for such specific tumor cell recognition. Aptamers are single-stranded polynucleotides,
which recognize specific molecular targets with high affinity and selectivity.101 They are
obtained through an in vitro selection process, systematic evolution of ligands by
exponential enrichment (SELEX), against a variety of targets, including ions, proteins,
and cells.102,103 Typically, antibodies are used to detect protein targets, but aptamers
have several demonstrated advantages over antibodies, such as ease of manipulation,
reproducible synthesis, good stability and non-toxicity. Moreover, these properties make
aptamers excellent candidates for biochemical sensors, signal transduction, and
targeted therapeutic applications.56,104,105
To date, several types of nanoparticles have been developed for point-of-care
applications using optical signals. However, many of these nanoscale materials, such
as quantum dots and dye-doped or gold nanoparticles, are subject to significant
background interference by scattering, absorption or autofluorescence within samples,
which limits high-sensitivity detection. In contrast, the signals from magnetic
nanoparticles (MNPs), are not present in biological samples, resulting in the absence of
background noise and, hence, high detection sensitivity. Specifically, the conjugation
between aptamers and MNPs, or aptamer-conjugated magnetic nanoparticles

55
(ACMNPs), constitutes a novel kind of magnetic nanosensor, combining the specific
binding ability of aptamers and their easy bioconjugation to solid surfaces, and the large
surface areas of MNPs for multivalent interactions.
The detection mechanism of ACMNPs in solution is based on the change of spin-
spin relaxation time, or ΔT2, of protons in water. The assembly of ACMNPs upon
specific binding with their target cells leads to cluster formation, thereby inducing
coupling of magnetic spin moments generating strong local magnetic fields (Figure 2-
1A).38,49,106 At the same time, such local magnetic fields generate inhomogeneities that
accelerate the spin-dephasing of surrounding water protons, which results in a decrease
in the proton spin-spin relaxation time (T2). Moreover, MNPs are known to enhance the
magnetic resonance (MR) signal of protons from surrounding water molecules.107-109
Under these circumstances, aggregation can be detected by a change in proton
relaxation time (ΔT2), corresponding to the binding event between ligand-conjugated
MNPs and target molecules. This phenomenon has led to the development of magnetic
relaxation switches (MRSw) for the detection of molecular targets, such as DNA, RNA,
proteins, bacteria, viruses, small molecules, and enzymatic activity.110-114
Based on previous studies, some cancer biomarkers are not restricted to a single
cell type; rather, they are expressed in different cell types or at different developmental
states of cancer cells.115 Thus, multiple cell types at different physiological stages of
cancer may show binding towards the same ligand, but with different affinities,
depending on the level of biomarker expression. A methodology able to analyze various
cancer cells, both qualitatively and quantitatively, can lead to the development of a
cancer cell profile and thus greater understanding of cancer pathogenesis and the

56
potential efficacy of new therapeutic modalities. By using an array of ACMNPs, various
cell types can be differentiated through pattern recognition (Figure 2-1B). A distinct
pattern of responses generated from a set of ACMNPs would provide a cellular profile
allowing clinicians to accurately classify and identify cancer cells at the molecular level.
In the following discussion, we will demonstrate the specificity of ACMNPs to their
target, explain and demonstrate the viability of MRSw, particularly in complex media,
and show that ACMNPs arrays can recognize and differentiate various cell types and,
by so doing, can create a distinct pattern recognition profile for various cancer cells.
Experimental Section
Synthesis of DNA Aptamers
The aptamers with strong affinities toward their intact tumor cells were selected by
cell-SELEX and were chosen as demonstrated in Table 2-1. All aptamers were
synthesized using standard phosphoramidite chemistry with an ABI3400 DNA/RNA
synthesizer (Applied Biosystems, CA). Biotin core pore glass (CPG) from Glen
Research was used for the synthesis. After the synthesis, the aptamers were
deprotected in concentrated AMA (1:1 mixture of ammonium hydroxide and aqueous
methylamine) solution at 65°C for 30 min prior to further purification with reversed phase
high-pressure liquid chromatography (RP-HPLC). RP-HPLC was performed on a
ProStar HPLC Station (Varian, CA) equipped with a fluorescent and a photodiode array
detector using a C-18 column (Econosil, C18, 5 µM, 250 x 4.6 mm) from Alltech
(Deerfield, IL). The eluent was 100mM triethylamine-acetic acid buffer (TEAA, pH 7.5)
and acetonitrile (0-30min, 10-100%). The collected DNA products were dried and
detritylated with acetic acid. The detritylated aptamers were precipitated with ethanol
and dried with a vacuum drier. The purified aptamers were then dissolved in DNA-grade
57
water and quantified by determining the UV absorption at 260 nm using a UV-Vis
spectrometer (Cary Bio-300, Varian, CA).
Aptamer-Nanoparticle Conjugation
In order to prepare aptamer-conjugated magnetic nanoparticles (ACMNPs), 30 nm
streptavidin-coated iron oxide nanoparticles (Ocean Nanotech) were dispersed at 0.1
mg/mL in 100mM phosphate-buffered saline (PBS), pH 7.4. An excess amount of biotin-
labeled aptamer was then added to the streptavidin-coated MNPs solution. The mixture
was vortexed at room temperature for 1 h followed by three washings with PBS buffer
using centrifugation at 14000 rpm to remove any aptamers that did not conjugate to the
MNPs. Zeta potential measurements were performed using Brookhaven ZetaPlus at
25°C to determine the successful conjugation of aptamers on the MNPs’ surface. The
ACMNPs were dispersed in PBS and stored at 4°C at a concentration of 0.1 mg/mL.
Cells and Culture Conditions
The cell lines listed in Table 2-1 were obtained from the American Type Culture
Collection (ATCC). CEM, Ramos, and DLD1 cells were cultured in RPMI 1640 medium
(ATCC). K562 cells were maintained in culture with IMDM (ATCC). HCT116 cells were
grown with McCoy’s 5A (ATCC), and LH86 cells were maintained in culture with DMEM
(ATCC). All media for cancer cells were supplemented with 10% heat-inactivated FBS
and 100U/mL penicillin–streptomycin. HBE135-E6E7, Normal Bronchial lung cell line,
was maintained in Keratin Serum Free Medium supplemented with 5 ng/mL human
recombinant Epidermal Growth Factor (EGF), 0.05mg/ml bovine pituitary extract
(Invitrogen), 0.005 mg/ml insulin and 500ng/mL hydrocortisone. All cultured cells were
grown in a humidified incubator at 37ºC under a 5% CO2 atmosphere. In order to obtain
single-cell suspensions for the binding studies of adherent cells, cells were cultured
58
overnight in low density and treated with non-enzymatic cell dissociation solution (MP
Biomedicals) for 5min. Cells were aspirated several times, and the single cells were
pelleted and washed twice before use in the binding assays. Cell suspensions were
centrifuged at 1000 rpm for 5 min, and the pellet was resuspended in 2mL of washing
buffer. Ten microliter aliquots of the cell suspension were mixed with 10 µL trypan blue
solution. Cell quantification was performed using a hemacytometer (Hausser Scientific)
and a microscope (Olympus). After determining the cell concentration, serial dilution of
cells was prepared in PBS, FBS, plasma, or whole blood and used immediately after
preparation.
Determination of Conjugated Nanoparticle-Cell Specific Targeting
To demonstrate specific targeting, CEM cells with their corresponding aptamer,
fluorescien (FAM)-labeled sgc8c, were used, and FAM-labeled TDO5 was selected as a
negative control. The sgc8c-ACMNPs were incubated with approximately one million
CEM cells with the final concentration of 30µg Fe/mL at 4°C for 20 min in PBS.
Similarly, TDO5-ACMNPs were also incubated with CEM cells as a negative control.
After incubation, the cells were washed twice to remove unbound ACMNPs and
resuspended in PBS. The binding of aptamer-conjugated nanoparticles with target cells
was investigated using a laser scanning confocal microscope setup consisting of an
Olympus IX-81 inverted microscope with an Olympus Fluoview 500 confocal scanning
system and a HeNe laser with a photomultiplier tube (PMT) for the detection. The
cellular images were taken with a 20x objective. The ACMNPs were excited at 488 nm
(λex for FAM), and the emission was detected with a 505-525 nm band-pass filter.
59
Sample Assays using Spin-Spin Relaxation Time Measurement
To determine the specificity and sensitivity of the detection, 50µL aliquots of CEM
cell suspensions with different numbers of cells (1 to 106 cells) were incubated with 200
µL of sgc8c-ACMNPs solution in PBS ([Fe] = 10µg/mL) at 4°C for 40 min at the final
volume of 250 µL. Similarly, as a negative control, TDO5-ACMNPs were also incubated
with the cells. The spin-spin relaxation times (T2) were measured at 1.5 T by an mq60
NMR analyzer (Minispec, Bruker, Germany), operating at 37°C without a washing step.
In order to mimic real clinical samples, which normally contain thousands of different
species, similar experiments were also performed in FBS, plasma and whole blood from
Innovative Research. To generate the profiling of cancer cells, all cell types listed in
Table 1 were dispersed in PBS such that each sample would contain only one cell type
and approximately 1000 cells. Each type of ACMNPs was incubated with each cell
sample individually using the same conditions mentioned above, followed by the spin-
spin relaxation time measurement.
Results and Discussion
Magnetic Nanosensor Preparation
The magnetic nanosensor was prepared by conjugating streptavidin-coated iron
oxide nanoparticles with biotin-labeled aptamers. The streptavidin-coated MNPs have
an average hydrodynamic diameter of about 30 nm and a zeta potential (ζ) of -32.4 ±
3.7 mV. The conjugation of aptamers to the MNPs results in an increase of negative
charge on the particles’ surface (a zeta potential (ζ) of -41.8 ± 2.6 mV for sgc8c-
ACMNPs) arising from the large negative charge of the DNA aptamers. The large
surface area of MNPs allows the attachment of multiple aptamers, which result in
multiple interactions between ACMNPs and receptors on the cell’s surface. The

60
ACMNPs were stable and well dispersed without precipitation after storage at 4°C for
several months.
Specificity of ACMNPs
Although ACMNPs have been previously used for cancer cell separation,116,117 it is
necessary to confirm that the aptamers remain viable in terms of their ability to
specifically recognize their targets after conjugation. Therefore, CEM cells and their
corresponding aptamer, FAM-labeled sgc8c-ACMNPs, were selected for the
demonstration, and FAM-labeled TDO5-ACMNPs were used as a negative control.
Since our aptamers were labeled with fluorescent molecules, a fluorescence confocal
microscope was used to validate the target specificity of the aptamer conjugate. The
binding between the sgc8c-ACMNPs and CEM cells was demonstrated by bright
fluorescence, while the control, TDO5-ACMNPs, showed only minimal fluorescence
signal (Figure 2-2A and Figure 2-2B). To further validate the specificity, the binding of
TDO5-ACMNPs to their corresponding target, Ramos cells, was also investigated.
There was also a significant difference in the amount of fluorescence signal seen
between the images of the target and control (Figure 2-2C and Figure 2-2D). This
observation demonstrated that the ACMNPs maintain the same biological recognition to
their targets as the free aptamers.
Cancer Cells Detection using Spin-spin Relaxation Time Measurement
After using the fluorescence technique to demonstrate the specificity of ACMNPs
to their targets, the use of MRSw to detect cancer cells was investigated. The first assay
was performed to detect CEM cells in PBS. The results showed that 10µg Fe/mL was
the optimal concentration for the detection of target cells, since lower concentrations
generated significant errors in measurement, while higher concentrations limited the

61
detection threshold (Figure 2-3). When sgc8c-ACMNPs were mixed with CEM cells, a
decrease of T2 was observed as the number of target cells increased. To verify whether
the change of T2 resulted from specific aptamer-mediated interaction and not
nonspecific aggregation of MNPs, TDO5-ACMNPs were also incubated with CEM cells
as a control, followed by the relaxation time measurements. To determine the binding,
ΔT2 was defined as follows:
ΔT2 = T2sample - T2nonspiked (2-1)
where T2sample is the average T2 relaxation time of ACMNPs in the presence of
target cells and T2nonspiked is the average T2 relaxation time of ACMNPs in the absence of
target cells. Figure 2-4 shows a wide dynamic range of detection and excellent
correlation between the number of target cells and ΔT2 using sgc8c-ACMNPs, whereas
the ΔT2 of the control had no significant change. In addition, fewer than 10 target cells in
250 µL of PBS could be detected without any amplification method. The detection of
Ramos cells was also demonstrated using their corresponding aptamer, TDO5-
ACMNPs. The incubation of Ramos cells with TDO5-ACMNPs led to proportional
changes of ΔT2 with increasing number of cells, while the mixture of Ramos cells and
sgc8c-ACMNPs as a control produced only small ΔT2 changes (Figure 2-5). These
results agreed with our fluorescence assays, as described above, and confirmed the
specific recognition of ACMNPs, making this a viable and practical technique for the
sensitive detection of cancer cells.
Detection in Complex Biological Media
To further assess the potential of this technique, detection in FBS, plasma, and
whole blood samples was also performed. These assays were meant to mimic real
clinical samples, which normally contain thousands of different species. The detection

62
and quantification of CEM cells in FBS was demonstrated by incubating CEM-spiked
FBS with sgc8c-ACMNPs. The change of ΔT2 was also proportional to the number of
target cells, while the control showed only negligible changes (Figure 2-6). It is
important to note that this nanosensor can detect as few as 10 cells in 250 µL of serum,
which is much lower than the detection limits of conventional fluorescence- or
colorimetric-based methods.118,119 Although the detection of a few target cells has been
demonstrated by the chip-based Diagnostic Magnetic Resonance (DMR) system,53 our
nanosensor requires no microfabrication, and the washing step is eliminated. Similarly,
CEM-spiked plasma or whole blood was incubated with sgc8c-ACMNPs, followed by T2
measurement. The results revealed that the detection and quantification of target cells
can also be achieved in both plasma and whole blood (Figure 2-7). Nonspecific
interactions in complex media containing thousands of proteins caused unwanted
aggregates of ACMNPs on the cells’ surfaces producing lower relaxation times in both
T2sample and T2nonspiked. The low T2nonspiked value generated a higher background, resulting
in a smaller ΔT2 for detection in complex media compared to detection in buffer with the
same concentration of target cells. Nonetheless, we were able to detect as few as 100
target cells in all biological complex media (Figure 2-8).
Detection in Mixture of Cells
The detection of mixtures of targets and non-targets (CEM and Ramos cells,
respectively) with different ratios was also demonstrated. One hundred CEM cells were
mixed with non-target Ramos cells at different ratios: 1:1, 1:2, 1:5, 1:10, 1:50, and
1:100, respectively. sgc8c-ACMNPs were used to detect the target cells, and random
sequenced-DNA conjugated with MNPs was also used as a negative control. The
results showed that the target CEM cells can be detected in mixtures of CEM and

63
Ramos cells with ΔT2 similar to those observed in the presence of target CEM cells only
(Figure 2-9). For a large number of non-target cells, which may hinder the binding
between the ACMNPs and their targets, a slight decrease of ΔT2 was observed.
However, the detection in mixtures in which the ratio between target and non-target
cells was as small as 1:100 was achieved. This result shows promise for detection in
complex biological matrices. Successful detection of target cells in FBS, plasma, whole
blood, and mixtures of cells indicates that this method can be used for cellular detection
in real clinical applications.
Cancer Cells Profiling
With the successful detection of target cancer cells with high specificity and
sensitivity, the use of ACMNPs to monitor the interactions between different ACMNPs
and multiple cell lines was investigated. The use of aptamers as specific recognition
elements provides both qualitative and quantitative information about cell surface
receptors. For example, sgc8c aptamer was used to recognize PTK7 receptors on
leukemia cancer cells with precise quantitation.120,121 However, by using an array of
ACMNPs combined with the use of the MRSw technique, as described above,
recognition patterns were generated resulting in the differentiation of various cell types
and, in turn, a cancer cell profile that could be utilized to identify and classify cancer
cells more precisely than might otherwise be achieved by a single specific probe.
The target cells were chosen to represent a variety of cancer cell types: a normal
lung cell line and six types of representative cancer cells, as listed in Table 1. One
thousand cells of each cell line were spiked in PBS, incubated with each ACMNP
individually, followed by a T2 relaxation time measurement similar to that of the previous
assays. The six cancer cell lines showed a large variation in T2 reductions upon mixing

64
with different ACMNPs (Figure 2-10). The variation of ΔT2 upon the incubation of
multiple cell types with different ACMNPs can be explained by the different affinities of
the aptamers to their target and non-target cells. The aptamers, which have high affinity
to their targets, induced ACMNPs to agglomerate on the cells’ surface producing large
ΔT2, while the non-target cells showed no significant difference in T2. Based on the MR
response, sgc8c-ACMNPs not only showed strong binding with their target, CEM, but
also with the DLD1 and HCT116 cell lines. It was previously described that the target of
sgc8c, PTK7, is also expressed in colorectal cancers.115 As expected, the binding of
sgc8c to both colorectal cancer cell lines was observed. Similarly, KCHA10 aptamer
was found to interact with most colorectal cell lines,58 resulting in the recognition of
KCHA10-ACMNPs to both HCT116 and DLD1. The other aptamers, KDED2-3, TD05,
T2-KK1B10, and TSL11a, which have recognition to only single cell types,
demonstrated strong specificity to their targets. Significantly, none of ACMNPs had any
interaction with the normal cell line, indicating that targets of these aptamers are related
only to cancer. This result also confirmed that the binding based on the interaction of
aptamer-cell surface receptors involved and excluded nonspecific interactions. With the
low background observed, the detection and profiling can be potentially used for
analysis of clinical specimens, which normally contain both diseased and normal cells.
Compared to other methods, for example, flow cytometry or cell morphology analysis,
MRSw also offers the advantages of simplicity, minimal detection time, and low
detection limits.
Conclusion
In summary, we have developed a rapid and sensitive nanosensor for the
detection of cancer cells, as well as a method of profiling cancer cells based on MRSw.

65
The ACMNPs were found to maintain their biological recognition and provide a
multivalent effect, resulting in strong interaction with their target cells. Significantly, high
sensitivity and specificity could be achieved by this nanosensor for the sample assays in
complex biological systems, including serum, plasma, and whole blood. An array of
ACMNPs was utilized qualitatively and quantitatively to generate a profile for multiple
types of cancer cells. The nanosensor allowed not only the identification of cancer cells
but also the differentiation between cancerous and normal cells. Combined with the
ease of operating magnetic relaxation instrumentation, the ACMNPs-based nanosensor
could become a useful tool for reliable and sensitive detection, as well as cancer
screening for clinical use. Furthermore, this demonstration provides strong evidence
that the ACMNPs nanosensor has the potential to help identify the protein receptors on
the surfaces of various cancer cell types for more informed cancer studies and
biomarker discovery.

66
Aptamer conjugated magnetic nanoparticles
(ACMNPs)
Target cell-induced nanoassembly
High T2Low T2A
cell1
ΔT
2
cell2 cell3
B
Figure 2-1. Schematic representation of magnetic nanosensor for cancer cell detection and profiling. (A) The magnetic nanoparticles were conjugated with DNA aptamers having specific binding to their target cells. Addition of target cells results in an aggregation of magnetic nanoparticles, decreasing the T2 relaxation time of adjacent water protons. (B) Distinct recognition pattern generated from different affinities of aptamers to multiple cell types. An array of ACMNPs can be used to differentiate various cell types providing a molecular profile for qualitative and quantitative identification of cancer cells.

67
C
D
A
B
Figure 2-2. The specific recognition of ACMNPs to their target cells. Confocal images (left: fluorescence image, right: transmission image) of CEM cells labeled by (A) FAM-labeled TDO5-ACMNPs and (B) FAM-labeled sgc8c-ACMNPs; Ramos cells labeled by (C) FAM-labeled sgc8c-ACMNPs and (D) FAM-labeled TDO5-ACMNPs. The binding between ACMNPs and their target cells was demonstrated by the bright fluorescence, while the control showed minimal fluorescence signal.
0
5
10
15
20
25
30
35
40
45
50
30 20 15 10 5
MNP-sgc8
MNP-TDO5
ΔT
2(m
s)
[Fe] (µg/mL)
Sgc8c-ACMNPs
TDO5-ACMNPs
Figure 2-3. The optimization of magnetic nanosensor concentration in PBS. The optimal concentration of ACMNPs for the detection of target cells was determined by using ~100 CEM cells as a target. The result showed that 10 µg Fe/mL is the optimal concentration. The higher concentrations of ACMNPs limited the detection threshold, while the lower concentrations generated significant error for the measurement.
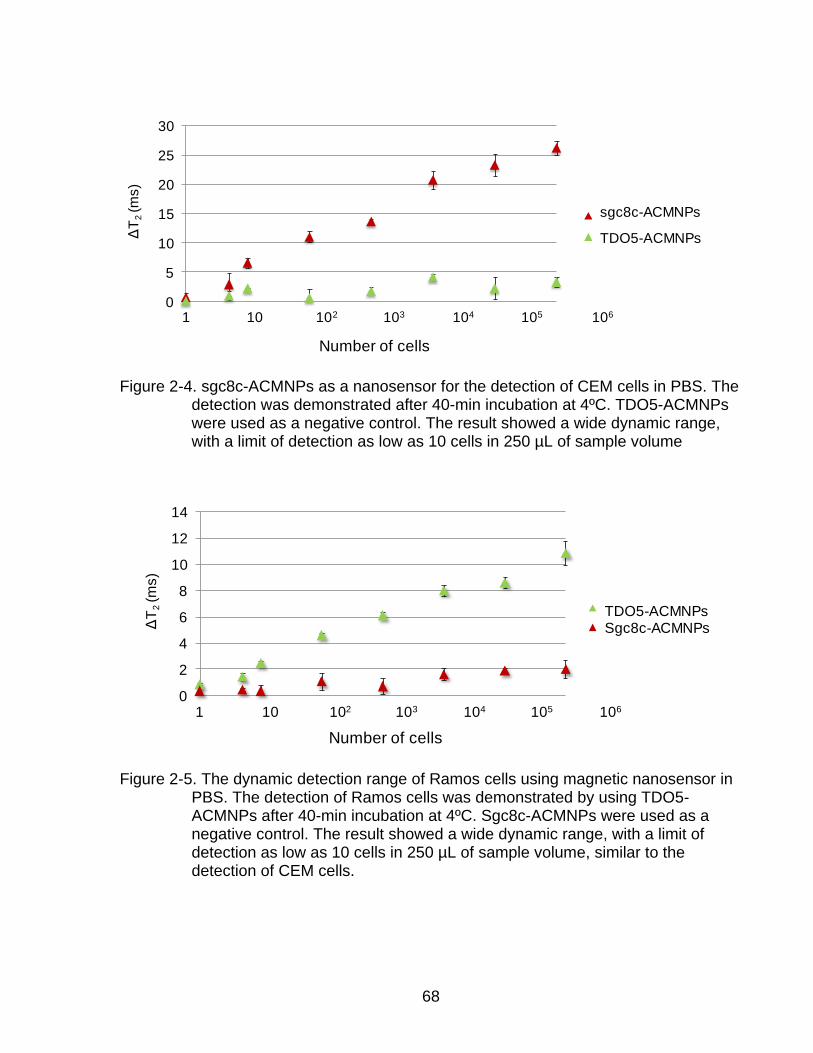
68
0
5
10
15
20
25
30
MNP-sgc8
MNP-TDO5
1 10 102 103 104 105 106
Number of cells
ΔT
2(m
s)
sgc8c-ACMNPs
TDO5-ACMNPs
Figure 2-4. sgc8c-ACMNPs as a nanosensor for the detection of CEM cells in PBS. The detection was demonstrated after 40-min incubation at 4ºC. TDO5-ACMNPs were used as a negative control. The result showed a wide dynamic range, with a limit of detection as low as 10 cells in 250 µL of sample volume
0
2
4
6
8
10
12
14
MNP-TDO5
MNP-sgc8ΔT
2(m
s)
Number of cells
TDO5-ACMNPsSgc8c-ACMNPs
1 10 102 103 104 105 106
Figure 2-5. The dynamic detection range of Ramos cells using magnetic nanosensor in PBS. The detection of Ramos cells was demonstrated by using TDO5-ACMNPs after 40-min incubation at 4ºC. Sgc8c-ACMNPs were used as a negative control. The result showed a wide dynamic range, with a limit of detection as low as 10 cells in 250 µL of sample volume, similar to the detection of CEM cells.
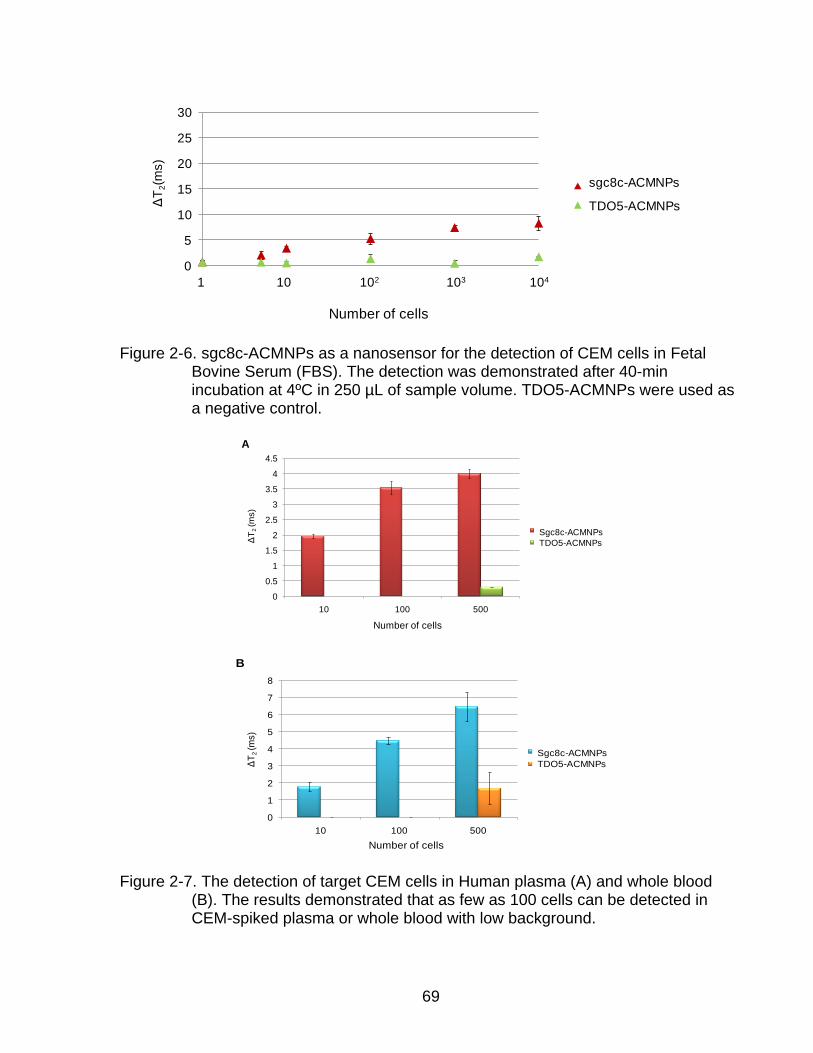
69
0
5
10
15
20
25
30
MNP-sgc8
MNP-TDO5ΔT
2(m
s)
Number of cells
1 10 102 103 104
sgc8c-ACMNPs
TDO5-ACMNPs
Figure 2-6. sgc8c-ACMNPs as a nanosensor for the detection of CEM cells in Fetal Bovine Serum (FBS). The detection was demonstrated after 40-min incubation at 4ºC in 250 µL of sample volume. TDO5-ACMNPs were used as a negative control.
0
0.5
1
1.5
2
2.5
3
3.5
4
4.5
10 100 500
MNP-sgc8
MNP-TDO5ΔT
2(m
s)
Number of cells
Sgc8c-ACMNPs
TDO5-ACMNPs
A
0
1
2
3
4
5
6
7
8
10 100 500
MNP-sgc8
MNP-TDO5ΔT
2(m
s)
Number of cells
Sgc8c-ACMNPs
TDO5-ACMNPs
B
Figure 2-7. The detection of target CEM cells in Human plasma (A) and whole blood (B). The results demonstrated that as few as 100 cells can be detected in CEM-spiked plasma or whole blood with low background.
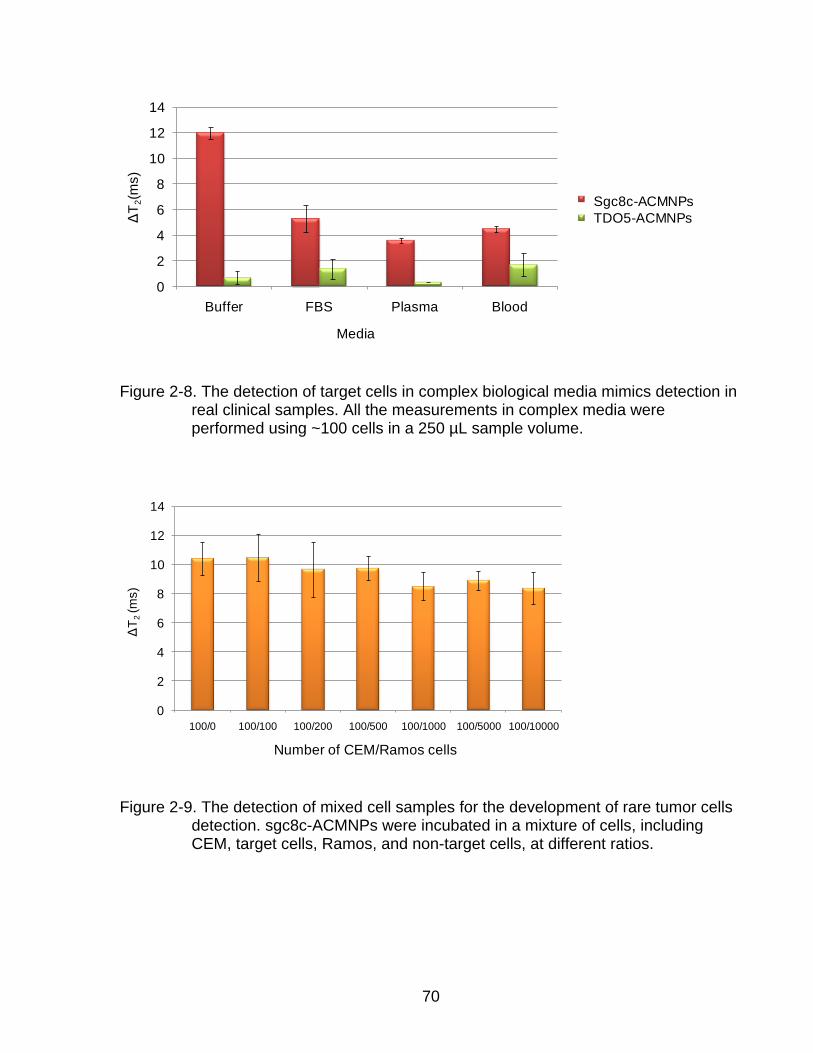
70
0
2
4
6
8
10
12
14
Buffer FBS Plasma Blood
MNP-sgc8
MNP-TDO5ΔT
2(m
s)
Sgc8c-ACMNPs
TDO5-ACMNPs
Media
Figure 2-8. The detection of target cells in complex biological media mimics detection in
real clinical samples. All the measurements in complex media were performed using ~100 cells in a 250 µL sample volume.
ΔT
2(m
s)
0
2
4
6
8
10
12
14
100/0 100/100 100/200 100/500 100/1000 100/5000 100/10000
Number of CEM/Ramos cells
Figure 2-9. The detection of mixed cell samples for the development of rare tumor cells
detection. sgc8c-ACMNPs were incubated in a mixture of cells, including CEM, target cells, Ramos, and non-target cells, at different ratios.

71
0
2
4
6
8
10
12
14
16
18
CEM Ramos K562 DLD1 HCT116 LH86 Normal cell
sgc8c-ACMNPs
TDO5-ACMNPs
T2-KK1B10-ACMNPs
KDED2a-3-ACMNPs
KCHA10-ACMNPs
TSL11a-ACMNPs
ΔT
2(m
s)
Cell lines
Figure 2-10. Profiling of cancer cells. The changes of T2 relaxation times obtained by incubating different ACMNPs with multiple cancer cell types or control normal cells. The measurement was performed on ~1000 cells in a 250µL sample volume.
Table 2-1. Representative cell lines and binding affinities of their selected aptamers.
Cell lines Type of cell Aptamer Kd(nM)
CEM Leukemia sgc8c58,a 0.8 Ramos Leukemia TDO5122 75.0 K562 Leukemia T2-KK1B10123,b 30.0 DLD1 Colon KDED2a-3124 29.2 HCT116 Colon KCHA10124 21.3 LH86 Liver TLS11a125,c 7.0 HBE135-E6E7d Lung N/A N/A
asgc8c is a truncated DNA of sgc8.
bT2-KK1B10 is a truncated DNA of KK1B10.
cTLS11a was originally developed for liver cancer.
dNormal cell line.

72
CHAPTER 3 DETECTION OF LYSOZYME USING MAGNETIC RELAXATION SWITCHES BASED
ON APTAMER-FUNCTIONALIZED SUPERPARAMAGNETIC NANOPARTICLES
Introduction
Over the past few decades, nanoparticles (NPs) have received considerable
attention in advanced biomedical science. The unique characteristics of NPs, such as
large surface-to-volume ratio and size-dependent optical and magnetic properties, hold
promise for the development of highly sensitive and selective diagnostic tools for clinical
use. Specific ligands can be conjugated to a variety of nanoparticles to provide
specificity and multivalent affinity. The interaction of NP-ligand conjugates with their
target molecules can be transduced into a reporting signal which can be detected by
fluorescence, colorimetric, and Raman spectroscopy.33,126,127 However, many of these
NPs, such as quantum dots (QDs) and dye-doped or gold NPs, cause high background
interference in biological media by scattering, absorption or autofluorescence, thus
limiting highly sensitive detection.
It has been observed that magnetic NPs (MNPs) have the ability to enhance the
magnetic resonance (MR) signal of protons from surrounding water molecules.107,108,111
Aggregation of MNPs induces the coupling of magnetic spin moments and generates
strong local magnetic fields. Such local magnetic field inhomogeneities accelerate the
dephasing of adjacent water protons, resulting in a decrease of transverse or spin-spin
relaxation times (T2). Thus, both aggregation and dissociation of MNP clusters can be
detected by a change in proton relaxation times (ΔT2) by using NMR, magnetic
resonance imaging (MRI), or relaxometry. This phenomenon has led to the
development of magnetic relaxation switches (MRSw), in which the self-assembly of
MNPs, or disassembly of pre-existing magnetic clusters, corresponds to the presence or

73
absence of specific targets, respectively. Such reversible systems can be designed to
detect a variety of targets, such as DNA, RNA, bacteria, viruses, and small molecules,
with the MNPs going either from the dispersed to aggregated state or vice-versa.111-114
Additionally, these magnetic properties are not exhibited in biological samples in the
absence of MNPs, resulting in a reduction of background noise, thereby increasing
detection sensitivity.
Protein dysfunction in the context of cell regulation and signal transduction is
always associated with the development of diseases, especially cancer.128-130 Advances
in protein detection and quantification are essential for pharmaceutical and biomedical
research. Recently, aptamers, which comprise a new class of ligands, have been
isolated and identified to recognize a variety of chemical and biological molecules with
high affinity and selectivity.101 Aptamers are obtained through an in vitro selection
process, which is known as systematic evolution of ligands by exponential enrichment
(SELEX), against a variety of targets, such as ions, proteins, and cells.102,103 Aptamers
have several advantages over antibodies, such as ease of manipulation, reproducible
synthesis, good stability against biodegradation, and non-toxicity.
In the following discussion, we will demonstrate an aptamer-based sensor for
protein detection based on MRSw, using lysozyme (Lys) and anti-Lys aptamers as
models. Lys is a highly isoelectric point enzyme (pI~11) that contains 129 amino acids.
Generally, a low concentration of Lys is distributed in body tissues and secretions.
However, it was reported that elevated levels of Lys in serum, urine, and cells are
related to many diseases, such as leukemia,131 renal diseases,132 and meningitis.133
Therefore, the detection and quantification of Lys is very important. In order to
74
demonstrate the feasibility of our magnetic nanosensors for real clinical analysis, the
detection of Lys in serum and cell lysates was also investigated.
Experimental Section
Synthesis of DNA
All DNA samples as demonstrated in Table 3-1 were synthesized using standard
phosphoramidite chemistry with an ABI3400 DNA/RNA synthesizer (Applied
Biosystems, CA). Biotin core pore glass (CPG) from Glen Research was used for the
synthesis. After the synthesis, the aptamers were deprotected in concentrated AMA (1:1
mixture of ammonium hydroxide and aqueous methylamine) solution at 65°C for 30 min,
prior to further purification with reversed phase high-pressure liquid chromatography
(RP-HPLC) using a ProStar HPLC Station (Varian, CA) equipped with a fluorescent and
a photodiode array detector and a C-18 reversed phase column (Econosil, C18, 5 µM,
250 x 4.6 mm) from Alltech (Deerfield, IL). The eluent was 100mM triethylamine-acetic
acid buffer (TEAA, pH 7.5) and acetonitrile (0-30min, 10-100%). The collected DNA
products were dried and detritylated with acetic acid. The detritylated aptamers were
precipitated with ethanol and dried using a vacuum drier. The purified aptamers were
then dissolved with DNA grade water and quantified by determining the UV absorption
at 260 nm using a UV-Vis spectrometer (Cary Bio-300, Varian).
Lys Nanosensor Preparation
In order to prepare Lys nanosensors, 30 nm streptavidin-coated iron oxide
nanoparticles (Ocean Nanotech) were dispersed at 0.1 mg/mL in 100 mM phosphate-
buffered saline (PBS), pH 7.4. An excess amount of biotin-labeled Lys aptamer or linker
DNA was then added to separate samples of the streptavidin-coated MNPs. The
mixtures were vortexed at room temperature for 1 h followed by washing 3x with PBS

75
buffer using centrifugation at 14000 rpm to remove any DNA that did not conjugate to
the MNPs. The conjugates were dispersed in PBS and stored at 4°C at a concentration
of 0.1 mg/mL. Equimolar amounts of MNP-Lys aptamer and MNP-Linker were mixed
together and dispersed in PBS buffer at a final concentration of 12 µg Fe/mL, leading to
cluster formation within 20 min. The spin-spin relaxation times (T2) were measured at
1.5 T by mq60 NMR analyzer (Minispec, Bruker, Germany), operating at 37°C to
confirm the aggregation of nanosensors.
Magnetic Relaxation Measurement
The Lys nanosensor was prepared as mentioned in the previous section. A stock
solution of protein (0.1mM) was prepared in deionized water and diluted in PBS as
necessary. Fifty µL aliquots of Lys with different concentrations were incubated with 200
µL nanosensor mixture in PBS at room temperature at a final volume of 250 µL and [Fe]
= 12 µg/mL. The spin-spin relaxation times (T2) were measured after 40 min of
incubation without a washing step. The samples with human serum (Innovative
Research) were prepared by adding protein and nanosensors to 100% human serum
using the same concentration of nanosensors. T2-weighted MR images were obtained
by using a 11 T NMR instrument with a spin echo pulse sequence, variable echo time
(TE) of 50-100 ms and repetition time (TR) of 3000 ms.
Cell Samples Preparation
All cancer cell lines were obtained from the American Type Culture Collection
(ATCC). CEM and Ramos cells were cultured in RPMI 1640 medium (ATCC). K562
cells were maintained in culture with IMDM (ATCC). All media for cancer cells were
supplemented with 10% heat-inactivated FBS and 100U/mL penicillin–streptomycin. All
cultured cells were grown in a humidified incubator at 37ºC under a 5% CO2

76
atmosphere. The normal white blood cells (WBC) were separated from whole blood
samples (Innovative Research) and transferred into 15 mL tubes. To isolate the WBC,
blood was centrifuged at 2000 rpm for 10 min at room temperature. This procedure
separated the blood specimen into three layers: an upper plasma layer, a lower red
blood cell (RBC) layer, and a thin interface buffy coat containing the WBC. With a
transfer pipette, the plasma was first removed, and then the buffy coat was carefully
aspirated into a separated tube. Cell suspensions were centrifuged at 1000 rpm for 5
min, and the pellet was resuspended in 2mL of washing buffer. After washing 2x, ten
microliter aliquots of the cell suspension were mixed with 10 µL trypan blue solution.
Cell quantification was performed using a hemocytometer (Hausser Scientific) and a
microscope (Olympus). Ten million cells of each cell type were resuspended in 250 µL
of 1% ice cold CHAPS (3-[(3-Cholamidopropyl) dimethylammonio]-1-propanesulfonate)
lysis buffer. The lysates were incubated for 30 min on ice and centrifuged 20 min at
12000 rpm at 4ºC. The lysates were transferred to clean centrifuge tubes for Lys assay
or frozen at -80 ºC. Fifty µL aliquots, which contained lysate from 1×10⁶ cells, were
incubated with nanosensor solution in PBS using the same conditions mentioned
above, followed by the spin-spin relaxation time measurement.
Results and Discussion
The MRSw mechanism for the Lys sensor is based on analyte-induced
disassembly of MNPs, an event which results in an increase in T2, as explained above.
As shown in Figure 3-1, iron oxide nanoparticles are conjugated with either Lys aptamer
or linker DNA. In the absence of Lys, the linker can hybridize with part of the aptamer (7
bases of the aptamer plus a 5-base extension) to form clusters (short T2). However, in
the presence of Lys, the aptamer undergoes a structural change in order to bind with

77
the target, resulting in base pair disruption. The five remaining base pairs between
MNP-Lys aptamer and MNP-Linker are not strong enough to hold the cluster together at
room temperature, leading to the disassembly of the clusters (longer T2). Therefore, the
Lys-induced disassembly of the clusters can be monitored by this increase in T2.
Clusters Formation of Lys Nanosensor
Streptavidin-coated iron oxide nanoparticles were conjugated with either biotin-
labeled aptamers or biotin-labeled linker. To prepare Lys nanosensor, equimolar of
MNP-Lys aptamer was incubated with MNP-Linker ([Fe] = 12 µg/mL) followed by T2
measurement. Within 5 minutes, the nanosensor showed a decrease in T2, indicating
the formation of clusters upon the hybridization between the complementary strands
(Table 3-2). In contrast, the T2 of either the individual MNP-Lys aptamer or MNP-Linker
showed no significant change. The T2 of the nanosensor remained constant after 10
min of incubation, indicating that the formation of nanosensors could be completed in a
short time. The aggregation was confirmed again by mixing a high concentration of
MNP-Lys aptamer and MNP-Linker at [Fe] = 100 µg/mL and incubating overnight at
4ºC. Precipitation of the nanosensor was observed as a consequence of the formation
of large clusters (Figure 3-2). However, the same effect was not observed for individual
MNP-Lys or MNP-Linker.
Lys-Induced Disassembly of Nanosensors
To avoid precipitation, the Lys assay was performed with the nanosensor at a low
concentration ([Fe] = 12 µg/mL). Two hundred fifty nM of Lys was added into the
prepared nanosensor, followed by T2 measurements at 5-minute intervals after adding
the target. For each time interval, the change in T2 (ΔT2) was calculated by the following
equation:
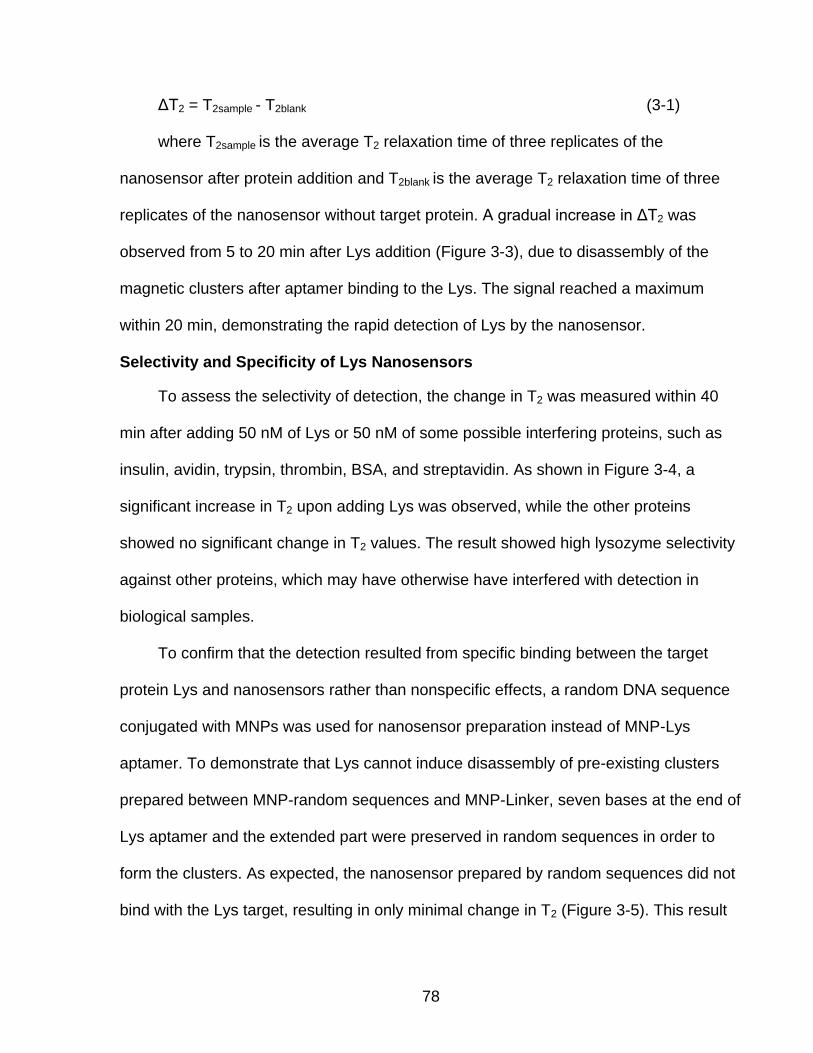
78
ΔT2 = T2sample - T2blank (3-1)
where T2sample is the average T2 relaxation time of three replicates of the
nanosensor after protein addition and T2blank is the average T2 relaxation time of three
replicates of the nanosensor without target protein. A gradual increase in ΔT2 was
observed from 5 to 20 min after Lys addition (Figure 3-3), due to disassembly of the
magnetic clusters after aptamer binding to the Lys. The signal reached a maximum
within 20 min, demonstrating the rapid detection of Lys by the nanosensor.
Selectivity and Specificity of Lys Nanosensors
To assess the selectivity of detection, the change in T2 was measured within 40
min after adding 50 nM of Lys or 50 nM of some possible interfering proteins, such as
insulin, avidin, trypsin, thrombin, BSA, and streptavidin. As shown in Figure 3-4, a
significant increase in T2 upon adding Lys was observed, while the other proteins
showed no significant change in T2 values. The result showed high lysozyme selectivity
against other proteins, which may have otherwise have interfered with detection in
biological samples.
To confirm that the detection resulted from specific binding between the target
protein Lys and nanosensors rather than nonspecific effects, a random DNA sequence
conjugated with MNPs was used for nanosensor preparation instead of MNP-Lys
aptamer. To demonstrate that Lys cannot induce disassembly of pre-existing clusters
prepared between MNP-random sequences and MNP-Linker, seven bases at the end of
Lys aptamer and the extended part were preserved in random sequences in order to
form the clusters. As expected, the nanosensor prepared by random sequences did not
bind with the Lys target, resulting in only minimal change in T2 (Figure 3-5). This result
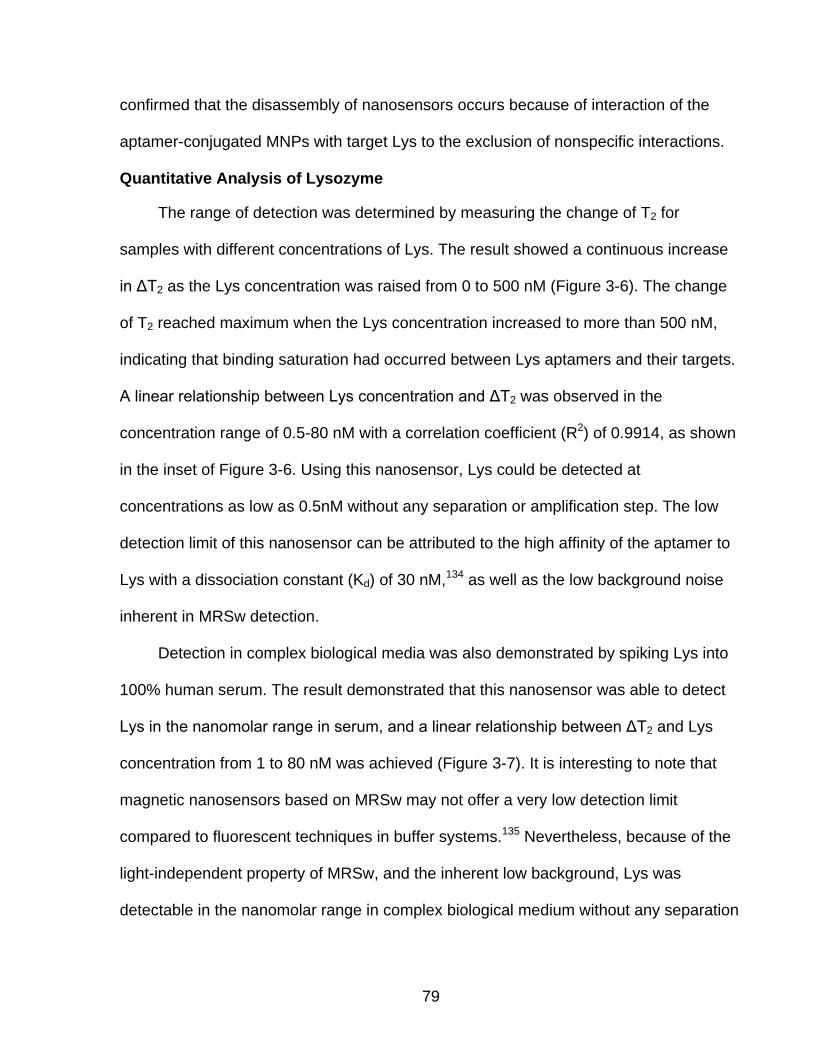
79
confirmed that the disassembly of nanosensors occurs because of interaction of the
aptamer-conjugated MNPs with target Lys to the exclusion of nonspecific interactions.
Quantitative Analysis of Lysozyme
The range of detection was determined by measuring the change of T2 for
samples with different concentrations of Lys. The result showed a continuous increase
in ΔT2 as the Lys concentration was raised from 0 to 500 nM (Figure 3-6). The change
of T2 reached maximum when the Lys concentration increased to more than 500 nM,
indicating that binding saturation had occurred between Lys aptamers and their targets.
A linear relationship between Lys concentration and ΔT2 was observed in the
concentration range of 0.5-80 nM with a correlation coefficient (R2) of 0.9914, as shown
in the inset of Figure 3-6. Using this nanosensor, Lys could be detected at
concentrations as low as 0.5nM without any separation or amplification step. The low
detection limit of this nanosensor can be attributed to the high affinity of the aptamer to
Lys with a dissociation constant (Kd) of 30 nM,134 as well as the low background noise
inherent in MRSw detection.
Detection in complex biological media was also demonstrated by spiking Lys into
100% human serum. The result demonstrated that this nanosensor was able to detect
Lys in the nanomolar range in serum, and a linear relationship between ΔT2 and Lys
concentration from 1 to 80 nM was achieved (Figure 3-7). It is interesting to note that
magnetic nanosensors based on MRSw may not offer a very low detection limit
compared to fluorescent techniques in buffer systems.135 Nevertheless, because of the
light-independent property of MRSw, and the inherent low background, Lys was
detectable in the nanomolar range in complex biological medium without any separation

80
or amplification step. This result revealed the feasibility of using this magnetic
nanosensor in clinical analysis.
The detection of Lys in human serum was also confirmed using T2-weighted MR
imaging. An increase of Lys concentration led to more disassembly of nanosensor
clusters, resulting in an increase in T2 and an increase in brightness of the T2 images,
as shown in Figure 3-8. The change in contrast was also observed in the nanomolar
range of Lys protein which corresponds to detection using a benchtop relaxometer.
Analysis of Lysozyme in Cell Lysates
To validate the use of this Lys nanosensor for real clinical samples, an analysis of
Lys in lysates from leukemia cells was performed. CEM, Ramos, and K562 cells were
chosen to represent a variety of leukemia cell types. Within this set, normal white blood
cells were used as a control. Lysates from one million cells of each cell type were
incubated with the Lys nanosensor followed by T2 relaxation time measurements similar
to those in previous assays. The cell lines containing a large amount of Lys could
induce a high degree of cluster disassembly, resulting in significant change in ΔT2.
Based on the MR response, the three cancer cell lines showed a variation of ΔT2,
indicating that different amounts of Lys were contained in each cell type (Figure 3-9).
Normal white blood cells showed only a small change in T2, indicating a low
concentration of Lys. It was previously reported that a high concentration of Lys was
detected in myeloid leukemia cells.136 As expected, a significant increase in T2 was
observed in K562 cells, which belong to a myeloid leukemia cell line, based on their
high Lys expression. In contrast, CEM and Ramos, which are T and B lymphoid
leukemia cells, showed small ΔT2, similar to that of normal cells, indicating a low Lys
expression, a result which agrees with the literature.136,137 The result suggested that this

81
magnetic nanosensor could be potentially used for differentiation of Lys levels in
specimens between healthy individuals and patients with leukemia.
Conclusion
In conclusion, we successfully demonstrated an aptamer-based biosensor for
protein detection using MRSw and Lys as the model target protein. Good selectivity for
Lys compared to other proteins was demonstrated by minimal disassembly of pre-
existing clusters prepared by random DNA sequences conjugated with MNPs. A
detection limit in the nanomolar range was achieved for Lys detection in both buffer and
human serum. Detection was confirmed by the T2-weighted MR image of Lys-induced
disassembly. An assay to determine the level of Lys in cell lysates also demonstrated
the potential of this Lys nanosensor for real clinical sample analysis. Overall, this
MRSw-based nanosensor offers the advantages of high sensitivity and simplicity for the
detection in turbid media and biological samples without protein purification or
separation; consequently, the system is feasible for point-of-care diagnostics.

82
Figure 3-1. Schematic representation of the magnetic nanosensor for Lys detection based on MRSw. The iron oxide nanoparticles are conjugated with either Lys aptamer or linker DNA which can hybridize with the extended part of the aptamer to form clusters. Upon the addition of Lys, the aptamers bind with their targets, leading to disassembly of clusters and increased T2 relaxation time of the adjacent protons.
Figure 3-2. Effect of incubating MNP-Lys aptamer with MNP-Linker at high concentration overnight. The individual conjugates showed good dispersion, corresponding to long T2. However, the mixture of MNP-Lys and MNP-Linker showed precipitation at the bottom due to the hybridization between complementary strands, resulting in the formation of large clusters.

83
Time (min)
ΔT
2(m
s)
Δ T2 = T2sample – T2blank
0
2
4
6
8
10
12
14
16
18
5 10 15 20 25
Figure 3-3. A gradual change of ΔT2 upon the addition of Lys. The signal reached the
maximum within 20 min, indicating the rapid disassembly of magnetic nanosensors.
Protein
ΔT
2(m
s)
0
1
2
3
4
5
6
7
8
9
10
Figure 3-4. Selectivity of the Lys nanosensor. Disassembly of magnetic clusters upon the addition of 50 nM of Lys target was detected by significant change in T2 relaxation time. At the same time, other proteins, as noted, showed only negligible changes, indicating no interaction with the nanosensor.

84
ΔT
2(m
s)
DNA
0
5
10
15
20
25
Lys Library
Figure 3-5. Specificity of the Lys nanosensor. Random sequences were employed to test specificity; results showed no binding to target and only minimal change in T2 at a Lys concentration of 250 nM.
0
5
10
15
20
25
30
0 200 400 600 800 1000 1200
R² = 0.9914
0
5
10
15
20
0 20 40 60 80 100
ΔT
2(m
s)
ΔT
2(m
s)
Lys concentration (nM)
Lys concentration (nM)
Figure 3-6. Changes in T2 relaxation time with increasing concentrations of Lys. The
detection range was determined in PBS; inset: expanded linear region of the curve.
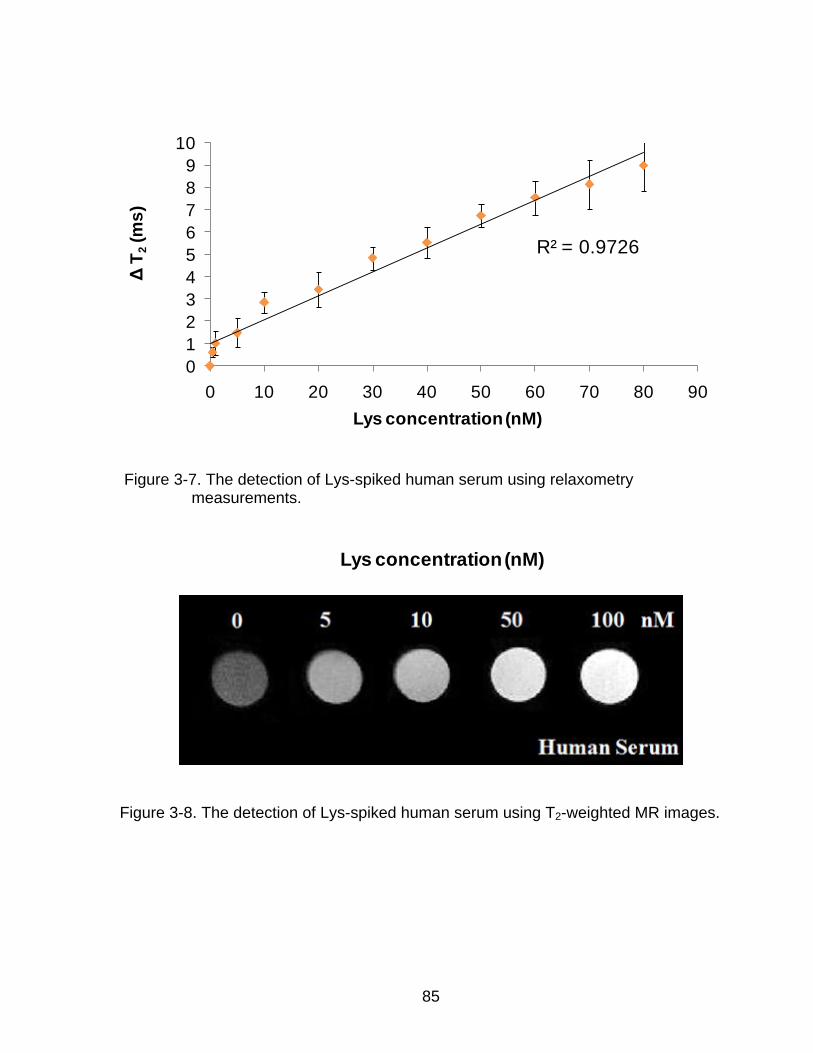
85
ΔT
2(m
s)
Lys concentration (nM)
R² = 0.9726
0
1
2
3
4
5
6
7
8
9
10
0 10 20 30 40 50 60 70 80 90
Figure 3-7. The detection of Lys-spiked human serum using relaxometry
measurements.
Lys concentration (nM)
Figure 3-8. The detection of Lys-spiked human serum using T2-weighted MR images.

86
ΔT
2(m
s)
Cell
0
1
2
3
4
CEM Ramos K562 Normal cells
Figure 3-9. Determination of Lys in cell lysates. Normal white blood cells were used as a
standard to represent the normal Lys level. A significantly elevated amount of Lys was observed in K562 cells, while CEM and Ramos only showed small differences in Lys levels compared to normal white blood cells.
Table 3-1. List of DNA sequences.
DNA sequences
Lys Aptamer
Library
Linker
5’-AGA GAG ATT CAT TGA GAC GTG AGA AAT CGG GAC TAT TTT TT-Biotin-3’ 5’-AGA GAG ATT CAT NNN NNN NNN NNN NNN NNN NNN NNT TTT TT-Biotin-3’ 5’-ATG AAT CTC TCT TTT TTT-Biotin-3’
The underlined bases demonstrate the complementary part, and the blue highlight demonstrates the extended part of Lysozyme aptamer.
Table 3-2. The formation of magnetic clusters upon hybridization between
complementary strands. The clusters were detected by changes in T2 at 5-minute intervals after mixing.
Time (min)
T2(ms) MNP-Lys MNP-Linker MNP-Lys+MNP-Linker
5 93.7±2.1 97.0±1.7 78.0±2.4 10 93.3±1.9 96.8±3.1 76.6±1.8 20 91.6 ±3.7 95.8±2.6 76.2±2.2
87
CHAPTER 4 MAGNETICALLY DRIVEN SINGLE DNA NANOMOTOR
Introduction
In biological systems, nanoscale molecular motors can generate forces from
spontaneous reactions of energy-rich molecules, mostly adenosine triphosphate (ATP),
to convert chemical energy to mechanical movement. These motors are roughly 10 nm
in size, take steps of a few nanometers, and can exert forces in the piconewton
range.138,139 However, to efficiently design and construct nanoscale motors in the
laboratory, two key requirements must be satisfied: 1) the generation of forces sufficient
to power nanomachines or nanodevices and 2) the exertion of precise control over the
motion produced.
Accomplishing these objectives begins with DNA, which is the ideal building block
for nanostructures. In addition, DNA can also be used to create dynamic molecules that
replicate machine functions including tweezers,10,79,140 gears,11 walkers,13,141,142 and
motors.84,143,144 The DNA nanomotors, which can be operated with high efficiency for
several cycles, require exergonic reactions, such as hydrolysis of the DNA
backbone,141,142,144 hydrolysis of ATP,13 and DNA hybridization.14,79 However, operating
such DNA nanomotors requires the addition and removal of fuels and waste strands for
motor function. This mode of operation, however, is accompanied by the accumulation
of waste products, which results in decreased motor efficiency. Therefore, coupling the
nanomotors to clean alternative energy sources would both eliminate the accumulation
of waste products and produce a practical high-efficiency device.
Single molecules can be manipulated through magnetic force by attaching them
on magnetic particles and applying an external magnetic field. Using a magnetic field to

88
control the movement of molecules can also avoid molecular damage from photonic
flux. Therefore, the application of a magnetic field could be of great interest as an
alternative energy source for DNA nanomotors and could also satisfy the design
requirements, as enumerated above.
We have designed a DNA nanomotor which is fueled by an oscillating magnetic
field gradient. The nanomotor consists of DNA hairpins that are immobilized on a glass
surface inside of a micro-channel and subsequently conjugated to magnetic particles.
An external magnetic field gradient is then used to apply a force on the magnetic
particles perpendicular to the glass surface, thereby opening the DNA hairpins. We
interpret the separation of the 5’ and 3’ ends of the DNA hairpin during opening as the
power stroke of our nanomotor and the hybridization of the hairpin as the recovery
stroke. The movement of the hairpin molecule can be monitored by fluorescence
resonance energy transfer (FRET) between a fluorophore and a quencher on the stem
ends.99,145,146 Compared with other DNA nanomotor systems, in which the cycles
involve the addition of several DNA strands, the magnetic hairpin DNA nanomotor can
be operated by the simple application of an external magnetic field gradient. As such,
this magnetically driven hairpin DNA nanomotor adds no DNA fuels and generates no
DNA waste products after each cycle, in addition to which it can be operated at room
temperature with low salt concentration.
Experimental Section
DNA Molecular Probes Synthesis
All sequences as demonstrated in Table 4-1were synthesized using standard
phosphoramidite chemistry. The DNA reagents for the synthesis of DNA hairpins and
biotinylated linker were purchased from Glen Research. All DNA hairpins were

89
synthesized with an ABI3400 DNA/RNA synthesizer (Applied Biosystems, CA). Biotin
core pore glass (CPG) was used for all DNA hairpins and DNA linker synthesis.
Deprotection of the DNA was performed using overnight incubation with ammonium
hydroxide at room temperature. The solution resulting from deprotection was
precipitated in cold ethanol. Subsequently, the precipitates were dissolved in 0.5 mL of
0.1 M triethylammonium acetate (TEAA, pH 7.0) for further purification with reverse
phase high-pressure liquid chromatography (RP-HPLC). RP-HPLC was performed on a
ProStar HPLC Station (Varian, CA) equipped with a fluorescent and a photodiode array
detector using a C-18 reverse phase column (Econosil, C18, 5 µM, 250 x 4.6 mm) from
Altech (Dearfield, IL). The product collected from the HPLC was vacuum dried and then
added with TEAA for a second round of HPLC. The final product was collected, vacuum
dried and dissolved in 200 µL of acetic acid (80%) for 30 min, follow by 200 µL of cold
ethanol and then vacuum-dried once more. Quantification of all DNA was performed
using a UV-Vis Spectrometer (Cary Bio-300, Varian, CA).
Molecular Probes Assays
The maximum fluorescence signal enhancement of each DNA hairpin was
observed in solution before and after incubation with excess DNase I in order to
determine its extension (or “opening”) efficiency. A mixture of 100 nM of DNA hairpins in
20 mM of Tris-HCl with MgCl2 and NaCl, pH 7.4 was loaded into a quartz cell for
fluorescent spectra. After excitation at 488 nm (λex for FAM), the emission spectra were
collected at 520 nm (λem for FAM). After scanning the emission of DNA hairpins for 5
min, 2000 Units/mL of DNase I (Deoxyribonuclease I) enzyme (New England BioLabs,
Inc) was added to the solution of DNA hairpins. DNase I catalyzes cleavage of the
phosphodiester linkages in the DNA backbone separating the fluorophore from the

90
quencher to generate the maximum fluorescence signal. It has been reported that the
ionic strength, especially the concentration of divalent cations, affects the stability and
reactivity of hairpin-structured DNA. To optimize the buffer system, the DNA cleavage
by DNase I was performed at pH 7.4 in 20 mM Tris-HCl solution with different
concentrations of MgCl2 (5 and 10 mM) and NaCl (50, 100, and 200 mM). The
fluorescence enhancement was calculated using the following equation:
Fluorescence Enhancement = (Scleaved – Bbuffer)/(Sclose – Bbuffer) (4-1)
where Scleaved is the signal of DNA hairpins after cleavage by DNase I, Sclose is the
signal of DNA hairpins prior to cleavage, and Bbuffer is the background fluorescence
intensity of buffer.
Immobilization of DNA Molecular Probes on Glass Surface
The surface experiments were performed using microscope slides and glass slips
from Fisher (optical borosilicate glass with a size of 45 x 50 mm and 0.13 to 0.17 mm in
thickness). The surfaces were cleaned with piranha solution (3:1 ratio of conc.
H2SO4:30% H2O2), washed thoroughly with deionized water, and dried with nitrogen.
Strips of double-sided tape (3M) were placed on the cleaned microscope slide and a
cover glass was placed on top to generate micro-channels. The channels were filled
with Tris-HCl buffer with optimum concentrations of MgCl2 and NaCl by capillary action,
and the solution was withdrawn with filter paper (Fisher). After washing channels with
buffer 3 times, 7 µL of 1 mg/mL, avidin was incubated in the channel for 5 min. The
excess avidin was removed by washing 3 times with buffer. Next, 7 µL of 5 µM
biotinylated linker was incubated in the avidin treated channels for 10 min. After
washing to remove excess linker, a solution of 5 µM DNA hairpins was incubated in the
channels to hybridize with the immobilized linker for 15 min, and the excess DNA
91
hairpins were removed by buffer washes. The fluorescence of the DNA hairpins in the
closed form was observed by a confocal fluorescence microscope setup consisting of
an Olympus IX-81 inverted microscope with an Olympus Fluoview 500 confocal
scanning system and an Argon laser with a photomultiplier tube (PMT) for detection, at
the wavelength given above using 20x objective. To find the glass-liquid interface, the
microscope was first focused on the glass surface of the micro-channel, and a z-section
was recorded after each step in the experiment. Each z-section was then analyzed to
find the position where the highest signal had been recorded. After immobilization of
DNA hairpin on the surface of the channel, DNase I was incubated with the immobilized
DNA hairpins for 45 min. Then, the average fluorescence intensities of the image from
avidin, immobilized DNA hairpins, and DNase I addition were taken at the same position
for that particular channel, and the average fluorescence was monitored to determine
the signal enhancement.
Construction of DNA Nanomotor
The DNA hairpins were immobilized on the glass surface and a z-section was
recorded following each step as described above. After immobilization of the DNA
hairpins, the surface was passivated against nonspecific interactions between magnetic
beads and the surface by incubating unreacted avidin with 2 mg/mL of biotinylated-PEG
solution for 15 min. The streptavidin-coated iron oxide beads (either 1 µm, 2.8 µm from
Dynabeads, Invitrogen, or 0.2 µm from Chemicell, GmbH) were sonicated for 1 min to
break up the bead clumps. A 2 mg/mL suspension of the beads was then incubated for
20 min in the DNA hairpins-coated channel. After washing, a z-section was recorded
and the average fluorescence signal of the image (closed form) was observed by
confocal microscope. A rare earth magnet, NdFeB from Applied Magnets, was attached

92
to an adjustable stage and positioned directly above the channel for 1 min and the
average fluorescence intensity was measured at the same position to observe the open
state of the DNA hairpins. Three minutes after removal of the magnet, the closed state
of DNA hairpins was observed by fluorescence. The magnet was positioned and
removed for several cycles to measure the change between shrinkage and extension of
the DNA nanomotor.
Results and Discussion
The DNA hairpins and biotinylated linker are summarized in Table 4-1.
Specifically, DNA hairpin structures were selected because they can be switched from
the “closed” (contraction) state to the “open” (extension) state. Each DNA hairpin has 20
thymidine (T) bases in the loop and 6, 9, or 12 base pairs (6ds, 9ds, or 12ds) in the
stem part. In order to visualize movement between the two states, a fluorophore (FAM)
is attached to one arm of the stem and a quencher (Dabcyl) on the other arm of the
stem. Poly T (20 bases) was used as the spacer between DNA hairpins and magnetic
beads at the 3’ end, and 15 bases were incorporated at the 5’ end to hybridize with a
DNA linker which was immobilized on a glass surface. It is necessary to point out that
the fluorescence resonance energy transfer (FRET) pair is not needed for motor
function but gives a convenient way to monitor the motion of the motor. The
fluorescence intensity is related to the distance between the FRET pair in the stem
ends, which indicates the closed or open state of the DNA nanomotor
movement.99,145,146 As shown in Figure 4-1, an external magnetic field attracts the
magnetic beads, which are conjugated to the 5’ end of the DNA molecular probes, to
trigger the opening and closing of DNA hairpins. In order to control the movement, the 3’
end is tethered to a glass surface. In the absence of the magnetic field, the DNA

93
hairpins are in the contracted state and the fluorophore is quenched by FRET. When
the external magnetic field is applied, the magnetic beads are attracted to the magnet
and cause the DNA hairpins to extend, restoring the fluorescence signal.
Signal Enhancement of the DNA Molecular Probes by Dnase I Cleavage
The signal enhancement of three DNA hairpins in solution was tested and the
results are shown in Figure 4-2. The DNA hairpins with longer stems exhibit lower
background fluorescence, however, the DNA hairpins with fewer base pairs in the stem
yielded higher signal enhancement after DNase I addition by the higher enzymatic
cleavage efficiency.
We further tested the signal enhancement of the DNA hairpins immobilized on
glass surface by DNase I. Since the DNA nanomotor will be immobilized and operated
on a glass surface, the fluorescence signal enhancement of each DNA hairpin on the
micro-channel surface was also determined. Equation 4-1 was also used to calculate
the signal enhancement for DNA hairpins immobilized on the glass slide, and the results
are shown in Figure 4-3. On the glass surface, the signal enhancement of DNA hairpins
decreases significantly compared to that of DNA hairpins in solution. Whereas DNA
hairpins can typically achieve fluorescence enhancements above 25-fold in solution,
these values can drop to 2 to 5-fold once immobilized. This behavior mainly results from
the interaction between the DNA hairpins and the surface, which disrupts the loop and
destabilizes the DNA hairpins’ structures. This can cause inefficient quenching, which is
reflected in higher background signal, thus results in lower signal enhancement.
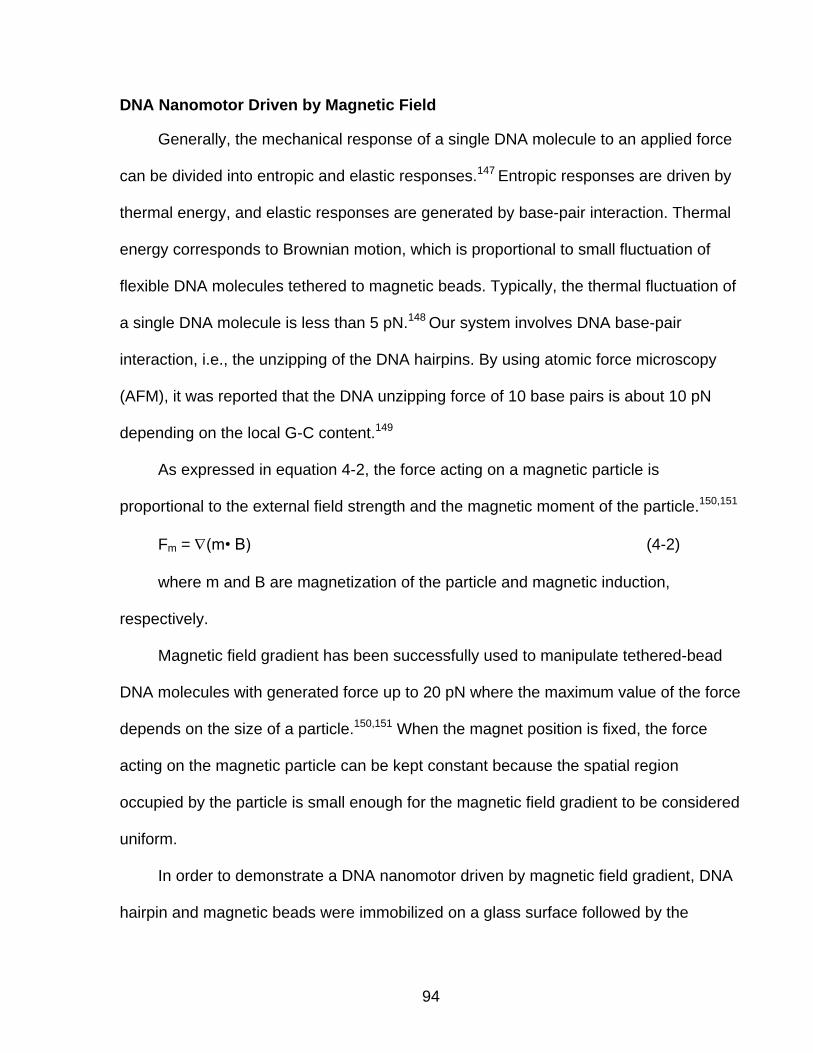
94
DNA Nanomotor Driven by Magnetic Field
Generally, the mechanical response of a single DNA molecule to an applied force
can be divided into entropic and elastic responses.147 Entropic responses are driven by
thermal energy, and elastic responses are generated by base-pair interaction. Thermal
energy corresponds to Brownian motion, which is proportional to small fluctuation of
flexible DNA molecules tethered to magnetic beads. Typically, the thermal fluctuation of
a single DNA molecule is less than 5 pN.148 Our system involves DNA base-pair
interaction, i.e., the unzipping of the DNA hairpins. By using atomic force microscopy
(AFM), it was reported that the DNA unzipping force of 10 base pairs is about 10 pN
depending on the local G-C content.149
As expressed in equation 4-2, the force acting on a magnetic particle is
proportional to the external field strength and the magnetic moment of the particle.150,151
Fm = (m• B) (4-2)
where m and B are magnetization of the particle and magnetic induction,
respectively.
Magnetic field gradient has been successfully used to manipulate tethered-bead
DNA molecules with generated force up to 20 pN where the maximum value of the force
depends on the size of a particle.150,151 When the magnet position is fixed, the force
acting on the magnetic particle can be kept constant because the spatial region
occupied by the particle is small enough for the magnetic field gradient to be considered
uniform.
In order to demonstrate a DNA nanomotor driven by magnetic field gradient, DNA
hairpin and magnetic beads were immobilized on a glass surface followed by the

95
investigation of magnetically controlled process. To optimize the motor system, two
design factors were investigated: the number of base pairs in the stem part of the DNA
hairpins and the size of magnetic beads. In normal condition, the DNA hairpins were in
the contracted (closed) conformation, and the hairpin structure was maintained. When
the external field was applied to drive the movement of the DNA nanomotor, the
magnetic particles experienced sufficient force to unzip and extend the DNA hairpins as
the power stroke of the motor. After removal of the external field, the DNA molecular
probes reformed to the hairpin structure as the recovery stroke. By repeated application
and removal of the external magnetic field, the DNA hairpins can be regarded as a
reversible DNA nanomotor as demonstrated by the fluorescence signal changes shown
in Figure 4-4A. It is important to point out that the extension of DNA molecular probes
as the power stroke occurred within 1 minute and a few minutes were used to reform
the hairpins as the recovery stroke.
Based on the assumption that the diameter of the DNA duplex is 2.2 nm and the
distance between two bases is 0.34 nm, we estimated the distance variation between
closed and open states to be 2.2 nm and 10.8 nm, respectively, for the DNA hairpin with
6 base pairs in the stem part.67,150 Accordingly, molecular motors moving with larger
steps generate more forces. Therefore, to change distance and create a larger working
stroke, the number of base pairs in the stem part of the DNA hairpins was varied. As
such, longer distance in the open state, i.e., from 10.8 nm to 12.9 and 14.9 nm, was
achieved by changing from 6 to 9 and 12 base pairs in the stem part of the DNA hairpin,
respectively. However, increasing the number of base pairs requires more force to unzip
the DNA hybridization resulting in slightly less fluorescence intensity change for each
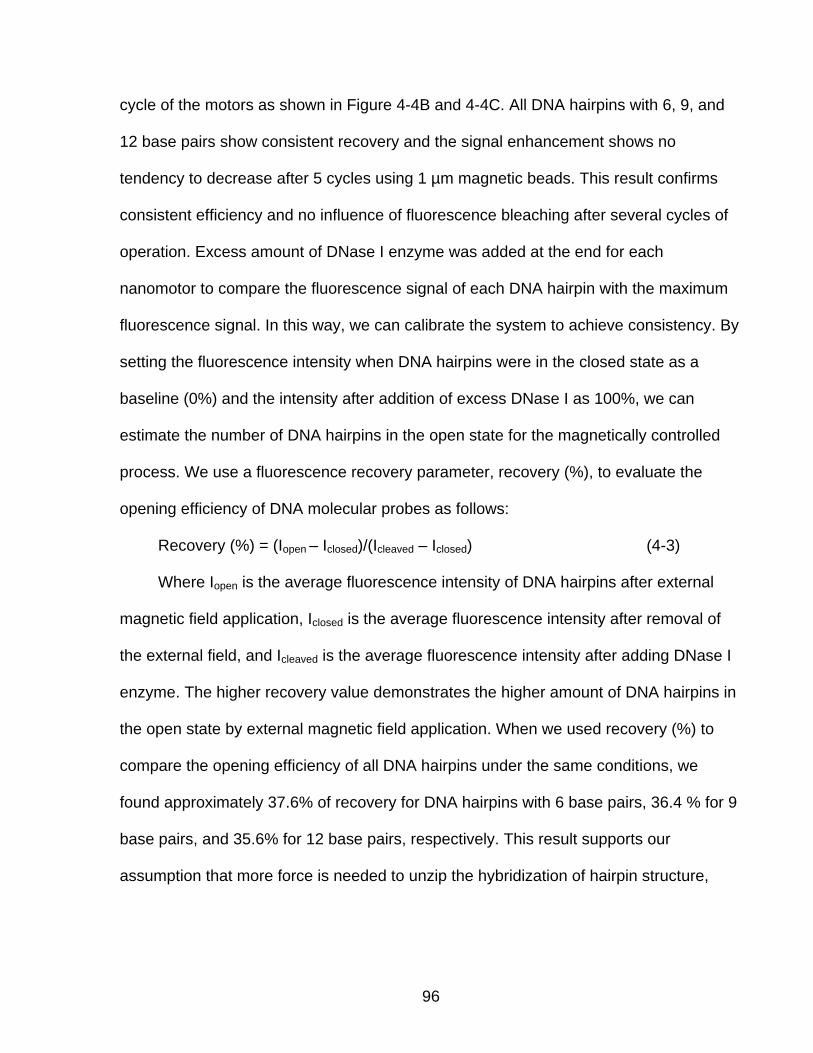
96
cycle of the motors as shown in Figure 4-4B and 4-4C. All DNA hairpins with 6, 9, and
12 base pairs show consistent recovery and the signal enhancement shows no
tendency to decrease after 5 cycles using 1 µm magnetic beads. This result confirms
consistent efficiency and no influence of fluorescence bleaching after several cycles of
operation. Excess amount of DNase I enzyme was added at the end for each
nanomotor to compare the fluorescence signal of each DNA hairpin with the maximum
fluorescence signal. In this way, we can calibrate the system to achieve consistency. By
setting the fluorescence intensity when DNA hairpins were in the closed state as a
baseline (0%) and the intensity after addition of excess DNase I as 100%, we can
estimate the number of DNA hairpins in the open state for the magnetically controlled
process. We use a fluorescence recovery parameter, recovery (%), to evaluate the
opening efficiency of DNA molecular probes as follows:
Recovery (%) = (Iopen – Iclosed)/(Icleaved – Iclosed) (4-3)
Where Iopen is the average fluorescence intensity of DNA hairpins after external
magnetic field application, Iclosed is the average fluorescence intensity after removal of
the external field, and Icleaved is the average fluorescence intensity after adding DNase I
enzyme. The higher recovery value demonstrates the higher amount of DNA hairpins in
the open state by external magnetic field application. When we used recovery (%) to
compare the opening efficiency of all DNA hairpins under the same conditions, we
found approximately 37.6% of recovery for DNA hairpins with 6 base pairs, 36.4 % for 9
base pairs, and 35.6% for 12 base pairs, respectively. This result supports our
assumption that more force is needed to unzip the hybridization of hairpin structure,

97
when more base pairs are added. However, the recovery of each DNA molecular probe
is slightly different.
Since the external magnetic field gradient is kept constant, the maximum force
reacts to DNA nanomotor depends on the size of the magnetic particle. In order to
generate different forces for the power stroke to drive the DNA nanomotor, the effect of
different sizes of magnetic beads was also observed using 2.8 µm and 0.2 µm magnetic
particles, as shown in Figure 4-5, Figure 4-6 and Figure 4-7, respectively. Interestingly,
all DNA hairpins show slightly lower signal enhancement for each cycle when the larger
particles were used. This behavior of the 2.8 µm system is mainly attributed to a lower
signal in the opened state compared to the 1 µm system. The larger particles have a
larger radius of curvature and this allows more hairpins to form the link between the
surface and the bead, thus increasing the force needed to pull the bead away from the
surface. This increase in force to open more hairpins is balanced by the increase in
force created by using a larger particle. However, when 0.2 µm of magnetic particles
were attached to the DNA hairpins, there was no change in fluorescence intensity after
applying the magnetic field (Figure 4-7A). The smaller magnetic particles experienced
smaller magnetic force because of the saturation of their magnetic susceptibility, which
was insufficient to unzip the hairpin structure. The average signal enhancement of
different DNA hairpins and magnetic particles is summarized in Table 4-2.
In addition, a control experiment was performed by using 6ds hairpins attached to
5 µm silica particles. The results demonstrated that the fluorescence signal did not
change after cycling the external magnetic field (Figure 4-7D), confirming that the

98
fluorescence intensity change from the previous system was not an artificial signal and
hairpins tethered to magnetic beads can be manipulated by the applied magnetic field.
Conclusion
In conclusion, a magnetically driven DNA nanomotor using DNA hairpins
conjugated to magnetic particles has been successfully demonstrated. Specifically,
DNA hairpins with different numbers of base pairs in the stem were synthesized. One
end of the DNA hairpin was immobilized on the glass surface of a micro-channel and
the other end was attached to iron oxide particles. An external magnetic field was then
applied to pull the iron oxide particles away from the glass surface. This pulling force
opens the hairpin, as observed by an increased fluorescence signal, and is interpreted
as the power stroke. Removal of the magnetic field reforms the closed state of DNA
hairpins, as observed by decreased fluorescence signal, and represents the recovery
stroke. Motorization of the nanodevice results from the cyclical shrinking and extending
movements. This DNA nanomotor holds promise for a new class of nanomachines that
can be operated by magnetic field without any additional DNA strands as fuels. In
addition, using magnetic field to control the movement of molecules can also avoid
molecular damage from photonic fluxes, which in contrast to previous photoregulated
DNA nanomotors.

99
B = 0
Iron oxide particle
Glass surface
B > 0
Avidin Biotin DNA hairpin DNA linker DAB FAM
Glass surface
Iron oxide particle
Figure 4-1. Concept of magnetically driven DNA nanomotor.152 One end of DNA
hairpins were immobilized on a glass surface and the other conjugated to magnetic particles. DNA hairpins molecules were opened by an external magnetic field gradient and subsequently closed through DNA hybridization after the removal of the magnetic field. We interpret the separation of the 5’ and 3’ ends of the DNA hairpin during opening as the power stroke of our nanomotor and the hybridization of the hairpin as the recovery stroke.

100
0
1000000
2000000
3000000
4000000
5000000
6000000
7000000
0 500 1000 1500 2000 2500 3000 3500
Flu
ore
sce
nce
Inte
ns
ity
Time (s)
DNA hairpin added
DNase I added
6ds
9ds
12ds
A
0
2
4
6
8
10
12
14
6ds 9ds 12ds
DNA hairpins
Sig
na
l En
ha
nc
em
en
t
B
Figure 4-2. Signal enhancement of DNA hairpins in solution after the addition of DNase I.152 Fluorescence emission at 520 nm was measured for the DNA hairpins after DNase I addition: [DNA hairpin] = 100nM, DNase I = 2000 U/mL, and buffer is 20 mM Tris-HCl buffer pH 7.4, Na+ = 100 nM, Mg2+ = 10 mM

101
0
0.5
1
1.5
2
2.5
3
3.5
6ds 9ds 12dsS
ign
al E
nh
an
ce
me
nt
DNA hairpins
Figure 4-3. Signal enhancement of DNA hairpins on the glass surface of micro-channel after DNase I addition.152 Fluorescence emission at 520 nm was measured for the DNA hairpins after DNase I addition: [DNA hairpin] = 5µM, DNase I = 2000 U/mL, and buffer is 20 mM Tris-HCl buffer pH 7.4, Na+ = 100 nM, Mg2+ = 10 mM
0
0.2
0.4
0.6
0.8
1
No
rmaliz
ed
F.I.
6ds-1.0 µm MNP
0
0.2
0.4
0.6
0.8
1
No
rmaliz
ed
F.I.
9ds-1.0 µm MNP
0
0.2
0.4
0.6
0.8
1
No
rmaliz
ed
F.I.
12ds-1.0 µm MNP
A B
C
Figure 4-4. Cycles of closed-open state from DNA hairpins with 6 (A), 9 (B), and 12 (C) base pairs, respectively, conjugated with 1.0 µm magnetic beads.152 The cycles were demonstrated by repeated application (Bn) and removal (Rn) of the magnetic field.

102
0
0.2
0.4
0.6
0.8
1
No
rmaliz
ed
F.I.
6ds-2.8 µm MNP
0
0.2
0.4
0.6
0.8
1
No
rmaliz
ed
F.I.
9ds-2.8µm MNP
0
0.2
0.4
0.6
0.8
1
12ds-2.8µm MNP
A B
C
Figure 4-5. Cycles of closed-open state from DNA hairpins with 6 (A), 9 (B), and 12 (C) base pairs, respectively, conjugated with 2.8 µm magnetic beads.152 The cycles were represented by repeated application (Bn) and removal (Rn) of the magnetic field.
0
0.2
0.4
0.6
0.8
1
No
rmaliz
ed
F.I.
6ds-0.2 µm MNP
0
0.2
0.4
0.6
0.8
1
No
rmaliz
ed
F.I.
9ds-0.2µm MNP
A B
C
0
0.2
0.4
0.6
0.8
1
No
rmaliz
ed
F.I.
12ds-0.2µm MNP
Figure 4-6. Cycles of closed-open state from DNA hairpins with 6 (A), 9 (B), and 12 (C) base pairs, respectively, conjugated with 0.2 µm magnetic beads.152 The cycles were demonstrated by repeated application (Bn) and removal (Rn) of the magnetic field.

103
0
0.2
0.4
0.6
0.8
1
No
rmaliz
ed
F.I.
6ds-1.0 µm MNP
0
0.2
0.4
0.6
0.8
1
No
rmaliz
ed
F.I.
6ds-0.2 µm MNP
0
0.2
0.4
0.6
0.8
1
No
rmaliz
ed
F.I.
6ds-2.8 µm MNP
0
0.2
0.4
0.6
0.8
1
No
rmaliz
ed
F.
I.
6ds-5.0 µm SiNP
A B
C D
Figure 4-7. Magnetic beads effect on the DNA nanomotor.152 Cycles of closed-open state from 6 base pair DNA hairpins; (a) 0.2 µm, (b) 1.0 µm, and (c) 2.8 µm magnetic particle; (d) a control experiment using 5.0 µm silica particle.

104
Table 4-1. DNA hairpins and biotinylated linker. Stem bases are underlined.
DNA hairpins
Meltinga
Temperature (Cº)
6ds
5’- TGG TGT GGT TGG TGG TTT –FAM- CCA TCG TTT TTT TTT TTT TTT TTT TTC GAT GG-DAB-T TTT TTT TTT TTT TTT TTT T-Biotin-3’
66.5
9ds
5’- TGG TGT GGT TGG TGG TTT –FAM-CCG CCA TCG TTT TTT TTT TTT TTT TTT TTC GAT GGC GG-DAB-T TTT TTT TTT TTT TTT TTT T-Biotin-3’
68.9
12ds
5’- TGG TGT GGT TGG TGG TTT –FAM-CCG CCG CCA TCG TTT TTT TTT TTT TTT TTT TTC GAT GGC GGC GG-DAB-T TTT TTT TTT TTT TTT TTT T- Biotin-3’
70.8
Linker 5’- CCA CCA ACC ACA CCA TTT TTT TTT T-Biotin-3’
a Calculated melting temperature from IDT website
Table 4-2. The average signal enhancement of nanomotor after repeating several cycles.
MNP
Signal Enhancement
6ds 9ds 12ds
2.8µm 1.7 1.6 1.4 1.0µm 2.1 2.0 1.8 0.2µm No change No change No change

105
CHAPTER 5 SUMMARY AND FUTURE DIRECTIONS
The Development of DNA-Conjugated Magnetic Nanoparticles for Bio-Analytical and Biomedical Applications
Great efforts have been made toward the improvement of highly sensitive and
selective medical diagnostic tools to meet the demand for rapid and accurate disease
screening, especially for cancer. Nanomaterials, whose properties can be tuned by size
and shape, are used not only in material science but also in the translation of
nanotechnology to medical practice. Specifically, magnetic nanoparticles (MNPs) have
attracted the attention of scientists as multimodal nanoplatforms with both diagnostic
and therapeutic functionalities. Owing to their large surface-to-volume ratios and
magnetic properties, selective recognition elements, including oligonucleotides, can be
loaded onto MNPs’ surfaces for targeting, separating, and imaging. Besides carrying
genetic information, DNA is renowned for the specificity of Watson-Crick base pairing,
which provides highly specific molecular recognition and enables programmed
sequences and structures.
Integration of MNPs and DNA to construct hybrid materials has led to the
development of advanced bioanalysis tools and fabrication of novel DNA-based
nanomachines. In this research, three key projects have been demonstrated: 1)
molecular profiling of cancer cells using aptamer-conjugated magnetic nanoparticles; 2)
detection of lysozyme using magnetic relaxation switches based on aptamer-
functionalized superparamagnetic nanoparticles; 3) magnetically driven single DNA
nanomotor.
We first applied DNA aptamers conjugated to MNPs as magnetic nanosensors
based on the magnetic relaxation switch (MRSw) mechanism. Aptamer conjugated

106
MNPs (ACMNPs) switched from their original dispersed to aggregated states upon
binding with target cells. The aggregation induced the formation of magnetic clusters
generating the coupling of magnetic moments and resulting in a decrease in the spin-
spin relaxation times (T2) of the surrounding water protons. The change in T2 (ΔT2)
indicated the binding of ACMNPs to their target cells. The synergism between the large
surface area of MNPs and the high specificity of aptamers played a key role in high
selectivity and sensitivity. The magnetic nanosensors were able to detect as few as 10
target cancer cells in both buffer and biological media, as well as in a mixture of cells.
Additionally, a molecular profiling of cancer cells was designed by using an array of
ACMNPs. Due to different affinity of aptamers to each cell type, distinct recognition
patterns were generated allowing the accurate identification of cancer cells.
The expansion of MRSw-based nanosensors was demonstrated for protein
detection. Lysozyme which has high affinity for its aptamer was selected as a model
protein. In this system, MNPs were conjugated with either aptamers or linker DNA that
could hybridize to the extended part of aptamers leading to magnetic cluster formation.
The presence of targets induced the base-pair disruption of aptamers resulting in the
disassembly of pre-existing clusters and an increase in T2. The high selectivity and
sensitivity of detection was achieved in both buffer and serum. The successful
identification of lysozyme in cancer cell lysates was also demonstrated.
These studies validated the potential of using DNA-conjugated MNPs as magnetic
nanosensors for a wide range of molecular targets. With low magnetic background, high
sensitivity was achieved in biological samples without separation, purification,
amplification and washing steps. Furthermore, the detection could be performed using a

107
bench top relaxometer, which provides rapid results, and easy to operate. Considering
theses advantages, this method is feasible for clinical diagnostics.
Besides using DNA-conjugated MNPs as bioanalysis tools, a DNA-based
nanomachine driven by magnetic fields was also demonstrated. DNA hairpins were
selected to serve as a dynamic part of the molecular motor due to their ability to shrink
and extend by external stimuli. DNA hairpins were immobilized onto a glass surface and
then conjugated to magnetic particles. The application of an external magnetic field
triggered the switch of molecular conformation between closed and open states. The
movement of a nanomotor could be tracked by the change of fluorescence from the
intercalated fluorophore and quencher in DNA hairpin structures. By repetitive shrinking
and extending movements, DNA hairpins were considered as a nanometer-scale motor.
Overall, this research mainly focused on the development of DNA-conjugated
MNPs for cancer detection and the fabrication of DNA-based nanomotor. A successful
outcome from these studies will lead to advanced hybrid nanomaterials for bioanalysis,
biomedical applications, and bionanomaterial research.
Future Directions
Although magnetic nanosensors have shown advantages in simple and sensitive
detection, they still have some limitations. In chapter 3, we demonstrated that the
presence of targets triggered the disassembly of magnetic nanoclusters and the T2
increase was observed. However, a small numbers of targets may not be sufficient to
induce the disassembly of pre-existing clusters. Typically, a certain number of analyte
molecules is always needed to disrupt magnetic clusters and generate significant
changes in T2, thus limiting sensitivity of detection. In order to improve the efficiency of

108
magnetic nanosensors for rare target detection, an enzymatic reaction could be
incorporated into magnetic nanosensors for signal amplification.
It has been found that DNA also has catalytic activity and can catalyze a number
of biochemical reactions, including RNA or DNA cleavage, ligation, and DNA-self
modification.126,153 Catalytically active DNA molecules are known as deoxyribozymes or
DNAzymes and can be obtained by the SELEX process.154,155 Typically, catalytic
activities of DNAzymes are dependent on metal-ions, especially transition-metal ions.
DNAzymes that are specific for Pb2+,156 Cu2+,157 Zn2+,158 and Co2+ 159 have been
reported. Compared to RNA molecules or proteins, DNAzymes are much more stable,
and the synthesis, as well as modification, is relatively easy. Consequently, DNAzymes
are used as analytical tools for metal ion detections.160
By taking advantage of DNAzymes’ catalytic activity and their ease of synthesis
and modification, we are attempting to apply DNAzymes into magnetic nanosensors
system. The Pb2+dependent DNAzyme is selected due to its relatively high catalytic
efficiency and structural stability,156 and is designed to have 7 extended bases in order
to hybridize with a part of the lysozyme aptamer (as shown in Figure 7-1). The twelve
base-pairs between DNAzyme and aptamer can maintain stable duplex at room
temperature. To assemble magnetic nanoclusters, the DNAzyme substrate containing a
single RNA linkage (rA) as the cleavage site is extended on both ends by 12 bases to
be complementary to the linker DNA attached to MNPs. In the presence of lysozyme
targets, aptamers undergo structural change and DNAzymes are released. By the
addition of pre-existing magnetic nanoclusters having substrates as linkers, the
released DNAzymes recognize and cleave the substrates inducing cluster disassembly.

109
After cleavage, DNAzymes can leave the cleaved substrates and catalyze the cleavage
of other nearby substrates. In this way, the catalytic reaction can cycle several times
with only a few target molecules. Consequently, disassembly of magnetic nanoclusters
can be triggered, resulting in an increase in T2. With DNAzyme’s catalytic activity, ease
of synthesis, and sequence modification, combined with the flexibility of the MRSw to
sense various types of targets, it is very likely that DNAzyme-based magnetic
nanosensors will become highly efficient bioanalysis tools for clinical applications.

110
Figure 7-1. Schematic representation of DNAzyme-based magnetic nanosensor for Lys
detection. The sequences of DNAzyme, substrate, linker, and Lys aptamer are shown. The underlined based are the extended parts of either DNAzyme or aptamer. The highlight demonstrates the complementary parts between DNAzyme and aptamer.
111
LIST OF REFERENCES
(1) Alivisatos, A. P. Science 1996, 271, 933. (2) Daniel, M. C.; Astruc, D. Chem. Rev. 2004, 104, 293. (3) Wang, H.; Yang, R.; Yang, L.; Tan, W. ACS nano 2009, 3, 2451. (4) Cheon, J.; Lee, J. H. Acc. Chem. Res. 2008, 41, 1630. (5) Hirschfeld, T.; Callis, J. B.; Kowalski, B. R. Science 1984, 226, 312. (6) Elghanian, R.; Storhoff, J. J.; Mucic, R. C.; Letsinger, R. L.; Mirkin, C. A. Science
1997, 277, 1078. (7) Cao, Y. C.; Jin, R.; Nam, J. M.; Thaxton, C. S.; Mirkin, C. A. J. Am. Chem. Soc.
2003, 125, 14676. (8) Seeman, N. C. Nature 2003, 421, 427. (9) Yang, D.; Campolongo, M. J.; Nhi Tran, T. N.; Ruiz, R. C.; Kahn, J. S.; Luo, D.
Wiley Interdiscip. Rev. Nanomed. Nanobiotechnol. 2010, 2, 648. (10) Yurke, B.; Turberfield, A. J.; Mills, A. P., Jr.; Simmel, F. C.; Neumann, J. L.
Nature 2000, 406, 605. (11) Tian, Y.; Mao, C. J. Am. Chem. Soc. 2004, 126, 11410. (12) Shin, J. S.; Pierce, N. A. J. Am. Chem. Soc. 2004, 126, 10834. (13) Yin, P.; Yan, H.; Daniell, X. G.; Turberfield, A. J.; Reif, J. H. Angew. Chem. Int.
Ed. 2004, 43, 4906. (14) Green, S. J.; Lubrich, D.; Turberfield, A. J. Biophys. J. 2006, 91, 2966. (15) Jun, Y. W.; Seo, J. W.; Cheon, J. Acc. Chem. Res. 2008, 41, 179. (16) Jun, Y. W.; Lee, J. H.; Cheon, J. Angew. Chem. Int. Ed. 2008, 47, 5122. (17) Morales, M. P.; Veintemillas-Verdaguer, S.; Montero, M. I.; Serna, C. J.; Roig, A.;
Casas, L.; Martinez, B.; Sandiumenge, F. Chem. Mater. 1999, 11, 3058. (18) Laurent, S.; Forge, D.; Port, M.; Roch, A.; Robic, C.; Vander Elst, L.; Muller, R. N.
Chem. Rev. 2008, 108, 2064. (19) Minelli, C.; Lowe, S. B.; Stevens, M. M. Small 2010, 6, 2336.
112
(20) Gupta, A. K.; Gupta, M. Biomaterials 2005, 26, 3995. (21) Jolivet, J. P.; Chaneac, C.; Tronc, E. Chem. Commun. 2004, 481. (22) Babes, L.; Denizot, B.; Tanguy, G.; Le Jeune, J. J.; Jallet, P. J. Colloid Interface
Sci. 1999, 212, 474. (23) Gribanov, N. M.; Bibik, E. E.; Buzunov, O. V.; Naumov, V. N. J. Magn. Magn.
Mater. 1990, 85, 7. (24) Hyeon, T.; Lee, S. S.; Park, J.; Chung, Y.; Na, H. B. J. Am. Chem. Soc. 2001,
123, 12798. (25) Vincent, B.; Edwards, J.; Emmett, S.; Jones, A. Colloids Surf. 1986, 18, 261. (26) Molday, R. S.; MacKenzie, D. J. Immunol. Methods 1982, 52, 353. (27) Kohler, N.; Fryxell, G. E.; Zhang, M. J. Am. Chem. Soc. 2004, 126, 7206. (28) Stober, W.; Fink, A.; Bohn, E. J. Colloid Interface Sci. 1968, 26, 62. (29) Turney, K.; Drake, T. J.; Smith, J. E.; Tan, W.; Harrison, W. W. Rapid Commun.
Mass Spectrom. 2004, 18, 2367. (30) Lindberg, R.; Sjoblom, J.; Sundholm, G. Colloids and Surfaces a-
Physicochemical and Engineering Aspects 1995, 99, 79. (31) Yamauchi, H.; Ishikawa, T.; Kondo, S. Colloids Surf. 1989, 37, 71. (32) Sun, E. Y.; Josephson, L.; Kelly, K. A.; Weissleder, R. Bioconjugate Chem. 2006,
17, 109. (33) Wang, L., Wang, K., Santra, S., Zhao, X., Hilliard, L. R., Smith, J. E., Wu, Y.,
Tan, W. Anal. Chem. 2006, 78, 646. (34) Vanblaaderen, A.; Imhof, A.; Hage, W.; Vrij, A. Langmuir : the ACS journal of
surfaces and colloids 1992, 8, 1514. (35) Vanblaaderen, A.; Vrij, A. J. Colloid Interface Sci. 1993, 156, 1. (36) Inouye, K.; Endo, R.; Otsuka, Y.; Miyashiro, K.; Kaneko, K.; Ishikawa, T. J. Phys.
Chem. 1982, 86, 1465. (37) Calvin, S.; Carpenter, E. E.; Harris, V. G. Phys. Rev. B 2003, 68.

113
(38) Haun, J. B.; Yoon, T. J.; Lee, H.; Weissleder, R. Wiley Interdiscip. Rev. Nanomed. Nanobiotechnol. 2010, 2, 291.
(39) Kotitz, R.; Matz, H.; Trahms, L.; Koch, H.; Weitschies, W.; Rheinlander, T.;
Semmler, W.; Bunte, T. Ieee T Appl Supercon 1997, 7, 3678. (40) Baselt, D. R.; Lee, G. U.; Natesan, M.; Metzger, S. W.; Sheehan, P. E.; Colton,
R. J. Biosens. Bioelectron. 1998, 13, 731.
(41) Graham, D. L.; Ferreira, H. A.; Freitas, P. P.; Cabral, J. M. Biosens. Bioelectron.
2003, 18, 483. (42) Aytur, T.; Foley, J.; Anwar, M.; Boser, B.; Harris, E.; Beatty, P. R. J. Immunol.
Methods 2006, 314, 21. (43) Koenig, S. H.; Kellar, K. E. Magnetic resonance in medicine : official journal of
the Society of Magnetic Resonance in Medicine / Society of Magnetic Resonance in Medicine 1995, 34, 227.
(44) Maeda, H.; Fang, J.; Inutsuka, T.; Kitamoto, Y. Int. Immunopharmacol. 2003, 3,
319. (45) Lee, H.; Lee, E.; Kim do, K.; Jang, N. K.; Jeong, Y. Y.; Jon, S. J. Am. Chem. Soc.
2006, 128, 7383. (46) Sun, C.; Veiseh, O.; Gunn, J.; Fang, C.; Hansen, S.; Lee, D.; Sze, R.;
Ellenbogen, R. G.; Olson, J.; Zhang, M. Small 2008, 4, 372. (47) Lee, J. H.; Huh, Y. M.; Jun, Y. W.; Seo, J. W.; Jang, J. T.; Song, H. T.; Kim, S.;
Cho, E. J.; Yoon, H. G.; Suh, J. S.; Cheon, J. Nat. Med. 2007, 13, 95. (48) Xu, C.; Xie, J.; Ho, D.; Wang, C.; Kohler, N.; Walsh, E. G.; Morgan, J. R.; Chin,
Y. E.; Sun, S. Angew. Chem. Int. Ed. 2008, 47, 173. (49) Koh, I.; Josephson, L. Sensors 2009, 9, 8130. (50) Demas, V.; Lowery, T. J. New J Phys 2011, 13. (51) Kaittanis, C.; Santra, S.; Santiesteban, O. J.; Henderson, T. J.; Perez, J. M. J.
Am. Chem. Soc. 2011, 133, 3668. (52) Grimm, J.; Perez, J. M.; Josephson, L.; Weissleder, R. Cancer Res. 2004, 64,
639. (53) Lee, H.; Sun, E.; Ham, D.; Weissleder, R. Nat. Med. 2008, 14, 869.

114
(54) Lee, H.; Yoon, T. J.; Weissleder, R. Angew. Chem. Int. Ed. 2009, 48, 5657. (55) Tan, W.; Wang, K.; Drake, T. J. Curr. Opin. Chem. Biol. 2004, 8, 547. (56) Yang, C. J.; Jockusch, S.; Vicens, M.; Turro, N. J.; Tan, W. Proc. Natl. Acad. Sci.
U. S. A. 2005, 102, 17278. (57) Tan, L.; Li, Y.; Drake, T. J.; Moroz, L.; Wang, K.; Li, J.; Munteanu, A.; Chaoyong,
J. Y.; Martinez, K.; Tan, W. The Analyst 2005, 130, 1002. (58) Shangguan, D.; Li, Y.; Tang, Z.; Cao, Z. C.; Chen, H. W.; Mallikaratchy, P.;
Sefah, K.; Yang, C. J.; Tan, W. Proc. Natl. Acad. Sci. U. S. A. 2006, 103, 11838. (59) Baron, R.; Willner, B.; Willner, I. Chem. Commun. 2007, 323. (60) Willner, I.; Baron, R.; Willner, B. Biosens. Bioelectron. 2007, 22, 1841. (61) Gellert, M.; Lipsett, M. N.; Davies, D. R. Proc. Natl. Acad. Sci. U. S. A. 1962, 48,
2013. (62) Leroy, J. L.; Gueron, M.; Mergny, J. L.; Helene, C. Nucleic Acids Res. 1994, 22,
1600. (63) Winfree, E.; Liu, F.; Wenzler, L. A.; Seeman, N. C. Nature 1998, 394, 539. (64) Liu, D.; Wang, M.; Deng, Z.; Walulu, R.; Mao, C. J. Am. Chem. Soc. 2004, 126,
2324. (65) Bath, J.; Turberfield, A. J. Nature nanotechnology 2007, 2, 275. (66) Beissenhirtz, M. K.; Willner, I. Org. Biomol. Chem. 2006, 4, 3392. (67) Simmel, F. C.; Dittmer, W. U. Small 2005, 1, 284. (68) Liu, H.; Liu, D. Chem. Commun. 2009, 2625. (69) Litman, G. W.; Rast, J. P.; Shamblott, M. J.; Haire, R. N.; Hulst, M.; Roess, W.;
Litman, R. T.; Hinds-Frey, K. R.; Zilch, A.; Amemiya, C. T. Mol. Biol. Evol. 1993, 10, 60.
(70) Conrad, R.; Keranen, L. M.; Ellington, A. D.; Newton, A. C. J. Biol. Chem. 1994,
269, 32051. (71) Macaya, R. F.; Schultze, P.; Smith, F. W.; Roe, J. A.; Feigon, J. Proc. Natl. Acad.
Sci. U. S. A. 1993, 90, 3745.

115
(72) Famulok, M.; Mayer, G. Curr. Top. Microbiol. Immunol. 1999, 243, 123. (73) Hicke, B. J.; Marion, C.; Chang, Y. F.; Gould, T.; Lynott, C. K.; Parma, D.;
Schmidt, P. G.; Warren, S. J. Biol. Chem. 2001, 276, 48644. (74) Sefah, K.; Shangguan, D.; Xiong, X.; O'Donoghue, M. B.; Tan, W. Nature
protocols 2010, 5, 1169. (75) Seeman, N. C. J. Theor. Biol. 1982, 99, 237. (76) Pohl, F. M.; Jovin, T. M. J. Mol. Biol. 1972, 67, 375. (77) Mao, C.; Sun, W.; Shen, Z.; Seeman, N. C. Nature 1999, 397, 144. (78) Howard, J.; Hudspeth, A. J.; Vale, R. D. Nature 1989, 342, 154. (79) Turberfield, A. J.; Mitchell, J. C.; Yurke, B.; Mills, A. P., Jr.; Blakey, M. I.; Simmel,
F. C. Phys. Rev. Lett. 2003, 90, 118102. (80) SantaLucia, J., Jr. Proc. Natl. Acad. Sci. U. S. A. 1998, 95, 1460. (81) Liu, H.; Xu, Y.; Li, F.; Yang, Y.; Wang, W.; Song, Y.; Liu, D. Angew. Chem. Int.
Ed. 2007, 46, 2515. (82) Liu, D.; Bruckbauer, A.; Abell, C.; Balasubramanian, S.; Kang, D. J.; Klenerman,
D.; Zhou, D. J. Am. Chem. Soc. 2006, 128, 2067. (83) Liedl, T.; Olapinski, M.; Simmel, F. C. Angew. Chem. Int. Ed. 2006, 45, 5007. (84) Kang, H.; Liu, H.; Phillips, J. A.; Cao, Z.; Kim, Y.; Chen, Y.; Yang, Z.; Li, J.; Tan,
W. Nano Lett. 2009, 9, 2690. (85) Lakowicz, J. R. Principles of fluorescence spectroscopy; 3rd ed.; Springer, 2006. (86) Okamoto, M.; Wada, O.; Tanaka, F.; Hirayama, S. J. Phys. Chem. A 2001, 105,
566. (87) Denicola, A.; Souza, J. M.; Radi, R.; Lissi, E. Arch. Biochem. Biophys. 1996, 328,
208. (88) Lakowicz, J. R. J. Biochem. Bioph. Methods 1980, 2, 91. (89) Jayaraman, S.; Verkman, A. S. Biophys. Chem. 2000, 85, 49.

116
(90) Sontag, B.; Reboud, A. M.; Divita, G.; Di Pietro, A.; Guillot, D.; Reboud, J. P. Biochemistry (Mosc). 1993, 32, 1976.
(91) Wasylewski, M.; Malecki, J.; Wasylewski, Z. J. Protein Chem. 1995, 14, 299. (92) Tyagi, S.; Bratu, D. P.; Kramer, F. R. Nat. Biotechnol. 1998, 16, 49. (93) Stryer, L. Annu. Rev. Biochem 1978, 47, 819. (94) Gordon, G. W.; Berry, G.; Liang, X. H.; Levine, B.; Herman, B. Biophys. J. 1998,
74, 2702. (95) Awais, M.; Sato, M.; Sasaki, K.; Umezawa, Y. Anal. Chem. 2004, 76, 2181. (96) Lei, G.; MacDonald, R. C. Biophys. J. 2003, 85, 1585. (97) Morrison, L. E.; Stols, L. M. Biochemistry (Mosc). 1993, 32, 3095. (98) Walter, N. G.; Hampel, K. J.; Brown, K. M.; Burke, J. M. The EMBO journal 1998,
17, 2378. (99) Tyagi, S.; Kramer, F. R. Nat. Biotechnol. 1996, 14, 303. (100) Na, H. B.; Song, I. C.; Hyeon, T. Adv. Mater. 2009, 21, 2133. (101) Brody, E. N.; Gold, L. J. Biotechnol. 2000, 74, 5. (102) Ellington, A. D.; Szostak, J. W. Nature 1990, 346, 818. (103) Tuerk, C.; Gold, L. Science 1990, 249, 505. (104) Osborne, S. E.; Matsumura, I.; Ellington, A. D. Curr. Opin. Chem. Biol. 1997, 1,
5. (105) Nutiu, R.; Li, Y. Angew. Chem. Int. Ed. 2005, 44, 1061. (106) Gossuin, Y.; Gillis, P.; Hocq, A.; Vuong, Q. L.; Roch, A. Wiley Interdiscip. Rev.
Nanomed. Nanobiotechnol. 2009, 1, 299. (107) Weissleder, R.; Moore, A.; Mahmood, U.; Bhorade, R.; Benveniste, H.; Chiocca,
E. A.; Basilion, J. P. Nat. Med. 2000, 6, 351. (108) Zhao, M.; Beauregard, D. A.; Loizou, L.; Davletov, B.; Brindle, K. M. Nat. Med.
2001, 7, 1241.

117
(109) Liu, W.; Dahnke, H.; Jordan, E. K.; Schaeffter, T.; Frank, J. A. NMR Biomed. 2008, 21, 242.
(110) Perez, J. M.; Josephson, L.; O'Loughlin, T.; Hogemann, D.; Weissleder, R. Nat.
Biotechnol. 2002, 20, 816. (111) Yigit, M. V.; Mazumdar, D.; Lu, Y. Bioconjugate Chem. 2008, 19, 412. (112) Kaittanis, C.; Naser, S. A.; Perez, J. M. Nano Lett. 2007, 7, 380. (113) Perez, J. M.; Simeone, F. J.; Saeki, Y.; Josephson, L.; Weissleder, R. J. Am.
Chem. Soc. 2003, 125, 10192. (114) Kaittanis, C.; Santra, S.; Perez, J. M. J. Am. Chem. Soc. 2009, 131, 12780. (115) Fang, X.; Tan, W. Acc. Chem. Res. 2010, 43, 48. (116) Herr, J. K.; Smith, J. E.; Medley, C. D.; Shangguan, D.; Tan, W. Anal. Chem.
2006, 78, 2918. (117) Smith, J. E.; Medley, C. D.; Tang, Z.; Shangguan, D.; Lofton, C.; Tan, W. Anal.
Chem. 2007, 79, 3075. (118) Deng, T.; Li, J.; Zhang, L. L.; Jiang, J. H.; Chen, J. N.; Shen, G. L.; Yu, R. Q.
Biosens. Bioelectron. 2010, 25, 1587. (119) Medley, C. D.; Smith, J. E.; Tang, Z.; Wu, Y.; Bamrungsap, S.; Tan, W. Anal.
Chem. 2008, 80, 1067. (120) Shangguan, D.; Cao, Z.; Meng, L.; Mallikaratchy, P.; Sefah, K.; Wang, H.; Li, Y.;
Tan, W. J. Proteome Res. 2008, 7, 2133. (121) Chen, Y.; O'Donoghue, M. B.; Huang, Y. F.; Kang, H.; Phillips, J. A.; Chen, X.;
Estevez, M. C.; Yang, C. J.; Tan, W. J. Am. Chem. Soc. 2010, 132, 16559. (122) Tang, Z.; Shangguan, D.; Wang, K.; Shi, H.; Sefah, K.; Mallikratchy, P.; Chen, H.
W.; Li, Y.; Tan, W. Anal. Chem. 2007, 79, 4900. (123) Sefah, K.; Tang, Z. W.; Shangguan, D. H.; Chen, H.; Lopez-Colon, D.; Li, Y.;
Parekh, P.; Martin, J.; Meng, L.; Phillips, J. A.; Kim, Y. M.; Tan, W. H. Leukemia : official journal of the Leukemia Society of America, Leukemia Research Fund, U.K 2009, 23, 235.
(124) Sefah, K.; Meng, L.; Lopez-Colon, D.; Jimenez, E.; Liu, C.; Tan, W. PLoS One
2010, 5, e14269.

118
(125) Shangguan, D.; Meng, L.; Cao, Z. C.; Xiao, Z.; Fang, X.; Li, Y.; Cardona, D.; Witek, R. P.; Liu, C.; Tan, W. Anal. Chem. 2008, 80, 721.
(126) Liu, J.; Cao, Z.; Lu, Y. Chem. Rev. 2009, 109, 1948. (127) Jain, P. K.; Huang, X.; El-Sayed, I. H.; El-Sayed, M. A. Acc. Chem. Res. 2008,
41, 1578. (128) Hunter, T. Cell 2000, 100, 113. (129) von Ahsen, O.; Bomer, U. Chembiochem : a European journal of chemical
biology 2005, 6, 481. (130) Cohen, P. Nature reviews. Drug discovery 2002, 1, 309. (131) Levinson, S. S.; Elin, R. J.; Yam, L. Clin. Chem. 2002, 48, 1131. (132) Harrison, J. F.; Lunt, G. S.; Scott, P.; Blainey, J. D. Lancet 1968, 1, 371. (133) Klockars, M.; Reitamo, S.; Weber, T.; Kerttula, Y. Acta Med. Scand. 1978, 203,
71. (134) Cox, J. C.; Ellington, A. D. Biorg. Med. Chem. 2001, 9, 2525. (135) Wang, B.; Yu, C. Angew. Chem. Int. Ed. 2010, 49, 1485. (136) Saito, N. Leuk. Lymphoma 1990, 2, 347. (137) Leculier, C.; Couprie, N.; Francina, A.; Archimbaud, E.; Adeleine, P.; Treille, D.;
Denoyel, G.; Fiere, D. Blood 1992, 79, 760. (138) Bray, D. Cell Movement: from Molecules to Motility (2nd Edition); Garland
publishing, 2001. (139) Schliwa, M.; Woehlke, G. Nature 2003, 422, 759. (140) Muller, B. K.; Reuter, A.; Simmel, F. C.; Lamb, D. C. Nano Lett. 2006, 6, 2814. (141) Tian, Y.; He, Y.; Chen, Y.; Yin, P.; Mao, C. Angew. Chem. Int. Ed. 2005, 44,
4355. (142) Bath, J.; Green, S. J.; Turberfield, A. J. Angew. Chem. Int. Ed. 2005, 44, 4358. (143) Li, J. J., Tan, W. Nano Lett. 2002, 2, 4. (144) Chen, Y.; Wang, M.; Mao, C. Angew. Chem. Int. Ed. 2004, 43, 3554.

119
(145) Fang, X.; Li, J. J.; Perlette, J.; Tan, W.; Wang, K. Anal. Chem. 2000, 72, 747A. (146) Liu, X.; Farmerie, W.; Schuster, S.; Tan, W. Anal. Biochem. 2000, 283, 56. (147) Strick, T. R.; Allemand, J. F.; Bensimon, D.; Bensimon, A.; Croquette, V. Science
1996, 271, 1835. (148) Chiou, C. C., Huang, Y. Y., CHiang, M. H., Lee, H. H., Lee, G. B.
Nanotechnology 2006, 17, 8. (149) Lang, M. J.; Fordyce, P. M.; Engh, A. M.; Neuman, K. C.; Block, S. M. Nat.
Methods 2004, 1, 133. (150) Huang, H.; Dong, C. Y.; Kwon, H. S.; Sutin, J. D.; Kamm, R. D.; So, P. T.
Biophys. J. 2002, 82, 2211. (151) Hosu, B. G.; Jakab, K.; Banki, P.; Toth, F. I.; Forgacs, G. Rev. Sci. Instrum.
2003, 74, 4158. (152) Bamrungsap, S.; Phillips, J. A.; Xiong, X.; Kim, Y.; Wang, H.; Liu, H.; Hebard, A.;
Tan, W. Small 2011, 7, 601. (153) Willner, I.; Shlyahovsky, B.; Zayats, M.; Willner, B. Chem. Soc. Rev. 2008, 37,
1153. (154) Breaker, R. R. Nat. Biotechnol. 1997, 15, 427. (155) Breaker, R. R. Science 2000, 290, 2095. (156) Breaker, R. R.; Joyce, G. F. Chem. Biol. 1994, 1, 223. (157) Cuenoud, B.; Szostak, J. W. Nature 1995, 375, 611. (158) Santoro, S. W.; Joyce, G. F.; Sakthivel, K.; Gramatikova, S.; Barbas, C. F., 3rd J.
Am. Chem. Soc. 2000, 122, 2433. (159) Mei, S. H.; Liu, Z.; Brennan, J. D.; Li, Y. J. Am. Chem. Soc. 2003, 125, 412. (160) Wang, H.; Kim, Y.; Liu, H.; Zhu, Z.; Bamrungsap, S.; Tan, W. J. Am. Chem. Soc.
2009, 131, 8221.

120
BIOGRAPHICAL SKETCH
Suwussa Bamrungsap was born in Samutsongkhram, in 1981 to Somkuan and
Wasana Bamrungsap. She obtained the scholarship from the Development and
Promotion of Science and Technology Talent Projects (DPST) to complete her high
school at Sriboonyanon School in 1999 and attended Kasetsart University to study
Chemistry. After Suwussa received her bachelor’s degree with the second class honors
in 2003, she continued her master’s degree in physical chemistry at Kasetsart
University under the supervision of Dr. Jumras Limtrakul. She obtained the scholarship
under the National Nanotechnology Center, Thailand from the Royal Thai government
and began her Doctorate study under the supervision of Dr. Weihong Tan at the
University of Florida in fall 2006. She received her Doctor of Philosophy degree in
chemistry in August 2011.