DMF: a new chapter in personalized medicine
68
Dimethyl fumarate: a new chapter in the adoption of personalized medicine in MS Gavin Giovannoni Blizard Institute, Barts and The London School of Medicine December 2014
-
Upload
gavin-giovannoni -
Category
Health & Medicine
-
view
1.748 -
download
6
Transcript of DMF: a new chapter in personalized medicine
Dimethyl fumarate: a new chapter in the adoption of personalized medicine in MS
Gavin Giovannoni
Blizard Institute, Barts and The London School of Medicine
December 2014

Disclosures
Over the last 15 years Professor Giovannoni has received personal compensation for participating on Advisory Boards in relation to clinical trial design, trial steering committees and data and safety monitoring committees from: Abbvie, Bayer-Schering Healthcare, Biogen-Idec, Canbex, Eisai, Elan, Fiveprime, Genzyme, Genentech, GSK, GW Pharma, Ironwood, Merck, Merck-Serono, Novartis, Pfizer, Roche, Sanofi-Aventis, Synthon BV, Teva, UCB Pharma and Vertex Pharmaceuticals.
Professor Giovannoni would like to acknowledge and thank Biogen-Idec for making available data slides for this presentation.
Professor Giovannoni was a member of the DEFINE study steering committee.
Professor Giovannoni’s tour to India has been kindly sponsored by Biogen-Idec, therefore please interpret anything he says about Biogen-Idec’s products in this context.
This presentation has been designed and prepared by Professor Giovannoni with no input from any other parties.

.

A new treatment paradigm in MS

Consequences of increasing EDSS scores: loss of employment1
0
10
20
30
40
50
60
70
80
90
Work Capacity by Disability Level
0.0/1.0 2.0 3.0 4.0 5.0 6.0 6.5 7.0 8.0/9.0
EDSS Score
Pro
po
rtio
n o
f P
ati
en
ts ≤
65
Ye
ars
Old
Wo
rkin
g (
%)
The proportion of patients employed or on long-term sick leave is calculated as a percentage of patients aged 65 or younger.
1. Kobelt G et al. J Neurol Neurosurg Psychiatry. 2006;77:918-926;
2. Pfleger CC et al. Mult Scler. 2010;16:121-126.
Spain
Sweden
Switzerland
United Kingdom
Netherlands
Italy
Germany
Belgium
Austria
~10 yrs2

Impact of MS: cognitive functioning in the CIS stage
Feuillet et al. MSJ 2007
CIS Patients n = 40
57%
7%
-20%
0%
20%
40%
60%
Healthy Controls n = 30
p < 0.0001
Deficits were found mainly in memory, speed of information
processing, attention and executive functioning Patients failing
≥ 2 cognitive tests

Control Multiple sclerosis
Slide courtesy of Dr Klaus Schmierer

Relapses
Unreported relapses
Clinical disease progression
Subclinical relapses: focal MRI activity
Focal gray and white matter lesions not detected by MRI
Brain atrophy
Spinal fluid neurofilament levels
MS Iceberg
Clinical activity
Focal MRI activity
Hidden focal and diffuse MRI activity
Microscopic or biochemical pathology
Biomarkers

Brain atrophy occurs across all stages of the disease
De Stefano, et al. Neurology 2010
n= 963 MSers

Association of MRI metrics and cognitive impairment in radiologically isolated syndromes
Amato et al. Neurology. 2012 Jan 31;78(5):309-14.

AAN 2013

11,000 to 1
Trapp, et al. NEJM 1998;338:278-85
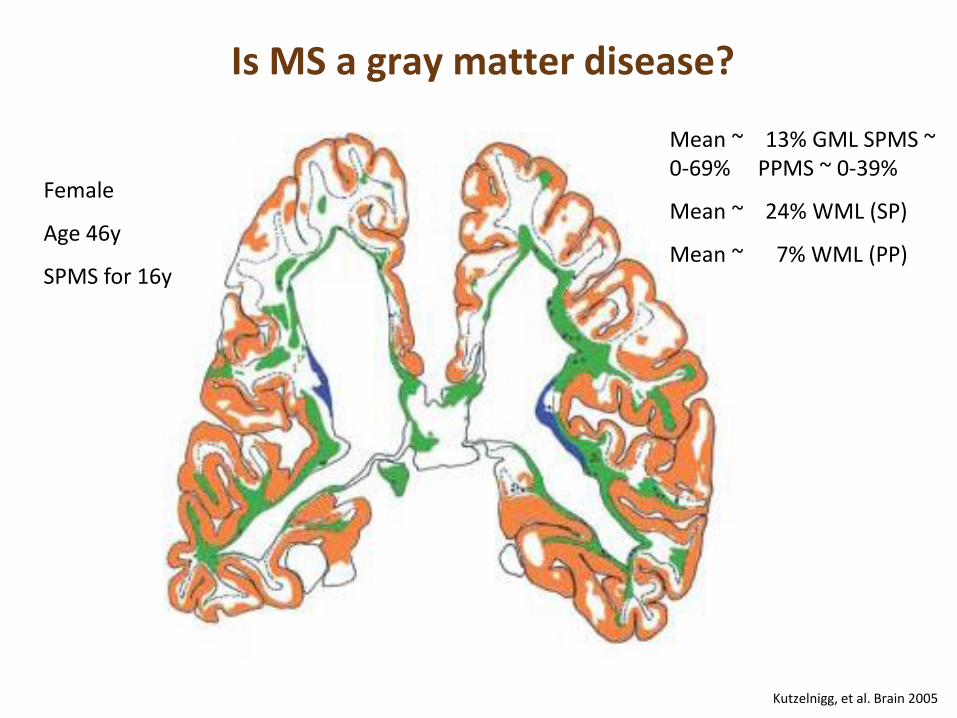
Kutzelnigg, et al. Brain 2005
Is MS a gray matter disease?
Female
Age 46y
SPMS for 16y
Mean ~ 13% GML SPMS ~ 0-69% PPMS ~ 0-39%
Mean ~ 24% WML (SP)
Mean ~ 7% WML (PP)

Treatment effect on disability predicted by effect on T2-lesion load and brain atrophy
Meta-analysis of treatment effect on EDSS worsening (y) vs effects on MRI lesions
and brain atrophy, individually or combined, in 13 placebo-controlled RRMS trials
(13,500 patients)
Sormani MP et al. Ann Neurol. 2014;75:43-49.
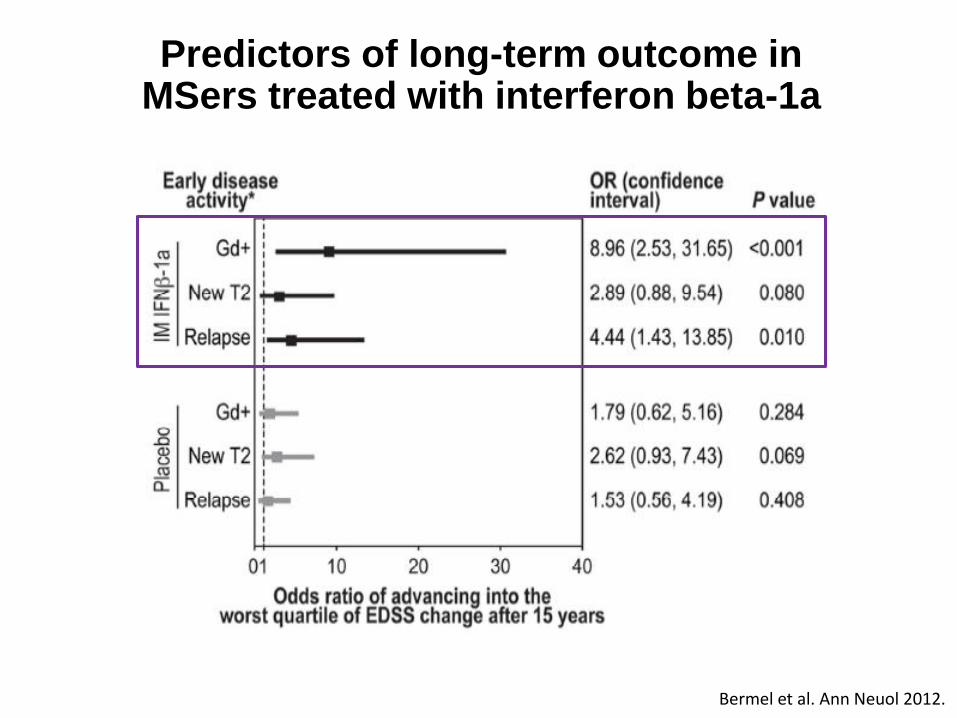
Bermel et al. Ann Neuol 2012.
Predictors of long-term outcome in MSers treated with interferon beta-1a

No evidence of disease activity: NEDA-3
Gd, gadolinium. 1. Havrdova E, et al. Lancet Neurol 2009; 8:254–260; 2. Giovannoni G, et al. Lancet Neurol 2011; 10:329–337.
Treat-2-target
No evidence of disease activity defined as:1,2
× No relapses
× No sustained disability progression
× No MRI activity
× No new or enlarging T2 lesions
× No Gd-enhancing lesions

38-year-old teacher with relapsing–remitting MS under the care of a hospital in central London
Glatiramer acetate treatment for 3 years (good adherence and tolerance)
Relapse with a mild left sensory loss
Referred to me for a second opinion
Switched to interferon β (intramuscular interferon β-1a; www.msdecisions.org.uk)
Mild persistent flu-like side effects and lymphopenia
12/12’s neutralizing antibodies screen negative
Volunteers for new research programme, which included a gadolinium-enhanced MRI protocol
Teacher
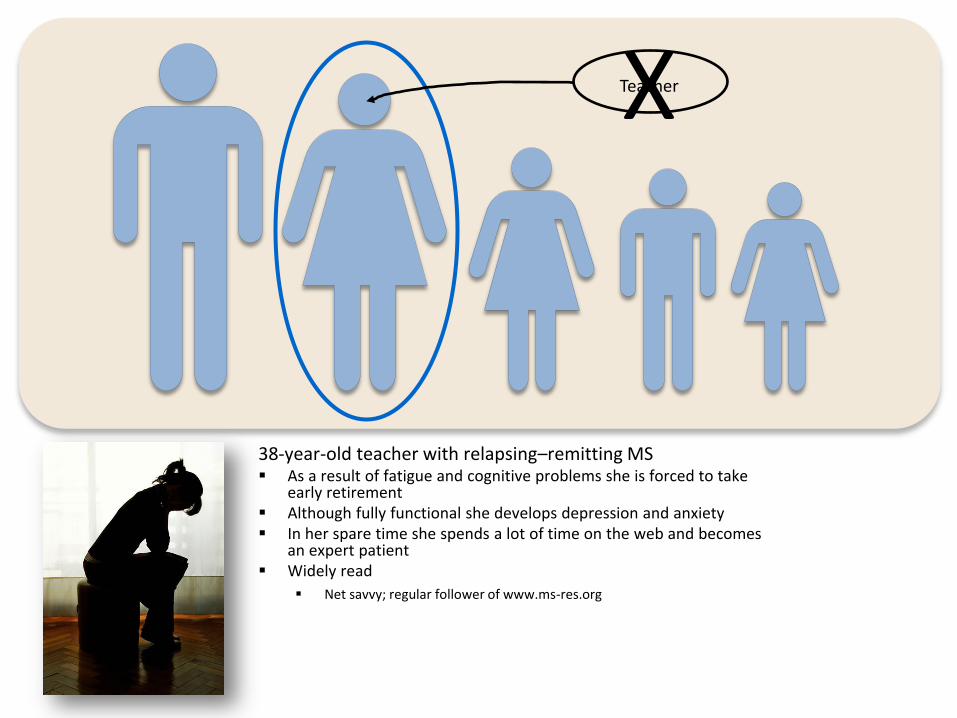
38-year-old teacher with relapsing–remitting MS As a result of fatigue and cognitive problems she is forced to take
early retirement Although fully functional she develops depression and anxiety In her spare time she spends a lot of time on the web and becomes
an expert patient Widely read
Net savvy; regular follower of www.ms-res.org
Teacher X


BARTS-MS T2T-NEDA
T2T = treating-to-target; NEDA = no evident disease activity
Choose therapy
A B C
Define the individual’s MS
Treatment failure?
• Patient’s preferences? • Your choice?
Individual measures: • Evidence of disease activity? • Tolerability/safety? • Adherence? • Drug or inhibitory markers,
e.g. NABs?
Monitoring
• MS prognosis based on clinical and MRI indices
• Life style and goals • Shared goals for therapy
Rebaseline
Rebaselining: • IFNβ, natalizumab, fingolimod,
teriflunomide, Dimethyl-Fumarate=3-6 months
• Glatiramer acetate=9 months • Alemtuzumab=24 months
Choose a therapeutic strategy
Maintenance-escalation Induction
Choose therapy
X Z
Rebaseline
Monitoring
Initiate or Switch or Escalate Rx Complete course / Re-treat
Breakthrough disease
Y
• Patient’s preferences? • Your choice?
No Yes Yes
• Only one licensed induction therapy at present

Rheumatoid arthritis End-stage joint disease
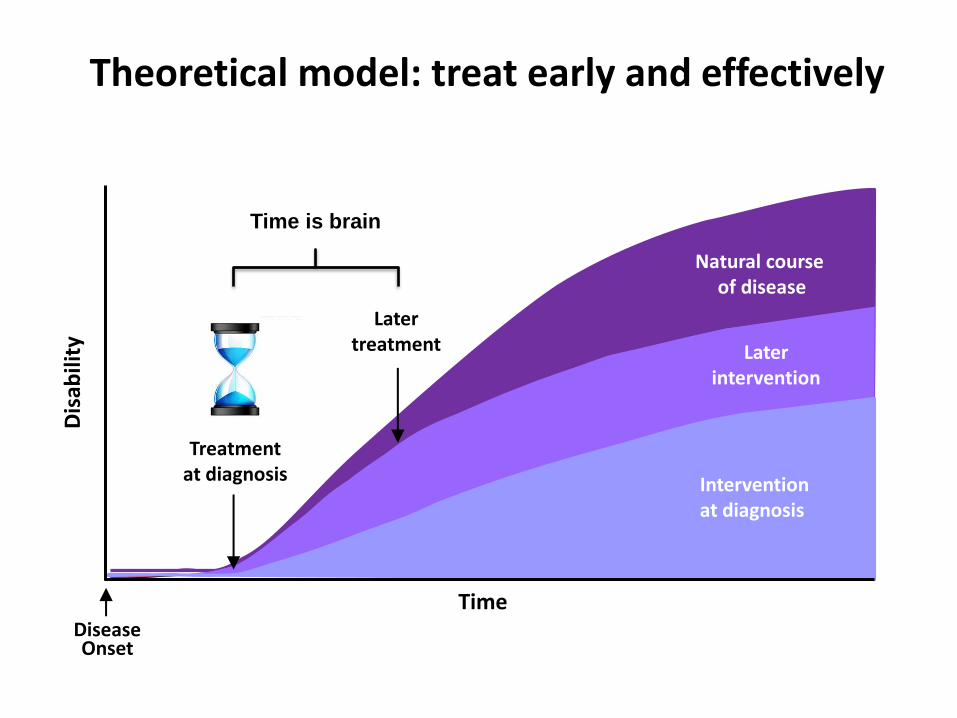
Theoretical model: treat early and effectively
Natural course of disease
Later intervention
Later treatment
Treatment at diagnosis Intervention
at diagnosis
Time Disease Onset
Dis
abili
ty
Time is brain
The new kid on the block: DMF
What is DMF?
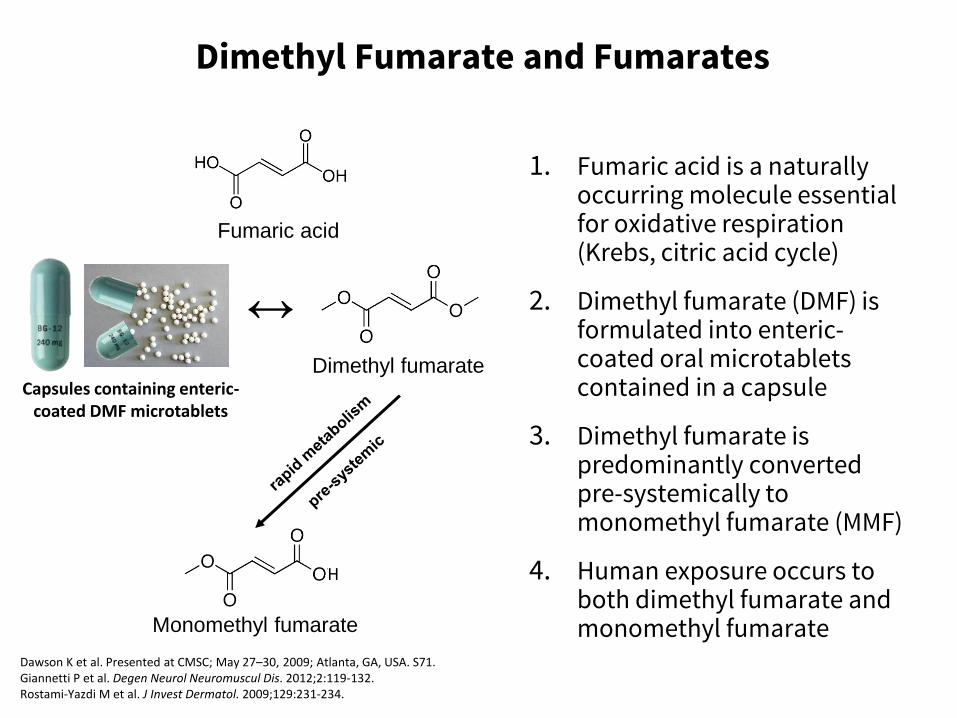
Dimethyl Fumarate and Fumarates
1. Fumaric acid is a naturally occurring molecule essential for oxidative respiration (Krebs, citric acid cycle)
2. Dimethyl fumarate (DMF) is formulated into enteric-coated oral microtablets contained in a capsule
3. Dimethyl fumarate is predominantly converted pre-systemically to monomethyl fumarate (MMF)
4. Human exposure occurs to both dimethyl fumarate and monomethyl fumarate Monomethyl fumarate
Fumaric acid
↔ Dimethyl fumarate
H
Dawson K et al. Presented at CMSC; May 27–30, 2009; Atlanta, GA, USA. S71. Giannetti P et al. Degen Neurol Neuromuscul Dis. 2012;2:119-132. Rostami-Yazdi M et al. J Invest Dermatol. 2009;129:231-234.
Capsules containing enteric-coated DMF microtablets

Through Activation of Nrf2, Dimethyl Fumarate/Monomethyl Fumarate Activate Both Antioxidant and Anti-inflammatory Responses
Keap1=kelch-like ECH-associated protein. van Horssen J et al. Biochem Biophys Acta. 2011;1812:141-150; Linker RA et al. Brain. 2011;134:679-692; Scannevin R et al. J Pharmacol Exp Ther. 2012;341:274-284.
Under normal conditions, Nrf2 is sequestered in the
cytoplasm via Keap1 DMF/MMF cause Nrf2 to translocate to the
nucleus (imitates physiological stress response)
Nrf2 activates intrinsic defense mechanisms
1
2
3 Keap1
Cytoplasm
Nucleus Inflammatory response
Antioxidant response
Nrf2
DMF/MMF

Potential Dimethyl Fumarate Activation of the Nrf2 Pathway in MS Patients
• NQO1 is an Nrf2-dependent antioxidant response gene
• NQO1 mRNA levels were significantly elevated at weeks 12 and 48 for bid and tid doses
*P<0.05 compared with placebo. NQO1=NADPH (nicotinamide adenine dinucleotide phosphate) quinone oxidoreductase; bid=twice daily; tid=3 times daily. Amaravadi et al. Presented at ECTRIMS; October 10–13, 2012; Lyon, France. P554.
*
Placebo
DMF bid
DMF tid
Week
0 10 20 30 40 50
35
30
25
20
15
10
5
0
–5
No
rmal
ise
d C
han
ge N
QO
1 (
%) *
*
*
Changes in Blood NQO1 over Time in DEFINE Phase 3 Trial

Prophylactic DMF
Dimethyl Fumarate Improved Clinical Scores in Mouse Model of MS: EAE
Dimethyl fumarate improved motor function (clinical score) in mouse experimental
autoimmune encephalomyelitis (EAE), a preclinical MS animal model
*P<0.05; ‡P<0.001; †methocel was used as the vehicle control; §postinjection with MOG 35–55 peptide.
SEM=standard error of the mean; MOG=myelin oligodendrocyte glycoprotein.
Linker RA et al. Brain. 2011;134:678-692.
Therapeutic DMF
‡
*
Mea
n C
linic
al S
core
± S
EM
7
6
5
4
3
2
1
0 10 20 30 40 50 60 70
Days Postinjection§
Control (n=36)† DMF (n=42)
0 10 20 30 40
Days Postinjection§ M
ean
Clin
ical
Sco
re ±
SEM
5
4
3
2
1
0
Control (n=7)† DMF (n=7)
Start of therapy Day 18

Dimethyl Fumarate
Immune
modulation Cytoprotection
DMF
DMF=dimethyl fumarate.

How effective is DMF?

*Any patient with significant protocol-defined disability progression may switch to open-label MS treatment at any time; any patient with 2 INEC-confirmed relapses at any time may switch to open-label MS treatment after 48 weeks on study; †double-blind only for dimethyl fumarate and placebo; rater-blinded for all arms; INEC fully blinded to all arms. DEFINE=Determination of the Efficacy and Safety of Oral Fumarate in Relapsing-Remitting MS; CONFIRM=Comparator and an Oral Fumarate in Relapsing-Remitting MS; PO=by mouth; SC=subcutaneous; INEC=independent neurology evaluation committee. Fox R et al. N Engl J Med. 2012;367:1087-1097; Gold R et al. N Engl J Med. 2012;367:1098-1107.
Dimethyl Fumarate Phase 3 Study Schematic: DEFINE and CONFIRM
*Any patient with significant protocol-defined disability progression may switch to open-label MS treatment at any time; any patient with 1 INEC-confirmed relapse on or after week 24 may switch to open-label MS treatment after 48 weeks on study.
Screening
DMF 240 mg PO bid (480 mg/day)
DMF 240 mg PO tid (720 mg/day)
Optional open-label MS treatment*
Placebo Randomisation
1:1:1
Year 1 Year 2
Open label GA SC (20 mg/day)
Multicentre, double-blind, dose-comparison study (N=1237; MRI N=540)
Multicentre, double-blind, reference comparator, dose-comparison study (N=1430; MRI N=681)†
Randomisation 1:1:1:1
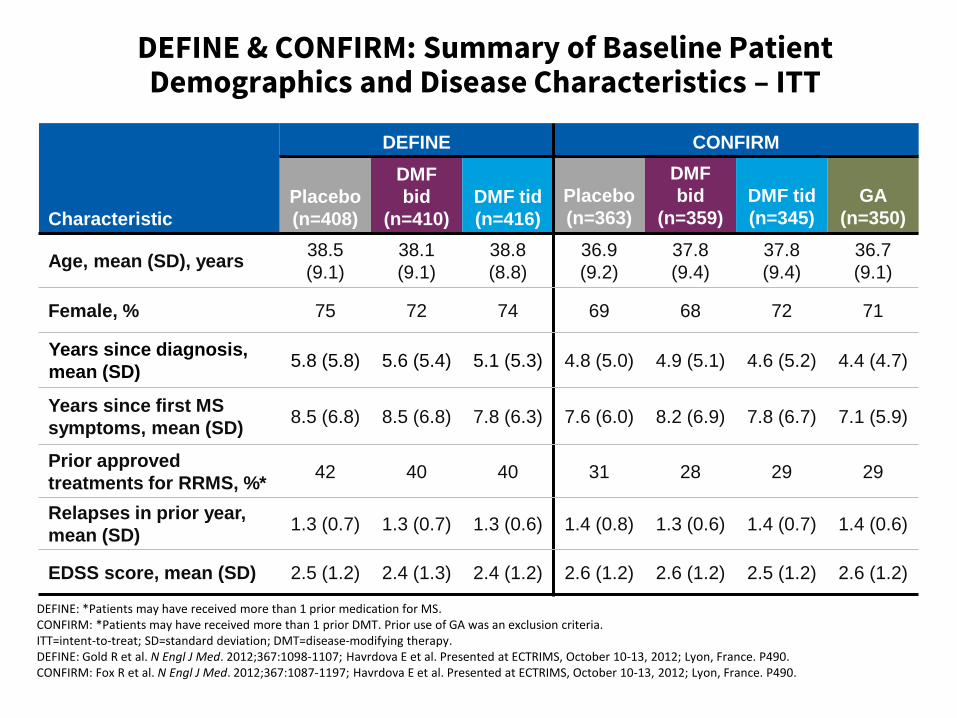
DEFINE: *Patients may have received more than 1 prior medication for MS. CONFIRM: *Patients may have received more than 1 prior DMT. Prior use of GA was an exclusion criteria. ITT=intent-to-treat; SD=standard deviation; DMT=disease-modifying therapy. DEFINE: Gold R et al. N Engl J Med. 2012;367:1098-1107; Havrdova E et al. Presented at ECTRIMS, October 10-13, 2012; Lyon, France. P490. CONFIRM: Fox R et al. N Engl J Med. 2012;367:1087-1197; Havrdova E et al. Presented at ECTRIMS, October 10-13, 2012; Lyon, France. P490.
DEFINE & CONFIRM: Summary of Baseline Patient Demographics and Disease Characteristics – ITT
Characteristic
DEFINE CONFIRM
Placebo
(n=408)
DMF
bid
(n=410)
DMF tid
(n=416)
Placebo
(n=363)
DMF
bid
(n=359)
DMF tid
(n=345)
GA
(n=350)
Age, mean (SD), years 38.5
(9.1)
38.1
(9.1)
38.8
(8.8)
36.9
(9.2)
37.8
(9.4)
37.8
(9.4)
36.7
(9.1)
Female, % 75 72 74 69 68 72 71
Years since diagnosis,
mean (SD) 5.8 (5.8) 5.6 (5.4) 5.1 (5.3) 4.8 (5.0) 4.9 (5.1) 4.6 (5.2) 4.4 (4.7)
Years since first MS
symptoms, mean (SD) 8.5 (6.8) 8.5 (6.8) 7.8 (6.3) 7.6 (6.0) 8.2 (6.9) 7.8 (6.7) 7.1 (5.9)
Prior approved
treatments for RRMS, %* 42 40 40 31 28 29 29
Relapses in prior year,
mean (SD) 1.3 (0.7) 1.3 (0.7) 1.3 (0.6) 1.4 (0.8) 1.3 (0.6) 1.4 (0.7) 1.4 (0.6)
EDSS score, mean (SD) 2.5 (1.2) 2.4 (1.3) 2.4 (1.2) 2.6 (1.2) 2.6 (1.2) 2.5 (1.2) 2.6 (1.2)
How effective is DMF as an anti-inflammatory?

Treatment effect on disability predicted by effect on T2-lesion load and brain atrophy
Meta-analysis of treatment effect on EDSS worsening (y) vs effects on MRI lesions
and brain atrophy, individually or combined, in 13 placebo-controlled RRMS trials
(13,500 patients)
Sormani MP et al. Ann Neurol. 2014;75:43-49.

0.40
0.220.20
0.29
0
0.1
0.2
0.3
0.4
0.5
0.6
Placebo
(n=363)
DMF bid
(n=359)
DMF tid
(n=345)
GA
(n=350)
0.36
0.17 0.19
0
0.1
0.2
0.3
0.4
0.5
0.6
Placebo(n=408)
DMF bid(n=410)
DMF tid(n=416)
44% reduction vs placebo P<0.001
51% reduction vs placebo P<0.001
*Annualised relapse rate was calculated with negative binomial regression, with prespecified adjustment for baseline EDSS score (≤2.0 vs >2.0), baseline age (<40 vs ≥40 years), region, and number of relapses in the 1 year prior to study entry; data after switch to alternative MS therapy were excluded. CI=confidence interval. DEFINE: Gold R et al. N Engl J Med. 2012;367:1098-1107 (supplementary appendix); CONFIRM: Fox R et al. N Engl J Med. 2012;367:1087-1197.
29% reduction vs placebo P=0.01
Annualised Relapse Rate at 2 Years
53% reduction vs placebo P<0.001
48% reduction vs placebo P<0.001
An
nu
alis
ed
Rel
apse
Rat
e* (
95
% C
I)
An
nu
alis
ed
Rel
apse
Rat
e* (
95
% C
I)
CONFIRM DEFINE

Proportion of Patients Who Relapsed
HR=hazard ratio; BL=baseline. DEFINE: Gold R et al. N Engl J Med. 2012;367:1098-1107; CONFIRM: Fox R et al. N Engl J Med. 2012;367:1087-1197 (supplementary appendix).
0.6
0.5
0.4
0.3
0.2
0.1
0
HR (95% CI):
DMF bid vs placebo=0.51 (0.40–0.66);
49% risk reduction; P<0.001
DMF tid vs placebo=0.50 (0.39–0.65);
50% risk reduction; P<0.001
Placebo (n=408)
DMF bid (n=410)
DMF tid (n=416)
Time on Study (weeks)
Pro
po
rtio
n R
ela
ps
ed
BL 12 24 36 48 60 72 84 96
0.461
0.270 0.260
0.6
BL 12 24 36 48 60 72 84 96
0
0.1
0.2
0.3
0.4
0.5
Pro
po
rtio
n R
ela
pse
d
Time on Study (weeks)
HR (95% CI): DMF bid vs placebo=0.66 (0.51–0.86): 34% risk reduction; P=0.002 DMF tid vs placebo=0.55 (0.42–0.73): 45% risk reduction; P<0.001 GA vs placebo=0.71 (0.55–0.92): 29% risk reduction; P=0.010
0.291
0.241
0.321
0.410
Placebo
GA
DMF bid
DMF tid
DEFINE CONFIRM

New or Newly Enlarging T2-Hyperintense Lesions at 2 Years
*Negative binomial regression analysis, adjusted for region and baseline T2 lesion volume. DEFINE: Arnold DL et al. Presented at ECTRIMS; October 19–22, 2011; Amsterdam, The Netherlands. P831; CONFIRM: Fox R et al. N Engl J Med. 2012;367:1087-1197 (supplementary appendix).
New
or
New
ly E
nla
rgin
g T2
Le
sio
ns*
(m
ean
)
17.0
2.6
4.4
0
5
10
15
20
25
Placebo(n=165)
DMF bid (n=152)
DMF tid(n=152)
New
or
New
ly E
nla
rgin
g T2
Le
sio
ns*
(m
ean
)
74% reduction vs placebo P<0.001
85% reduction vs placebo P<0.001
17.4
5.1 4.7
8.0
0
5
10
15
20
25
Placebo(n=139)
DMF bid(n=140)
DMF tid(n=140)
GA(n=153)
71% reduction
vs placebo P<0.001
73% reduction vs placebo P<0.001
54% reduction vs placebo P<0.001
CONFIRM DEFINE
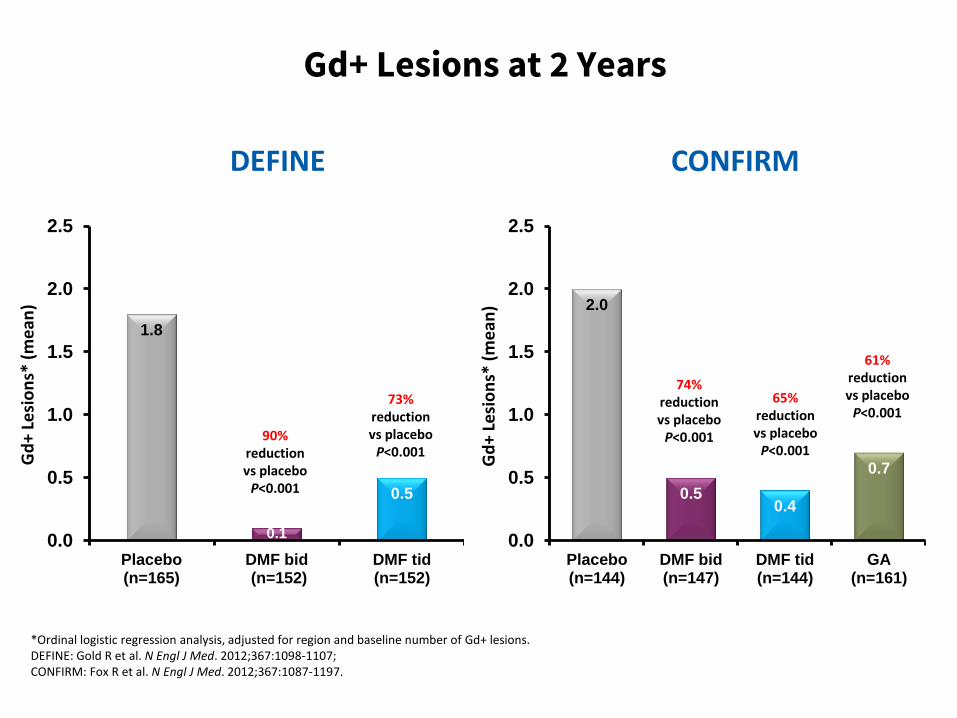
Gd+ Lesions at 2 Years
*Ordinal logistic regression analysis, adjusted for region and baseline number of Gd+ lesions. DEFINE: Gold R et al. N Engl J Med. 2012;367:1098-1107; CONFIRM: Fox R et al. N Engl J Med. 2012;367:1087-1197.
Gd
+ Le
sio
ns*
(m
ean
)
1.8
0.1
0.5
0.0
0.5
1.0
1.5
2.0
2.5
Placebo(n=165)
DMF bid (n=152)
DMF tid(n=152)
Gd
+ Le
sio
ns*
(m
ean
) 2.0
0.5 0.4
0.7
0.0
0.5
1.0
1.5
2.0
2.5
Placebo(n=144)
DMF bid(n=147)
DMF tid(n=144)
GA(n=161)
73% reduction vs placebo P<0.001
90% reduction vs placebo P<0.001
74% reduction
vs placebo P<0.001
65% reduction vs placebo P<0.001
61% reduction vs placebo P<0.001
CONFIRM DEFINE
How effective is DMF as a neuroprotective?

Treatment effect on disability predicted by effect on T2-lesion load and brain atrophy
Meta-analysis of treatment effect on EDSS worsening (y) vs effects on MRI lesions
and brain atrophy, individually or combined, in 13 placebo-controlled RRMS trials
(13,500 patients)
Sormani MP et al. Ann Neurol. 2014;75:43-49.

12-Week Confirmed Disability Progression
CONFIRM DEFINE
Pat
ien
ts w
ith
Dis
abili
ty P
rogr
ess
ion
* (%
)
12 24 36 48 60 72 84 96
Time on Study (weeks)
0
10
20
30 DMF bid=38% risk reduction, P=0.005†
DMF tid=34% risk reduction, P=0.013†
18%
16%
27%
BL
Placebo
DMF bid
DMF tid
12 24 36 48 60 72 84 96
Time on Study (weeks)
0
DMF bid=21% risk reduction, P=0.25†
DMF tid=24% risk reduction, P=0.20†
GA=7% risk reduction, P=0.70†
16%
13%
17%
BL
Placebo
DMF bid
DMF tid
13%
GA
10
20
30
Pat
ien
ts w
ith
Dis
abili
ty P
rogr
ess
ion
* (%
)
*Estimated proportion of patients with progression and time to progression up to 96 weeks based on the Kaplan-Meier product limit method; †based on Cox proportion hazards model, adjusted for baseline EDSS score (≤2.0 vs >2.0), region, and baseline age (<40 vs ≥40 years). DEFINE: Gold R et al. N Engl J Med. 2012;367:1098-1107; CONFIRM: Fox R et al. N Engl J Med. 2012;367:1087-1197.

New T1-Hypointense Lesions at 2 Years N
ew T
1-H
ypo
inte
nse
Le
sio
ns*
(m
ean
)
5.6
1.5
2.1
0
2
4
6
8
10
Placebo(n=165)
DMF bid(n=152)
DMF tid(n=152)
New
T1
-Hyp
oin
ten
se L
esi
on
s* (
me
an)
7.0
3.0
2.4
4.1
0
2
4
6
8
10
Placebo(n=139)
DMF bid(n=140)
DMF tid(n=140)
GA(n=154)
63% reduction vs placebo P<0.001
72% reduction vs placebo P<0.001
57% reduction
vs placebo P<0.001
65% reduction vs placebo P<0.001
41% reduction vs placebo P<0.001
*Negative binomial regression analysis, adjusted for region and baseline T1 lesion volume. DEFINE: Arnold DL et al. Presented at ECTRIMS; October 19–22, 2011; Amsterdam, The Netherlands. P831; CONFIRM: Fox R et al. N Engl J Med. 2012;367:1087-1197.
CONFIRM DEFINE

DEFINE and CONFIRM: Median Change in Whole Brain Volume from Baseline to Week 96
WBV=whole brain volume.
DEFINE: Arnold DL et al. Presented at ECTRIMS, October 10-13, 2012; Lyon, France. P509.
CONFIRM: Miller D et al. Presented at AAN, April 21-28, 2012; New Orleans, LA. S11.001.
-0.81
-0.64
-0.77
-1.0
-0.8
-0.6
-0.4
-0.2
0.0
Med
ian
Ch
an
ge i
n W
BV
fro
m B
aselin
e t
o W
eek 9
6 (
%)
21% reduction vs placebo P<0.05 5%
reduction vs placebo P=0.640
Placebo
DMF bid
DMF tid
-0.95
-0.66
-0.75
-0.96
-1.0
-0.8
-0.6
-0.4
-0.2
0.0
30% reduction vs placebo P=0.065 21%
reduction vs placebo P=0.264
P=0.880
Med
ian
Ch
an
ge i
n W
BV
fro
m B
aselin
e t
o W
eek 9
6 (
%)
Placebo
DMF bid
DMF tid GA
DEFINE CONFIRM
How quickly does DMF work?

Integrated Analysis: Onset of Efficacy
2.9
6.9
8.9
10.8
13.2
16.1
19.8
31.2
43.7
3.0
4.9 6.0
7.4
9.9 10.9
12.2
18.5
28.0
2.7
5.5 6.7
7.5 9.2
10.5 11.6
18.4
25.1
0
10
20
30
40
50Placebo (n=771)
DMF bid (n=769)
DMF tid (n=761)
Pro
po
rtio
n o
f P
atie
nts
Re
lap
sed
(%
)
0–4 0–8 0–10 0–12 0–16 0–20 0–24 0–48 0–96
* *
* †
‡
‡
‡
* *
† ‡
‡
‡
Based on stratified Cox proportion hazards model with study as a stratifying variable, adjusted for baseline EDSS (≤2.0 vs >2.0), baseline age (<40 vs ≥40), region and number of relapses in the year prior to study entry. *P<0.05; †P<0.01; ‡P≤0.0001; P values vs placebo. Kappos et al. Presented at AAN; March 16–23, 2013; San Diego, CA, USA. S41.005.
Weeks

What is the patients’ perspective on DMF?

-1.05
-0.6
0.47
0.31 0.43
0.63
-1.2
-0.9
-0.6
-0.3
0.0
0.3
0.6
0.9
1.2
PCS MCS
Placebo (n=733) DMF bid (n=741) DMF tid (n=728)
Integrated Analysis: Dimethyl Fumarate Significantly Improves Physical and Mental Well-Being
SF-36 was available for all patients where a validated translation in the local language was available. Observed data after patients switched to alternative MS medications were excluded. Missing data prior to alternative medications and visits after patients switched to alternative medications were included and imputed using a random effects model. A higher score indicates a better outcome. SF-36=Short Form-36 Health Survey; MCS=Mental Component Summary; PCS=Physical Component Summary. Adapted from Kita M et al. Presented at AAN; March 16-23, 2013, San Diego, CA, USA. Poster P07.092.
Imp
rove
me
nt
Wo
rse
nin
g
Ch
ange
fro
m B
ase
line
P<0.05
P≤0.0001
P<0.05
P≤0.0001
PCS MCS
Can we treat-2-targt on DMF?

11
23 23
0
5
10
15
20
25
30
Integrated Analysis: No Evident Disease Activity (NEDA)
Pat
ien
ts N
EDA
* (%
) OR 2.6 P<0.0001
OR 2.7 P<0.0001
n= 309 299 296
P values are for comparisons with placebo. OR=odds ratio. *Defined as no relapses and no 3-month confirmed disability progression over 2 years, no new Gd+ lesions on brain MRI at week 24, year 1 and year 2 and no new/enlarging T2 lesions on brain MRI at 2 years. P values are for comparisons with placebo. Havrdova et al. Presented at AAN; March 16–23, 2013; San Diego, CA. P07.106.
Placebo
DMF bid
DMF tid

Are there any subgroups who don’t respond to DMF?
51
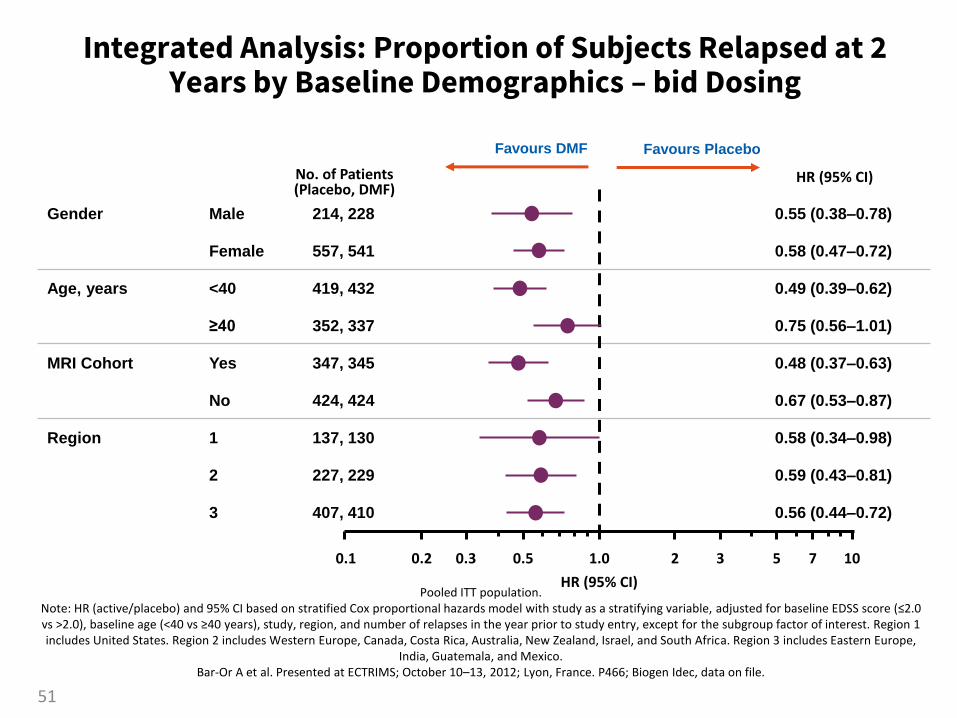
Integrated Analysis: Proportion of Subjects Relapsed at 2 Years by Baseline Demographics – bid Dosing
Pooled ITT population. Note: HR (active/placebo) and 95% CI based on stratified Cox proportional hazards model with study as a stratifying variable, adjusted for baseline EDSS score (≤2.0 vs >2.0), baseline age (<40 vs ≥40 years), study, region, and number of relapses in the year prior to study entry, except for the subgroup factor of interest. Region 1 includes United States. Region 2 includes Western Europe, Canada, Costa Rica, Australia, New Zealand, Israel, and South Africa. Region 3 includes Eastern Europe,
India, Guatemala, and Mexico. Bar-Or A et al. Presented at ECTRIMS; October 10–13, 2012; Lyon, France. P466; Biogen Idec, data on file.
Gender Male 214, 228 0.55 (0.38–0.78)
Female 557, 541 0.58 (0.47–0.72)
Age, years <40 419, 432 0.49 (0.39–0.62)
≥40 352, 337 0.75 (0.56–1.01)
MRI Cohort Yes 347, 345 0.48 (0.37–0.63)
No 424, 424 0.67 (0.53–0.87)
Region 1 137, 130 0.58 (0.34–0.98)
2 227, 229 0.59 (0.43–0.81)
3 407, 410 0.56 (0.44–0.72)
HR (95% CI) No. of Patients (Placebo, DMF)
0.1 0.2 0.3 0.5 1.0 2 3 5 7 10
HR (95% CI)
Favours DMF Favours Placebo

Integrated Analysis: Proportion of Subjects Relapsed at 2 Years by Baseline Disease Characteristic – bid Dosing
Pooled ITT population. Note: HR (active/placebo) and 95% CI based on stratified Cox proportional hazards model with study as a stratifying variable, adjusted for baseline EDSS
score (≤2.0 vs >2.0), baseline age (<40 vs ≥40 years), study, region, and number of relapses in the year prior to study entry, except for the subgroup factor of interest.
Bar-Or A et al. Presented at ECTRIMS; October 10–13, 2012; Lyon, France. P466.
Prior relapses ≤1 546, 541 0.56 (0.44–0.70)
≥2 224, 228 0.59 (0.44–0.80)
McDonald criteria 1 647, 627 0.58 (0.48–0.71)
2, 3, and 4 124, 142 0.53 (0.33–0.83)
Prior MS treatment No 397, 398 0.53 (0.40–0.69)
Yes 374, 371 0.62 (0.48–0.79)
EDSS score ≤2.0 362, 373 0.45 (0.34–0.60)
>2.0 409, 395 0.69 (0.55–0.87)
HR (95% CI) No. of Patients (Placebo, DMF)
52
0.1 0.2 0.3 0.5 1.0 2 3 5 7 10
HR (95% CI)
Favours DMF Favours Placebo

Gender Male 214, 228 0.464 (0.318–0.676)
Female 557, 541 0.525 (0.423–0.652)
Age, years <40 419, 432 0.451 (0.355–0.573)
≥40 352, 337 0.642 (0.475–0.868)
MRI cohort Yes 347, 345 0.469 (0.360–0.611)
No 424, 424 0.568 (0.436–0.740)
Region 1 137, 130 0.558 (0.325–0.957)
2 227, 229 0.446 (0.326–0.609)
3 407, 410 0.552 (0.426–0.715)
Integrated Analysis: Annualised Relapse Rate at 2 Years by Baseline Demographics – bid Dosing
Pooled ITT population.
Note: RR (active/placebo) and 95% CI based on negative binomial regression model. In general, model adjusted for baseline EDSS score
(≤2.0 vs >2.0), baseline age (<40 vs ≥40 years), study, region, and number of relapses in the year prior to study entry, except for the
subgroup factor of interest. Region 1 includes United States. Region 2 includes Western Europe, Canada, Costa Rica, Australia, New
Zealand, Israel, and South Africa. Region 3 includes Eastern Europe, India, Guatemala, and Mexico.
Bar-Or A et al. Presented at ECTRIMS; October 10–13, 2012; Lyon, France. P466; Biogen Idec, data on file.
No. of Patients (Placebo, DMF) RR (95% CI)
53
0.1 0.2 0.3 0.5 1.0 2 3 5 7 10
RR (95% CI)
Favours DMF Favours Placebo

Prior relapses ≤1 546, 541 0.502 (0.395–0.637)
≥2 224, 228 0.534 (0.396–0.720)
McDonald criteria 1 647, 627 0.512 (0.418–0.626)
2, 3, and 4 124, 142 0.547 (0.329–0.908)
Prior MS treatment No 397, 398 0.473 (0.353–0.633)
Yes 374, 371 0.558 (0.439–0.710)
EDSS score ≤2.0 362, 373 0.368 (0.272–0.499)
>2.0 409, 395 0.666 (0.525–0.845)
Integrated Analysis: Annualised Relapse Rate at 2 Years by Baseline Disease Characteristic – bid Dosing
Pooled ITT population. Note: RR (active/placebo) and 95% CI based on negative binomial regression model. In general, model adjusted for baseline EDSS score (≤2.0 vs >2.0),
baseline age (<40 vs ≥40 years), study, region, and number of relapses in the year prior to study entry, except for the subgroup factor of interest. Bar-Or A et al. Presented at ECTRIMS; October 10–13, 2012; Lyon, France. P466.
No. of Patients (Placebo, DMF)
RR (95% CI)
54
0.1 0.2 0.3 0.5 1.0 2 3 5 7 10
RR (95% CI)
Favours DMF Favours Placebo

Naïve vs. switchers: how do they do on DMF?

ABCR=Avonex®, Betaseron®, Copaxone®, Rebif®; CI=confidence interval. Hutchinson M et al. Presented at AAN; March 16–23, 2013; San Diego, CA, USA. P07.128
Placebo DMF 240 mg bid DMF 240 mg tid
Ad
just
ed
An
nu
aliz
ed
Re
lap
se
Rat
e (
95
% C
I)
0.5
0.3
0.2
0.1
0 n=397 n=398 n=393 n=221 n=202 n=193 n=164 n=155 n=145
Treatment-Naïve
Annualized Relapse Rate at 2 Years by Subgroup
0.4
Any ABCR 1 ABCR
0.35 0.16 0.16 0.37 0.22 0.18 0.38 0.23 0.16
40% 52% reduction
vs placebo P<0.05
53% 54% reduction
vs placebo P<0.05
40% 59% reduction
vs placebo P<0.05
Prior Treatment: Relapse Rate

0.6
0.5
0.4
0.3
0.2
0.1
0
-0.1
Ad
just
ed
AR
R (
95
% C
I)
Placebo (n=162)
0.359
DMFa BID (n=156)
0.204 0.169
DMFa TID (n=157)
Based on negative binomial regression, adjusted for baseline EDSS (≤2.0 vs >2.0), baseline age (<40 vs ≥40 years), study, region, and number of relapses in the 1 year prior to study entry. aDelayed-release DMF.
Rate ratio vs placebo
DMFa BID: 0.570 (p=0.004)
DMFa TID: 0.471 (p=0.0002)
OS1116
43%
53%
IFN-b Non-Responder: Relapse Rate

Integrated Analysis of Efficacy
1. The integrated analyses results provide a more precise estimate of the therapeutic effect of dimethyl fumarate relative to placebo than individual study results
2. Compared with placebo, dimethyl fumarate bid and tid, respectively, significantly reduced
a. Annualised relapse rate over 2 years by 49% and 49%
b. Risk of relapse at 2 years by 43% and 47%
c. 12-week confirmed disability progression by 32% and 30%
d. Number of new/newly enlarging T2 lesions by 78% and 73%
e. Gd+ lesion activity by 83% and 70%
f. Number of new T1 lesions by 65% and 64%
3. The efficacy of dimethyl fumarate bid and tid was broadly comparable
Gold R et al. Presented at ECTRIMS; October 10–13, 2012; Lyon, France. S151.

How safe is DMF?

Safety Analysis: Overview*
*The safety population for the integrated analysis includes patients treated with placebo or dimethyl fumarate 240 mg tid from the phase 2 dose-ranging study, as well as all patients from the phase 3 studies, DEFINE and CONFIRM; †includes MS relapses fitting the classification of a serious adverse event; ‡due to ischemic stroke after switch to alternative MS medication; §due to road traffic accident/traumatic brain injury after study withdrawal; ¶due to road traffic accident and MS relapse complicated by intraventricular haemorrhage after last dose (within 30 days of study withdrawal). Selmaj K et al. Presented at ECTRIMS; October 10–13, 2012; Lyon, France. P484.
Event, % Patients
Placebo
(n=836)
DMF bid
(n=769)
DMF tid
(n=823)
Any adverse event 92 95 93
Serious adverse event† 21 18 15
Discontinuation due to adverse event 11 14 14
Study withdrawal due to adverse event 4 8 8
Infection 56 60 60
Serious infection 1.4 2.2 1.8
Malignancy <1 <1 <1
Death <1‡ <1§ <1¶
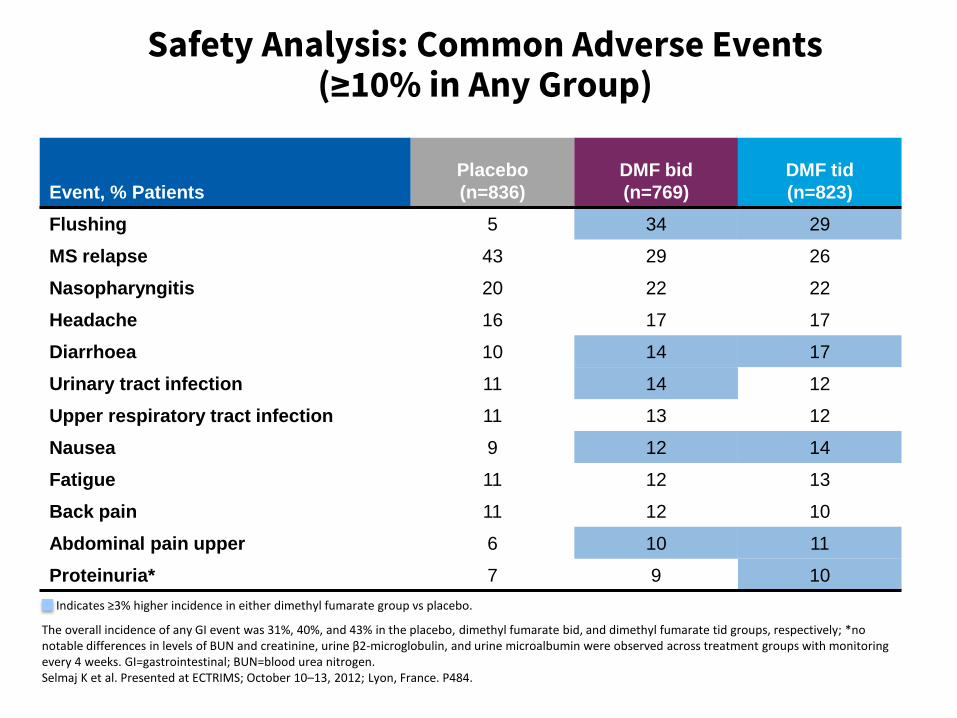
Safety Analysis: Common Adverse Events (≥10% in Any Group)
The overall incidence of any GI event was 31%, 40%, and 43% in the placebo, dimethyl fumarate bid, and dimethyl fumarate tid groups, respectively; *no notable differences in levels of BUN and creatinine, urine β2-microglobulin, and urine microalbumin were observed across treatment groups with monitoring every 4 weeks. GI=gastrointestinal; BUN=blood urea nitrogen. Selmaj K et al. Presented at ECTRIMS; October 10–13, 2012; Lyon, France. P484.
Indicates ≥3% higher incidence in either dimethyl fumarate group vs placebo.
Event, % Patients
Placebo
(n=836)
DMF bid
(n=769)
DMF tid
(n=823)
Flushing 5 34 29
MS relapse 43 29 26
Nasopharyngitis 20 22 22
Headache 16 17 17
Diarrhoea 10 14 17
Urinary tract infection 11 14 12
Upper respiratory tract infection 11 13 12
Nausea 9 12 14
Fatigue 11 12 13
Back pain 11 12 10
Abdominal pain upper 6 10 11
Proteinuria* 7 9 10
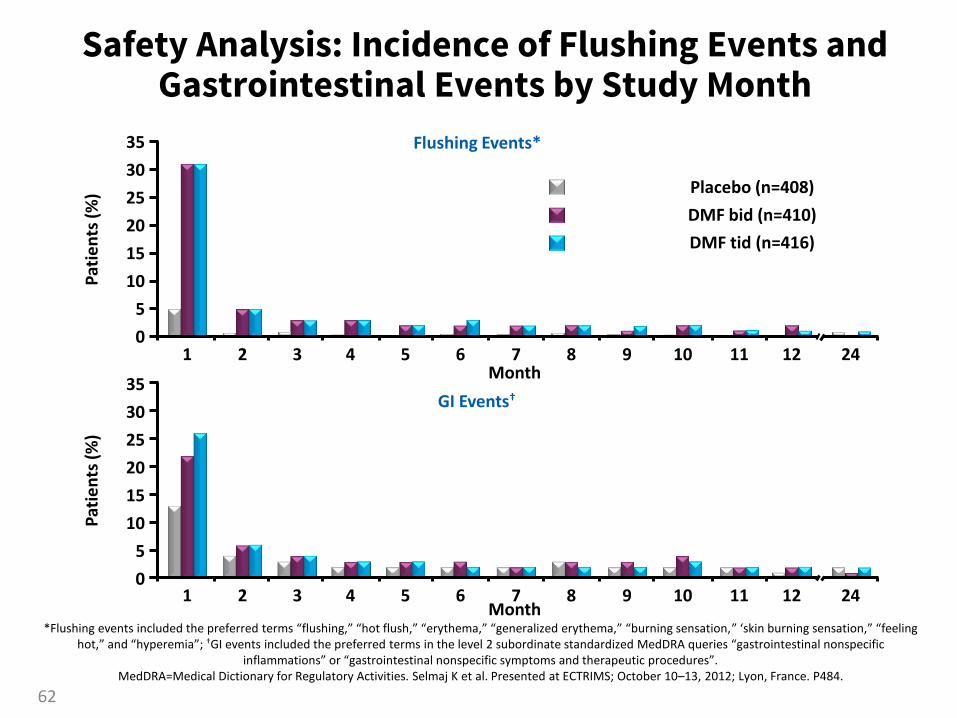
Safety Analysis: Incidence of Flushing Events and Gastrointestinal Events by Study Month
*Flushing events included the preferred terms “flushing,” “hot flush,” “erythema,” “generalized erythema,” “burning sensation,” ‘skin burning sensation,” “feeling hot,” and “hyperemia”; †GI events included the preferred terms in the level 2 subordinate standardized MedDRA queries “gastrointestinal nonspecific
inflammations” or “gastrointestinal nonspecific symptoms and therapeutic procedures”. MedDRA=Medical Dictionary for Regulatory Activities. Selmaj K et al. Presented at ECTRIMS; October 10–13, 2012; Lyon, France. P484.
Placebo (n=408)
DMF bid (n=410)
DMF tid (n=416)
10
5
25
30
35
20
15
0 1 2 3 4 5 6 7 8 9 10 11 12 24
Month
Pat
ien
ts (
%)
30
25
20
15
10
5
0 1 2 3 4 5 6 7 8 9 10 11 12 24
Month
Pat
ien
ts (
%)
35
Flushing Events*
GI Events†
62

Safety Analysis: Mean Lymphocyte Counts over Time
72
526 574 568
BL
833 767 819
8
792 694 731
4
805 731 781
12
790 699 722
24
758 665 704
36
655 636 617
48
607 611 606
60
565 596 586
84
519 564 555
96
479 527 505
1.5
2.0
2.5
3.0
Mea
n (±
SE)
Lym
ph
ocy
te C
ou
nt
(×1
09/L
)
Placebo DMF bid DMF tid
1.0
0.5
0
Placebo
DMF bid
DMF tid
LLN (0.91)
Visit (weeks)
Number of Patients at Risk
Lymphocyte counts <0.5 x 10⁹/L (grade 3 lymphopenia) observed in <1% of patients in the placebo group, 6% of patients in the dimethyl fumarate bid group, and 3% of patients in the dimethyl fumarate tid group
LLN=lower limit of normal. Selmaj K et al. Presented at ECTRIMS; October 10–13, 2012; Lyon, France. P484; Phillips JT et al. Presented at AAN; March 16–23, 2013; San Diego, CA. S30.003.
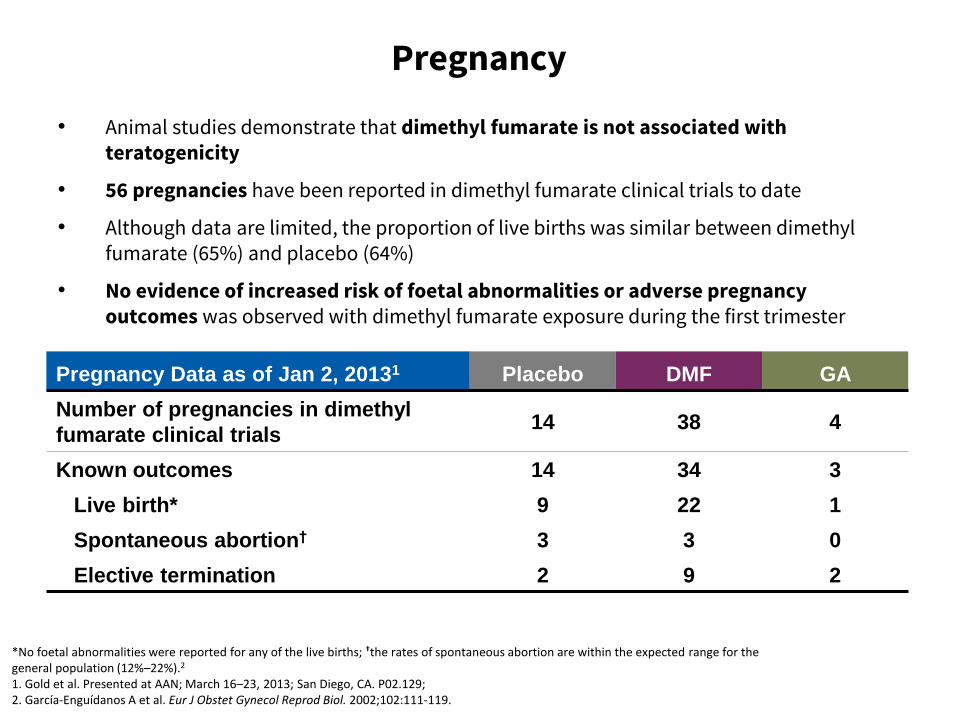
Pregnancy
• Animal studies demonstrate that dimethyl fumarate is not associated with teratogenicity
• 56 pregnancies have been reported in dimethyl fumarate clinical trials to date
• Although data are limited, the proportion of live births was similar between dimethyl fumarate (65%) and placebo (64%)
• No evidence of increased risk of foetal abnormalities or adverse pregnancy outcomes was observed with dimethyl fumarate exposure during the first trimester
*No foetal abnormalities were reported for any of the live births; †the rates of spontaneous abortion are within the expected range for the general population (12%–22%).2
1. Gold et al. Presented at AAN; March 16–23, 2013; San Diego, CA. P02.129; 2. García-Enguídanos A et al. Eur J Obstet Gynecol Reprod Biol. 2002;102:111-119.
Pregnancy Data as of Jan 2, 20131 Placebo DMF GA
Number of pregnancies in dimethyl
fumarate clinical trials 14 38 4
Known outcomes 14 34 3
Live birth* 9 22 1
Spontaneous abortion† 3 3 0
Elective termination 2 9 2

DEFINE and CONFIRM Safety Analysis
1. Overall, the incidence of adverse events, serious adverse events, and drug discontinuations due to adverse events was similar across placebo and dimethyl fumarate treatment groups
2. No increased risk of serious infections or malignancies was seen with dimethyl fumarate
3. The most common adverse events were flushing and GI events
4. Mean lymphocyte counts were reduced by 30% but remained within the normal range
a. 6% of patients had grade 3 lymphopaenia
b. There was no association with an increased incidence of serious infections.
5. There were no reports of serious renal failure. The percentage of patients with protein values of 1+ or greater was similar for dimethyl fumarate- (43%) and placebo-treated patients (40%)
6. The incidence of hepatic adverse events was similar with placebo vs dimethyl fumarate bid and tid (1% vs 1% and 2%); no cases of hepatic failure were reported
Havrdova E et al. Expert Opin Pharmacother, 2013;14:2145-2156; Fox RJ et al. Curr Med Res Opin. 2013 Oct 22. [Epub ahead of print]; Selmaj K et al. Presented at ECTRIMS; October 10–13, 2012; Lyon, France. P484.

DMF
Dual mode of action:
1. Cytoprotective
2. Anti-inflammatory
Convenience:
1. Oral
2. 1st or 2nd line
Safe:
1. No increased risk of
serious infections
2. Short-term tolerance
issues due to
flushing and GI
symptoms
3. Low rate (~6%) of
lymphopaenia
4. Low risk of
teratogenicity
Effective:
1. Anti-inflammatory
a. Reduces ARR ~50%
b. Reduces new focal MRI
activity by ~75%
2. Neuroprotective
a. Reduces 12 week
confirmed disease
progression by ~30%
b. Reduces T1-
hypointensities ~65%
c. Reduces BVL by ~25%
3. Improves QoL


Questions?