DLDS LDB Analytics Annual Report for JNPTjnport.gov.in/Writereaddata/data/Downloads/JNPT DLDS...
40
Logistics Redefined DLDS LDB Analytics Annual Report for JNPT Oct 2016- Sep 2017
Transcript of DLDS LDB Analytics Annual Report for JNPTjnport.gov.in/Writereaddata/data/Downloads/JNPT DLDS...
Logistics Redefined
DLDS LDB Analytics Annual Report
forJNPT
Oct 2016- Sep 2017

Agenda
LDB Operations
LDB Analytics
Executive Summary

DLDS Marketing Activities - Update
DLDS’s Logistics Databank Project(LDB) is currently providing Container visibility services for more than 70% of India’s Container Volume and as on date has provided services for more than 5million EXIM Containers of India in the western corridor starting from the port till the ICD’s through a single window.
DLDS Analytics Report which is being published for the trade has been able to provide insights to the stakeholders in terms of identification of various challenges leading to increase in Time & Inefficiencies/ bottlenecks .The Performance Benchmarking has helped in inculcating competition to provide better services.
DLDS started publishing Analytics starting Oct 2016 and the reports have been able to bring in Visibility to the Stakeholders across JNPT Region enabling them in improvising the key performance Indicators as below:
• Improvement in the Dwell Time of Port terminals, Inland Container Depots, Container Freight stations.
• Congestion Analysis have helped in identification of areas of challenges to be addressed between Port Terminals & CFS/ ICD’s for both Truck bound and Train bound container movement.
• Bringing more Accountability of the stakeholders across the supply chain.• Inculcating competition to promote better Logistics Services.• Due to heavy monsoon rain, July-August September (JAS 2017) quarter saw a comparative dip
in performance in JNPT Mumbai region in comparison to the earlier timelines.
Executive Summary

Executive Summary- JNPT Dwell Time Performance
• The Dwell Time of Port terminals of JNPT region (JNPCT, APM, NSICT, NSIGT) which was around 91 hours during the Oct Nov Dec -2016 (OND 16) quarter saw an improvement of 10 % until April-May-Jun (AMJ 17) 2017 quarter prior to Monsoons and is currently recorded at 90 hours.
• There has been an 22% improvement in the Dwell Time of the Container Freight stations across the JNPT Region starting OND 16 quarter..
• Continuous improvement in Inland Container Depots Dwell Time which has currently improved to around 30 % in comparison to its performance during the Oct-Nov-Dec 2016 Quarter.
• Other than Monsoons, during the July-August-September (JAS 17) Quarter , APM Terminals Mumbai was hit by Ransomeware virus leading to increased Dwell Time of the Port Terminal.
113
81 83 88.7
4939.5 41
9186.5
8290
65.8
JNPT Region Port Dwell Time (in hrs)
AMJ ‘17 JAS’17*JFM’ ‘17OND‘16
CFS Dwell time : JNPT Region (in hrs)
AMJ ‘17JAS‘17JFM’ ‘17OND‘16
182171.86
133 128
ICD Dwell time (in hrs)
AMJ ‘17JAS‘17JFM’ ‘17OND‘16
Import
Export(-4.9%) (-5.2%) (9.7%)
(-19.5%) (3.8%) (67%)
(-28.3%) (2.47%) (6.8%)(-5.6%) (-22.6%) (-3.7%)

Executive Summary-JNPT Transit Time Performance
2.6 2 2.4 2.3
AMJ ‘17 JAS‘17JFM’ ‘17OND‘16
JNPT Port to nearby CFS Region Average Delivery Time (in hrs)
(23%) (20%) (4.2%)
6.485.7 4.98 5.5
AMJ ‘17 JAS‘17JFM’ ‘17OND‘16
CFS Region to JNPT PortAverage Delivery Time (in hrs)
(12%) (12.6%) (10.4%)
• 12.5 % improvement in the transit time of Container Movement from JNPT Port terminals & nearby Container Freight Stations (CFS).
• 15 % improvement in the transit time of Container Movement from Container Freight Stations to JNPT Port terminals.
• Due to Congestions as well as early arrival of trailers around JNPT region, there is increase in Container Delivery time from CFS- Port in comparison to movement of Containers from Port-CFS.
• DLDS has categorized various CFS around the JNPT region in smaller clusters (areas) to help in identifying the clusters with maximum congestions resulting in overall high delivery time and same is being published on a monthly basis to the relevant stakeholders.

Executive Summary
• LDB is one of the key projects featured in Indo Japan Global partnership Summit and the project featured in the joint statement issued by the Hon’ble PM’s of India & Japan during Japanese PM visit to India in Sep 2017 as well as in December 2015.
• LDB Project won the Express Logistics & Supply Chain Leadership Award for providing Best in Class Visibility across the supply chain.
By bringing in Visibility &
Transparency across Supply Chain, LDB is helping the
trade in streamlining the processes and
bringing in efficiencies.

LDB- Port Terminal Performance Benchmarking
Best Performing Terminal: JNPCT Port TerminalJNPCT is the top performing terminal in comparison to the other port terminals in JNPT from OND’16 to JAS’17.
Trai
n
Tru
ck
Trai
n
118 120.5 120 124.6
OND'16 JFM'17 AMJ'17 JAS'17
Tru
ck
80
76.074
76
OND'16 JFM'17 AMJ'17 JAS'17
IMPORT CYCLE
EXPORT CYCLE
29 35.327 30.8
OND'16 JFM'17 AMJ'17 JAS'17
72
40.054
74
OND'16 JFM'17 AMJ'17 JAS'17

LDB- Port Terminal Performance Benchmarking
Low Performing Terminal: NSIGT Port terminal
Trai
n
Tru
ck
IMPORT CYCLE
4033 36.3
JFM'17 AMJ'17 JAS'17
48.172
128
JFM'17 AMJ'17 JAS'17
Trai
n
Tru
ckEXPORT CYCLE
80
72 72.5
JFM'17 AMJ'17 JAS'17
135 118 108
JFM'17 AMJ'17 JAS'17
In comparison to other Port terminals in the JNPT region , performance recorded for NSIGT Port terminal was on the lower side (Import cycle primarily) for the given time period as below.

LDB- CFS Performance Benchmarking
Top Performing Container Freight Station(CFS)
1. All Cargo logistic CFS, Navi Mumbai
10867 62 57.6
OND'16 JFM'17 AMJ'17 JAS'17
61 63.6
AMJ'17 JAS'17
2. CWC Dronagiri CFS, Navi Mumbai
Low Performing Container Freight Station (CFS)
1. Ashte Logistics CFS, Panvel
2. Maersk Annex (APM) CFS, Mumbai
106 84.0 95 102.6
OND'16 JFM'17 AMJ'17 JAS'17
84.5 107.8
AMJ'17 JAS'17
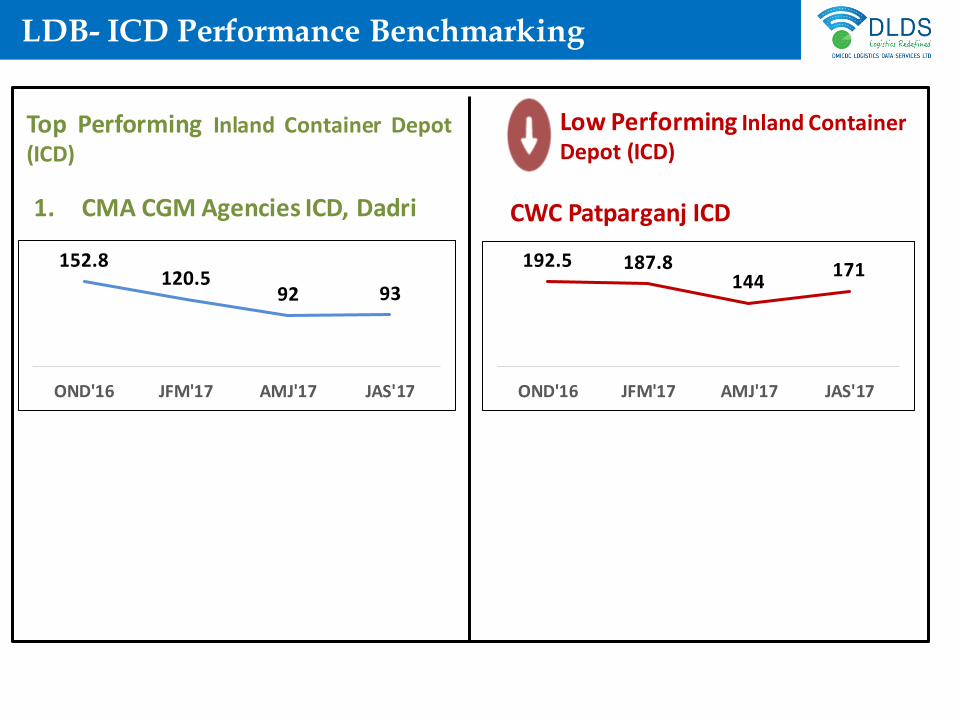
LDB- ICD Performance Benchmarking
Top Performing Inland Container Depot(ICD)
Low Performing Inland Container Depot (ICD)
152.8120.5
92 93
OND'16 JFM'17 AMJ'17 JAS'17
1. CMA CGM Agencies ICD, Dadri CWC Patparganj ICD
192.5 187.8144
171
OND'16 JFM'17 AMJ'17 JAS'17

Key Challenges- JNPT Region
Challenges
Train bound container movement
at Port terminals leading to high
Dwell Time
Mixed Container Movement
across railway sidings
Higher Container
Handling time across railway
siding
Higher Port Dwell time for
rail bound containers
Congestions around certain clusters around
JNPT region
Higher Dwell time for Truck bound Export
containers

Key Challenges-Railways

Key Challenges-Railway bound Containers (Export)
Even though JNPT is working towards gate time for train bound Containers to be between 4-5 days, the below image depicts the scenario wherein the early arrival of the containers via Train within the Port Premises leading to higher Dwell Time.
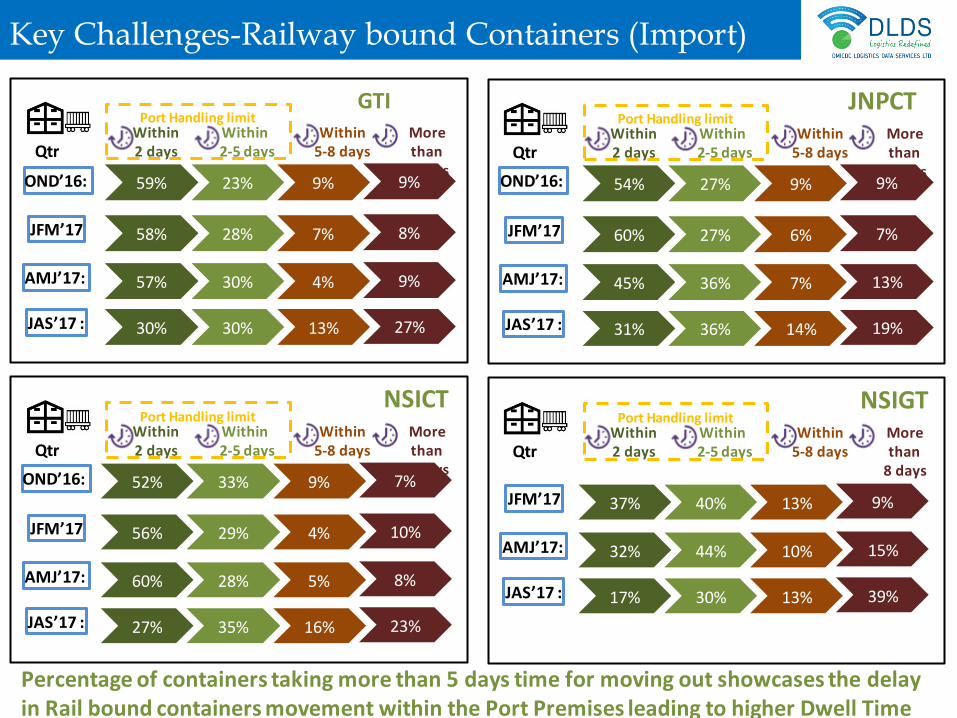
Key Challenges-Railway bound Containers (Import)
59% 23% 9% 9%OND’16:
JFM’17
AMJ’17:
JAS’17 :
More than
8 days
Within 5-8 days
Within2-5 days
Within 2 daysQtr
58% 28% 7% 8%
57% 30% 4% 9%
30% 30% 13% 27%
Port Handling limitGTI
52% 33% 9% 7%OND’16:
JFM’17
AMJ’17:
JAS’17 :
More than
8 days
Within 5-8 days
Within2-5 days
Within 2 daysQtr
56% 29% 4% 10%
60% 28% 5% 8%
27% 35% 16% 23%
Port Handling limitNSICT
54% 27% 9% 9%OND’16:
JFM’17
AMJ’17:
JAS’17 :
More than
8 days
Within 5-8 days
Within2-5 days
Within 2 daysQtr
60% 27% 6% 7%
45% 36% 7% 13%
31% 36% 14% 19%
Port Handling limitJNPCT
JFM’17
AMJ’17:
JAS’17 :
More than
8 days
Within 5-8 days
Within2-5 days
Within 2 daysQtr
37% 40% 13% 9%
32% 44% 10% 15%
17% 30% 13% 39%
Port Handling limitNSIGT
Percentage of containers taking more than 5 days time for moving out showcases the delay in Rail bound containers movement within the Port Premises leading to higher Dwell Time

Key Challenges-Mixed Railway Containers
Rail bound Containers arriving at railway siding of a different port terminal within the JNPT premise and then moving to its destination terminal . (For ex: JNPCT to APM, APM to NSICT etc)
42%
102
34
Mixed Container Dwell time
Cargo Container Dwell time
Container dwell time comparison(in hrs.)
In terms of Dwell Time, time taken by Mixed containers for clearance at the port terminals is much higher in comparison to the regular movement of Containers.
Mixed containers stacking at Yard of different terminal leads to challenges in retrieving the same and at times leads to the possibility of containers missing the vessel leading to loss of revenue for shipping lines.
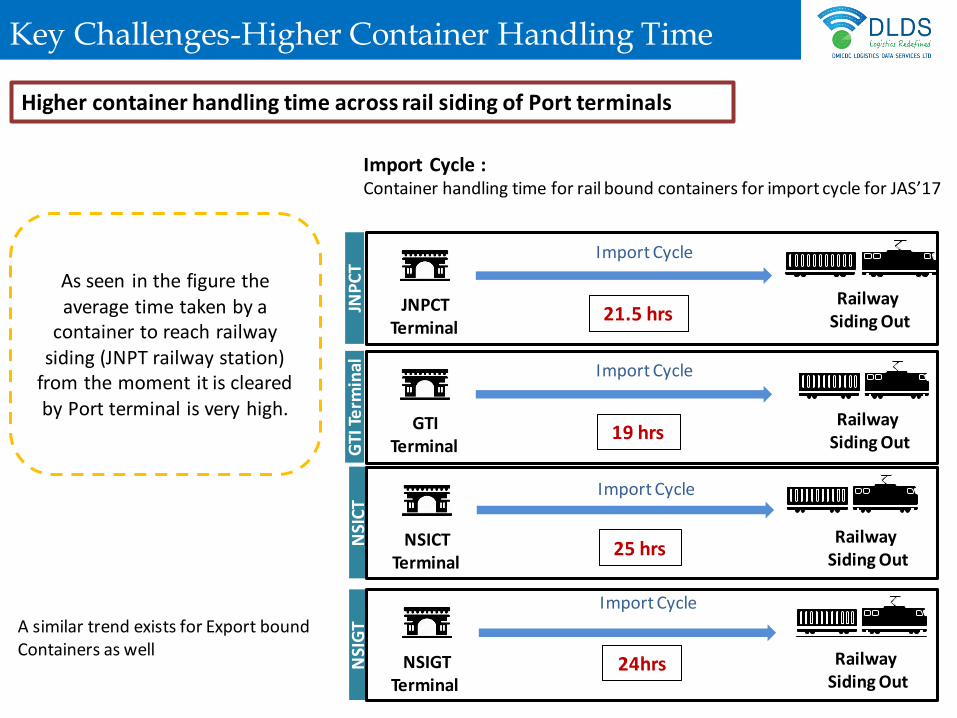
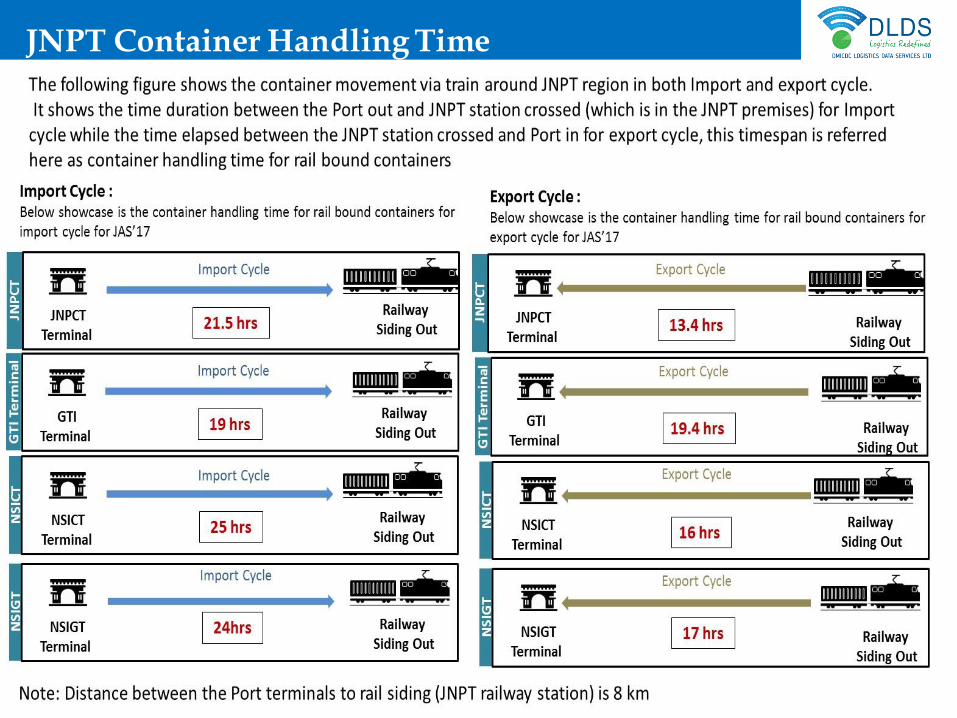
Key Challenges-Higher Container Handling Time
Higher container handling time across rail siding of Port terminals
GTITerminal
RailwaySiding OutG
TI T
erm
inal
19 hrs
JNPCTTerminal
RailwaySiding Out
JNP
CT
21.5 hrs
NSICTTerminal
RailwaySiding Out
NSI
CT
25 hrs
NSIGTTerminal
RailwaySiding Out
NSI
GT
24hrs
Import Cycle : Container handling time for rail bound containers for import cycle for JAS’17
Import Cycle
Import Cycle
Import Cycle
Import Cycle
As seen in the figure the average time taken by a
container to reach railway siding (JNPT railway station)
from the moment it is cleared by Port terminal is very high.
A similar trend exists for Export bound Containers as well

Key Challenges-Roadways
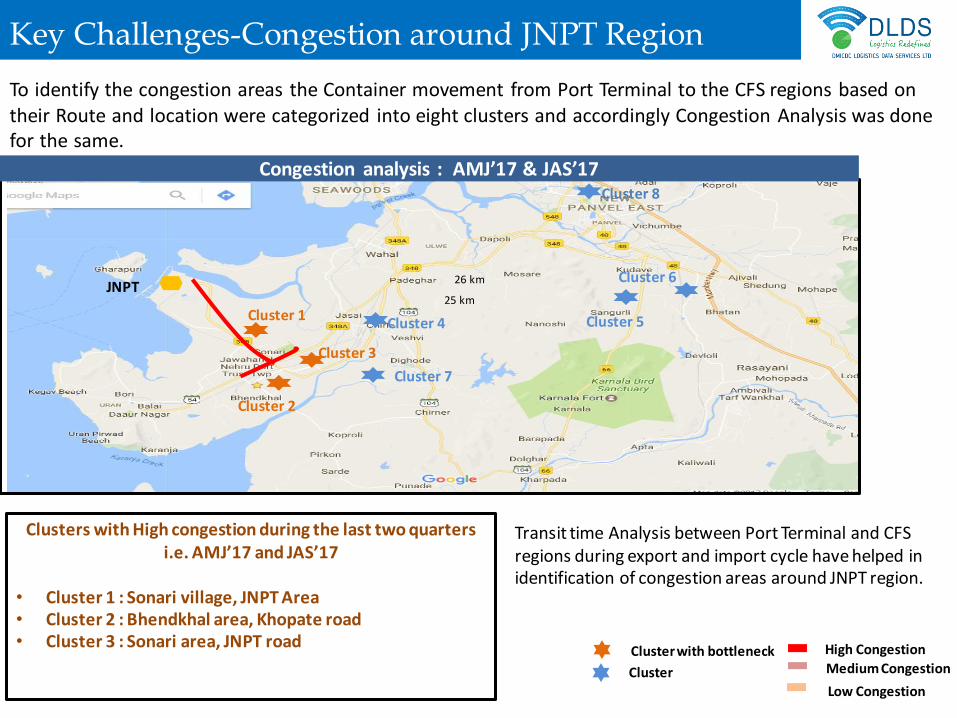
Key Challenges-Congestion around JNPT Region
To identify the congestion areas the Container movement from Port Terminal to the CFS regions based on their Route and location were categorized into eight clusters and accordingly Congestion Analysis was done for the same.
Clusters with High congestion during the last two quarters i.e. AMJ’17 and JAS’17
• Cluster 1 : Sonari village, JNPT Area• Cluster 2 : Bhendkhal area, Khopate road• Cluster 3 : Sonari area, JNPT road High Congestion
Cluster
Cluster with bottleneck Medium Congestion
Low Congestion
Transit time Analysis between Port Terminal and CFS regions during export and import cycle have helped in identification of congestion areas around JNPT region.
Cluster 2
Cluster 5
Cluster 7
Cluster 4
Cluster 6
Cluster 3
Cluster 1
JNPT25 km
26 km
Congestion analysis : AMJ’17 & JAS’17Cluster 8

LDB Analytics

LDB User Testimonials

Global Benchmarking- Trade Performance
Average Port Dwell Time
Ports Dwell Time(in Hrs)
JNPT, India* 48
APSEZ , Mundra* 53
Singapore 31
Jabel Ali, Dubai 29
Hong Kong 17
Port Klang , Malaysia 17
Hamburg , Germany 37
Shanghai , China 20
Vessel Turn Around Time & Avg Vessel berthing Volume
Port Turn Around Time Avg. no. of vessel Calling
per month
JNPT , Mumbai 2-2.5 days 160
APSEZ ,Mundra 0-1 day 190
Shanghai , China 0-1 day 1500
Singapore 1-2 days 1500
Rotterdam , Netherland 1-2 days 600
Port Klang, Malaysia 0-1 day 1000
Hamburg , Germany 1-2 days 400
Global Ranking of Top Container Ports (FY 16) Indian Container Volume in India (FY 17)
Countries Container Handled (IN
Million TEU's) Port
Container Handled (IN Million TEU's)
Shanghai , China 37
JNPT , Mumbai 4.5 Singapore 30.9
Shenzhen , China 23.9 Adani Port SEZ , Mundra 3.9 Rotterdam , Netherland 12.23
Port Klang , Malaysia 11.89
Hamburg , Germany 8.8
Source: Indian Ports Association, Merk-
O Analytics.
Source: LDB Data, Logistics Performance
Index, World Bank.
Source: Indian Ports Association, Logistics
Performance Index

Global Benchmarking
Port Average Lead Time (In Days)
Shanghai , China 6.5
JNPT , Mumbai* 14
APSEZ , Mundra* 14
Arrival v/s Departure handling time for rail bound containers (Port/ICD rail bottleneck in Hrs.)
Port Terminal Arrival handling duration
Departure handling duration
Difference
ICDs, Dadri 3.0
5.9 2.9
JNPT, Mumbai 3.1 7.7 4.6
APSEZ, Mundra 6.5 8.0 1.5
Source: LDB Data
Source: LDB Data, Logistics Performance
Index

Key Findings- JAS Quarter
Increase in Port terminals’ Import Cycle dwell time for JAS’17 quarter as the majority of containers are cleared after 2 days
4939.5 41
65.8
OND'16 JFM'17 AMJ'17 JAS'17
JNPT region overall Import Cycle Dwell time (in Hrs)
JNPCTTruck
GTITrain
NSICTTrain
NSIGTTrain
JNPCTTrain
AMJ’17 JAS’17
57% 30%
Within 2 days Within 2 days
60%
27%
15%
12%
11%
9%
GTITruck
NSICTTruck
NSIGTTruck
82%
62%
82%
62%
70%
63%
78%
69%
Terminal with mode
Container Clearance volume

Key Findings- JAS Quarter
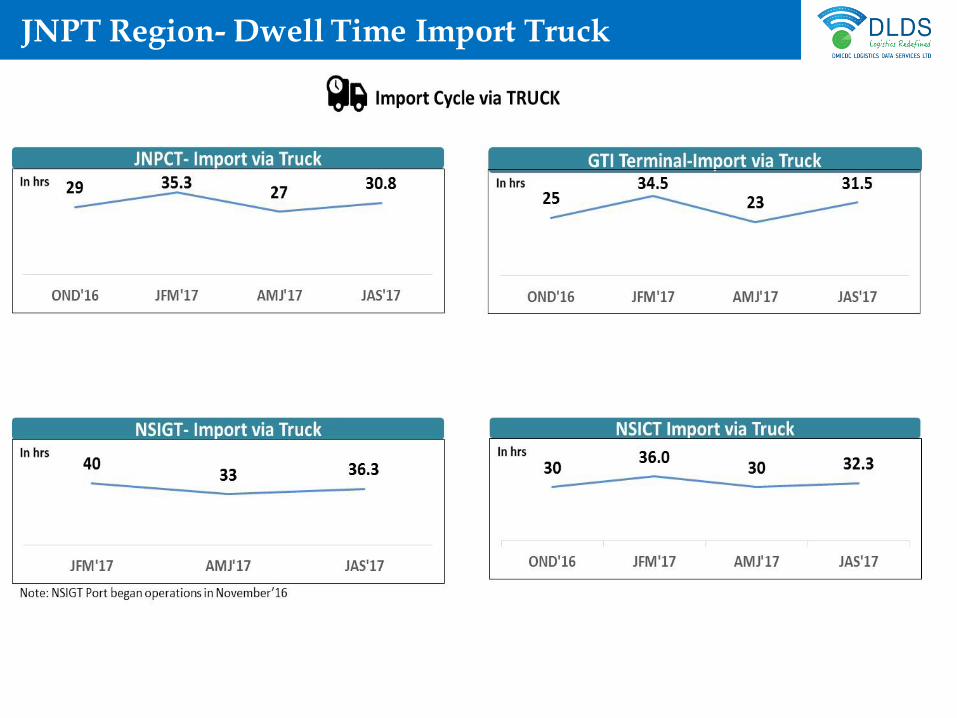
JNPT Region- Dwell Time Import Truck

JNPT Region- Dwell Time Import Train

JNPT Region- Dwell Time Export Truck

JNPT Region- Dwell Time Export Train

Performance Index- Port Terminals

Performance Index- Container Freight Stations

Performance Index- Container Freight Stations

Performance Index- Inland Container Depots
JNPT Container Handling Time

Congestion Analysis: Toll Plaza
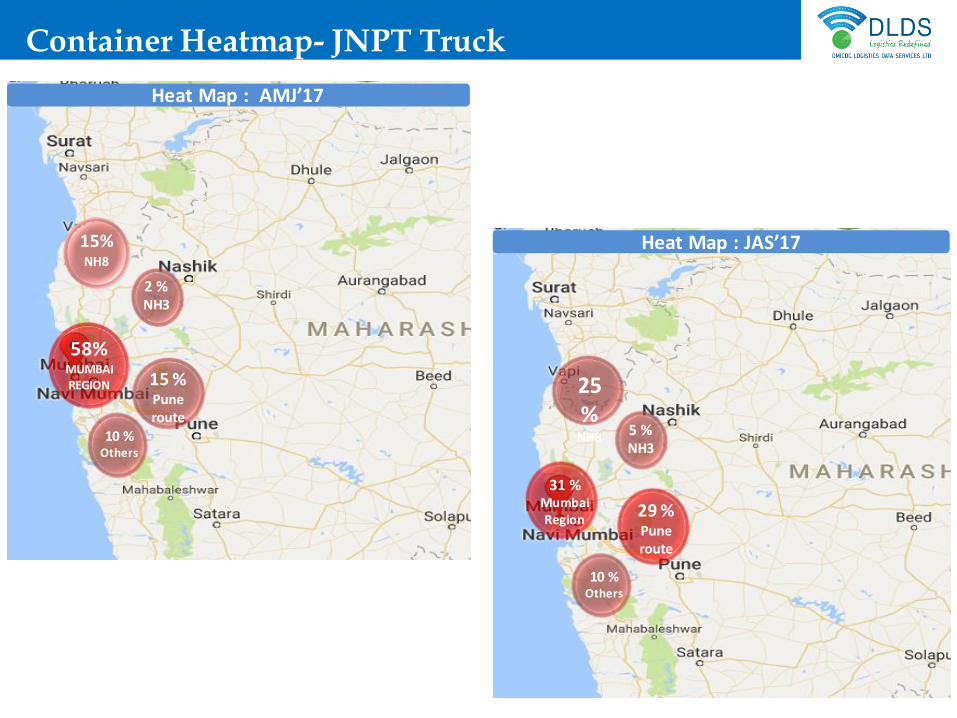
Container Heatmap- JNPT Truck
58%MUMBAI REGION
Heat Map : AMJ’17
2 %NH3
15 %Pune route
10 %Others
15%NH8
Heat Map : JAS’17
5 %NH3
10 %Others
29 %Pune route
31 %Mumbai Region
25%
NH8

Container Heatmap- JNPT Train
LDB Operations

LDB Coverage

LDB Coverage
THANK YOU