
DK1288_Ch13
50
13 Analytical Applications of Solvent Extraction MANUEL AGUILAR, JOSE ´ LUIS CORTINA, and ANA MARI ´ A SASTRE Universitat Polite`cnica de Catalunya, Barcelona, Spain 13.1 INTRODUCTION The role of solvent extraction in analytical chemistry has steadily increased since the mid-1950s as a powerful separation technique applicable both to trace and macro levels of materials. Work in this field has provided the basis for a rich store of analytical methodology characterized by high sen- sitivity and selectivity as is described in Chapters 2– 4. Developments of new extractants and their application to separation of a growing variety of compounds are recognized as an important area of analytical chemistry. Advances in this field over the last 50 years have been reported in a large number of publications, among them several monographs and reviews [1–5]. Because of the great range of concentrations (from weightless trace levels of carrier-free radioisotopes to macro levels of several weight percent of metal ions) for which quantitative separations by solvent extraction are applicable, this technique is equally useful in analytical, preparative, and process chemistry. Solvent extraction has been also used as a separation step in many analytical techniques and methods in response to the new problems posed in many other fields such as medicine, biology, ecology, engineering, etc. Among these, automatic methods of analysis have gained a notable momentum and have motivated the development of a large number of commercial instruments. Solvent extraction has also played a major role in sample pre- or posttreatment to improve selectivity and sensitivity. Initially simple schemes of liquid–liquid extraction were used as separation methods for the clean- up and preconcentration of samples, mainly because of its simplicity, Copyright © 2004 by Taylor & Francis Group, LLC
-
Upload
api-19668023 -
Category
Documents
-
view
302 -
download
1
Transcript of DK1288_Ch13

13Analytical Applications of Solvent Extraction
MANUEL AGUILAR, JOSE LUIS CORTINA, and ANA MARIASASTRE Universitat Politecnica de Catalunya, Barcelona, Spain
13.1 INTRODUCTION
The role of solvent extraction in analytical chemistry has steadily increasedsince the mid-1950s as a powerful separation technique applicable both totrace and macro levels of materials. Work in this field has provided thebasis for a rich store of analytical methodology characterized by high sen-sitivity and selectivity as is described in Chapters 2–4. Developments of newextractants and their application to separation of a growing variety ofcompounds are recognized as an important area of analytical chemistry.Advances in this field over the last 50 years have been reported in a largenumber of publications, among them several monographs and reviews [1–5].Because of the great range of concentrations (from weightless trace levels ofcarrier-free radioisotopes to macro levels of several weight percent of metalions) for which quantitative separations by solvent extraction are applicable,this technique is equally useful in analytical, preparative, and processchemistry. Solvent extraction has been also used as a separation step inmany analytical techniques and methods in response to the new problemsposed in many other fields such as medicine, biology, ecology, engineering,etc. Among these, automatic methods of analysis have gained a notablemomentum and have motivated the development of a large number ofcommercial instruments.
Solvent extraction has also played a major role in sample pre- orposttreatment to improve selectivity and sensitivity. Initially simple schemesof liquid–liquid extraction were used as separation methods for the clean-up and preconcentration of samples, mainly because of its simplicity,
Copyright © 2004 by Taylor & Francis Group, LLC

reproducibility, and versatility. Later, the distribution between two liquidphases was used as an efficient tool in chromatographic separation processes.More recently, the same principles have been implemented using supercriticalfluids in preconcentration, cleanup, and column separation schemes.
In the past decades, the principles and the properties of solventextraction reagents were used to develop extraction chromatography tech-niques, to design different types of membrane electrodes, and to prepare anddevelop impregnated materials. In such materials where the extractant isplaced in a solid matrix, commonly an organic polymer or an inorganicadsorbent, advantage is taken of their improved properties when highvolumes of aqueous samples are to be treated.
13.2 ROLES OF SOLVENT EXTRACTION INANALYTICAL CHEMISTRY
The analytical process can be defined as a set of operations separating theuntreated, unmeasured sample from the results expressed as required inaccordance with the ‘‘analytical black box’’ concept. However, followingmodern schemes of analysis, the total analytical process can be defined bya set of operations as shown in Fig. 13.1 [6]. According to these ideas, theso-called preliminary operations comprise a series of steps such as sam-pling, sample preservation and treatment (e.g., dissolution, disagregga-tion), separation techniques, development of analytical reactions, andtransfer of an adequate portion of the treated sample to the detector. Thesecond stage of the analytical process requires the use of one or severalinstruments to generate pertinent information. The resulting analyticalsignal (optical, electrochemical, thermal, etc.) should be unequivocallyrelated to the presence, amount, or chemical structure of one or severalanalytes. Solvent extraction has been extensively used in two of these stepsin the analytical process: step 4, sample preparation (pretreatment, sep-aration) and step 5, which is more concerned with measurement. Detailsof procedures and methodologies are described in the following para-graphs.
13.3 SOLVENT EXTRACTION INSAMPLE PREPARATION ANDPRETREATMENT STEPS
In sample preparation or sample pretreatment steps there are a number ofimportant operations that may include: dissolution of the sample, trans-formation of the elements into specific inorganic forms, conversion of the
Copyright © 2004 by Taylor & Francis Group, LLC

analytes into alternative chemical species, separation of the analyte fromother chemical species present, and preconcentration. The significance ofthese preliminary operations is generally very critical because they could bethe source of major errors that may hinder analyte preconcentration andelimination of matrix effects. On the other hand, these procedures can berather complex and time consuming and thus require ample dedication.Then, the first stage of the analytical process decisively influences the pre-cision, sensitivity, selectivity, rapidity, and cost. Sample pre- and post-treatments in analytical schemes are intended to:
1. Improve selectivity, by removal of interfering species from the samplematrix
2. Improve sensitivity by means of preconcentration3. Prevent the deterioration of the analytical system by a sample cleanup
step
13.3.1 Operation Modes
Liquid–liquid extraction is by far the most popular separation method forthe cleanup and preconcentration of samples because it is simple, repro-ducible, and versatile. There are several ways to achieve these objectives,from the original discontinuous (‘‘batch’’) and nonautomatic techniques tocontinuous separation techniques incorporated with automated methods ofanalysis. The methodologies can be classified into two general types:
Fig. 13.1 General scheme of the analytical process.
Copyright © 2004 by Taylor & Francis Group, LLC

13.3.1.1 Discontinuous Methods (Batch)
Discontinuous methods are performed in conventional separating funnels inone or more steps. In ultratrace analyses, tapered or specially profiled quartztubes are recommended because of their easier cleaning (more compact size),the introduction of less contaminating material, and easier centrifugation inthe case of difficulties with phase separation. Shaking must be continueduntil equilibrium is reached, which may last seconds, minutes, or (rarely)hours, depending on the physicochemical properties of the system; morethan 2–5min requires a mechanical shaker. Microscale extraction carriedout in autosampler tubes, followed by direct automatic introduction of theorganic phase into the atomizer, is recommended.
13.3.1.2 Continuous Methods
Continuous methods can be performed by different procedures, such assolvent recirculation, extraction chromatographic techniques, or counter-current chromatography. The introduction of extractors in continuousmethods such as segmented flow analysis (SFA), flow injection analysis(FIA), and completely continuous flow analysis (CCFA) that are used as pre-or postcolumn devices in chromatographic separation techniques (liquidchromatography) have been used widely in the last decade. Continuous-flowextraction involves segmenting of an aqueous stream with an organic sol-vent and separation of the phases using a membrane separator [7]. Thisoption is seldom used in practice because the preconcentration factorsare small and solvent consumption is large. An interesting possibilityis offered by countercurrent extraction, in which gravitational forcesretain the organic phase while the aqueous phase is pumped through it. Thebasic components of a continuous liquid–liquid extractor are shown inFigure 13.2.
As can be seen in this figure, a continuous liquid–liquid extractionsystem consists of three main parts and performs the following functions:
Fig. 13.2 General scheme of a continuous solvent extraction contactor.
Copyright © 2004 by Taylor & Francis Group, LLC

1. It receives the two streams of immiscible phases and combines them intoa single flow with alternate and regular zones of the two phases (solventsegmenter).
2. It facilitates the transfer of material through the interfaces of segmentedflow in the extraction coil, the length of which, together with the flowrate, determines the duration of the actual liquid–liquid extraction.
3. It splits, in a continuous manner, the segmented flow from the extrac-tion coil into two separated phases (phase separator).
The functions of these three parts are based on the same fundamentalprinciple, i.e., the selective wetting of internal component surfaces by bothorganic and aqueous phases. In general, it is found that organic solvents wetTeflon surfaces whereas aqueous phases wet glass surfaces.
13.3.2 Solvent Extraction for Separation Steps
Solvent extraction can facilitate the isolation of analyte(s) from the majorcomponent (matrix) and/or the separation of the particular analyte fromconcomitant trace or minor elements. Extraction is usually a fast and simpleprocess, that demands only very simple equipment but having as a dis-advantage its rather low preconcentration coefficient. In practice, the sep-aration/preconcentration step consists either of selectively removing thematrix without affecting the analyte(s) or of isolating the analyte(s) with-out affecting the matrix. There is a variety of separation/preconcentrationmethods available [8]. The most popular include solvent extraction, pre-cipitation, sorption and chromatographic techniques, volatilization, andelectrodeposition. The choice is dictated by the sample to be analyzed, theanalytes and concentration levels to be determined, and the characteristics ofthe determination technique. In any case, the incorporation of a separation/preconcentration step increases the analysis time, may result in losses of theanalyte(s), and at the same time raises demands both on the purity ofreagents used and the analytical expertise required.
The selectivity of the extraction is expressed by the separation factor S,which is derived from the individual distribution coefficients (D1, D2) fortwo species (1, 2):
S ¼ D1=D2 (13.1)
This coefficient gives quantitative information for the separation of bothspecies. Working with mixtures of extractants, additional experimentalinformation is needed and the synergistic coefficient (SC) defined by [9]:
SC ¼ log D12=ðD1 þD2Þ (13.2)
Copyright © 2004 by Taylor & Francis Group, LLC

where D12 denotes the distribution coefficient of the species for the mixtureof extractants. In analytical chemistry, for an extraction system based on apH-dependent extraction reaction, as in the case of acidic extractants, thevalue of SC has been estimated by the following equation:
SC ¼ n �pH50 (13.3)
where n is the charge of the metal ion and DpH50 is the difference of pHcorresponding to 50% extraction when the total concentration of theextraction system is the same for the single system and for the mixtures.
13.3.3 Preconcentration for TraceElement Determination
Preconcentration is an operation in which the relative ratio of trace com-ponents vs. the macro component is increased; it is aimed, typically; forovercoming limited detection characteristics of the instrumental technique.The efficiency of this operation, the preconcentration factor (PF ), is definedin terms of recovery as:
PF ¼ ½AT �=½AoT � (13.4)
where [AT] and [AoT ] are the concentrations of the microcomponent in the
concentrate and in the sample respectively. The need for preconcentra-tion of trace compounds results from the fact that instrumental analyticalmethods often do not have the required selectivity and/or sensitivity. Thus,the combination of instrumental techniques with concentration techniquessignificantly extends the range of application of the instrument. The chem-ical techniques used in preconcentration can provide, in many cases, analyteisolation, as well as high enrichment factors. The concept of sample pre-concentration prior to determination could apply to many situations otherthan just concentration enrichment and minimization of matrix effects.Selection of a preconcentration scheme based on any liquid–liquid extrac-tion step will depend upon on the type of analyte and/or sample matrix.
Concentration factors reasonably achieved by solvent extraction havepractical limits. However, considering a reasonable practical limit of ex-tracting a 100 cm3 sample with 1–2 cm3 of organic phase, a concentrationfactor of 100 to 50 can be achieved. One of the limitations of the pre-concentration factor in batch solvent extraction is the difficulty of obtaininggood separation of the small volume of organic phase. Significant portionsof the organic solvent may adhere to the walls of the vessel, requiringrepeated washings, which decreases the concentration factor.
Copyright © 2004 by Taylor & Francis Group, LLC

Thus, to conduct successful analyses for many organic and inorganiccompounds at trace concentrations, it is necessary to extract these com-pounds and use a concentration step prior to analysis. Many of the tech-niques developed for preconcentration are described in specialized books[10]. Proper choice of the extracting solvent can often be the critical step inthe procedure.
13.3.3.1 Preconcentration of Inorganic Compounds
There has been a growing demand for highly sensitive analytical methods oftrace components in complicated matrices. Recent advances of new ligands,chelating reagents, and instrumentation have improved detection and spec-ificity. However, in the presence of an interfering matrix, or when the con-centration of the component of interest is far less than the instrumentaldetection limit, it is necessary to concentrate the trace component with highselectivity beforehand. Although many types of reagents can be used toextract a wide variety of metal ions from different media, chelating agents aretypically widely used. It is interesting to note that a considerable number ofmethods for specific extractions with reagents such as 8-hydroxyquinolinehave been developed in the past, basically because the instrumentation atthat time was not sufficiently specific and so prior separation was required.For example, interference in atomic absorption determinations are common,and so separations of interfering species are frequently required. Grouppreconcentration of trace elements has the objective of isolating the max-imum number of elements in a single step using the minimum number ofreagents, with the excess reagents being retained in the aqueous phase. On theother hand, by suitable choice of the appropriate pH and sometimes usingappropriate masking agents, these reagents may become highly selective andeven specific for a particular species. In some cases exchange techniques inwhich a less stable metal chelate is the source of the chelating agent may bevery useful. Extraction reagents available for this purpose fall into severalbasic categories (solvating, chelating, ion exchangers, etc.) as described inChapter 4.
A series of preconcentration techniques based on the use of a solidphase carrying a liquid metal extractant has been developed [11,12]. Thesesolid phases substitute the solvent (liquid phase) carried of the liquid–liquidextractant with a solid phase. Such impregnated materials have been pre-pared using different types of solid supports: paper, resin beds, gels, poly-urethane foams, flat and hollow fiber membranes, clays, silica, etc. Themajor advantage of most of these solid adsorbents is that the functionalgroup is immobilized on a solid substrate, therefore providing the possibilityof either batch extraction of the analytes from solution or using the solidphase in a column.
Copyright © 2004 by Taylor & Francis Group, LLC

13.3.3.2 Preconcentration and Separationof Organic Compounds
A complete scheme for trace analysis of organic compounds generallyconsists of sampling, extraction, prefractionation, and analysis by gas chro-matography (GC) or gas chromatography/mass chromatography (GC-MS).Determination of organics at parts per trillion (ppt) levels can be performedby combining sensitive and selective detection with sample preconcentra-tion. Increasing the degree of preconcentration can make the limits ofdetection extremely small. Many standard methods of analysis [13] ofteninclude preconcentration as an integral part of the sampling and extractionprocedure. It is especially important for environmental samples where manytoxic and carcinogenic compounds are distributed from a wide variety ofsources. Because of their serious damaging effects at low levels, to assesstheir environmental impact it is necessary to achieve the greatest possibleanalytical sensitivities. In some cases, detection limits as low as a few ppt arerequired. In addition to the polynuclear aromatic hydrocarbons (PAHs),much attention has been focused on many halogenated pollutants such aspesticides, polychlorinated biphenyls (PCBs), trihalomethanes (THMs),polychlorinated dibenzofurans (PCDFs), and dibenzo-p-dioxines. Such sub-stances can be found in air, water, and solid and biological samples. Mostpreconcentration techniques fall into two classes: solvent extraction fol-lowed by solvent reduction or sorbent trapping with subsequent solventelution or thermal desorption. There are many variations of these methods,and they are frequently used in combination.
13.3.3.2a Solvent Extraction Reduction
Solvent extraction reduction is most frequently performed mainly in con-nection with the extraction of solid and biological samples by liquid parti-tion. Extractions are typically accomplished using a Soxhlet apparatus thatprovides the benefits of multiple extractions. By repeated distillation andcondensation of the solvent, the apparatus allows multiple extractions usingthe same (small) volume of solvent. Soxhlet extraction has been a standardmethod for many decades, and it is often the method against which otherextraction methods are measured and verified [14].
Preconcentration will only give precise results for quantitative work ifthe initial extraction technique gives high, or at least known and repro-ducible, recoveries of the desired compounds from the initial sample. Astypically, several cycles are needed, and the solvent containing the extractedcompounds must be concentrated to a small volume. This is normally carriedout by evaporation under reduced pressure. Volatile compounds may be lostin this procedure. However, for many applications the compounds of interest
Copyright © 2004 by Taylor & Francis Group, LLC

are nonvolatile compared to the extracting solvent. In such applications, theuse of a rotary evaporation technique is rapid and straightforward, althoughsevere losses of even nonvolatiles can be experienced without careful samplehandling. The major problem involves the physical handling of the sample, aseven the very small volume losses to the glass walls of the recovery flask orthe disposable pipettes commonly used for sample transfer may result insignificant and nonreproducible component loss.
13.3.3.2b Accelerated Solvent Extraction (ASETM)
Accelerated solvent extraction is a relatively new extraction technique usingequipment that holds the sample in a sealed high-pressure environment toallow conventional solvents to be used at higher temperatures [15]. Using ahigher temperature without boiling, ASE allows smaller volumes of solventto be used in a single-stage extraction. Extraction kinetics are also faster, sothe entire process is much faster than Soxhlet extraction. After heating, thecell is allowed to cool to below the normal boiling point of the solvent andpressure is applied to the cell to force the solvent and extracted materialsthrough a filter.
13.4 SOLVENT EXTRACTION AS A MEANSOF ANALYTICAL DETERMINATION
In the previous section, the role of solvent extraction was limited to pre-paring the analyte for subsequent analysis. A large majority of proceduresthat use solvent extraction in chemical analysis are used in this fashion.However, the extraction itself, or rather the distribution ratio characteriz-ing it, may provide an appropriate measured signal for analysis. Examplesof this use of solvent extraction are found in spectroscopy, isotope dilutionradiometry, and ion-selective electrodes using liquid membranes. In thelatter case, electrochemical determinations are possible by controlling thelocal concentration of specific ions in a solution by extraction.
13.4.1 Analytical Methods Based onSpectrophotometric Detection
The oldest application of solvent extraction in spectrophotometric deter-minations uses extraction from the original aqueous solution and sub-sequent back-extraction into a second aqueous phase. Here the extractantprovides only separation or concentration, as in the case of Np(IV) andPu(IV) determination [16]. However, as only a few element species (e.g.,MnO�4 , CrO
2�4 ) are capable of absorbing light in the UV-VIS range, usually
all spectrophotometric methods are based on reactions of analytes with
Copyright © 2004 by Taylor & Francis Group, LLC

color-forming reagents. The role of the most important organic reagents hasbeen discussed [17] and a comprehensive dictionary is available [18].
Chelating reagents are the most popular. Although most of these reac-tions were initially developed for aqueous phase measurement, in many casestaking into account the low aqueous solubility of the analyte-chromogenicreagents, extraction into an organic phase was used for direct spectroscopicmeasurements. Among the most important reagents used are the follow-ing [19].
Dithizone (diphenylthiocarbazone) is a weak acid insoluble in water atpH <7 but readily soluble in CCl4 and CHCl3. It reacts with many metalions to form chelates that can be extracted into the organic phase fromwhich the excess of the green reagent is stripped with dilute NH3. The moststable dithizonates (Pt, Pd, Au, Ag, Hg, and Cu) are extracted from stronglyacid solutions. Other metals (Bi, Ga, In, Zn) are extracted from weakly acidmedia and some (Co, Ni, Pb, Tl, Cd) from neutral or alkaline media. Somecompounds are extracted rapidly (Ag, Hg, Pb, Cd) and others more slowly(Pd, Cu, Zn), while a few (Rh, Ir, and Ru) require prolonged heating to beformed.
Azo dyes contain an azo link between two aromatic rings possessing aorthohydroxy group. The most important reagents include PAN, PAR, andArsenazo III and generally they offer high sensitivity for the majority oftransition metals.
Chelating dyes include triphenylmethane reagents (e.g., PyrocatecholViolet, Eriochrome Cyanine R, Chrome Azurol S, Xylenol Orange) andxanthene reagents (fluorones, e.g., Gallein, Pyrogallol Red, phenylfluorone,and salicylfluorone). They form chelates with most metals. Ionic surfactantsmake it easier to dissociate the protons of chelating triphenylmethanereagents and facilitate reactions with easily hydrolyzable metals (Be, Al, Fe,Se, Ti, Zr), leading to very sensitive but poorly selective methods.
Nonchelating dyes include basic triphenylmethane dyes (e.g., BrilliantGreen, Malachite Green, Crystal Violet), xanthene dyes (e.g., Rhodamine B,Rhodamine 6G), azine dyes (e.g., Methylene Blue), and acid dyes (e.g.,Eosin, Erythrosin). These are intensely colored and when paired with anoppositely charged analyte ion lead to high sensitivities.
Crown ethers are not chromogenic unless they contain a pendantchromogen able to dissociate a proton in a basic medium. The resultinganion interacts strongly with the crown-complexed cation compensating theelectric charge. The formation of a zwitterion leads to a hydrophobic ex-tractable species with a considerably shifted absorption maximum comparedwith the protonated species. This allows the same spectrophotometricdetermination to be used for a large number of metal ions, provided theappropriate crown compound is used in each case. Another method involves
Copyright © 2004 by Taylor & Francis Group, LLC

using specific macrocyclic reagents that incorporate a chromophoric group,even if the latter is not involved in the complexation of the metal ion. Thislatter use of crown compounds is a development of an earlier knownmethod, used when no reagent could be found, which combines selectivityfor a certain metal and spectrophotometric sensitivity. In such cases, theanalyte is first extracted by a highly selective extractant, after which thereagent providing the photometric determination is added to the extractantphase [20].
13.4.2 X-Ray Fluorescence
Although this method is generally used on solid samples, it may be beneficialin some cases to combine the procedure with solvent extraction. In additionto the usual advantages of separation and preconcentration (before the solidsample is prepared), it may be easier to prepare the required solid sample byevaporation or crystallization from an organic extract phase rather thanfrom an aqueous solution [21]. Of special interest is the technique that usesan extraction system that is solid at room temperature, but has a relativelylow melting point. Liquid–liquid extraction is performed at a temperatureabove the melting point and after separation of the phases, the organic meltis allowed to solidify, to give a purified concentrate of the analyte [22].
13.4.3 Atomic Absorption Spectroscopy andFlame Emission Spectroscopy
It may seem that the high selectivity of these techniques would make aseparation process superfluous. However, preconcentration, especially theremoval of the solution medium, is often essential in atomic absorptiondeterminations. Extraction into an organic phase decreases the detectionlimit by increasing the rate of introduction of the solution into the flame,since most organic solvents have a lower viscosity and surface tension thanaqueous solutions. In addition, the sensitivity of the determination may beinfluenced favorably by changes in flame temperature and composition [23].Using the combination of solvent extraction-flame atomic absorption,attention must be paid to the problems of vapor toxicity or noncombus-tibility of the extractant or its diluent. For example, benzene or chlorinecontaining solvents should always be avoided. Favored extraction systemsare solutions of a chelating agent such as oxine (8-hydroxyquinoline), aketone (methylisobutylketone), or butyl acetate [24].
The advantages of solvent extraction in combination with atomicabsorption apply equally well for flame emission spectroscopy. In addition,the latter analytical method often requires separation of the analyte from alarge excess of other components. This may be achieved either by extracting
Copyright © 2004 by Taylor & Francis Group, LLC

the elements to be determined or by carrying out the spectrometric analysisof an aqueous solution from which the interfering components have beenremoved by extraction [25].
13.4.4 Polarography (Voltammetry)
Solvent extraction has also been used to enhance the selectivity of polaro-graphic determinations. Such measurements are normally carried out inaqueous solutions, and extraction followed by back-extraction has beenwidely used. However, it may be unnecessary to perform a back-extraction ifthe organic extractant phase has a sufficiently high dielectric constant todissolve sufficient background electrolyte for a voltammetric determinationor if the organic phase can be diluted with suitable polar solvents, such asmethanol or acetonitrile [26].
13.4.5 Activation Analysis
Activation analysis is the main radiometric method used in analyticalchemistry. The sample is irradiated in a neutron flux, and the resultingspecific radioactivity of the analyte determined. Although high-resolutiongamma spectrometers would seem to eliminate the need for highly selectiveseparation of individual gamma-emitting radioactive elements, group sep-aration still may be necessary. Solvent extraction can be used in combina-tion with activation analysis in two ways: either by separating the analytefrom interfering components and preconcentrating before irradiation, or byperforming the neutron activation and separating the analyte before theradiometric determination. The latter method has the advantage of elim-inating the need for a blank correction. However, when the interferingcomponents become highly radioactive and the resulting radioisotopes arelong-lived, it is preferable to remove them before irradiation.
13.4.6 Isotope Dilution Radiometry
In this type of radiometric analysis, a tracer quantity of a radioactive iso-tope is added to the analyte, which is then partly extracted using a specificextractant. Since the extractant may be considered as reacting totally withthe analyte, the ratio of radioactivity in both phases provides the con-centration of analyte in the sample. This method, first developed by Stary[2], has proved to be useful in several systems.
13.4.7 Liquid Scintillation Counting
Carbon-14 and tritium are radioisotopes with b-emissions of very low energythat are extremely difficult to detect with any form of window counter, due to
Copyright © 2004 by Taylor & Francis Group, LLC

self-absorption of the b-particles and absorption within the counter window.To reduce the self-absorption losses, it is desirable to mix the active samplehomogeneously with the detecting material. This can be done by counting thesample in the gaseous phase. The gaseous activity can then be intimatelymixed with the filling gas of any type of gas ionization detector, thus mini-mizing the effect of b-absorption and resulting in high counting efficiencies.In this, the radioactive sample and a scintillator material are both dissolvedin a suitable solvent, and the resulting scintillations are detected and counted[27]. The method is called liquid scintillation counting. If a compound con-taining an a- or b-emitting isotope is dissolved in a solvent such as toluene,the radioactive emissions result in the formation of electronically excitedsolvent molecules. If the solution also contains a small amount of a suitablescintillator, the excited solvent molecules rapidly transfer their excitationenergy to the scintillator, forming electronically excited scintillator mole-cules, which then relax by the emission of photons. All scintillator solutionscontain:
1. a solvent;2. a primary solute, the scintillator material; and may contain3. a secondary solute.
The functions of the solvent are to keep the scintillator or solute in solution,and to absorb the decay energy of the radioisotope for subsequent transferto the solute. Solvents fall broadly into three categories:
1. Effective solvents, e.g., aromatic hydrocarbons such as toluene andxylene.
2. Moderate solvents, e.g., many nonaromatic hydrocarbons.3. Poor solvents; unfortunately this includes virtually everything else
including the most common laboratory solvents such as alcohols,ketones, esters, and chlorinated hydrocarbons.
13.4.8 Other Methods
Several other analytical procedures exist in which solvent extraction may beapplied. Thus extraction has been used in a limited number of analyses withprocedures such as: (1) luminescence (fluorimetry), where, for example, thedetection limit of rhodamine complexes of gallium or indium can be in-creased by extraction [28]; (2) electron spin resonance using a spin-labelledextractant [29]; and (3) mass spectrometry, where an organic extract of theanalyte is evaporated onto pure Al2O3 before analysis [30].
Several thousand articles have been published on analytical proceduresfor chemical elements in which solvent extraction is involved. The scope ofthis chapter limits us to only one example for each element (Table 13.1).
Copyright © 2004 by Taylor & Francis Group, LLC

Table 13.1 Elements Determined by an Analytical Procedure Involving Solvent
Extraction
Element Extractant Analytical technique Ref.
Alkali metals crown ether compounds Spectrophotometry (AAS) 30
Lithium dipivaloylmethane Spectrophotometry (VIS) 31
Potassium crown ether compounds Spectrophotometry (VIS) 5
Rubidium/Caesium nitromethane Spectrophotometry (VIS) 32
Copper dithizone Isotope dilution 33
diethyldithiocarbamate Spectrophotometry (VIS) 17
Silver diethyldithiocarbamate Isotope dilution 34
dithizone Spectrophotometry (VIS) 17
Gold diphenyldipyridylmethane Activation analysis 35
dithizone Spectrophotometry (VIS) 17
Beryllium b-diketones Spectrophotometry (AAS) 36
Magnesium 8-hydroxyquinoline Spectrophotometry (VIS) 37
Calcium tributylphosphate/CCl4 Spectrophotometry (VIS) 38
Strontium polyethylene glycol Activation analysis 39
Barium crown ether compounds Spectrophotometry (AAS) 40
Zinc dithizone Spectrophotometry (VIS) 41
diethyldithiocarbamate Spectrophotometry (VIS) 17
thioxine Molecular fluorescence 17
Cadmium diethyldithiocarbamate Polarography 42
thioxine Molecular fluorescence 17
Mercury dithizone Spectrophotometry (VIS) 43
Aluminium 8-hydroxyquinoline Spectrophotometry (VIS) 44
Gallium diisopropyl ether Activation analysis 45
thioxine Spectrophotometry (VIS) 17
8-hydroxyquinoline Spectrophotometry (VIS) 17
Indium b-mercaptoquinoline Polarography 46
thioxine Molecular fluorescence 17
8-hydroxyquinoline Spectrophotometry (VIS) 17
Thallium diethyldithiocarbamate Spectrophotometry (VIS) 47
8-hydroxyquinoline Spectrophotometry (VIS) 17
Scandium mesityl oxide Spectrophotometry (VIS) 48
Yttrium diantipyrylmethane Complexometry 49
Lanthanides diethylhexylphosphoric acid Activation analysis 50
Thorium trioctylphosphine oxide Spectrophotometry (VIS) 51
8-hydroxyquinoline Spectrophotometry (VIS) 17
Uranium quaternary amine Spectrophotometry (VIS) 52
diethyldithiocarbamate Spectrophotometry (VIS) 17
8-hydroxyquinoline Spectrophotometry (VIS) 17
thenoyltrifluoroacetone Spectrophotometry (VIS) 17
Germanium dibutyl ether Spectrophotometry (AAS) 53
Tin diisopropyl ether Activation analysis 54
Copyright © 2004 by Taylor & Francis Group, LLC

Element Extractant Analytical technique Ref.
Lead diethyldithiocarbamate Polarography 42
thioxine Spectrophotometry (VIS) 17
dithizone Spectrophotometry (VIS) 17
Titanium monolaurylphosphoric acid Isotope dilution 55
Zirconium trioctylphosphine oxide Spectrophotometry (VIS) 56
Hafnium thenoyltrifluoroacetone Spectrophotometry (VIS) 57
Phosphorous butanol Spectrophotometry (VIS) 58
Arsenic carbon tetrachloride Spectrophotometry (AAS) 59
thioxine Spectrophotometry (AAS) 17
Antimony dithiocarbamate Spectrophotometry (AAS) 60
thioxine Spectrophotometry (AAS) 17
Bismuth dithiocarbamate Spectrophotometry (VIS) 61
thioxine Spectrophotometry (VIS) 17
dithizone Spectrophotometry (VIS) 17
Vanadium Cupferron Spectrophotometry (AAS) 62
8-hydroxyquinoline Spectrophotometry (VIS) 17
thenoyltrifluoroacetone 17
Niobium tetraphenylarsonium salt Spectrophotometry (VIS) 63
8-hydroxyquinoline Spectrophotometry (VIS) 17
Tantalum methylisobutyl ketone Spectrophotometry (AAS) 64
Selenium diethyldithiocarbamate Spectrophotometry (AAS) 65
Tellurium methylisobutyl ketone Spectrophotometry (AAS) 66
Chromium methylisobutyl ketone Activation analysis 67
8-hydroxyquinoline Spectrophotometry (VIS) 17
Molybdenum N-benzoyl-N-phenyl Polarography 68
hydroxylamine
8-hydroxyquinoline Spectrophotometry (VIS) 17
Tungsten methylisobutyl ketone Spectrophotometry (AAS) 69
Manganese tetramethylene-dithiocarbamate Spectrophotometry (AAS) 70
8-hydroxyquinoline Spectrophotometry (VIS) 17
Technetium tetraphenylarsonium chloride Spectrophotometry (VIS) 71
Rhenium ALIQUAT 336 Activation analysis 72
Iron acetylacetone Polarography 33
diethyldithiocarbamate Spectrophotometry (VIS) 17
Cobalt 1-nitroso-2-naphthol Isotope dilution 73
diethyldithiocarbamate Spectrophotometry (VIS) 17
Nickel dimethylglyoxime Polarography 74
diethyldithiocarbamate Spectrophotometry (VIS) 17
thenoyltrifluoroacetone Spectrophotometry (VIS) 17
Platinum diphenyldithourea Spectrophotometry (VIS) 74
diethyldithiocarbamate Spectrophotometry (VIS) 17
8-hydroxyquinoline Spectrophotometry (VIS) 17
Table 13.1 (Continued )
(Continued )
Copyright © 2004 by Taylor & Francis Group, LLC

13.5 SOLVENT EXTRACTION–BASED MATERIALSFOR ANALYTICAL APPLICATIONS
13.5.1 Solvent-Impregnated Resins
In the last decade, the development of new impregnated materials with che-lating and complexing properties has acquired great importance. These mate-rials are prepared principally by the simple immobilization of complexingorganic reagents by adsorption onto conventional macroporous polymericsupports (polar and nonpolar). They provide two important advantages overconventional ion exchange resins: the possibility of selecting the functionalgroup to be immobilized and the facility for continuous column operation.
Such macromolecular resins containing an extractant within the latticeof the polymer were developed to bridge the gap between the two techniquesof solvent extraction and ion exchange and are roughly classified intoextractant-impregnated sorbents and Levextrel resins [12]. The former areprepared by soaking a polymeric resin in a diluent containing the extractant,then evaporating the diluent (dry impregnation method) or retaining thediluent (wet method). Levextrel resins are prepared by adding an extractantto the mixture of styrene monomers during bead polymerization with divi-nylbenzene. This method has increased in importance mainly because of itsadaptability to preconcentration, separation, and/or determination of ana-lytes. Additionally, they could be used in continuous-flow systems and insolid phase spectrophotometry by using chemical reactions that occur atinterfaces (e.g., solid/liquid or gas/solid). Furthermore, most of the analytescould be analyzed directly on the solid matrix using X-ray spectrometry,neutron activation analysis, molecular absorption, fluorescence spectros-copy, or isotopic dilution methods. Alternatively, analytes may be elutedfrom the column and the analysis completed on the solution. In this context,atomic absorption (AAS) or inductively coupled plasma spectroscopy (ICP)are mainly used.
Element Extractant Analytical technique Ref.
Palladium diphenyldithourea Spectrophotometry (VIS) 74
diethyldithiocarbamate Spectrophotometry (VIS) 17
8-hydroxyquinoline Spectrophotometry (VIS) 17
Rhodium diphenyldithourea Spectrophotometry (VIS) 74
8-hydroxyquinoline Spectrophotometry (VIS) 17
thenoyltrifluoroacetone Spectrophotometry (VIS)
Ruthenium 8-hydroxyquinoline Spectrophotometry (VIS) 17
Table 13.1 (Continued )
Copyright © 2004 by Taylor & Francis Group, LLC

The use of impregnated resins in the preconcentration and separationof trace metal ions provides the following advantages:
� The active part of the resin (complexing ligand) can be selected to becompatible with the nature of the metal ion and the matrix of thesample, and with the analytical procedure to be applied.
� The impregnation procedures of the complexing molecules are simple.� Their structure and composition could be compatible with integrated
detection systems, when used in solid phase spectroscopic measure-ments.
13.5.1.1 Solid-Phase Spectrophotometry Applications
Solid-phase spectrophotometry (SPS) is a technique based on the precon-centration of the species of interest onto a solid, aided by complexants orother reagents, and subsequent measurement of the spectrophotometricproperties of the species in the solid phase [75]. Depending on the spectro-photometric responses of the analytes or analyte complexes, several proce-dures based on absorbance and fluorescence measurements have beendeveloped. In the first case, the absorbance of a resin containing the analytefixed as a colored chromogenic species is measured directly. In the secondcase, solid phase fluorimetry (SPF), the diffuse reflected fluorescence, ismeasured. Most procedures using color or fluorescence measurement arebased on the addition to the sample solution of a resin impregnated with ahighly specific chromogenic agent for the analyte.
Ion exchanger colorimetry has been used as a sensitive and rapidmethod for vanadium analysis by immobilization of 2[2-(3-5-dibromopyri-dyl)azo]-5-dimethylaminobenzoic acid onto an ion exchanger resin AG1X2[75]. Solid phase fluorimetry can be useful for the analysis of very dilutesolutions in water analysis or trace metal determination; thus a chelating8-(benzene-sulfonamido)quinoline, immobilized on Amberlite XAD2 sup-port, has been used for the spectrofluorimetric determination of Zn(II) andCd(II) [76].
13.5.1.2 Applications for Fiber Optic Chemical Sensors
The development of chemical sensors based on optical measurements hasgrown steadily in importance during the last decade. While a large variety ofdevices are possible, they share a common feature in multiple applications,i.e., an immobilized reagent phase that changes its optical properties uponinteraction with an analyte on either a continuous or reusable basis. Systemsin which chelating liquid extractants are immobilized onto solid polymericsupports have been used for chemical sensing. Particular attention has beengiven to fiber-optic devices for measuring and controlling metal ions andorganic compounds in aqueous media. The applications of such devices
Copyright © 2004 by Taylor & Francis Group, LLC

have covered areas such as environmental applications, industrial processcontrol, and biomedical and clinical applications. Small sensors based onimmobilization of acid-base indicators such as Bromothymol Blue, Bro-mophenol Blue, Bromocresol Purple, Phenolphtalein, Phenol Red, Chloro-phenol Red Alizarin, on nonionic macroporous supports, Amberlite XAD-2and Amberlite XAD-4, have been developed and used for pH measurements[77]. These fiber-optic probes provide advantages over conventional elec-trodes in safety, reliability, applicability, and cost. A sensor based on per-ylene dibutyrate adsorbed onto Amberlite XAD4 has been characterized insome depth [78]. Fiber optic sensors, particularly fluorescent sensors, havebecome the object of considerable interest among researchers in recentyears. Their performance is based on the change in fluorescent properties oforganic reagents immobilized on a solid matrix upon contact with solutionsof metals in a continuous system.
13.5.2 Liquid Membranes in Analytical Chemistry
The use of liquid membranes in analytical applications has increased in thelast 20 years. As is described extensively elsewhere (Chapter 15), a liquidmembrane consists of a water-immiscible organic solvent that includes asolvent extraction extractant, often with a diluent and phase modifier, im-pregnated in a microporous hydrophobic polymeric support and placedbetween two aqueous phases. One of these aqueous phases (donor phase)contains the analyte to be transported through the membrane to the second(acceptor) phase. The possibility of incorporating different specific reagentsin the liquid membranes allows the separation of the analyte from the matrixto be improved and thus to achieve higher selectivity.
Solvents used in liquid membranes should have special characteristicssuch as low aqueous solubility, as a thin film of solvent is in contact withlarge volumes of aqueous solutions, and low viscosity to provide large dif-fusion coefficients in the liquid membrane. Furthermore, the analyte shouldhave large partition coefficients between the donor and the membrane phaseto give good extraction recovery and, at the same time, interfering sub-stances in the sample should have low partition coefficients for efficientcleanup.
Two configurations of liquid membranes are mainly used in analyticalapplications: flat sheet liquid membranes that give acceptable extractionefficiencies and enriched sample volumes down to 10–15 mL, and hollowfiber liquid membranes that allow smaller enriched sample volumes. Flatsheet liquid membrane devices consist of two identical blocks, rectangular orcircular in shape, made of chemically inert and mechanically rigid material(PTFE, PVDF, titanium) in which channels are machined so that when
Copyright © 2004 by Taylor & Francis Group, LLC

assembled the channels face each other. The channels are about 0.10–0.25mm deep, 1.5mm wide, and differ in length from 15 cm to 250 cm toprovide volumes from 12 mL to 1000 mL. In the smallest devices the channelscan be U-shaped grooves, while in other separators they are arranged inspirals with the feed inlet on the periphery and the outlet in the center(Fig. 13.3). The impregnated membrane, which is prepared by soaking the
Fig. 13.3 Schematic diagram of two different membrane units. (a) Membrane separator
unit composed of two machined blocks of PTFE or Ti (A), and PTFE membrane (B),
impregnated with stationary liquid. (b) Membrane unit. The PTFE membrane is placed
between the two blocks made of titanium. The two channels (donar and acceptor) that are
formed have a nominal volume of 12 mL.
Copyright © 2004 by Taylor & Francis Group, LLC

support in the organic phase, is clamped tightly between the planar surfacesof the two blocks. Such devices can be coupled to chromatographic col-umns, but are too large for on-line connection to packed capillary liquidchromatography or capillary electrophoresis. To decrease the volume whilepreserving the enrichment efficiency requires shallower channels with thepossibility of clogging problems. In such cases, porous hollow fiber modulesas supports for the liquid membrane can be used. The hollow fiber modulemay have only one fiber of a microporous polymer about 15mm long withan internal diameter of 300–500 mm giving a lumen volume for the acceptorphase of 1.9 mL and annular donor volume of approximately 0.5 mL.
13.5.2.1 Applications of Liquid Membranes inthe Analysis of Selected Samples
The most frequently used pretreatment methods for extraction and enrich-ment of analytes are liquid–liquid solvent extraction and solid-phaseextraction (SPE). Liquid–liquid solvent extraction often gives a good cleanupfrom the matrix. It allows, by incorporating different specific reagents,improvement of the separation of the analyte from the sample. However,liquid–liquid solvent extraction has some drawbacks. It is laborious anddifficult to automate and connect on-line to analytical instruments. Inaddition, large amounts of organic solvents should be avoided for environ-mental and health reasons. Supported liquid membranes (SLM) are anattractive alternative based on the efficient cleanup of liquid–liquid extrac-tion, using small amounts of organic solvents and avoiding the possibility ofemulsion formation. Using appropriate carriers, the SLM technique offersvery selective extraction of analytes in very complex samples. Furthermore,preconcentration is often required in trace analysis to improve detectionlimits and this can be also achieved using liquid membranes [79–81] with thepossibility of obtaining over 100 times enrichment of heavy metal ions as wellas various organic pollutants.
The most important features of liquid membranes are that they offerhighly selective extraction, efficient enrichment of analytes from the matrixin only one step, and the possibility of automated interfacing to differentanalytical instruments such as liquid chromatography, gas chromatography,capillary zone electrophoresis, UV spectrophotometry, atomic absorptionspectrometry, and mass spectrometry [82].
13.5.2.1a Application in Cleanup Procedures
Many analyses of organic compounds in liquid samples require selectivecleanup and concentration. Direct on-line coupling of sample preparation tothe analytical instrumentation minimizes sample handling and therebythe risk for contamination or loss of analyte. Also, on-line coupling makes
Copyright © 2004 by Taylor & Francis Group, LLC

automation of the process possible, resulting in more reproducible andeconomical analysis. Membrane extraction techniques are then well suited toautomated interfacing with various separation techniques (chromatography,capillary electrophoresis) as well as with various detection techniques suchas UV-VIS and flow-through sensors.
1. Liquid membrane sample cleanup coupled to gas–liquid chromatog-raphy. Several types of analysis including environmental [83–85] and bio-logical samples [86–88] that need both cleanup and concentration prior tochromatographic determination can be advantageously pretreated by liquidmembranes. Thus on-line combination of supported liquid membraneextraction in a hollow fiber configuration and column liquid chromatog-raphy with a phenol oxidase-based biosensor as a selective detector has beenused for the determination of phenols in human plasma. The phenols areselectively extracted into a porous PTFE membrane impregnated with awater-immiscible organic solvent [89]. Also a liquid membrane in a minia-turized hollow fiber module coupled on-line to packed capillary liquidchromatography enables the use of very small volumes and has been used todetermine amines in plasma using 6-undecanone as extractant.
2. Liquid membrane sample cleanup coupled to capillary zone electro-phoresis. Capillary zone electrophoresis (CZE) is a technique that can beused for determination of a great variety of analytes and it is especiallysuitable when only small sample volumes are available and high separationpower is needed. Biological samples are difficult to analyze by CZE due totheir complexity and the low concentration of analytes. Thus, before CZEdetermination, a cleanup procedure is necessary to eliminate the interferingmatrix. On the other hand, to improve the detection limit of CZE, a pre-concentration step is needed [90]. The use of a liquid membrane of 6-undecanone in a PTFE support has been used successfully as a prior stepbefore CZE determination of bambuterol in human plasma to obtain a highdegree of cleanup from the plasma and thus avoid adsorption problems inthe CZE capillary [91]. The samples were concentrated more than 1000times, allowing the detection limit to be lowered about 400 times. A hollowfiber miniaturized supported liquid membrane can be used as sample pre-treatment for on-line connection to CZE for determining basic drugs inhuman plasma [92]. The analyte is extracted from the outside of the hollowfiber (feed phase) through the liquid membrane containing the organicsolvent into the strip phase, which flows through the fiber lumen and canthen be injected into the CZE capillary.
13.5.2.1b Application to Enrichment Procedures
1. Liquid membrane enrichment coupled to mass spectrometry. Membraneintroduction mass spectrometry (MIMS) is an established method of sample
Copyright © 2004 by Taylor & Francis Group, LLC

analysis that couples rapid introduction via a semipermeable membrane withthe sensitivity and specificity of a mass spectrometer. Membranes are chosento enrich the analyte concentration in the sample stream entering the massspectrometer while rejecting the bulk of the mobile phase.
The membranes used are typically composed of cross-linked siliconesand are suitable for on-line monitoring of volatile organic and inorganiccompounds [93–94]. An alternative material is microporous PTFE, whichhas more rapid responses as well as lower selectivities and higher fluxes of themobile phase compared to nonporous silicone membranes. More recently,developments in membrane introduction systems include the use of liquidmembranes composed, for example, of a polyphenyl ether diffusion pumpfluid [95–96]. This membrane has the advantage that it can take any desirableanalyte and the selectivity can be modified using appropriate reagents.
2. Liquid membrane enrichment coupled on-line with ion chromatog-raphy. Low molecular mass carboxylic acids in low concentrations in air orsoil samples can be determined by ion chromatography coupled on-line to aselective enrichment system consisting of a supported liquid membrane,impregnated with tri-n-octylphosphine oxide in di-n-hexyl ether [97–98]. Thesystem allows the determination of these carboxylic acids at micromolarlevels in the presence of interfering ions such as nitrite, chloride, sulfate,iron, and aluminum.
3. Liquid membrane enrichment coupled on-line with atomic absorptionspectrophotometry. Metal ions can be readily determined by atomic absorp-tion spectrometry. Nevertheless, preconcentration is sometimes required andsupported liquid membranes can be used as an attractive alternative to otherpretreatment methods such as liquid–liquid extraction [99–101]. The trans-port of the metal species across the liquid membrane is generally performedby carriers in the membrane such as alkylphosphorous acids, long-chainalkylamines, or chelating reagents. These carriers react with metal ions togive neutral species that are soluble in nonpolar solvents and diffuse acrossthe membrane. In the case of cationic metal species, cationic exchangerextractants or chelating extractants are used frequently as carriers. In suchsystems, the metal ions are transported from the aqueous donor solution tothe acceptor phase and protons are countertransported from the acceptorto the donor phase. The driving force for the process is the pH gradientbetween the donor and acceptor phases and this allows the metal ions to betransported against their concentration gradient with the result that the metalions concentrate in the acceptor phase.
In the case of metal ions present as anionic complexes in the donorphase, solvating or ion-pairing extractants can be used as carriers. Here themetal ions and counterions are cotransported across the membrane fromthe donor to the acceptor phase. By using a complexing or reducing agent in
Copyright © 2004 by Taylor & Francis Group, LLC

the acceptor phase, it is possible to back-extract the metal ions into theacceptor phase.
Metal ions such Cu2+, Cd2+, and Pb2+ can be preconcentratedfrom water samples using liquid membranes containing 40% w/w of di-2-ethylhexylphosphoric acid in kerosene diluent in a PTFE support. Theliquid membrane can be coupled on-line to an atomic absorption spectrom-eter and has been shown to be stable for at least 200 h with extractionefficiencies over 80%, and enrichment factors of 15 can be obtained. Aliquid membrane has also been used for sample cleanup and enrichment oflead in urine samples prior to determination by atomic absorption spec-trometry [100]. The experimental setup for metal enrichment is shown inFig. 13.4. Lead was enriched 200 times from urine [80] and severalmetals were enriched 200 times from natural waters [88]. Using hollow fiber
Fig. 13.4 Schematic setup for a membrane-based metal enrichment system.
Copyright © 2004 by Taylor & Francis Group, LLC

geometry and crown ethers in the membrane, enrichment factors up to 3000have been obtained for lead [102].
Other applications of supported liquid membranes have been relatedto metal speciation. For example, recently a system for chromium speciationhas been developed based on the selective extraction and enrichment ofanionic Cr(VI) and cationic Cr(III) species in two SLM units connected inseries. Aliquat 336 and DEHPA were used respectively as carriers for thetwo species and graphite furnace atomic absorption spectrometry used forfinal metal determination. With this process, it was possible to determinechromium in its different oxidation states [103].
13.5.3 Micelles in Analytical Chemistry
Another of the new techniques for extractive preconcentration, separation,and/or purification of metal chelates, biomaterials, and organic compoundsis based on the use of surfactant micellar systems.
Surface-active agents aggregate in aqueous solutions to form micellesif the concentration in aqueous solutions exceeds the critical micelle con-centration (CMC). Dilute aqueous solutions of certain surfactant micelles,when the conditions (i.e., temperature, pressure, and electrolyte concentra-tion) of the solution are changed, have the ability to separate into twoisotropic liquid phases: a surfactant-rich phase with a small amount of water(surfactant phase or coacervate phase) and a phase containing an almostmicelle-free dilute aqueous solution. This separation is reversible so that onchanging the conditions, e.g., cooling, the two separated phases merge toform a clear solution once again.
This phenomenon can be exploited for separation and concentrationof solutes. If one solute has certain affinity for the micellar entity in solutionthen, by altering the conditions of the solution to ensure separation of themicellar solution into two phases, it is possible to separate and concentratethe solute in the surfactant-rich phase. This technique is known as cloudpoint extraction (CPE) or micelle-mediated extraction (ME). The ratio ofthe concentrations of the solute in the surfactant-rich phase to that in thedilute phase can exceed 500 with phase volume ratios exceeding 20, whichindicates the high efficiency of this technique. Moreover, the surfactant-richphase is compatible with the micellar and aqueous-organic mobile phases inliquid chromatography and thus facilitates the determination of chemicalspecies by different analytical methods [104].
The most common surfactants for analytical applications are nonionic(polyoxyethylene glycol monoethers, polyoxyethylene methyl-n-alkyl ethers,t-octylphenoxy polyoxyethylene ethers, and polyoxyethylene sorbitan esters
Copyright © 2004 by Taylor & Francis Group, LLC

of fatty acids) that demonstrate cloud point behavior with increasing solutiontemperature, and zwitterionic surfactants (ammonioethylsulfates, ammo-niopropylsulfates, ammoniopropanesulfonates, phosphobetaine, dimethyl-alkylphosphine oxides) that show cloud point behavior on decreasingsolution temperature. Thus, cloud point temperature depends on the struc-ture of the surfactant and its concentration and range from �0.5C to 120C[105,106]. In a homologous series of polyoxyethylated surfactants, thecloud point temperature increases with the hydrocarbon chain length andincreasing length of the oxyethylene chain. At a constant oxyethylene con-tent in the surfactant molecule, the cloud point temperature is lowered bydecreasing the molecular mass of the surfactant and by branching of thehydrophobic group.
The most important advantage of cloud point extraction is that onlysmall amounts of nonionic or zwitterionic surfactants are required andconsequently the procedure is less costly and more environmentally benignthan other conventional extraction techniques such as liquid–liquid extrac-tion and solid–liquid extraction [107,108]. Moreover, CPE offers the pos-sibility of combining extraction and preconcentration in one step.
13.5.3.1 Experimental Protocols
Operation procedures are performed by adding a small volume of a con-centrated nonionic or zwitterionic surfactant solution to an aqueous sample(50–100 cm3) containing the analyte, taking into account that the final sur-factant concentration must be greater than its CMC value so that micelles arepresent in solution. The analyte, depending on its affinity to the micelles, isincorporated into the micellar aggregates in solution. The solution is heated(in the case of nonionic surfactants) or cooled (with zwitterionic surfactants)until the cloud point temperature is reached and the solution is allowed tosettle (settling temperature) in a thermostatted bath set at a temperatureabove or below that of the cloud point (for nonionic and zwitterionic sur-factants respectively) until the phases separate. As the density of both phasesin some cases is quite similar, centrifugation is often recommended to facil-itate the physical separation. The analyte is concentrated in the surfactant-rich phase in a small volume (50–400 mL) [105,106]. Figure 13.5 shows thesteps involved in CPE prior to analysis.
The surfactant selected for CPE technique should not have too high acloud point temperature. In practice, it is possible to obtain almost anydesired temperature by choosing an appropriate mixture of surfactants, ascloud point temperatures of mixtures of surfactants are intermediatebetween those of the two pure surfactants, or by the choice of an appro-priate additive (i.e., salts, alcohols, organic compounds) [105].
Copyright © 2004 by Taylor & Francis Group, LLC

13.5.3.2 Applications of Cloud Point Extraction to theAnalysis of Selected Samples
Cloud point extraction has been applied to the separation and pre-concentration of analytes including metal ions, pesticides, fungicides, andproteins from different matrices prior to the determination of the analyte bytechniques such as atomic absorption, gas chromatography, high perfor-mance liquid chromatography, capillary zone electrophoresis, etc.
1. Cloud point extraction of metal ions. The use of cloud pointextraction as a separation technique was first introduced by Watanabe forthe extraction of metal ions forming sparingly water soluble complexes[109]. Since then, the technique has been applied successfully to the ex-traction of metal chelates for spectrophotometric, atomic absorption, orflow injection analysis of trace metals in a variety of samples [105–107,110].Other metal complexes such as AuCl4
� or thiocyanato-metal complexes canbe extracted directly using nonionic surfactants such as polyoxyethylene
Fig. 13.5 Steps involved in cloud point extraction (CPE) prior to HPLC, GC, and CE
analysis.
Copyright © 2004 by Taylor & Francis Group, LLC

nonyl phenyl ether (PONPE) or Triton X prior to their determination byICP or visible spectrometry [111,112]. The main advantages of cloud pointextraction of metal ions include the simplicity of the extraction procedureand the possibility of obtaining high preconcentration factors ranging from10 to 100 allowing the development of analytical methods for determiningmetal ions at very low concentrations. For example, Pd(II) can be deter-mined in a surfactant phase of Triton X-100 with coproporphyrin III as acomplexing agent in a procedure based on phosphorescence at room tem-perature with detection limits of 20 nmol dm�3. Some parameters for thecloud point extraction of metals with different surfactant micelles are givenin Table 13.2 [105,107].
2. Cloud point extraction from biological and clinical samples. The mostfrequent use of CPE is for the separation and purification of biologicalanalytes, principally proteins. In this way, the cloud point technique hasbeen used as an effective tool to isolate and purify proteins when combinedwith chromatographic separations. Most of the applications deal with theseparation of hydrophobic from hydrophilic proteins, with the hydrophobicproteins having more affinity for the surfactant-rich phase, and the hydro-philic proteins remaining in the dilute aqueous phase. The separation ofbiomaterials and clinical analytes by CPE has been described [105,106,113].
3. Cloud point extraction of environmental samples. More recently, CPEhas been used for sample preparation and preconcentration of organic ana-lytes such as pesticides [114,115], herbicides, polycyclic aromatic hydro-carbons (PAH) [116], polychlorinated biphenyls (PCBs) [117], and phenols[118] in environmental samples prior to their determination. The compat-ibility of the surfactant-rich phase from CPE with micellar or conventionalhydroorganic mobile phases allows subsequent determination of the analyteby thin layer chromatography, HPLC [119,120], micellar electrokineticcapillary chromatography, or CZE [121]. Cloud point extraction is a rapid,simple, sensitive, and efficient sample pretreatment for trace environmentalanalysis and offers some advantages over conventional liquid–liquid ex-traction technology in terms of enhanced detection limits from the largepreconcentration factors, elimination of analyte losses during evaporation ofsolvents used in liquid–liquid extraction, and elimination of toxic solvents[107].
13.5.4 Ion-Selective Electrodes
An important advance in ion-selective electrodes (ISEs) and related systemswas based on the concept of polymeric liquid membranes developed byEisenman [122]. The principle of this approach was to incorporate anorganic compound as the ionophore into a polyvinyl chloride membrane
Copyright © 2004 by Taylor & Francis Group, LLC

together with an appropriate plasticizer and additive to provide the mem-brane with the properties of a liquid phase. Ionophores are lipophilic,electron-rich complexing agents capable of reversibly binding ions andtransporting them across organic membranes, and the ultimate performanceof such devices depends strongly on the choice of ionophore. The mode of
Table 13.2 Summary of Cloud Point Extractions of Metals Chelates Using Nonionic
Surfactants Micelles
Metal ion Ligand Nonionic surfactant Experimental conditions
pH; CFa, %Eb
Ni(II) TANc Triton X-100 pH 7.0 (phosphate); CF = 30
PAN Triton X-100 pH 5–6
Zn(II) PAN PONPE-7.5 pH 10 (carbonate); CF = 40
QADI PONPE-7.5 pH 9; NH3; CF = 40
Ni(II), Zn(II), Cd(II) PAMP PONPE-7.5
Au(III) HCl PONPE-7.5 HCl; %E > 95
Ni(II), Cd(II), Cu(II) PAMP PONPE-7.5 pH 5.6
Ni(II) PAN OPd pH 6.0; CF = 15–25
Transition metal ions TAN PONPE-7.5
Fe(III), Ni(II) TAC Triton X-100
U(VI) PAN Triton X-114 pH 9.2; %E= 98
U(VI), Zr(IV) Arsenazo Tween 40e pH 3; %E > 96
Cu(II), Zn(II), Fe(III) Thiocyanate PONPE-7.5 %E= 72.5–96.8
Er(III) CMAP PONPE-7.5 CF = 20
Gd(III) CMAP PONPE-7.5 CF = 3.3; %E= 99.88
Cd(II) PAN Triton X-114 CF = 60
Ni(II), Zn(II) PAN Triton X-114
Ru(III) Thiocyanate Triton X-110 CF = 5–10
Au(III) HCl PONPE-10f %E > 90
Ga(III) HCl PONPE-7.5f %E & 90
Ag(I), Au(III) DDTP Triton X-114f CF = 9–130
Cu(II) LIX54 Igepal CO-630f
aConcentration factor.bPercent extracted.cAbbreviations for ligands: CMAP: 2-(3,5-dichloro-2-pyridylazo)-5-dimethylaminophenol; DDTP:
o,o-diethyldithiophosphoric acid; LIX54: dodecylbenzoylacetone; PAN: 1-(2-pyridylazo)-2-naphthol;
QADI: 2-(8-quinolazo)-4,5-dipheylbenzimidazole; PAMP: 2-(2-pyridylazo)-5-methylphenol; PAP: 2-
(2-pyridylazo)-phenol; TAC: 2-(2-thiazoylazo)4-methylphenol; TAN: 1-(2- thiazoylazo)-2-naphthol.dOP surfactants refer to (polyethyleneglycol octylphenyl ethers).eIn this extraction, the concentrated surfactant-rich phase was a solid rather than a liquid.fAbbreviations for surfactants: Igepal CO-630: nonylphenoxypoly(ethylenoxy)ethanol; PONPE-7.5:
polyoxyethylene(7.5)nonylphenyl ether; PONPE-10: polyoxyethylene(10)nonylphenyl ether; TRI-
TON X: t-octylphenoxypolyoxyethylene ether.
Copyright © 2004 by Taylor & Francis Group, LLC

action of these electrodes is therefore a reversible ion exchange processaccompanied by diffusion and migration effects.
Potentiometric sensors, such as ion-selective electrodes, ion-selectivemicroelectrodes, and ion-selective field effect transistors (ISFET) are fre-quently used in analytical systems. Moreover, the recently introduced ion-selective optodes based on absorbance or fluorescence measurements provideadditional sensors for a broad range of monitoring applications [123,124]. Inthese systems, the active constituent of the liquid membrane is an ion-pairingor complexing agent that is selective for a limited number of specific ions.This reagent is dissolved in a low-polarity organic solvent, which must alsohave a low vapor pressure to minimize losses through evaporation, highviscosity to prevent rapid loss during flow across the membranes, and lowsolubility in the aqueous sample solution with which it comes into contact.The complexing reagents are subdivided into two groups:
1. Electrically charged ligands, often called liquid ion exchangers, whichare ionizable organic molecules of high molecular weight
2. Electrically neutral complexing agents, ionophores, that are capable ofenveloping metal ions in a ‘‘pocket’’ of oxygen or nitrogen ligands andcan serve as selective extractants for cations
The construction of a liquid membrane electrode is rather similar tothat of the glass electrode, in that it requires an internal reference electrode.In addition, a solid support is required into which the active liquid reagentsare incorporated. This support may be a porous polyvinyl chloride (PVC)plug, a porous polymeric film, or a commercial membrane. Many differentdesigns have been suggested to solve the problem of interposing the liquidmembrane between the aqueous solutions. The support prevents leakage ofthe organic solvent into the aqueous solution and the same time maintainsefficient contact with the analyte solution. Two of these designs are illus-trated in Fig. 13.6.
The electromotive force (emf ) of liquid membrane electrodes dependson the activity of the ions in solution and their performance is similar inprinciple to that of the glass electrode. To characterize the behavior of liquidmembrane electrodes, the linearity of the emf measurements vs. concentra-tion of a certain ion in solution is checked. Additional performance data arethe Nernstian slope of the linear range and the pH range over which thepotential of the electrode is constant.
Eisenman [122] pioneered the development of this type of electrodeand created the theory on which the measurements are based, and investi-gated the selectivity of certain membranes. Equally significant were thecontributions of Buek, Durst, Worf [126], Koryta [127], and Simon, whichwere compiled into an important monograph [128].
Copyright © 2004 by Taylor & Francis Group, LLC

The ion selectivity of a membrane can be established by measuring thepotential difference between two identical reference electrodes. One elec-trode is immersed in the specimen solution, the other in a reference solution,and the membrane is interposed between them. The composition of solution2 is constant, and, if both solutions contain monovalent ions, the ion-exchange process can be described as follows:
JþðaqÞ þ IþðmembraneÞ() JþðmembraneÞ þ IþðaqÞ (13.5)
and the potential difference is given by:
E ¼ E0 þ 0:059 log fai þ Kijajg (13.6)
where E0 is a constant related to the reference electrodes and the referencesolution, ai and aj are the activities of ions i and j in the specimen solution,and Kij is the selectivity constant of the membrane.
Inspection of Eq. (13.6) shows that the selectivity behavior of a liquidmembrane is specified completely by the membrane selectivity constant, Kij,which in turn is dependent on the equilibrium constant of Eq. (13.5) and onthe mobility of ions i and j within the membrane. For the case in which themembrane consists of a neutral carrier [129], the exchange reaction can bepresented as:
JþðaqÞ þ ISþðmembraneÞ() JSþðmembraneÞ þ IþðaqÞ (13.7)
Fig. 13.6 Schematic diagrams of two liquid membrane electrodes: (a) a commercial
Onion electrode; (b) an improved version developed by Szczepaniac and Oleksy [125].
Copyright © 2004 by Taylor & Francis Group, LLC

If the ligand (neutral carrier) is capable of completely enveloping thecations, the terms Kij and E0 of the membrane depend only on the ratio ofthe complex stability constants K�js=K
�is of the ions with the ionophore.
Liquid membrane electrodes are not capable of being specific for onlyone ion in solution. There is always some interference from other ions insolution with the given analyte. The selectivity coefficient provides anindication of the ability of an electrode to measure a particular ion in thepresence of another ion. The response of an electrode to an interfering ioncan be included in the Nernstian equation:
E ¼ E 00 þ 0:059=z0 log faA þ KABaBz0=zg (13.8)
where:
E00 =a constant emf, including that of the reference electrode and thestandard potential of the ion being measured
aA=activity of species A with charge Z0
aB=activity of interfering ion, B, with charge ZKA/B= selectivity constant of the electrode for A over B
13.5.4.1 Liquid Ion Exchangers
Liquid ion exchange carriers must again be subdivided into cation- andanion-specific ion exchangers. For cations, extensive use is made of highmolecular mass organic anions, such as sulfonates, carboxylates, thio-carboxylates, and phosphonates. An important example of this membranetype is the calcium-selective electrode, in which the liquid membrane consistsof long-chain alkylphosphates [130–131]. These compounds are dissolved indi-n-octylphenylphosphate, which enhances the selectivity for calcium rela-tive to magnesium and the other alkaline earth metals. A mercury(II) ion-selective electrode uses a thiophosphonyl derivative of thiobenzamide as thecomplexing agent [125]. For anions, stable ion pairs are formed with largecationic organic molecules, such as substituted organophenanthroline nickelor iron compounds dissolved in decanol.
Of special interest is the nitrate electrode, which has found manyapplications in quantitative analysis of nitrates in biological fluids andagricultural products. A nitrate-selective electrode [132] based on a tributyl-octadecylphosphonium ligand is also selective for perrhenate and per-chlorate ions.
13.5.4.2 Neutral Carrier-Based Cation-SelectiveElectrodes
A number of polyether molecules have been described that form membranesselective for four monovalent and for six divalent cations [129,133,134].Inspection of Table 13.3 shows that two classes of ligands can be distinguished:
Copyright © 2004 by Taylor & Francis Group, LLC

the first is the macrotetrolides (antibiotics), such as nonactin and dinactin,which have eight oxygen atoms in a flexible ring and are specific forammonium ions. Another antibiotic that has assumed considerable impor-tance is valinomycin, which has a high selectivity for potassium across themembrane of living cells. The second class of ligands is composed of syntheticcrown ethers, some acrylic polyethers, and cryptands. Figure 13.7 demon-strates how different geometric arrangements of these polyethers providecompounds that systematically bind ions, from Li+ to Pb2+.
Five liquid membrane electrodes (Table 13.3) are now commerciallyavailable and have found wide application in the testing of electrolytes inbiological and technological systems. All five electrodes perform well in theconcentration range over which the Nernstian slope is maintained, i.e., from10�1–10�5mol dm�3. These electrodes to a certain extent have replaced inboth chemical and clinical laboratories the more traditional instrumentalmethods of analysis, such as flame photometry and atomic absorptionspectrometry. There are, of course, many more liquid membrane electrodes,but the availability of satisfactory solid electrodes has greatly restricted theirdevelopment and practical application.
13.6 SOLVENT EXTRACTION–BASED TECHNIQUES
The term chromatography now embraces a variety of processes that arebased on the differential distribution of the components in a chemicalmixture between two phases. The difference between extraction processesinvolving a single equilibrium of two bulk phases and chromatography is
Table 13.3 Some Commercial Ion Exchange Electrodes
Ion Ligand Area of application Refs.
Li+ Trioctylphosphine oxide + Lithium in blood serum 136
neutral carrier and pharmaceuticals
K+ Valinomycin dissolved in Potassium in feldspar, urine, 137
diphenyl ether blood serum, seawater, vegetables
NHþ4 Nonactin or dinactin Activity of nitrate reductase, 138
ammonium in mineral water,
fruit juice, beer, urine, sewage water
Ca2+ Phosphates and Protein binding studies, calcium in 131
phosphonates sewage water, mineral water, blood
serum, biological fluid
NO�3 Tributyl octadecyl- Nitrate in agricultural products, soils, 132
phosphonium nitrate foods
Copyright © 2004 by Taylor & Francis Group, LLC

that, in the latter technique, species are separated, not by discrete extractionsteps, but by continuous equilibration between two phases, one that isstationary and the other mobile. The same fundamental laws of phaseequilibrium apply to both, extraction and chromatography. In principle, thelatter is a multiple-extraction process in which the mobile phase movescontinuously over the fixed phase in a chromatographic column.
13.6.1 Liquid–Liquid Partition Chromatography
The liquid–liquid partition chromatography (LLPC) method involves astationary liquid phase that is more or less immobilized on a solid support,and a mobile liquid phase. The analyte is therefore distributed between thetwo liquid phases. In conventional LLPC systems, the stationary liquidphase is usually a polar solvent and the mobile liquid phase is an essentiallywater-immiscible organic solvent. On the other hand, in reversed-phasechromatography (RPC), the stationary liquid is usually a hydrophobic
Fig. 13.7 Structures of cation-selective carriers. (From Ref. 133.)
Copyright © 2004 by Taylor & Francis Group, LLC
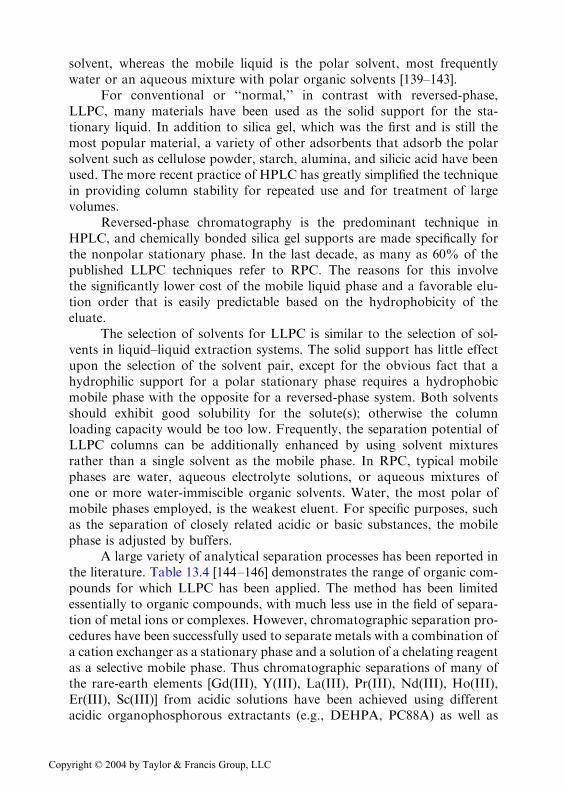
solvent, whereas the mobile liquid is the polar solvent, most frequentlywater or an aqueous mixture with polar organic solvents [139–143].
For conventional or ‘‘normal,’’ in contrast with reversed-phase,LLPC, many materials have been used as the solid support for the sta-tionary liquid. In addition to silica gel, which was the first and is still themost popular material, a variety of other adsorbents that adsorb the polarsolvent such as cellulose powder, starch, alumina, and silicic acid have beenused. The more recent practice of HPLC has greatly simplified the techniquein providing column stability for repeated use and for treatment of largevolumes.
Reversed-phase chromatography is the predominant technique inHPLC, and chemically bonded silica gel supports are made specifically forthe nonpolar stationary phase. In the last decade, as many as 60% of thepublished LLPC techniques refer to RPC. The reasons for this involvethe significantly lower cost of the mobile liquid phase and a favorable elu-tion order that is easily predictable based on the hydrophobicity of theeluate.
The selection of solvents for LLPC is similar to the selection of sol-vents in liquid–liquid extraction systems. The solid support has little effectupon the selection of the solvent pair, except for the obvious fact that ahydrophilic support for a polar stationary phase requires a hydrophobicmobile phase with the opposite for a reversed-phase system. Both solventsshould exhibit good solubility for the solute(s); otherwise the columnloading capacity would be too low. Frequently, the separation potential ofLLPC columns can be additionally enhanced by using solvent mixturesrather than a single solvent as the mobile phase. In RPC, typical mobilephases are water, aqueous electrolyte solutions, or aqueous mixtures ofone or more water-immiscible organic solvents. Water, the most polar ofmobile phases employed, is the weakest eluent. For specific purposes, suchas the separation of closely related acidic or basic substances, the mobilephase is adjusted by buffers.
A large variety of analytical separation processes has been reported inthe literature. Table 13.4 [144–146] demonstrates the range of organic com-pounds for which LLPC has been applied. The method has been limitedessentially to organic compounds, with much less use in the field of separa-tion of metal ions or complexes. However, chromatographic separation pro-cedures have been successfully used to separate metals with a combination ofa cation exchanger as a stationary phase and a solution of a chelating reagentas a selective mobile phase. Thus chromatographic separations of many ofthe rare-earth elements [Gd(III), Y(III), La(III), Pr(III), Nd(III), Ho(III),Er(III), Sc(III)] from acidic solutions have been achieved using differentacidic organophosphorous extractants (e.g., DEHPA, PC88A) as well as
Copyright © 2004 by Taylor & Francis Group, LLC

neutral organophosphorous extractants (e.g., TOPO, TBP) immobilizedonto polymer beads as stationary phases [150,151]. Similar approaches havebeen used in environmental control and determination of transuraniumelements (TUE), especially Pu(IV) and Am(III), in various natural samples[152,153]. Among numerous sorbents for radioanalytical purposes, a newtype of solid sorbent (TVEX) based on introducing an extractant into thepolymer matrix during synthesis has been developed [141,142]. The behaviorof uranium, plutonium, and transplutonium elements (TPE) using TVEXswith TBP, TOPO, DEHPA, and TOA, etc., has been studied. More recently,at the Argonne National Laboratory in the United States [156,157], a newfamily of impregnated resins based on the impregnation of Amberlite XAD7with highly specific reagents for actinide analysis in environmental andbiological samples has been intensively studied.
13.6.2 Supercritical Fluid Extraction
Supercritical fluids were soon found to be highly efficient extraction media,chiefly because of their high solvating power, their low viscosities (inter-mediate between a gas and a liquid), and their low surface tensions thatenable their penetration deep into the extraction matrix. Supercritical fluidextraction (SFE) used in isolation is generally not selective enough to sepa-rate specific solutes from the matrix without further cleanup or resolutionfrom coextracted species prior to qualitative and quantitative analysis.Consequently, for analytical applications, SFE is usually used in combinationwith chromatographic techniques to improve the overall selectivity in theisolation of specific solutes. The combined use of SFE with chromatographictechniques is quite recent.
Table 13.4 Some Applications of Liquid–Liquid Partition Chromatography (LLPC)
Eluate Support Stationary phase Mobile phase
Aromatics alumina water n-heptane
Aliphatic alcohols silica acids water chloroform-CCl4Fatty acids celite aq. sulphuric acid butanol-chloroform
Glycols celite water butanol-chloroform
Phenols silicic acid water isooctane
Amino acids silica gel water dichloromethane
Steroids silica acids methanol/water benzene-chloroform
Alkaloids silica gel water acetonitrile-water
Urine silica gel aq. sulphuric acid dichloromethane
Antibiotics silica gel water dichloromethane
Pesticides silica gel water n-heptane
Copyright © 2004 by Taylor & Francis Group, LLC

The application of SFE for the preparation of samples in the analyticallaboratory has received serious attention as a sample preparation step forextracting analytes of interest from a bulk matrix prior to their determi-nation by other analytical methods including chromatographic, spectro-metric, radiochemical, and gravimetric techniques.
Much of the current interest in using analytical-scale SFE systemscomes from the need to replace conventional liquid solvent extractionmethods with sample preparation methods that are faster, more efficient,have better potential for automation, and also reduce the need for largevolumes of potentially hazardous liquid solvents. The need for alternativeextraction methods is emphasized by current efforts to reduce the use ofmethylene chloride as an extraction fluid for environmental sample pre-paration [158]. The potential for applying SFE to a wide variety of envi-ronmental and biological samples for both qualitative and quantitativeanalyses is widely described in reviews [159–161] and the references therein.Analytical-scale SFE is most often applied to relatively small samples (e.g.,several grams or less).
A good solvent for extraction should be selective so that it dissolvesthe desired analytes to a greater degree than other constituents in the samplematrix. It should be unreactive and stable, preferably nontoxic and from aneconomic point of view noncorrosive to equipment and inexpensive to buy.Many of these requirements are met by supercritical fluids such as carbondioxide.
13.6.2.1 Off-Line and On-Line SFE
Analytical-scale SFE can be divided into off-line and on-line techniques.Off-line SFE refers to any method where the analytes are extracted usingSFE and collected in a device independent of the chromatograph or othermeasurement instrument. On-line SF techniques use direct transfer of theextracted analytes to the analytical instrument, most frequently a chromato-graph. While the development of such on-line SFE methods of analysis hasgreat potential for eventual automation and for enhancing method sensi-tivities [159–161], the great majority of analytical SFE systems described usesome form of off-line SFE followed by conventional chromatographic orspectroscopic analysis.
To perform off-line SFE, only the SFE step must be successful, and theextract can be analyzed at leisure by a variety of methods. The final productof an off-line SFE experiment typically consists of the extract dissolved in afew milliliters of liquid solvent, a form that is directly compatible withconventional chromatographic injectors. In contrast, the successful perfor-mance of on-line SFE requires that the SFE step, the coupling step (i.e., the
Copyright © 2004 by Taylor & Francis Group, LLC

transfer and collection of extracted analytes from the SFE to the chromato-graphic system), and the final chromatographic conditions be understoodand controlled. With many on-line approaches the sample extract is com-mitted to a single analysis, and the extract is not available for analysis byother methods. While off-line SFE has the advantages of simplicity andavailability of commercial instrumentation, and provides extracts that canbe analyzed by several instrumental methods, on-line techniques havegreater potential for enhanced sensitivity and automation.
Off-line SFE is conceptually a simple experiment to perform andrequires only relatively basic instrumentation. The instrumental componentsnecessary include a source of fluid, most often CO2 or CO2 with an organicmodifier, a means of pressurizing the fluid, an extraction cell, a method ofcontrolling the extraction cell temperature, a device to depressurize thesupercritical fluid (flow restrictor), and a device for collecting the extractedanalytes.
13.6.2.2 On-Line Coupling SFE withAnalytical Techniques
On-line supercritical fluid extraction/GC methods combine the ability ofliquid solvent extraction to extract efficiently a broad range of analytes withthe ability of gas-phase extraction methods to rapidly and efficiently transferthe extracted analytes to the gas chromatograph. The characteristics ofsupercritical fluids make them ideal for the development of on-line sampleextraction/gas chromatographic (SFE-GC) techniques. SFE has the abilityto extract many analytes from a variety of matrices with recoveries that rivalliquid solvent extraction, but with much shorter extraction times. Addi-tionally, since most supercritical fluids are converted to the gas phase upondepressurization to ambient conditions, SFE has the potential to introduceextracted analytes to the GC in the gas phase. As shown in Fig. 13.8, therequired instrumentation to perform direct coupling SFE-GC includes suit-able transfer lines and a conventional gas chromatograph [162,163].
Finally, supercritical fluid chromatography, in which a supercriticalfluid is used as the mobile phase, was introduced by Klesper [164–166].SFE directly coupled to SFC provides an extremely powerful analytical tool.The efficient, fast and selective extraction capabilities of supercritical fluidsallows quantitative extraction and direct transfer of the selected solutesof interest to be accomplished to the column, often without the need forfurther sample treatment or cleanup. Extraction selectivity is usuallyachieved by adjusting the pressure of the supercritical fluid at constanttemperature or, less often, by changing the temperature of the supercriticalfluid at constant pressure. SFE coupled with packed column SFC has found
Copyright © 2004 by Taylor & Francis Group, LLC

Fig. 13.8 Schematic diagram of a simple SFE-GC system showing all the required
components. (Several manufacturers supply suitable components and specific suppliers are
listed only for the reader’s convenience.) Components are: (A) SFE grade extraction fluid
source; (B) 1.5mm o.d. stainless steel tubing (0.77mm or smaller i.d.); (C) shut-off valves
(SSI model 02–120 or equivalent, Supelco, Bellefonte, PA); (D) SFE pump; (E) SFE cell
heater; (F) approx. 0.5m long coil of 1.5mm stainless steel tubing for fluid preheater; (G)
1.5mm�1.5mm tubing union (e.g., Parker or Swagelok brand); (H) finger-tight con-
nectors (e.g. Slip-Free connectors from Keystone Scientific Bellefonte, PA, USA); (I) SFE
cell; (J) restrictor connector ferrule (Supelco M2-A, Bellefonte, PA) which is used to
replace the stainless steel ferrule in the outlet end of the tubing union ‘G’; (K) 15–30 mmi.d. fused silica tubing restrictor (Polymicro Technologies, Phoenix, AZ); (L) GC injection
port.
596 Aguilar et al.
Copyright © 2004 by Taylor & Francis Group, LLC

many applications in the last decade, particularly in connection with thedetermination of food compounds, drug residues, herbicide and pesticideresidues, and polymer additives.
13.6.3 Solvent Extraction in ContinuousFlow Injection Analysis
13.6.3.1 Fundamental of Flow Injection Analysis
Flow injection analysis is based on the injection of a liquid sample into acontinuously flowing liquid carrier stream, where it is usually made to reactto give reaction products that may be detected. FIA offers the possibilityin an on-line manifold of sample handling including separation, pre-concentration, masking and color reaction, and even microwave dissolution,all of which can be readily automated. The most common advantages ofFIA include reduced manpower cost of laboratory operations, increasedsample throughput, improved precision of results, reduced sample volumes,and the elimination of many interferences. Fully automated flow injectionanalysers are based on spectrophotometric detection but are readily adaptedas sample preparation units for atomic spectrometric techniques. Flowinjection as a sample introduction technique has been discussed previously,whereas here its full potential is briefly surveyed. In addition to a few bookson FIA [168,169], several critical reviews of FIA methods for FAAS, GFAAS, and ICP-AES methods have been published [170,171].
As noted earlier, the essence of flow injection is the controlled physicaldispersion of an injected liquid sample into a continuous flowing unseg-mented liquid carrier stream that may contain a suitable reagent to produce atransient reproducible detector response proportional to the analyte con-centration. Thus, a typical FIA system consists of the following components:
1. A propulsion unit, usually a peristaltic pump, that produces a flow ofone or several solutions (streams), either containing a dissolved reagentor merely acting as a carrier
2. An injection system whose function is the reproducible introduction ofan accurately measured sample volume into the flow without stopping it
3. A mixing (reaction) unit4. A flow cell for photometry detection
The simplest flow injection arrangement is the single-line configurationshown in Fig. 13.9. As can be seen, the carrier stream is propelled by a pumpthrough a narrow conduit to an injector, then via the reaction manifold tothe detector and finally to waste. Each injection yields a single peak at thedetector, with the height, area, or width proportional to the analyte con-centration.
Copyright © 2004 by Taylor & Francis Group, LLC
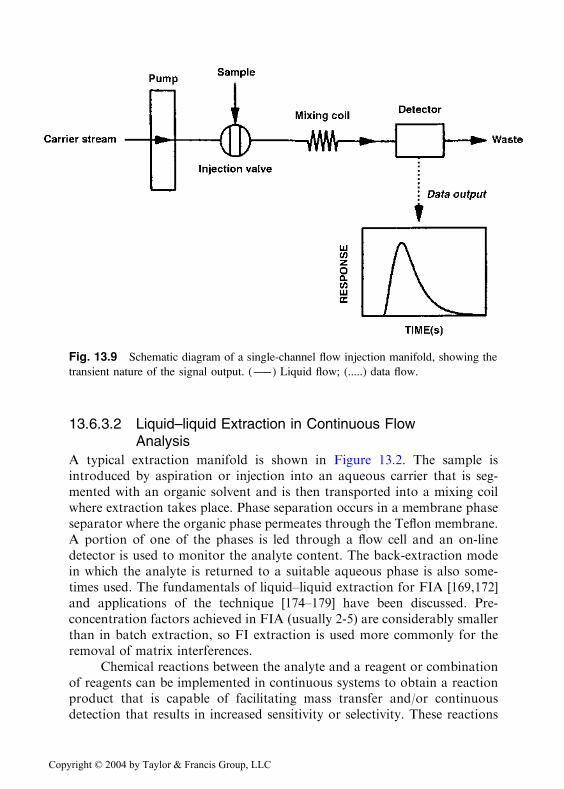
13.6.3.2 Liquid–liquid Extraction in Continuous FlowAnalysis
A typical extraction manifold is shown in Figure 13.2. The sample isintroduced by aspiration or injection into an aqueous carrier that is seg-mented with an organic solvent and is then transported into a mixing coilwhere extraction takes place. Phase separation occurs in a membrane phaseseparator where the organic phase permeates through the Teflon membrane.A portion of one of the phases is led through a flow cell and an on-linedetector is used to monitor the analyte content. The back-extraction modein which the analyte is returned to a suitable aqueous phase is also some-times used. The fundamentals of liquid–liquid extraction for FIA [169,172]and applications of the technique [174–179] have been discussed. Pre-concentration factors achieved in FIA (usually 2-5) are considerably smallerthan in batch extraction, so FI extraction is used more commonly for theremoval of matrix interferences.
Chemical reactions between the analyte and a reagent or combinationof reagents can be implemented in continuous systems to obtain a reactionproduct that is capable of facilitating mass transfer and/or continuousdetection that results in increased sensitivity or selectivity. These reactions
Fig. 13.9 Schematic diagram of a single-channel flow injection manifold, showing the
transient nature of the signal output. (--) Liquid flow; (.....) data flow.
Copyright © 2004 by Taylor & Francis Group, LLC

could take place in different locations of the schemes defined previously, forexample:
1. In a coil after the sample is merged with a reagent stream.2. In the solvent segmenter when it is necessary to avoid precipitation of
the extractable compound in the aqueous phase before it reaches thecontinuous extractor (SS).
3. In the extraction coil (EC), when the extraction reaction is based on theformation of metal chelates and the ligand is dissolved in the organicsolvent. Here the reaction and the transfer of the chelate take placesimultaneously.
4. In a coil located after the extractor using a reagent stream that is mergedprior to the detector with the phase containing the analyte.
The derivatizing reactions used in these systems are not substantiallydifferent from those described in classical analytical determinations. Themost common are ion-pair formation reactions, where the analyte forms anion pair directly, e.g., determination of anionic surfactants by using ethylviolet or methylene blue, and the determination of codeine with picric acidand enalapril with bromothymol blue; or after reacting with a reagent toform a bulkier, charged species e.g., tetracyanatocobaltate or phosphomo-lybdate. Metal cations are typically transformed into extractable metal che-lates by using such common ligands as described in section 13.4.1 (e.g., oxine,dithizone, dimethylglyoxime, etc.). Some of the most important applicationsof the technique are in the determination of surfactants in waters, quinizarinin hydrocarbons, amines in pharmaceuticals, and drugs in urine [177].
Typical FIA manifolds are shown in Fig. 13.10 with two generalalternatives depending on whether injection takes place before or after thecontinuous extractor device. The most common situation is when priorinjection of the sample take place. Figure 13.10(a) depicts a manifold for thedetermination of vitamin B1 in pharmaceuticals [178], based on the oxida-tion of thiamine to thiochrome in a carrier of potassium ferricyanide in abasic medium (NaOH). The thiochrome is continuously extracted into achloroform stream and the fluorescence of the organic phase is measuredcontinuously.
Continuous multiextraction could be applied for the separation anddetermination of carcinogenic polynuclear aromatic compounds (Fig. 13.10b)in crude-oil-ash residues [179]. The ash sample dissolved in a cyclohexanestream merges with a DMSO stream in the first solvent segmenter. Afterpassing through a glass extraction coil, the DMSO phase is mixed with awater stream of cyclohexane segmented with the aqueous DMSO phase.After passing through a Teflon extraction coil, the organic phase is carriedthrough the flow cell of a fluorimeter.
Copyright © 2004 by Taylor & Francis Group, LLC

Fig. 13.10 Typical FIA extraction manifolds. Injection in front of the extractor com-
ponents: (a) simple; (b) multiextraction; and (c) injection after the extraction has been
carried out. (Based on systems from Refs. 178, 179.)
Copyright © 2004 by Taylor & Francis Group, LLC

FIA can be used for the determination of traces of perchlorate inserum and urine by formation of an ion pair with cuproine-type chelates(CuL2
+) and subsequent extraction with 6-methylpicolinealdehyde azinedissolved in MIBK (Fig. 13.10c). The sample is continuously added to thesystem and is mixed with another stream containing Cu(II) and ascorbicacid. This mixture merges with the organic solution in the solvent seg-menter. The organic phase stream containing the ion pair emerging from aT-type separator fills the loop of an injector valve. This volume is theninjected into a water carrier in which copper is continuously determined andhence perchlorate (0.5 to 5 ppb) may be indirectly determined [179].
ACRONYM LIST
AAS atomic absorption spectrophotometryASE accelerated solvent extractionCCFA completely continuous flow analysisCMC critical micelle concentrationCPE cloud point extractionCZE capillary zone electrophoresisFAAS furnace atomic absorption spectrophotometryFIA flow injection analysisGC gas chromatographyGC-MS mass chromatographyGF-AAS graphite furnace atomic absorption spectrophotometryHPLC high-performance liquid chromatographyICP inductively coupled plasma spectrophotometryICP-AES inductively coupled plasma with atomic emission spectrophoto-
metryISE ion-selective electrodeISFET ion-selective field effect transistorsLLPC liquid–liquid partition chromatographyME micelle-mediated extractionMIMS membrane introduction mass spectrometryPAH polynuclear aromatic hydrocarbonPCDF polychlorinated dibenzofuranPCB polychlorinated biphenylPF preconcentration factorPONPE polyoxyethylene nonyl phenyl etherPTFE polytetrafluoroethenePVC porous polyvinyl chlorideREE rare earth elements
Copyright © 2004 by Taylor & Francis Group, LLC
REFERENCES
1. Morrison, M. G.; Freiser, H. Solvent Extraction in Analytical Chemistry; John
Wiley and Sons; New York, 1957.
2. Stary, J. The Solvent Extraction of Metal Chelates; Pergamon Press: Oxford,
1964.
3. De, A. K.; Khopkar, S. M.; Chalmers, R. A. Solvent Extraction of Metals;
Van Nostrand Reinhold: London, 1970.
4. Alders, L. Liquid-Liquid Extraction; Elsevier: New York, 1995.
5. Zolotov, Y. A.; Bodnya, V. A.; Zagruzina, A. N. CRC Crit. Rev. Anal.
Chem., 1982, 14, 2.
6. Keller, R.; Mermet, J. M.; Otto, M.; Widmer, H. M. Eds. Analytical Chem-
istry; Wiley-VCH, Verlag GmbH: Weinheim, Germany, 1998; p. 25.
7. Valcarcel, M. Liquid-Liquid Extraction in Continuous Flow Analysis. In
Developments in Solvent Extraction; S. Alegret, Ed., Ellis Horwood Series in
Analytical Chemistry: West Sussex, UK, 1988; p. 135.
RPC reversed-phase chromatographySC synergistic coefficientSFA segmented flow analysisSFE supercritical fluid extractionSLM supported liquid membranesSPE solid-phase extractionSPS solid-phase spectroscopyTHM trihalomethaneTUE transuranium elementsUFA unsegmented flow analysis
ALAMINE 336 mixture of trioctyl- and tridecylamineALIQUAT 336 methylated (quaternized) alamine 336DEHPA di-(2-ethylhexyl)phosphoric acidMIBK methylisobutylketoneDMSO dimethylsulfoxidePAN 1-(2-pyridylazo)-2-naphtholPAR 4-(2-pyridylazo)resorcinolPC88A 2-ethylhexylphosphonic acid 2-ethylhexyl esterOxine 8-hydroxyquinolineSDVB styrene divinylbenzeneTBP tributylphosphateTOA tri-n-octylamineTOPO trioctylphosphine oxideThioxine 8-quinolinethiol
Copyright © 2004 by Taylor & Francis Group, LLC

8. Preconcentration of Trace Elements. In Comprehensive Analytical Chemistry;
Lobinsky, L., Ed.; Vol. XXV, Elsevier: Amsterdam, 1992.
9. Aguilar, M. Graphical Treatment of Liquid-Liquid Equilibrium Data. In
Developments in Solvent Extraction, Ed. Alegret, S. Ed., Ellis Horwood Series
in Analytical Chemistry, West Sussex, UK, 1988; p. 87.
10. Tagushi, S.; Goto, K. Pre-Concentration Techniques for Trace Elements; Al-
fassi, Z. B.; Wai, C. M. Ed.; CRC Press: Boca Raton, Florida, 1989; p. 31.
11. Torre, M.; Marina, M. L. Crit. Rev. in Anal. Chem., 1994, 24, 327.
12. Cortina, J. L.; Warshawsky, A. Ion Exchange and Solvent Extraction, Mar-
insky, J. A.; Marcus, Y. Ed.; Marcel Dekker: New York, Vol. 13, 1996; 195.
13. Karasek, F. W.; Clement, R. E.; Sweetman, J. A. Anal. Chem., 1981, 53(9),
1051A.
14. Webb, R. C. EPA Report EPA-660/475-003, June 1975.
15. Bowers, W. D.; Parsons, M. L.; Clement, R. E.; Kasarek, F. W. J. Chroma-
togr., 1981, 207, 203.
16. Lobinski, R.; Marczenko, Z. Eds., Spectrochemical Trace Analysis for Metals
and Metalloids. In Comprehensive Analytical Chemistry, Volume XXX; Else-
vier: Amsterdam, Volume XXX, 1996.
17. Cheng, K. L.; Ueno, K.; Imamura,T. Handbook of Organic Analytical Re-
agents; CRC Press: Boca Raton, Florida, 1982.
18. Townshend, A.; Burns, D. T.; Guibault, G. G.; Lobinski, R.; Marczenko, Z.;
Newman, E. J.; Onishi, H. Eds. Dictionary of Organic Analytical Reagents;
Chapman and Hall: London, 1993.
19. Lobinski, R.; Marczenko, Z. CRC Crit. Rev. Anal. Chem., 1992, 23, 55.
20. Kaiyanaraman, S.; Khopkar, S. M. Anal. Chim. Acta., 1975, 78, 231.
21. Murata, M.; Omatsu, M.; Mushimoto, S. X-ray Spectrom., 1984, 13, 83.
22. Maguar, B.; Lobanov, F. L. Talanta, 1973, 20, 55.
23. Cresser, M. Solvent Extraction in Flame Spectroscopic Analysis; Butterworths:
London 1978.
24. Anders, U.; Mailer, D. Z. Anal. Chem., 1976, 278, 203.
25. Cordis, V.; Sigartau, G.; Pop, J. Z. Anal. Chem., 1976, 279, 355.
26. Fujinaga, T.; Nagaosa, Y. Chem. Lett., 1978, 6, 587.
27. Keller, C. Radiochemistry; Ellis Horwood Series in Physical Chemistry: Chi-
chester, UK, 1988.
28. Zorov, N. B.; Gocci,T. F.; Winefordner, J. D. Talanta, 1976, 23, 455.
29. Zolotov, Y A.; Petrukhin, O. M.; Nagy, V. Y.; Volodarskii, L. B. Anal.Chim.
Acta, 1980, 115, 1.
30. Zolotov, Y. A.; Kuzmin, N. M.; Petrukhin, O. M.; Spivakov, B. Y. Anal.
Chim. Acta, 1986, 180, 137.
31. Guter, G. A.; Hammond, G. S. J. Amer. Chem. Soc., 1956, 78, 5166.
32. Fix, R. C.; Irvine, J. W. Jr., Lab. Nucl. Sci. Prog. Rep., May 1956.
33. Shigematsu, T.; Kudo, K. J. Radioanal. Chem., 1978, 45, 373.
34. Hoentsch, E.; Flachowsky, J. Isotopenpraxis, 1977, 13, 432.
35. Iqbal, M.; Ejaz, M.; Chaudhri, S. A.; Zamiruddin, A. J. Radioanal. Chem.,
1978, 42, 335.
Copyright © 2004 by Taylor & Francis Group, LLC

36. Jauniaux, M.; De Meyer, M.; Lejeune, W.; Levert, J. M. Bull. Soc. Chim.
Belg., 1975, 84, 565.
37. Luke, C. L. Anal. Chem., 1956, 28, 1443.
38. Marczenko, Z.; Kalowska, H. Chem. Anal. (Pol.), 1976, 21, 183.
39. Shtefak, M.; Kirsh, M.; Rais, I. Zh. Anal. Khim., 1976, 32, 1364.
40. Takeda, Y.; Suzuki, S.; Ohyagi, Y.; Chem. Lett., 1978, 12, 1377.
41. Roberts, A. H. C.; Turner, M. A.; Syers, T. K. Analyst, 1976, 101, 574.
42. Karisson, R.; Gorton, L. Talanta, 1976, 23, 672.
43. Carry, J.; Menon, M. P. J. Radioanal. Chem., 1975, 34, 319.
44. Gentry, C. H. R.; Sherrington, L. G. Analyst, 1946, 71, 432.
45. Argollo, R. M.; Schilling, J. G. Anal. Chem. Acta., 1978, 96, 117.
46. Fujinaga, T.; Puri, B. K. Talanta, 1975, 22, 71.
47. Bode, H.; Z. Anal. Chem., 1955, 144, 165.
48. Kaiyanarman, S.; Khopkar, S. M. Anal. Chem., 1977, 49, 1192.
49. Charib, A.; Morris, D. F. C. Talanta, 1978, 25, 569.
50. Tomazic, B.; Branica, M. J. Radioanal. Chem., 1976, 30, 361.
51. Pollock, E. N. Anal. Chim. Acta., 1977, 88, 399.
52. Fantova, J.; Kliz, Z.; Cermakova, Z.; Suk, V. Chem. Listy, 1980, 74, 291.
53. Shimomura, S.; Sakurai, H.; Morita, I.; Mino, Y. Anal. Chem. Acta., 1978,
96, 69.
54. Steinnes, E. Radiochem. Radioanal. Lett., 1978, 33, 205.
55. Shamaev, Y. I.; Bogdanov, N. V. Zh. Anal. Khim., 1976, 31, 72.
56. Hasemann, K.; Bock, R. Z. Anal. Chem., 1985, 274, 185.
57. Huffman, E. H.; Beaufait, L. J. J. Amer. Chem. Soc., 1949, 71, 3179.
58. Wadelin, C.; Mellon, M. G. Anal. Chem., 1953, 25: 1668.
59. Fetchett, A. W.; Daughtrey, D.; Hunter, E. Anal. Chim. Acta., 1975, 79, 93.
60. Kamada, T.; Yamamoto, Y. Talanta, 1977, 24, 330.
61. Nakamura, K.; Ozawa, T. Anal. Chim. Acta., 1976, 86, 147.
62. Svehla, G.; Tolg, G. Talanta, 1976, 23, 755.
63. Lapenko, L. A.; Gibalo, I. M. Zh. Anal. Khim., 1976, 31, 481.
64. Spivakov, B. Y.; Orlova, Y. A.; Malyutina,T. M.; Kirilova, T. L. Zh. Anal.
Khim., 1979, 34, 161.
65. Kamada, T. Shiroishi, T.; Yamamoto, Y. Talanta, 1978, 25, 15.
66. Chao, T. T.; Sanzolone, R. F.; Hubert, A. E. Anal. Chim. Acta., 1978, 96, 251.
67. Kudo, K.; Shigernatsu, T.; Kobayashi, K. J. Radioanal. Chem., 1977, 36, 65.
68. Bhowal, S. K.; Umiand, E. Anal Chem., 1976, 282, 197.
69. Musil, J.; Dolezal, J. Anal. Chim. Acta, 1977, 92, 301.
70. Roberts, R. F. Anal. Chem., 1977, 49, 1861.
71. Tribalat, S.; Beydon, J. Anal. Chim. Acta., 1953, 8, 22.
72. Fujinaga, T.; Lee, H. L. Talanta, 1977, 24, 395.
73. Fujinaga, T.; Puri, B. K. Indian J. Chem., 1976, 14, 72.
74. Zolotov, Y. A.; Petrukhin, O. M.; Shevehenko, U. N.; Dunina, U. Y.; Ru-
khadze, E. G. Anal. Chim. Acta., 1978, 100, 613.
75. Matsuoka, S.; Yoshimura, K.; Waki, H. Mem. Fac. Sci. Kyushu Univ., Ser.
C., 1991, 18, 55–62.
Copyright © 2004 by Taylor & Francis Group, LLC

76. Compano, R.; Ferrer, R.; Guiteras, J.; Prat, M. D. Analyst, 1994, 119, 1225.
77. Kirkbright, G. F.; Narayanaswamy, R.; Welti, N. A. Analyst, 1984, 109, 15.
78. Narayanaswamy, R.; Sevilla, F. Anal. Chim. Acta., 1986, 189, 365.
79. Jonsson, J. A.; Mathiasson, L. Trac-Trend. Anal. Chem., 1999, 18, 318.
80. Jonsson, J. A.; Mathiasson, L. Trac-Trend. Anal. Chem., 1999, 18, 325.
81. Jonsson, J. A.; Mathiasson, L. Trac-Trend. Anal. Chem., 1992, 11, 106.
82. Audunsson, G. Anal. Chem., 1986, 58, 2714.
83. Norberg, J.; Zander, A.; Jonsson, J. A. Chromatographia, 1997, 46, 483.
84. Nilve, G.; Stebbins, R. Chromatographia, 1991, 32, 269.
85. Nilve, G.; Audunsson, G.; Jonsson, J. J. Chromatogr., 1989, 471, 151.
86. Audunsson, G. Anal. Chem., 1988, 60, 1340.
87. Lindegard, B.; Jonsson, J. A.; Mathiasson. L. J. Chromatogr., 1992, 573, 191.
88. Thordarson, E.; Palmarsdottir, S.; Mathiasson, L.; Jonsson, J. A. Anal.
Chem., 1996, 68, 2559.
89. Norberg, J.; Emneus, J.; Jonsson, J. A.; Mathiasson, L.; Burestedt, E.;
Knutsson, M.; Marko-Varga, G. J. Chromatogr. B, 1997, 701, 39.
90. Palmarsdottir, S.; Lindegard, B.; Deiningr, P.; Edholm, L. E.; Mathiasson, L.;
Jonsson, J. A. J. Cap. Electrophor., 1995, 2, 185.
91. Palmarsdottir, S.; Mathiasson, L.; Jonsson, J. A.; Edholm, L. E. J. Chro-
matogr. B, 1997, 688, 127.
92. Palmarsdottir, S.; Thordarson, E.; Edholm, L. E.; Jonson, J. A.; Mathiasson,
L. Anal. Chem., 1997, 69, 1732.
93. Bauer, S.; Solyom, D. Anal. Chem., 1994, 66, 4422.
94. Cisper, M. E.; Hembeergeer, P. H. Rapid Commun. Mass Sp., 1997, 11,
1454.
95. Johnson, R. C.; Koch, K.; Cooks, R. G. Ind. Eng. Chem. Res., 1999, 38, 343.
96. Johnson, R. C.; Koch, K.; Cooks, R. G. Anal. Chim. Acta., 1999, 395, 239.
97. Shen, Y.; Obuseng, V.; Gronberg, L.; Jonsson, J. A. J. Chromatogr. A, 1996,
725, 189.
98. Gronberg, L.; Shen, Y.; Jonsson, J. A. J. Chromatogr. A, 1993, 655, 207.
99. Djane, N. K.; Bergdahl, I. A.; Ndung’u, K.; Schutz, A.; Johansson, G.; Ma-
thiasson, L. Analyst, 1997, 122, 1073.
100. Djane, K. N.; Ndung’u, F.; Malcus, G.; Johansson, G.; Mathiasson, L. Fre-
senius J. Anal. Chem., 1997, 358, 822.
101. Cox, J. A.; Bhatnagar, A. Talanta, 1990, 37, 1037.
102. Parthasarathy, N.; Pelletier, M.; Buffle, J. Anal. Chim. Acta., 1997, 350, 183.
103. Djane, N. K.; Ndung’u, K.; Johnson, K.; Sartz, H.; Tornstrom, T.; Ma-
thiasson, L. Talanta, 1999, 48, 1121.
104. Scamerhorn, J. F.; Harwell, J. H. Surfactant-Based Separations Processes;
Marcel Dekker: New York, 1989; p. 139.
105. Hinze, W. L.; Pramauro, E. Criti. Rev. Anal. Chem., 1993, 24, 133.
106. Carabias-Martınez, R.; Rodrıguez-Gonzalo, E.; Moreno-Cordero, B.; Perez-
Pavon, J. L.; Garcia-Pinto, C.; Fernandez Laespada, E. J. Chromatogr. A,
2000, 902, 195.
107. Quina, F. H.; Hinze, W. L. Ind. Eng. Chem. Res., 1999, 38, 4150.
Copyright © 2004 by Taylor & Francis Group, LLC

108. Huddleston, J. G.; Willauer, H. D.; Griffin, S. T.; Rogers, R. D. Ind. Eng.
Chem. Res., 1999, 38, 2523.
109. Watanabe, H.; Tanaka, H. Talanta, 1978, 25, 585.
110. Garcıa Pinto, C.; Perez Pavon, J. L.; Moreno Cordero, B.; Romero Beato, E.;
Garcıa Sanchez, S. J. Anal. Atomic Spectrometry, 1996, 11, 37.
111. Akita, S.; Rovira, M.; Sastre, A. M.; Takeuchi, H. Sep. Sci. Technol., 1998,
33, 2159.
112. Okada, T. Anal. Chem., 1992, 64, 2138.
113. Horvath, W. J.; Huie, C. W. Talanta, 1993, 9, 1385.
114. Garcıa Pinto, C.; Perez Pavon, J. L.; Moreno Cordero, B. Anal. Chem., 1995,
67, 2606.
115. Stangl, G.; Niessner, R. Mikrochim. Acta., 1994, 113, 1.
116. Ferrer, R.; Beltran, J. L.; Guiteras, J. Anal. Chim. Acta., 1996, 330, 199.
117. Eiguren, A.; Sosa, Z.; Santana, J. J. Analyst 1999, 124, 487.
118. Calvo Seronero, L.; Fernandez Laespada, M. E.; Perez Pavon, J. L.; Moreno
Cordero, B. J. Chromatogr. A, 2000, 897, 171.
119. Eiguren, A.; Sosa, Z.; Santana, J. J. Anal. Chim. Acta., 1998, 358, 145.
120. Moreno, B.; Perez, J. L.; Garcıa, C.; Fernandez, M. E. Talanta, 1993, 40,
1703.
121. Carabias-Martınez, R.; Rodrıguez-Gonzalo, E.; Domınguez-Alvarez, J.;
Hernandez-Mendez, J. Anal. Chem., 1999, 771, 2468.
122. Eisenman, G. Ion Selective Electrodes; National Bureau of Standards (USA)
Special Publications: Washington, D.C., 1969; p. 314.
123. Janata, J.; Josowitz, M.; de Vaney, D. M. Anal. Chem., 1994, 66, 207R.
124. Camman, K.; Lemke, U.; Rohen, A.; Sander, J.; Wilken, H.; Winter, B.
Angew. Chem. 1991, 109, 519.
125. Szczepaniac, W.; Oleksy, J. Anal. Chim. Acta., 1986, 189, 237.
126. Worf, W. E. The Principles of Ion Selective Electrodes and of Membrane
Transport; Akademiai Kiado: Budapest, 1981; Elsevier: Amsterdam, 1981.
127. Koryta, J. Ion-Selective Electrodes; Cambridge University Press: London,
1975.
128. Freiser, H. Ion-Selective Electrodes in Analytical Chemistry; Plenum Press:
New York, Vol. 1, 1978.
129. Pretsch, E.; Buchi, R.; Amman, D.; Simon, W. Essays on Analytical Chem-
istry; Pergamon Press: New York, 1977.; p. 321.
130. Svehia, G. Comprehensive Analytical Chemistry; Elsevier: New York, Vol. 11,
Chap. 3, 1981; p. 346.
131. Hobby, P. C.; Moody, G. J.; Thomas, J. D. R. Analyst, 1983, 108, 581.
132. Geissler, M.; Kunze, R. Anal. Chim. Acta., 1986, 189, 245.
133. Simon, W.; Pretsch, E.; Morf, W. E.; Amman, D.; Oesch, U.; Dinten, O.
Analyst, 1984, 109, 207.
134. Simon, W.; Morf, W. E.; Meier, P. C. Struct. Bonding, 1973, 16, 113.
135. Eisenman, G. Anal. Chem., 1968, 40, 311.
136. Xie, R. Y.; Christian, G. D. Analyst, 1987, 112, 61.
137. Pioda, L. A. R.; Stankova, Y.; Simon, W. Anal. Lett., 1969, 2, 665.
Copyright © 2004 by Taylor & Francis Group, LLC

138. Scholer, R. P.; Simon, W. Chimia, 1970, 24, 372.
139. Mair, B. J. Treatise on Analytical Chemistry, Part 1, Theory and Practice;
Kolthoff, I. M.; Elving, P. J.; Sandeli, E. B. Eds., Wiley-Interscience: New
York, Vol. 3, 1961: p. 1469.
140. Pecsok, R. L.; Shields, L. D.; Cairns, T.; McWilliam, L. G.Modern Methods
of Chemical Analysis, 2nd ed.; John Wiley and Sons: New York, 1968; pp.
41–70.
141. Huber, J. F. K. Comprehensive Analytical Chemistry, eds. Wilson, C. L.;
Wilson, D. W.; Stroits, C. R. N. Elsevier: Amsterdam, Vol. 11B, 1968; p. 33.
142. Peters, D. G.; Hayes, J. M.; Hieftje, G. M. Modern Chemical Analysis;
W.B. Saunders; Philadelphia, 1976.
143. Hamilton, R. J.; Sewei, P. A. Introduction to High Performance Liquid
Chromatography; Chapman and Hall: London, 1977.
144. Snyder, L. R.; Kirkland, J. J.Modern Liquid Chromatography; John Wiley and
Sons: New York, 1974.
145. Parris, N. H. Instrumental Liquid Chromatography; Elsevier: Amsterdam, 1976.
146. Lawrence, J. F.; Frei, R. W. Chemical Derivitization in Liquid Chromato-
graphy; Elsevier: Amsterdam, 1976.
147. Horvath, C. Ed. High-Performance Liquid Chromatography; Academic Press:
New York, Vols. 1–3, 1980–1983.
148. Mulier, W. Kontakte (Merck), 1986, 3, 3.
149. Braun, R.; Ghersini, G. Extraction Chromatography; Elsevier: Amsterdam,
1975.
150. Wakui, Y.; Matsunaga, H.; Suzuki, T. M. Anal. Sci, 1988, 4, 325.
151. Muscatello, A. C.; Yarbro, S. L.; Marsh, S. F. New Separation Chemistry
Techniques for Radioactive Waste and other Specific Applications; Cecille, L.;
Casarci, M.; Pietrelli, L. Eds.; Elsevier Science Publishing: Amsterdam, 1991;
p. 88.
152. Dietz, M. L.; Horwitz, E. P.; Nelson, D. M.; Walgren, M. Health Physics
1991, 61, 871.
153. Horwitz, E. P.; Dietz, M. L.; Nelson, D. M.; La Rosa, J. J.; Fairman, W.
Anal. Chim. Acta., 1990, 238, 263.
154. Myasoedova, G. V.; Savvin, S. B. CRC Crit. Rev. Anal. Chem. 1988, 17.
155. Kremlyakova, N.; Barsukova, K. V.; Myasoedov, B. F. Radiochem. Radio-
anal. Lett., 1983, 57, 293.
156. Horwitz, E. P.; Dietz, M. L.; Fisher, D. E. Anal. Chem., 1991, 63, 522.
157. Horwitz, E. P.; Chiarizia, R.; Dietz, M. L. Solvent Extr. Ion Exch., 1992, 10,
313.
158. Westwood, S. A. Ed. Supercritical Fluid Extraction and its Use in Chromato-
graphic Sample Preparation; Blackie Academic and Professional, Chapman
and Hall: UK, 1993.
159. Veuthy, J. L.; Caude, M.; Rosset, R. Analysis, 1990, 18, 103.
160. Hawthorne, S. B.; Anal. Chem. 1990, 62, 633.
161. Vannoort, R. W.; Chervet, J. P.; Lingeman, H.; De Jong, G. J.; Brikman, A.
U. Th. J. Chromatogr., 1990, 505, 45.
Copyright © 2004 by Taylor & Francis Group, LLC

162. Hawthorne, S. B. Coupled (on-line) supercritical fluid extraction-gas chro-
matography. In Supercritical Fluid Extraction and Its Use in Chromatographic
Sample Preparation; Westwood, S. A. Ed., Blackie Academic and Profes-
sional, Chapman and Hall; UK, 1993; p. 65.
163. Hawthorne, S. B.; Miller, D. J. J. Chromatogr. Sci, 1985, 24, 258.
164. Klesper, E.; Corwin, A. H.; Turner, D. A. J. Org. Chem., 1962, 27, 700.
165. Sugiyama, K.; Saito, M.; Hondo, T.; Seda, M. J. Chromatogr. 1985, 332, 107.
166. Anderson, I. G. M. Supercritical fluid extraction coupled to packed column
supercritical fluid chromatography. In Supercritical Fluid Extraction and Its
Use in Chromatographic Sample Preparation; Westwood, S. A. Ed., Blackie
Academic and Professional, Chapman and Hall: UK, 1993; p. 112.
167. Foreman, J. K.; Stockweli, P. B. Automatic Chemical Analysis; Ellis Horwood:
Chichester, UK, 1975.
168. Foreman, J. K.; Stockweli, P. B. Topics in Automatic Chemical Analysis; Ellis
Horwood: Chichester, UK, Vol. 1, 1979.
169. Valcarecel, M.; Luque de Castro, M. D. Flow-Injection Analysis; Ellis Hor-
wood: Chichester, UK, 1987.
170. Furman, W. B. Continuous Flow Analysis: Theory and Practice; Dekker: New
York, 1976.
171. Coakley, W. A. Handbook of Automatic Analysis. Continuous Flow Techni-
ques; Dekker: New York, 1982.
172. Ruzicka, J.; Hansen, E. H. Flow-Injection Analysis; Wiley: New York, 1981.
173. Valcarcel, M.; Gallego, M. Separation techniques. In Flow Injection Atomic
Spectroscopy, Bruguera, J. L. Ed., Marcel Dekker: New York, 1989.
174. Luque de Castro, M. D.; Valcarcel, M. Trends in Analytical Chemistry, 1991,
10, 114.
175. MacLaurin, P.; Andrew, K. N.; Worsfold, P. J. Flow Injection Analysis. In
Process Analytical Chemistry, McLennan, F.; Kowalski, B. R. Eds.; Blackie
Academic and Professional: Glasgow, 1995; p. 159.
176. Valcarcel, M.; Luque de Castro, M. Non chromatographic Continuous Se-
paration Techniques; Royal Society of Chemistry: Cambridge, UK, 1990.
177. Karlberg, B.; Thelander, S. Anal. Chim. Acta., 1978, 98, 1.
178. Shelly, D. C.; Rossi, T. M.; Warner, I. M. Anal. Chem., 1982, 54, 87.
179. Gallego, M.; Valcarcel, M. Anal. Chim. Acta., 1985, 169, 161.
Copyright © 2004 by Taylor & Francis Group, LLC


