DIY Power Tools Injuries
57
Public Health Project 2010- 2011 Power Tools that don’t lend a Helping Hand Amit Anand, Nicholas Campion, James Cheshire, Thomas Haigh, James Leckenby Third Year Medical Students University of Birmingham
-
Upload
vaikunthan-rajaratnam -
Category
Documents
-
view
19 -
download
1
description
power tool injuries of the upper limb
Transcript of DIY Power Tools Injuries

Public Health Project 2010-2011
Power Tools that don’t lend a Helping Hand
Amit Anand, Nicholas Campion, James Cheshire, Thomas Haigh, James LeckenbyThird Year Medical Students
University of Birmingham
Word Count: 5317

Power Tools that don’t lend a Helping Hand 2011
Abstract
Objectives: To identify demographic and behavioural trends associated with hand injuries sustained
by power tool use, and to conduct a relevant treatment outcome analysis. We hope that our findings
will motivate further investigation into preventative measures that are specific to the identified “at
risk” groups.
Design: A cross-sectional data analysis of the Home and Leisure Accident (HASS/LASS) database
between 2000 and 2002, specifically looking at domestically sustained power tool injuries to the
hand.
Setting: The Department of Trade and Industry (DTI) selected 16 hospital A&E departments widely
representative of the UK demographic population.
Population: The data provided by DTI sampled 4131 cases of power tool injuries sustained in the
domestic setting serious enough to warrant A&E admission. This dataset was refined to only include
cases specifically looking at power tool injury to the hand, producing the final study sample of 1806
cases.
Measurements: Specially-trained HASS/LASS interviewers identified newly-admitted A&E patients
suffering from domestically sustained accidents and interviewed them using a standardised
questionnaire documenting the following details: patient age and sex, year of Injury, history of the
accident and location, body part injured and injury sustained, behaviour preceding the incident,
injury sustained and outcome following assessment at A&E.
Results:
Demographic analysis: Men sustained 89.5% of all hand related DIY power tool injuries. Most
injuries (75.4%) occurred in the 30-69 year age group. The elderly age bracket (70+ years) showed
the lowest frequency of hand injuries admitted to A&E (11.2%), but the highest proportion of injuries
requiring follow up in secondary care (44.8%, p=0.002). Altogether, 37% (p=0.002) of hand injuries
sustained across all age groups resulted in hospital care, with a further 22.8% (p=0.002) requiring
care in the community. The power tools most commonly causing injury were found to be circular
saws (28.6%) and hedge trimmers (27.4%), cumulatively accounting for the majority (56%) of hand
injuries studied. Hedge trimmers, were accountable for the majority of injuries amongst females
(56.6%) whilst circular saw accounted for the majority (30.9%) amongst males.
2
Power Tools that don’t lend a Helping Hand 2011
Injury Analysis: Circular saws and hedge trimmers accounted for 66.7% (p=0.002) of specialist care
review, and 87.7% (p=0.002) of immediate specialist attention.
Behavioural Analysis: Atypical positioning was the commonest behavioural cause (20.4%) of injury
followed by complacency (16.4%) and distraction/inattention (10.1%). Males were found to be more
complacent (16.1% in men vs. 13.3% in women), while women suffered more injuries due to
distraction and inattention (20% in women vs. 7.9% in men). Females showed better adherence to
safety measures as 0% of injuries sustained in women were due to lack of safety measures.
Complacency accounted for 17% of injuries sustained in the younger age group (p=0.015). Despite
this they were better at adhering to safety measures than their elder counterparts (0.4% in young vs
2.5% in middle aged).
Conclusion: In an economic climate lending itself to increased DIY activity, this research should be a
focus in emergency medicine. This is the only study that identifies demographic and behavioural
trends leading to hand injuries from such a broad spectrum of power tools. Injuries in the elderly
population most commonly require secondary care; a significant finding considering the healthcare
burden from an ageing population. A majority (51.4%) of hand injuries are avoidable in that they
have a behavioural root cause. Thus, implementing appropriate preventative measures will not only
significantly reduce the number of injuries presenting to A/E, but also the overall demand placed
upon the NHS.
3

Power Tools that don’t lend a Helping Hand 2011
Introduction
The great columns of Rome, the finishing touch to the Mona Lisa, the cups of tea a mother makes for
her family first thing in the morning. We might queue to take photographs, gaze in amazement or
simply smile a gentle curve of appreciation. Yet never is this directed to the miracle of normally
functioning hands, never do we recall the essential ingredient in the recipe of such marvels. Human
hands are at the core of all our accomplishments, whether they shape history or just the mood of a
single individuals day. They are indispensable to our creativity and achievements. The monuments we
build, the discoveries we make, the relationships we establish, all act as demonstrations of their
understated ability.
Twenty percent of patients attending A&E have hand injuries, equating to more than 1.36
million attendances in the UK per year [1]. The hands prove to be greatly vulnerable to injury during
Do-it-Yourself (DIY) activities due to their necessity in most tasks and their close proximity to the
hazardous components of the power tools. UK studies show that hand trauma is a consequence in
approximately a quarter of all DIY activities [2] equating to upwards of 200,000 hospital visits each
year; of which, 87,000 are specifically due to power tools [3]. These figures are likely to remain high
according to The Royal Society for the Prevention of Accidents (RoSPA), who state that the current
economic climate has led to an increase in people choosing to undertake DIY activities rather than
hiring a professional labourer.
An audit of hand injuries [4] identified serious shortcomings in service provision; stating that
treatment was often delayed by over 24 hours due to lack of available theatres (62%) and shortage
of staff (13%). The predicted increase in hand injuries and current lack of services available highlights
the importance of devising preventative measures. This is particularly relevant as a UK economic
analysis showed that costs of this kind of injury tripled between 1990 and 2000, amounting to a over
£100 million in healthcare costs in 2000 [5].
Hand trauma can have a major impact on an individual’s life. Frank et al. states that the
socioeconomic impact of these injuries is immense, explaining that patients can suffer from
significant losses in wages and potential earnings [6]. Additionally, patients are vulnerable to
psychosocial implications as the human hand is so instrumental in independence and care giving [7,
8].
It is evident that the prevention of hand injuries sustained domestically can not only have
significant benefits to an individual’s life but also to the healthcare system as a whole. For this
reason, such injury prevention should be a focus in emergency medicine. Previous preventative
4
Power Tools that don’t lend a Helping Hand 2011
strategies have already shown to be effective; however, there is a distinct lack of understanding
surrounding the behaviours leading to injury. The behavioural and demographic analysis our study
conducts establishes which specific behaviours lead to injury and the ‘at risk’ population groups. This
understanding provides another facet from which specific preventative measure can be developed.
Overview of Existing Research
Our literature review served to gain insight into current and already-documented trends in patterns
and behaviour associated with non-work related power tool hand injuries.
To achieve our objective, a PubMed search with MeSH headings ‘hand injury’ AND
‘accidents, home’ identified several American papers that demonstrated consistent views in sex and
age distributions in those acquiring domestically sustained hand injuries. Frank et al, conducted two
retrospective studies using the same patient group affected by circular-saw related injuries [6, 9].
This patient group showed an overwhelming male dominance (93%) in which the majority of cases
were in older age groups. Conn et al. also showed a male dominance (75%) in their cross-sectional
study population of finger amputation patients that presented to A&E [10]. The highest rates of
injuries in their study group had occurred between the fourth to the six decade of life (11.2-14.9
amputations per 100 000 population).
Our review showed no established pattern with regards to which hand is more commonly
injured. While Frank et al. and Bonte and Goldberg show almost uniform distribution of injuries
between the dominant and non-dominant hands [9, 11], Hoxie et al. and Hussey report higher
incidence of injuries in the non-dominant hand. [12] The pattern of digit involvement is documented
in the work of Frank et al., which is depicted in the diagram below.
5

Power Tools that don’t lend a Helping Hand 2011
The studies discussed are limited in that they only assess the pattern of injury specific to a
single power tool. To develop an understanding of trends in hand injury from a broader sample of
power tools, the terms ‘DIY,’ ‘power tools’ and ‘hand injury’ were inserted into an advanced
scholarly search engine. A British, cross sectional study by Williams and Power [13] was recovered
and cited circular saws (21%), hedge trimmers (21%) and electric drills (17%) as the power tools most
commonly associated with such injury. Although their study suggests that power tools only account
for 25% of domestically sustained hand injuries, 94.6% of these cases went on to require specialist
care, indicating the high level of healthcare provision attributed to these injuries.
There are evident limitations in the studies reviewed. Conn et al’s surveillance database, for
instance, demonstrated so much insufficiency in patient records that in a quarter of cases (25.2%)
the digits involved were not specified [10]. As their surveillance system only gathered data for finger
amputations treated in A&E, those treated in outpatient clinics were not included. Likewise, it is
difficult to have complete confidence in the results from Frank et al’s study as circular saws, in
America, have been attributed to self-inflicted harm in cases of insurance fraud [14]. Since they
included subjects with “insufficient medical documentation” and there was “negligent accident
analysis”, this limitation cannot be completely ruled out [9].
In all of these studies, there is a lack of clear insight into the behavioural components that
lead to injury. Conn et al. notes: “Studies are needed to assess how human factors… increase the
6
Figure 1: a) Distribution of injuries to one finger only; b) distribution of simultaneous injuries to two fingers; c) distribution of simultaneous injuries to three fingers
Power Tools that don’t lend a Helping Hand 2011
likelihood of injury to fingers when power tools are used.” [10] Speed attempts to address this gap in
knowledge by proposing several psychosocial factors that play a role in the way people approach DIY
tasks, including complacency and price.
Speed reports that those who lack DIY experience are more cautious in carrying out tasks,
while those with more DIY-experience tend to underestimate the difficulty of the procedure, and
show more complacency towards the recommended safety measures. Frank et al. supports this
notion, highlighting that 75% of his injured study population had more than 10 years of experience
of power tool use; 64% admitting to using their circular saws on a regular basis [6]. Only one of the
patients injured in their study group was a first-time user. In 13 cases (11%), the subject was so
complacent, that they removed the safety devices (e.g. blade guards) prior to conducting the task
[6].
Speed subsequently states that one of the triggers to engage in DIY tasks is to save on costs
involved in hiring professional labour. Frank et al. notes that this is particularly true in today’s
economic climate, where ‘circular saws, particularly the smaller and cheaper “consumer models,”
enjoy an upsurge of sales.’ In fact, 22 (19%) of the cases in their study reported that the ‘saws were
self-constructed.’ [9] Speed explains that while cheaper equipment is favoured, it is less likely to
meet the required safety standards, and thus more likely to lead to avoidable hand injury [15].
Additionally, our literature review also identified “inattention and distraction,”
“intoxication,” “and “lack of peer supervision” as other significant behavioural factors causing hand
injuries. Frank et al. described four patients (4%) that admitted that distraction may have led to
their injury, eight cases (7%) had consumed alcohol, and there was a lack of supervision in 75% of
cases [9].
While the literature shows a degree of behavioural analysis related to DIY hand injury, it is
often limited in content, and typically specific to a single power tool. We hope to address this gap in
knowledge and develop a thorough understanding of the behaviours that lead to hand injury on a
backdrop of a broad spectrum of power tools.
This research will serve to motivate further investigation into preventative measures to reduce
the occurrence of this kind of injury. A review of relevant literature assessing the effectiveness of
preventative measures shows optimistic findings. A PubMed search of the following MeSH headings:
“Accident Prevention” AND “Hand Injuries,” returned with a cohort study by Lipscomb et al. which
highlighted the importance of education, showing a 31% reduction in the incidence of hand injuries
after the subjects attended an apprenticeship education programme [16]. Frank and Ekkernkamp
highlight the effectiveness of improved engineering, reporting no reoccurrence of injury following
the modification of a faulty safety feature in a vole captive bolt device [17]. Finally, a case-crossover
7

Power Tools that don’t lend a Helping Hand 2011
study by Sorock et al demonstrates the effectiveness of appropriate enforcement of safety
equipment, reporting a 60-70% reduction in risk of laceration and puncture injury after using gloves
in an industrial setting [18].
By developing an understanding of the demographics and behaviours related to such injury,
we hope that our work will aid in developing specific preventative measures. The evident benefits in
previous prevention strategies, discussed above, justify the importance of our research.
Aims and Objectives
We hope to determine:
Demographic trends of hand injuries related to power tool use in the domestic setting.
Trends in treatment outcome related to specific power tool use.
Behavioural patterns that lead to power tool-related DIY injury
We hope that our research will motivate further investigation into preventative measures specific to
the identified ‘at risk’ groups, and their behavioural patterns.
Null Hypotheses
There is no difference in age or gender distribution of hand injuries.
No one tool is responsible for the majority of incidents.
There is no relationship between injury from a specific tool and age or gender.
There is no relationship between injury from a specific power tool and the resultant treatment
outcome.
There is not one specific behavioural pattern responsible for DIY related hand injuries.
8

Power Tools that don’t lend a Helping Hand 2011
Methods
The raw data analysed in this study was originally collected for the Department of Trade and
Industry’s (DTI) 24th Report of the Home and Leisure Accident Surveillance System (HASS/LASS), a
nationwide database recording domestically sustained injuries serious enough to warrant hospital
visitation between 2000 and 2002. This information, provided by RoSPA, is the most up-to-date data
of its kind, as the DTI ceased data collection by HASS/LASS in 2003.
The HASS/LASS Database
The dataset sampled 16 hospitals across the UK (appendix, table 1), selected on the basis
that they tended to more than 10,000 A&E cases/year, operated a 24-hour service, and took
ambulance cases. To ensure that the hospitals were widely representative, they were based in
different geographical regions (urban and rural), served different population volumes, and consisted
of different-sized A&E units.
Specially-trained HASS/LASS interviewers were allocated to the A&E units of the
participating hospitals. They identified newly-admitted patients suffering from domestically
sustained accidents and interviewed them using a standardised questionnaire (appendix,
questionnaire 1). The data was immediately entered onto a dedicated HASS/LASS computer in the
hospital, and transferred onto a central DTI database.
Each patient account on the database remained confidential, and was organised in tabular
form to include the following details:
- Patient age and sex
- Year of Injury
- History of the accident and location
- Body part injured and injury sustained
- Behaviour preceding the incident
- Mechanism of injury
- Outcome following assessment at A&E
Manipulation of Dataset
The data was first refined to only include the cases specific to our project. To do this, ‘Power Tools in
Domestic Setting’ was entered into the database search engine, allowing the exclusion of any injuries
not sustained by power tool use and occurring in non-domestic settings (appendix, table 2). This
9

Power Tools that don’t lend a Helping Hand 2011
search produced a sample of 4131 cases, which was further narrowed to a final set of 1806 cases
when refined to only include injuries specific to the hand (appendix, table 3).
To investigate the specific behaviours and power tools most commonly involved in injury, we
closely analysed the histories that were provided in the database. From this information, we were
able to add two further columns to our data set: a) the power tool involved; and b) patient
behaviour that preceded the incident. These columns were then codified (appendix, table 4) and
entered into ‘Statistical Package for the Social Sciences (SPSS)’ for statistical processing.
Similarly the treatment outcomes for each injury were codified after being categorised into
broader outcome groups for the ease of statistical analysis. Five broad categories were established
from the numerous original categories (appendix, table 5): 1) community care, 2) no treatment after
A&E visit, 3) hospital care, 4) immediate specialist attention required, and 5) unspecified. This kind of
broad categorisation was also done to make age groups: young (0-29), middle-aged (30-69), and
elderly (70+).
In some of the data analyses, we combined cases that fell into the categories ‘hospital care’
and ‘immediate specialist attention required’ into a single ‘specialist care’ group, to draw
comparisons between those cases that required secondary follow-up care, and those that did not.
Once the data was fully coded and entered into SPSS, descriptive statistics functions were
used to produce frequency tables and cross table comparisons. The chi squared test function was
used to obtain p values for our comparative data.
10

Power Tools that don’t lend a Helping Hand 2011
Results
Demographic Results
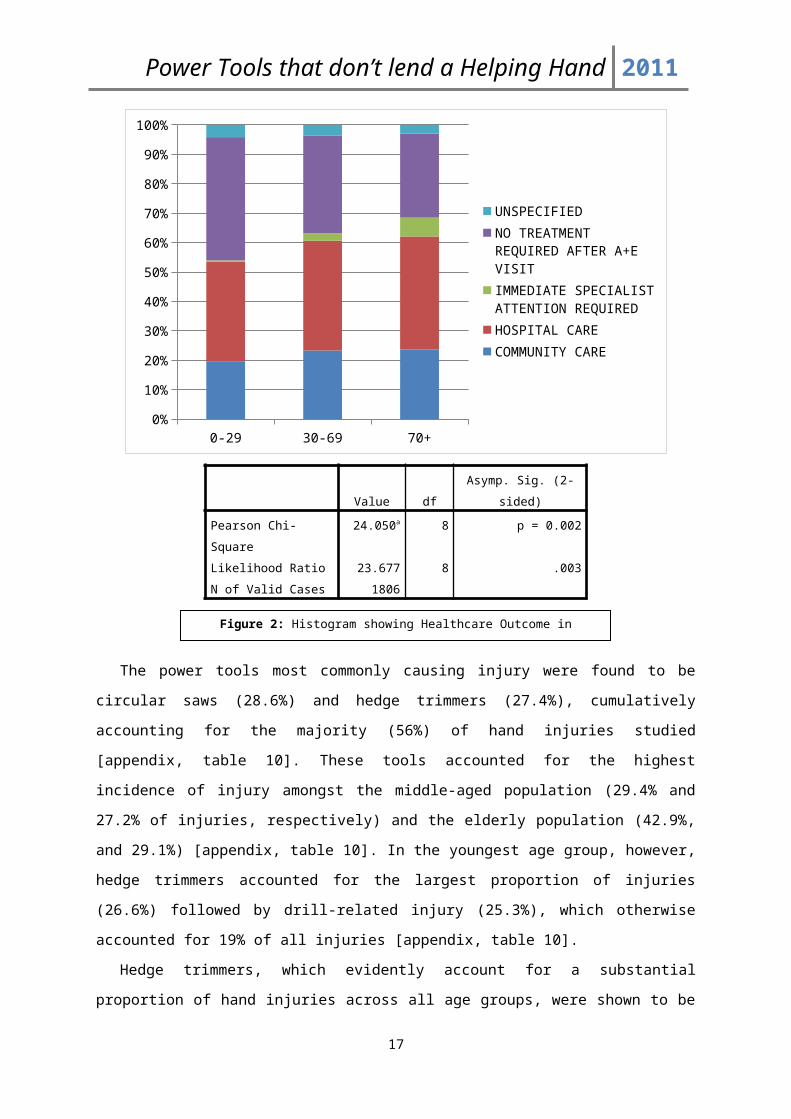
A demographic analysis revealed that men sustain 89.5% [appendix, table 6] of all hand related DIY
power tool injuries, and that most injuries (75.4%) occurred in the 30-69 year age group [appendix,
table 7]. A detailed analysis showed that, specifically, the 50-59 year age bracket [appendix, table 8]
were the most susceptible to hand injuries, accounting for 20% of all injuries sustained. The elderly
age bracket (70+ years) showed the lowest frequency of hand injuries admitted to A&E (11.2%)
[appendix, table 9], but the highest proportion of injuries requiring hospital care (38.4%, compared
to 37.3% amongst middle-aged injuries, and 34.0% amongst injuries in the young, p=0.002) , and
immediate specialist care (6.4%, compared to 2.6% and 0.4%, p=0.002) [see figure 2 below;
appendix, table 9]. Altogether, 37% (p=0.002) of hand injuries sustained across all age groups
resulted in hospital care, with a further 22.8% (p=0.002) requiring care in the community [appendix,
table 9].
0-29 30-69 70+0%
10%
20%
30%
40%
50%
60%
70%
80%
90%
100%
UNSPECIFIEDNO TREATMENT REQUIRED AFTER A+E VISITIMMEDIATE SPECIALIST ATTENTION REQUIREDHOSPITAL CARECOMMUNITY CARE
Value df Asymp. Sig. (2-sided)
Pearson Chi-Square 24.050a 8 p = 0.002
Likelihood Ratio 23.677 8 .003
N of Valid Cases 1806
11
Figure 2: Histogram showing Healthcare Outcome in relation to Patient Age
Power Tools that don’t lend a Helping Hand 2011
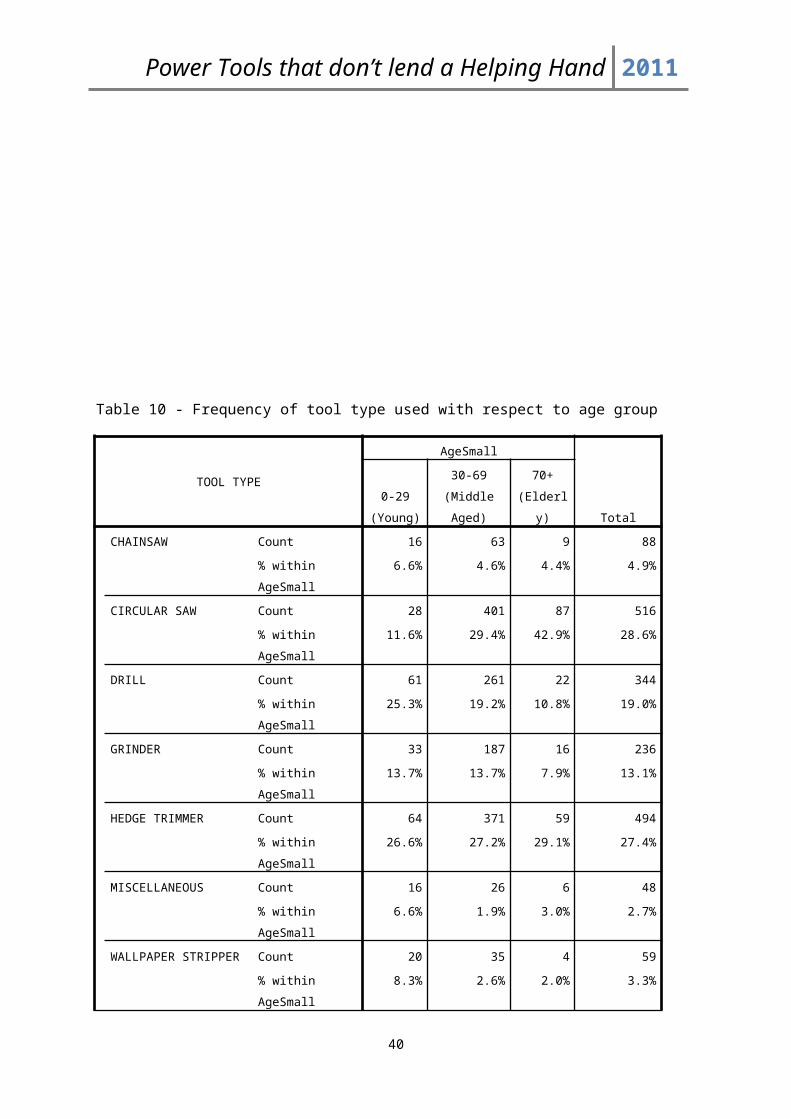
The power tools most commonly causing injury were found to be circular saws (28.6%) and
hedge trimmers (27.4%), cumulatively accounting for the majority (56%) of hand injuries studied
[appendix, table 10]. These tools accounted for the highest incidence of injury amongst the middle-
aged population (29.4% and 27.2% of injuries, respectively) and the elderly population (42.9%, and
29.1%) [appendix, table 10]. In the youngest age group, however, hedge trimmers accounted for the
largest proportion of injuries (26.6%) followed by drill-related injury (25.3%), which otherwise
accounted for 19% of all injuries [appendix, table 10].
Hedge trimmers, which evidently account for a substantial proportion of hand injuries across all
age groups, were shown to be responsible for the majority of injuries amongst females (56.6%)
[appendix, table 6]. Amongst males, however, circular saws were the commonest power tools
associated with injury (30.9%) [appendix, table 11].
Injury Results
An outcome analysis showed that circular saws and hedge trimmers accounted for 66.7% (p=0.002)
of specialist care review, and 87.7% (p=0.002) of immediate specialist attention [see figure 3 below;
appendix, table 12].
In 2002 there was an increase in the proportion of injuries sustained that required specialist
review, and a reduced proportion of injuries managed at the community level, compared to 2000 (p
= 0.105) [Appendix, table 13].
12

Power Tools that don’t lend a Helping Hand 2011
Chi-Square Tests
Value df P value
Pearson Chi-Square 22.671a 7 .002
Behavioural Results
The aim of our behavioural analysis was to broadly determine whether the majority of the injuries
sustained resulted from a fault in the patient’s conduct; or due to a fault in the tool’s mechanism
whilst in use. The former cause of injury was classified as ‘behavioural,’ and the latter was termed
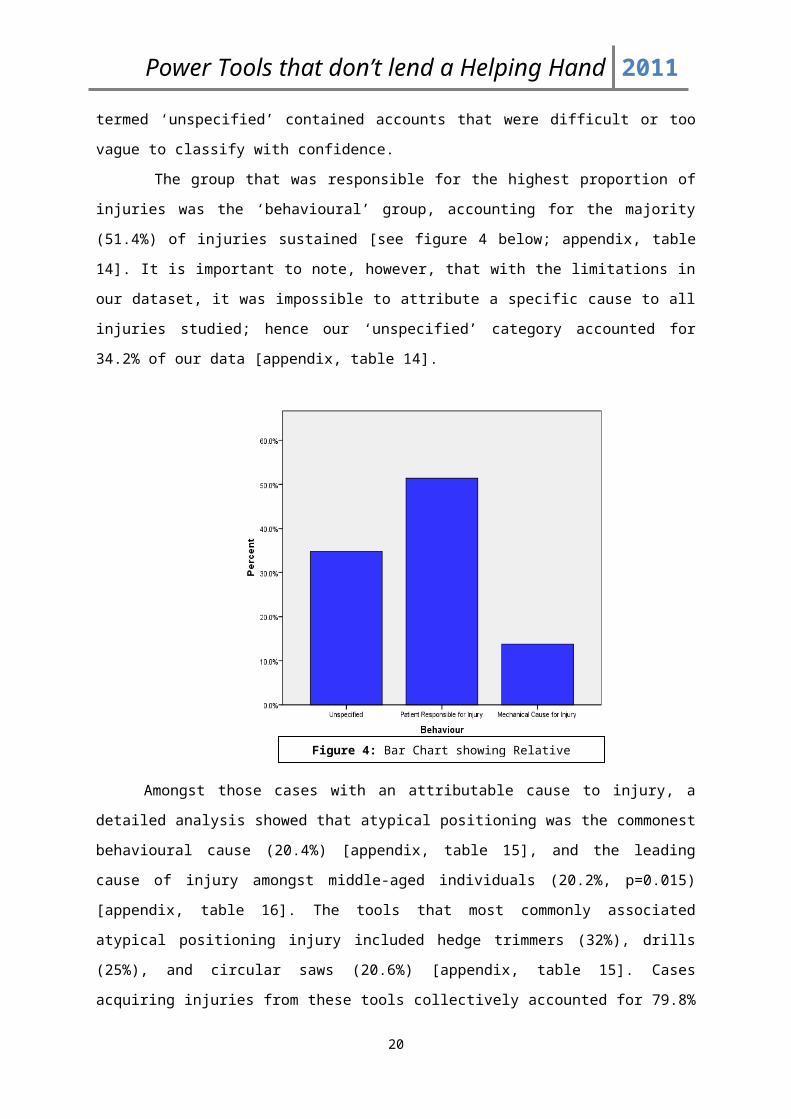
‘mechanical.’ Finally, a third category termed ‘unspecified’ contained accounts that were difficult or
too vague to classify with confidence.
The group that was responsible for the highest proportion of injuries was the ‘behavioural’
group, accounting for the majority (51.4%) of injuries sustained [see figure 4 below; appendix, table
13
Figure 3: A histogram depicting number of cases and treatment outcome by power tool.

Power Tools that don’t lend a Helping Hand 2011
14]. It is important to note, however, that with the limitations in our dataset, it was impossible to
attribute a specific cause to all injuries studied; hence our ‘unspecified’ category accounted for
34.2% of our data [appendix, table 14].
Amongst those cases with an attributable cause to injury, a detailed analysis showed that
atypical positioning was the commonest behavioural cause (20.4%) [appendix, table 15], and the
leading cause of injury amongst middle-aged individuals (20.2%, p=0.015) [appendix, table 16]. The
tools that most commonly associated atypical positioning injury included hedge trimmers (32%),
drills (25%), and circular saws (20.6%) [appendix, table 15]. Cases acquiring injuries from these tools
collectively accounted for 79.8% of injury requiring secondary care follow-up (p=0.002) [appendix,
table 17]. Thus, atypical positioning accounted for the greatest proportion of healthcare provision,
responsible for 30.2% of cases with an attributable cause requiring follow-up specialist attention
(appendix, table 12).
Complacency (16.4%) and distraction/inattention (10.1%) were the most common
behavioural causes leading to injury after atypical positioning [appendix, table 15]. Both were shown
to be most commonly associated with injury from hedge trimmers, accounting for 30.9% and 23.3%
(respectively) of cases with attributable cause [appendix, table 15]. These behaviours showed
marked gender differences: amongst those injuries serious enough to warrant specialist attention,
males were more complacent relative to their female counterparts (cause of 16.1% of injuries in
men compared to 13.3% in women, p=0.081) [appendix, table 20], while women suffered more from
14
Figure 4: Bar Chart showing Relative Causes of Hand Injury
Power Tools that don’t lend a Helping Hand 2011
injury by distraction and inattention (20% compared to 7.9%, p=0.081). Interestingly females showed
better adherence to safety measures as 0% of injuries sustained in women were due to lack of safety
measures [appendix, table 20, p=0.081].
Complacency was significantly marked amongst the youngest population studied, accounting
for 17% of injuries sustained in this age group (p=0.015) [appendix, table 21]. Whilst the young were
more complacent, they were better at adhering to safety measures than their elder counterparts.
Only 0.4% of injuries occurred due to lack of safety measures in the young, while a lack of safety
measures accounted for 2.5% of cases in the middle aged group and 3% of cases in the elderly
(p=0.015) [appendix, table 21].
Malfunction made up 3.3% of all injuries sustained to the hand, the highest occurrence being
in drills (12.2%) accounting for more than twice as many injuries proportionately compared to other
power tool malfunction [appendix, table 21]. This would suggest that stricter regimes in quality
assurance at the manufacturing level of these drills may need to be implemented.
Discussion
From a database of 4131 cases we determined that 1806 were relevant to this study. On the basis of
these cases we conducted our demographic analysis, severity analysis and behaviour analysis.
Demographic Analysis
An overwhelming majority of injuries resulting from power tool use were found to occur in men
(89.5%) between the ages of 30-69 (75.4%), suggesting that high-risk domestic DIY tasks are
performed chiefly by this population. The injuries sustained in this study group were most
commonly caused by circular saws and hedge trimmers (54.8%). A relevant outcome analysis
identified that this age group accounted for the highest volume of cases (860) requiring secondary
care after A/E admission. While this may be true, a greater proportion of the elderly population (of
70+) required secondary care (44.8%, p = 0.002); again, mostly due to circular saws (42.9%) and
hedge trimmers (29.1%). These results have a significant implication to healthcare provision when
considering an ageing population.
According to current literature, an increasing trend of DIY tool use is predicted by most
authors in accordance with the current economic climate. The UK National Estimates of power tool
related injuries between 2000 and 2002 (provided by RoSPA, n = 4131) back up these predictions by
showing increasing national estimates of such injuries: 24,605 in 2000 rising to 28,270 in 2002. When
we investigated the frequency of power tool injury specific to the hands in our study population (n =
15

Power Tools that don’t lend a Helping Hand 2011
1806) over this time period, a statistically insignificant (p = 0.267) decreasing trend was described,
contradicting current literature.
Severity Analysis
Our demographic tables show that circular saws and hedge trimmers accounted for the majority of
hand injuries acquired (cumulatively, 56%); on further analysis, these power tool injuries also
accounted for the highest proportion of secondary care attention required (66.7%, p=0.002). These
results illustrate the burden these tools have upon the healthcare system, not just in the shear load
of cases requiring attention, but also the high level of healthcare provision which they demand. This
is further exemplified in that these tools accounted for 87.7% (p=0.002) of the most severe hand
injuries sustained (those requiring immediate specialist attention).
A trend analysis in the outcomes of these injuries over the years shows that this burden is
likely to increase in the future. Between 2000 and 2002, there was seen to be a statistically
significant increase in the cases requiring immediate specialist attention: a rise from 19 cases in 2000
to 22 in 2002 (p=0.044).
Behaviour Analysis
When the causes of injuries were grouped into their broader categories (behavioural, mechanical,
and unspecified), the majority of hand injuries (51.4%) could be attributed to a behavioural cause.
As behavioural causes to injury can be modified, our data would suggest that the majority of
hand injuries sustained using power tools at home are avoidable. The specific behaviours most
responsible for injury were: atypical positioning (20.4% of all injuries), complacency (16.4%), and
distraction/inattention (10.1%). This information provides a basis from which safety and
preventative measures can be suggested; for example, preventing injuries from atypical positioning
and distraction/inattention can be reduced by promoting supervision or peer support when
conducting DIY. Likewise, complacency can be reduced with the provision of sufficient training and
education.
Our data goes on to suggest that such preventative measures can greatly reduce the burden
of such injury to our healthcare system. Of those injuries requiring follow-up after initial
presentation, it can be seen that, most of the time, community-level management is not sufficient
for those with a behavioural cause. A degree of specialist attention is required for the greater part
of these injuries; a cost which we have already shown to be avoidable provided that safer power-
tool behaviour is promoted and improved.
16
Power Tools that don’t lend a Helping Hand 2011
Limitations
As we were not personally able to validate each of the cases, our results carry the same
limitations as those in the HASS/LASS dataset. There were considerable limitations observed; for
instance, a number of accounts showed discrepancy in gender description in the provided history
and what was written under the gender subheading. When this occurred we used the information
provided in the gender column. Additionally, we also noted a number of duplicate accounts. To
avoid bias, we included all accounts in our results.
A lack of sufficient detail in some of the accounts introduced other drawbacks in our study.
On occasion, the information was so limited that the power tool used was not clear. For instance
“electric saw” was often recorded; when this occurred, we reclassified the power tool as “circular
saw,” potentially leading to an overrepresentation of circular saw incidents. Assumptions also played
a role whilst categorising each case into the various behaviour categories. Histories would often have
little information on the circumstances leading to injury, only including terms such as “caught” when
describing causative events. It was agreed that the term “caught” meant that an individual was being
complacent, as the patient could have taken more care. This, of course, may have not been the
interpretation intended. Where these inferences could not be made, the lack of sufficient detail led
to the creation of an unspecified category in our behaviour analysis. This subjected the data to
additional bias as it may have led to an underestimate of the relevant categories.
Finally, insufficient detail under “outcome following admission to A&E” occasionally made it
difficult to definitively state each patient’s treatment outcome. This shortcoming could have been
improved using the OPCS-4 coding system which documents all operations, procedures and
interventions carried out on a patients during a hospital admission; translating each entry into an
alphanumeric code. Its Incorporation would have allowed for more accurate and efficient analyses.
17

Power Tools that don’t lend a Helping Hand 2011
Recommendations (for future research)
While our study investigates several key research areas related to domestically sustained
hand injuries, our literature review revealed several other areas worthy of investigation. A key at-risk
population identified by Conn et al. were children younger than 5-years old who accounted for the
highest rate of finger amputations in American emergency departments annually. More research
focused at developing preventive measures is especially important in such a young age group as
these injuries can carry significant life-long functional restrictions. Additionally, Williams and Power
showed that an overwhelming majority of domestically sustained hand injuries are from manual
tools, not power tools. The study showed that a Stanley Knife, on its own, caused as many hand
injuries leading to A&E admission as all power tool combined. Thus, it can be easily inferred that the
healthcare burden from manual tools is still extraordinary and worthy of further investigation.
Our research provides a basis to several areas of further investigation. As alluded to in our
introduction, the economic impact of these types of injuries is significant. Our data not only suggests
that these injuries contribute to a significant financial burden to the NHS currently, but that this
burden is likely to increase with an ageing population. Investigation directed at the current and
expected costs surrounding these injuries would complete our understanding of their burden.
Additionally, we found that the malfunctioning of the power tool accounted for 3.3% of all injuries
sustained to the hand, namely in activity involving drills. This finding lends itself to further
investigation into the quality assurance criteria involved in tool engineering.
As a continuation to this project, we are currently undertaking a study looking to identify
measures to prevent the occurrence of power tool related hand injuries in the domestic setting.
From the trends that we have described in the mechanisms and behaviours leading to injury, a
questionnaire has been developed and distributed amongst healthcare personnel who deal with
hand injuries on a regular basis. The aim of this questionnaire is to gather expert opinions regarding
the commonest causes of injury, and their suggestions of how to prevent such injury from occurring.
The study will be conducted using the Delphi technique, where the questionnaire will circulate
amongst the expert panel for a number of cycles, each time being refined and narrowed to only
include opinions and suggestions that are widely accepted by the group. The end result will be a
common consensus as to what the most common root-cause to injury is, and the important
preventative measures that are needed to prevent this from occurring.
18

Power Tools that don’t lend a Helping Hand 2011
Conclusion
In an economic climate lending itself to increased DIY activity, it is important to develop an
understanding of the demographic and behavioural trends in hand injuries caused by power tools.
This is the only study that has been able to identify such trends leading to hand injuries from such
a broad spectrum of power tools. Our study has shown that while men between the ages of 30-69
account for the highest volume of such cases, it is the elderly population (70+) that are most
burdensome to our healthcare service; a key finding considering an ageing population. Likewise,
circular saws and hedge trimmers have been shown to cause the most healthcare burden, both in
volume of cases and secondary care required. The majority (51.4%) of hand injuries are avoidable
due to their behavioural root cause. The commonest modifiable behaviours leading to injury are
atypical positioning (20.4%) and complacency (16.4%). Implementing specific prevention strategies,
such as education and training, can reduce the incidence of these injuries and the subsequent
demand placed upon the healthcare system
19
Power Tools that don’t lend a Helping Hand 2011
Bibliography:
1. Brennen M, Burge P, Burke F, et al. Hand Surgery in the UK. Manpower, resources, standards and training. The British Society for Surgery of the Hand, 2007.
2. Ashby K. Injuries Associated with Do-it-Yourself Maintenance Activities. Victorian Health Promotion Foundation. Edition No. 41. 1999.
3. The Royal Society for the Prevention of Accidents. What are the most common DIY injuries? http://www.rospa.com/faqs/detail.aspx?faq=221 (accessed 19/04/11) .
4. Dias J. Helping the Hand; A report on the provision of surgical care for acute hand disorders in the United Kingdom. British Society for Surgery of the Hand, Royal College of Surgeons, London 1999.
5. Burke F, Dias J. Providing care for hand disorders: a reappraisal of need. Journal of Hand Surgery (British) 2004; 29(6):575-9.
6. Frank M, Hecht J, Napp M et al. Mind your hand during the energy crunch: Functional Outcome of Circular Saw Hand Injuries. Journal of Trauma Management & Outcomes 2010; 4:11.
7. Bylund S, Burström L, Knutsson A. A descriptive study of women injured by hand-arm vibration. The Annals of Occupational Hygiene 2002; 46(3):299-307.
8. Aghazadeh F, Mital A. Injuries due to hand tools; Results of a questionnaire. Applied Ergonomics 1987; 18(4):273-8.
9. Frank M, Lange J, Napp M et al. Accidental circular saw injuries: Trauma mechanisms, injury paterns, and accident insurance. Forensic Science International. 2010; 198(1-3):74-8.
10. Conn J, Annest J, Ryan G et al. Non-Work-Related Finger Amputations in the United States, 2001-2002. Annals of Emergency Medicine 2005; 45(6):630-5.
11. Bonte W , Goldberg R. Accidental circular saw injuries. Journal of Legal medicine 1982; 89(3):173-80.
12. Hoxie S, Capo J, Dennison D, Shin A. The Economic Impact of Electric Saw Injuries to the Hand. Journal of Hand Surgery. 2009; 34(5): 886-889.
13. Williams S, Power D. Hand injuries from tools in domestic and leisure settings: relative incidence and patterns of initial management. Journal of Hand Surgery (European Volume) 2011
20

Power Tools that don’t lend a Helping Hand 2011
14. Bonte W . Self-mutilation and private accident insurance. Journal of Forensic Science 1983; 28(1):70-82.
15. Speed M. Consumer Knowledge of Tool and DIY Safety. UK Department of Trade and Industry. 2002
16. Lipscomb H, Nolan J, Patterson D et al. Prevention of traumatic nail gun injuries in apprentice carpenters: use of population-based measures to monitor intervention effectiveness. American Journal of Industrial Medicine 2008; 51(10):719-27.
17. Frank M , Ekkernkamp A. Small change, big impact: prevention of vole captive bolt device hand injuries. Journal of Trauma 2010; 69(2):478.
18. Sorock G, Lombardi D, Peng D et al. Glove Use and the Relative Rick of Acute Hand Injury: A Case Crossover Study. Journal of Occupational and Environmental Hygiene 2004; 1(3):182-190
21
Power Tools that don’t lend a Helping Hand 2011
Appendices
Table 1 - The hospital Accident and Emergency departments participating in the surveillance system between 2000 and 2002.
Hospitals SampledAiredale, Keighley
Blackburn Royal Infirmary, Lancs
Daisy Hill, Newry
George Elliot, Nuneaton
Hereford City General, Hereford
Kings College, Denmark Hill
Luton & Dunstable, Beds
Macclesfield General, Cheshire
Monklands General, Airdrie
Norfolk & Norwich, Norwich
North Devon, Barnstaple
North Tees General, Stockton
Prince Charles, Merthyr Tydfil
Royal Berkshire, Reading
Selly Oak, Birmingham
Skegness and District, Lincs
St. Helier, Carshalton
Worthing
N.b Two hospitals left the sample during the 2000-2002 reporting period without being replaced. Monklands provided data until the end of June 2001, and Royal Berkshire left the sample at the end of 2001.
22
Power Tools that don’t lend a Helping Hand 2011
Table 2 - The exclusion criteria for location of injury.
Table 2: Exclusion Criteria filtering location of Injury- Air Museum- Airport- Backlane- Boat Yard- Business/Public Building/ Bank- Car park, Bus Station, Service Station- Education Area- Factory, Warehouse, Workshop, Plant- Field- Filling Station- Holiday Play Scheme- IED- In Sea, Lake, River, Canal, Marsh, Water- Inside School, University, College- Leisure, Public Building, Library, Church- Boat, Ship, Draft, Airbed- Other Industrial Production Area- Other Leisure Facility- Other Location- Other Natural Area- Other Road Area- Other Trade/ Service Area- Parkland/ Cemetery Gardens- Public Playground- Riding School- Rural Road, Pavement, Grass- School Grounds- Shopping Area- Sport Field/ Hall- Swimming Pool- Ulcultivated Fiels/ Woods- Unknown- Unspecified- Waterside/ Beach- Woods- Workshop
23

Power Tools that don’t lend a Helping Hand 2011
Table 3 - Inclusion criteria for classifying hand injuries
Table 3: Inclusion Criteria for Classifying Hand Injuries- Both Hands- Fingers, Thumb, Digit, Phalange- Wrists- Nail
Table 4 - Behaviour coding legend
Code Behaviour1.1 Unspecified (patient does not know how the
injury occurred or the history provided by the data was insufficient to ascertain how the injury came about)
1.2 OtherPatient Behaviour2.1 Inexperience (drill bit coming out, drill getting
stuck in material, igniting self, not realising being burnt by power tool)
2.2 Complacency (hand behind drill, fingers too close to saw, poor lighting, patient intoxicated, holding object being cut)
2.3 Distraction/Inattention (includes not realising machine was on, loss of concentration, patient missing material, not paying attention, multitasking)
2.4 Lack of Safety Implementations (hand being dragged into saw by gloves or wood)
2.5 Atypical Hand Position (includes slip/slipping, fell, lost balance, loss of grip, machine not stabilised, catching falling tool)
Mechanical3.1 Indirect Mechanical injury (being hurt by
material, by power tool when not being used, indirect, hurt from hot surface)
3.2 Direct Mechanical Injury (Vibration injury, kick back, injured while cleaning, steam from power tool, hot water)
3.3 Malfunction (tool snapping, electric shock)
24
Power Tools that don’t lend a Helping Hand 2011
Table 5 - Categorising of Treatment OutcomeReferral Categories
Immediate Specialist Attention Required
- Admitted to Specialist Hospital- Referred to Orthopaedics- Referred to Plastic Surgery- Referred to Brighton Plastics- Referred to St Georges Plastics Dept- To be admitted to Specialist Hospital
Hospital Care
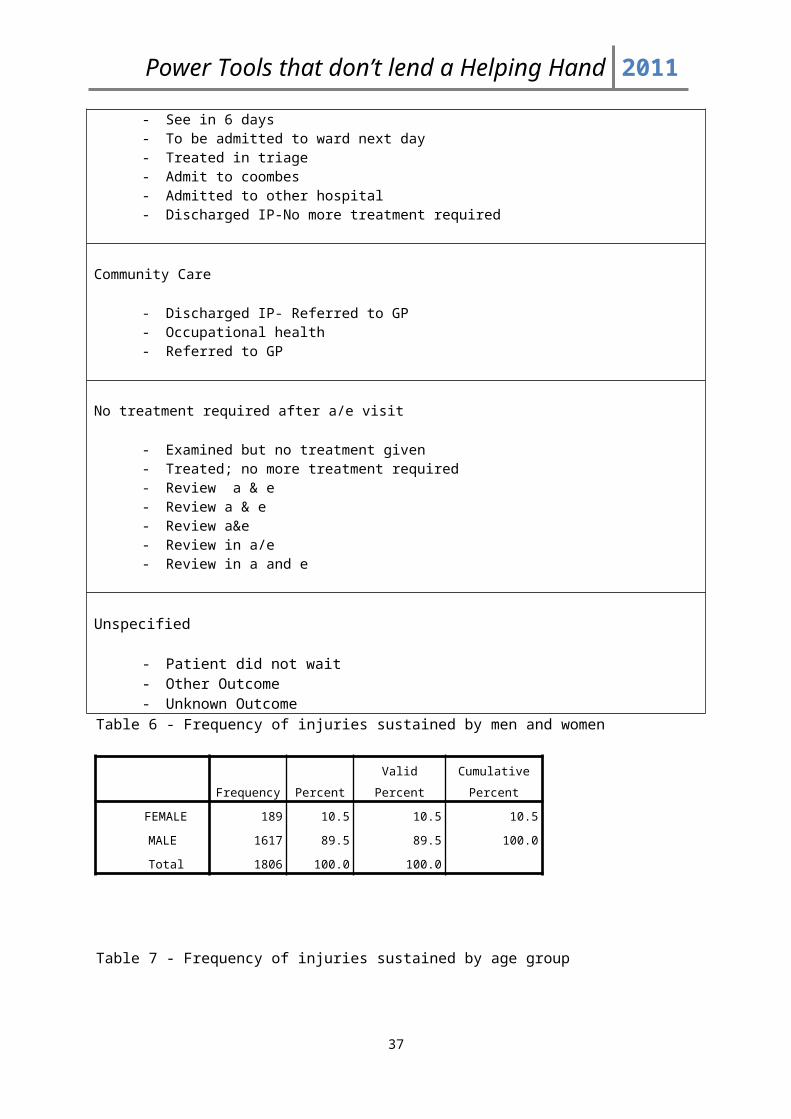
- Discharged IP, Referred Outpatient Clinic- Inpatient- Unspec Outcome- Inpatient, then transf to other hosp- IP for less than one day- Referred to any outpatient clinic- Other outcome – Newark hospital- Referred to other hospital- Review at a & e 3 days- Review 3 days- Review a & e 4 days- See in 6 days- To be admitted to ward next day- Treated in triage- Admit to coombes- Admitted to other hospital- Discharged IP-No more treatment required
Community Care
- Discharged IP- Referred to GP- Occupational health- Referred to GP
No treatment required after a/e visit
- Examined but no treatment given- Treated; no more treatment required- Review a & e- Review a & e- Review a&e- Review in a/e- Review in a and e
Unspecified
- Patient did not wait- Other Outcome- Unknown Outcome
25
Power Tools that don’t lend a Helping Hand 2011
Table 6 - Frequency of injuries sustained by men and women
Frequency Percent Valid Percent
Cumulative
Percent
FEMALE 189 10.5 10.5 10.5
MALE 1617 89.5 89.5 100.0
Total 1806 100.0 100.0
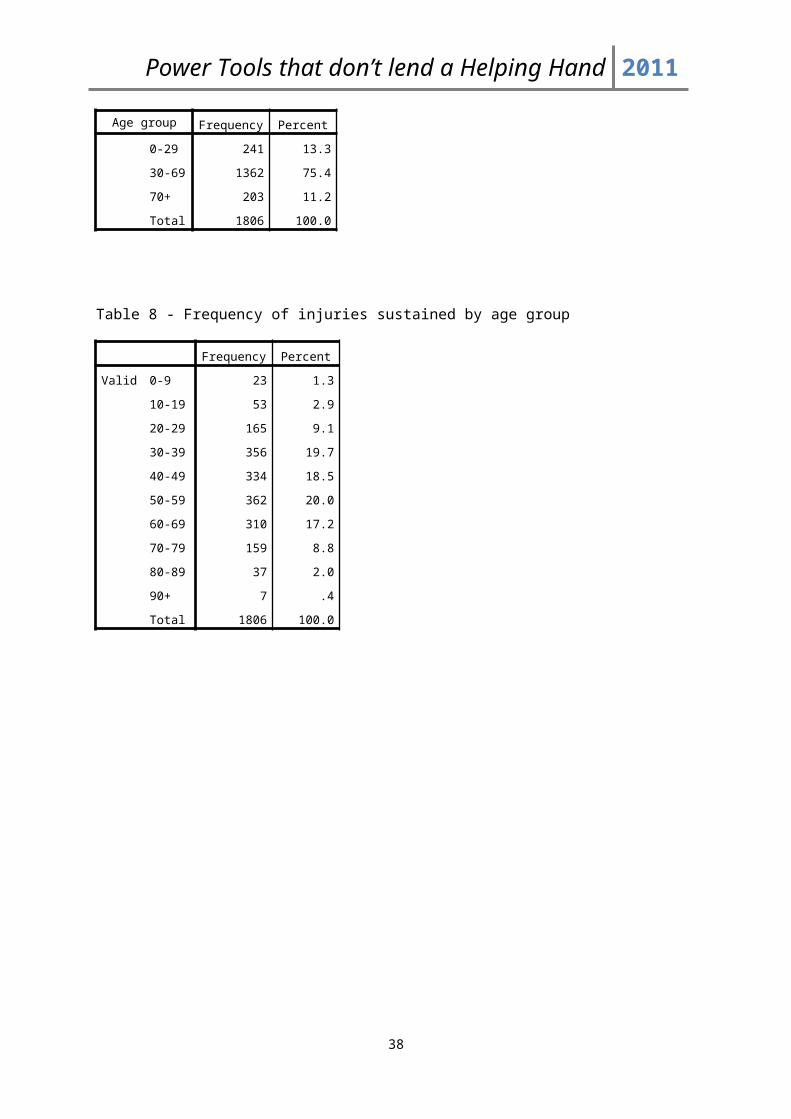
Table 7 - Frequency of injuries sustained by age group
Age group Frequency Percent
0-29 241 13.3
30-69 1362 75.4
70+ 203 11.2
Total 1806 100.0
Table 8 - Frequency of injuries sustained by age group
Frequency Percent
Valid 0-9 23 1.3
10-19 53 2.9
20-29 165 9.1
30-39 356 19.7
40-49 334 18.5
50-59 362 20.0
60-69 310 17.2
70-79 159 8.8
80-89 37 2.0
90+ 7 .4
Total 1806 100.0
26
Power Tools that don’t lend a Helping Hand 2011
Table 9 - Frequency of patient outcome with respect to age
OUTCOME
AgeSmall
Total0-29 (Young)
30-69
(Middle
Aged)
70+
(Elderly)
IMMEDIATE SPECIALIST
ATTENTION REQUIRED
Count 1 35 13 49
% within
AgeSmall
.4% 2.6% 6.4% 2.7%
HOSPITAL CARE Count 82 508 78 668
% within
AgeSmall
34.0% 37.3% 38.4% 37.0%
COMMUNITY CARE Count 47 317 48 412
% within
AgeSmall
19.5% 23.3% 23.6% 22.8%
NO TREATMENT
REQUIRED AFTER A+E
VISIT
Count 101 451 58 610
% within
AgeSmall
41.9% 33.1% 28.6% 33.8%
UNSPECIFIED Count 10 51 6 67
% within
AgeSmall
4.1% 3.7% 3.0% 3.7%
Total Count 241 1362 203 1806
% within
AgeSmall
100.0% 100.0% 100.0% 100.0%
Chi-Square Tests
Value df P value
Pearson Chi-Square 24.020a 8 .002
27

Power Tools that don’t lend a Helping Hand 2011
Table 10 - Frequency of tool type used with respect to age group
TOOL TYPE
AgeSmall
Total
0-29
(Young)
30-69
(Middle
Aged)
70+
(Elderly)
CHAINSAW Count 16 63 9 88
% within AgeSmall 6.6% 4.6% 4.4% 4.9%
CIRCULAR SAW Count 28 401 87 516
% within AgeSmall 11.6% 29.4% 42.9% 28.6%
DRILL Count 61 261 22 344
% within AgeSmall 25.3% 19.2% 10.8% 19.0%
GRINDER Count 33 187 16 236
% within AgeSmall 13.7% 13.7% 7.9% 13.1%
HEDGE TRIMMER Count 64 371 59 494
% within AgeSmall 26.6% 27.2% 29.1% 27.4%
MISCELLANEOUS Count 16 26 6 48
% within AgeSmall 6.6% 1.9% 3.0% 2.7%
WALLPAPER STRIPPER Count 20 35 4 59
% within AgeSmall 8.3% 2.6% 2.0% 3.3%
WELDER Count 3 18 0 21
% within AgeSmall 1.2% 1.3% .0% 1.2%
Total Count 241 1362 203 1806
% within AgeSmall 100.0% 100.0% 100.0% 100.0%
28
Power Tools that don’t lend a Helping Hand 2011
Table 11 - Frequency of injuries sustained by particular tools in males and females
SEX
TotalFEMALE MALE
TOOL TYPE CHAINSAW Count 9 79 88
% within SEX 4.8% 4.9% 4.9%
CIRCULAR SAW Count 16 500 516
% within SEX 8.5% 30.9% 28.6%
DRILL Count 17 327 344
% within SEX 9.0% 20.2% 19.0%
GRINDER Count 9 227 236
% within SEX 4.8% 14.0% 13.1%
HEDGE TRIMMER Count 107 387 494
% within SEX 56.6% 23.9% 27.4%
MISCELLANEOUS Count 16 32 48
% within SEX 8.5% 2.0% 2.7%
WALLPAPER STRIPPER Count 14 45 59
% within SEX 7.4% 2.8% 3.3%
WELDER Count 1 20 21
% within SEX .5% 1.2% 1.2%
Total Count 189 1617 1806
% within SEX 100.0% 100.0% 100.0%
29
Power Tools that don’t lend a Helping Hand 2011
Table 12 - Frequency of injuries sustained from specific tools with respect to outcome of the patient
OUTCOME
SPECIALIST
CARE
HOSPITAL
CARE
IMMEDIATE
SPECIALIST
ATTENTION
REQUIRED
TOOL TYPE CHAINSAW Count 31 4 35
% within OUTCOME 4.6% 8.2% 4.9%
CIRCULAR SAW Count 282 35 317
% within OUTCOME 42.2% 71.4% 44.2%
DRILL Count 93 1 94
% within OUTCOME 13.9% 2.0% 13.1%
GRINDER Count 69 0 69
% within OUTCOME 10.3% .0% 9.6%
HEDGE TRIMMER Count 153 8 161
% within OUTCOME 22.9% 16.3% 22.5%
MISCELLANEOUS Count 15 1 16
% within OUTCOME 2.2% 2.0% 2.2%
WALLPAPER STRIPPER Count 14 0 14
% within OUTCOME 2.1% .0% 2.0%
WELDER Count 11 0 11
% within OUTCOME 1.6% .0% 1.5%
Total Count 668 49 717
% within OUTCOME 100.0% 100.0% 100.0%
30

Power Tools that don’t lend a Helping Hand 2011
Chi-Square Tests
Value df P value
Pearson Chi-Square 22.671a 7 .002
Table 13 - Frequency of outcomes within each year
YEAR
Total2000 2001 2002
OUTCOME COMMUNITY CARE Count 159 130 123 412
% within YEAR 24.9% 22.1% 21.2% 22.8%
HOSPITAL CARE Count 227 221 220 668
% within YEAR 35.5% 37.6% 38.0% 37.0%
IMMEDIATE SPECIALIST
ATTENTION REQUIRED
Count 19 8 22 49
% within YEAR 3.0% 1.4% 3.8% 2.7%
NO TREATMENT
REQUIRED AFTER A+E
VISIT
Count 217 206 187 610
% within YEAR 34.0% 35.0% 32.3% 33.8%
UNSPECIFIED Count 17 23 27 67
% within YEAR 2.7% 3.9% 4.7% 3.7%
Total Count 639 588 579 1806
% within YEAR 100.0% 100.0% 100.0% 100.0%
Chi-Square Tests
Value df P value
Pearson Chi-Square 13.219a 8 .105
Table 14 - Behaviour frequency
31

Power Tools that don’t lend a Helping Hand 2011
Frequency Percent
UNSPECIFIED 629 34.8
BEHAVIOURAL 928 51.4
MECHANICAL 249 13.8
Total 1806 100.0
32

Power Tools that don’t lend a Helping Hand 2011
33
Table 15 - Behaviour type frequency with respect to particular tool used
BEHAVIOUR
TOOL TYPE
TotalCHAINSAWCIRCULAR SAW DRILL GRINDER
HEDGE TRIMMER MISCELLANEOUS
WALLPAPER STRIPPER WELDER
UNSPECIFIED Count 36 260 63 87 138 10 20 3 617
% within TOOL TYPE 40.9% 50.4% 18.3% 36.9% 27.9% 20.8% 33.9% 14.3% 34.2%
OTHER Count 0 0 4 1 4 3 0 0 12
% within TOOL TYPE .0% .0% 1.2% .4% .8% 6.3% .0% .0% .7%
INEXPERIENCE Count 1 9 14 2 5 3 1 6 41
% within TOOL TYPE 1.1% 1.7% 4.1% .8% 1.0% 6.3% 1.7% 28.6% 2.3%
COMPLACENCY Count 13 60 60 40 110 4 4 5 296
% within TOOL TYPE 14.8% 11.6% 17.4% 16.9% 22.3% 8.3% 6.8% 23.8% 16.4%
DISTRACTION/INATTENTION
Count 5 45 28 12 83 5 3 1 182
% within TOOL TYPE 5.7% 8.7% 8.1% 5.1% 16.8% 10.4% 5.1% 4.8% 10.1%
LACK OF ADEQUATESAFETY MEASURES
Count 3 20 2 5 10 0 0 1 41
% within TOOL TYPE 3.4% 3.9% .6% 2.1% 2.0% .0% .0% 4.8% 2.3%
AYTPICAL POSTIONING Count 16 76 92 51 118 5 10 0 368
% within TOOL TYPE 18.2% 14.7% 26.7% 21.6% 23.9% 10.4% 16.9% .0% 20.4%
INDIRECTMECHANICAL INJURY
Count 6 16 15 5 11 11 10 4 78
% within TOOL TYPE 6.8% 3.1% 4.4% 2.1% 2.2% 22.9% 16.9% 19.0% 4.3%
DIRECT MECHANICAL INJURY
Count 6 30 24 20 14 6 11 1 112
% within TOOL TYPE 6.8% 5.8% 7.0% 8.5% 2.8% 12.5% 18.6% 4.8% 6.2%
MALFUNCTION Count 2 0 42 13 1 1 0 0 59
% within TOOL TYPE 2.3% .0% 12.2% 5.5% .2% 2.1% .0% .0% 3.3%
Total Count 88 516 344 236 494 48 59 21 1806
% within TOOL TYPE 100.0% 100.0% 100.0% 100.0% 100.0% 100.0% 100.0% 100.0% 100.0%

Power Tools that don’t lend a Helping Hand 2011
34

Power Tools that don’t lend a Helping Hand 2011
Table 16 - Behaviour frequency causing injury with respect to age
BEHAVIOURAgeSmall
Total0-29 (Young) 30-69 (Middle Aged) 70+ (Elderly)
UNSPECIFIED Count 80 457 80 617
% within AgeSmall 33.2% 33.6% 39.4% 34.2%
OTHER Count 1 10 1 12
% within AgeSmall .4% .7% .5% .7%
INEXPERIENCE Count 9 32 0 41
% within AgeSmall 3.7% 2.3% .0% 2.3%
COMPLACENCY Count 41 222 33 296
% within AgeSmall 17.0% 16.3% 16.3% 16.4%
DISTRACTION/
INATTENTION
Count 32 126 24 182
% within AgeSmall 13.3% 9.3% 11.8% 10.1%
LACK OF ADEQUATE
SAFETY MEASURES
Count 1 34 6 41
% within AgeSmall .4% 2.5% 3.0% 2.3%
AYTPICAL
POSTIONING
Count 39 293 36 368
% within AgeSmall 16.2% 21.5% 17.7% 20.4%
INDIRECT
MECHANICAL
INJURY
Count 19 55 4 78
% within AgeSmall 7.9% 4.0% 2.0% 4.3%
DIRECT MECHANICAL
INJURY
Count 14 84 14 112
% within AgeSmall 5.8% 6.2% 6.9% 6.2%
MALFUNCTION Count 5 49 5 59
% within AgeSmall 2.1% 3.6% 2.5% 3.3%
Total Count 241 1362 203 1806
% within AgeSmall 100.0% 100.0% 100.0% 100.0%
Chi-Square Tests
Value df P value
Pearson Chi-Square 33.318a 18 .015
35

Power Tools that don’t lend a Helping Hand 2011
Table 17 - Frequency of specific tools with respect to outcome of the patient
OUTCOME
SPECIALIST
CARE
HOSPITAL
CARE
IMMEDIATE
SPECIALIST
ATTENTION
REQUIRED
TOOL TYPE CHAINSAW Count 31 4 35
% within OUTCOME 4.6% 8.2% 4.9%
CIRCULAR SAW Count 282 35 317
% within OUTCOME 42.2% 71.4% 44.2%
DRILL Count 93 1 94
% within OUTCOME 13.9% 2.0% 13.1%
GRINDER Count 69 0 69
% within OUTCOME 10.3% .0% 9.6%
HEDGE TRIMMER Count 153 8 161
% within OUTCOME 22.9% 16.3% 22.5%
MISCELLANEOUS Count 15 1 16
% within OUTCOME 2.2% 2.0% 2.2%
WALLPAPER STRIPPER Count 14 0 14
% within OUTCOME 2.1% .0% 2.0%
WELDER Count 11 0 11
% within OUTCOME 1.6% .0% 1.5%
Total Count 668 49 717
% within OUTCOME 100.0% 100.0% 100.0%
Chi-Square Tests
Value df P value
Pearson Chi-Square 22.671a 7 .002
36
Power Tools that don’t lend a Helping Hand 2011
Table 18 - Frequency and type of care received with respect to behaviour causing injury
BEHAVIOUR
HIC2
Total
COMMUNITY
CARE
NO TREATMENT
AFTER A+E VISIT
SPECIALIST
CARE UNSPECIFIED
UNSPECIFIED Count 131 156 297 33 617
% within BEHAVIOUR 21.2% 25.3% 48.1% 5.3% 100.0%
OTHER Count 3 7 2 0 12
% within BEHAVIOUR 25.0% 58.3% 16.7% .0% 100.0%
INEXPERIENCE Count 8 16 13 4 41
% within BEHAVIOUR 19.5% 39.0% 31.7% 9.8% 100.0%
COMPLACENCY Count 76 97 114 9 296
% within BEHAVIOUR 25.7% 32.8% 38.5% 3.0% 100.0%
DISTRACTION/
INATTENTION
Count 48 65 64 5 182
% within BEHAVIOUR 26.4% 35.7% 35.2% 2.7% 100.0%
LACK OF ADEQUATE
SAFETY MEASURES
Count 7 17 14 3 41
% within BEHAVIOUR 17.1% 41.5% 34.1% 7.3% 100.0%
AYTPICAL
POSTIONING
Count 89 147 127 5 368
% within BEHAVIOUR 24.2% 39.9% 34.5% 1.4% 100.0%
INDIRECT
MECHANICAL INJURY
Count 19 35 24 0 78
% within BEHAVIOUR 24.4% 44.9% 30.8% .0% 100.0%
DIRECT MECHANICAL
INJURY
Count 21 44 43 4 112
% within BEHAVIOUR 18.8% 39.3% 38.4% 3.6% 100.0%
MALFUNCTION Count 10 26 19 4 59
% within BEHAVIOUR 16.9% 44.1% 32.2% 6.8% 100.0%
Total Count 412 610 717 67 1806
% within BEHAVIOUR 22.8% 33.8% 39.7% 3.7% 100.0%
37
Power Tools that don’t lend a Helping Hand 2011
Table 19-Frequency of outcome of the patient with respect to sex
SEX
TotalFEMALE MALE
OUTCOME IMMEDIATE SPECIALIST
ATTENTION REQUIRED
Count 2 47 49
% within SEX 1.1% 2.9% 2.7%
HOSPITAL CARE Count 58 610 668
% within SEX 30.7% 37.7% 37.0%
COMMUNITY CARE Count 38 374 412
% within SEX 20.1% 23.1% 22.8%
NO TREATMENT
REQUIRED AFTER A+E
VISIT
Count 88 522 610
% within SEX 46.6% 32.3% 33.8%
UNSPECIFIED Count 3 64 67
% within SEX 1.6% 4.0% 3.7%
Total Count 189 1617 1806
% within SEX 100.0% 100.0% 100.0%
Chi-Square Tests
Value df P value
Pearson Chi-Square 17.852a 4 .001
38

Power Tools that don’t lend a Helping Hand 2011
Table 20 - Frequency of type of behaviours causing injury occurring in men and women
SEX
TotalFEMALE MALE
BEHAVIOUR UNSPECIFIED Count 24 273 297
% within SEX 40.0% 41.6% 41.4%
OTHER Count 0 2 2
% within SEX .0% .3% .3%
INEXPERIENCE Count 0 13 13
% within SEX .0% 2.0% 1.8%
COMPLACENCY Count 8 106 114
% within SEX 13.3% 16.1% 15.9%
DISTRACTION/
INATTENTION
Count 12 52 64
% within SEX 20.0% 7.9% 8.9%
LACK OF ADEQUATE
SAFETY MEASURES
Count 0 14 14
% within SEX .0% 2.1% 2.0%
AYTPICAL POSTIONING Count 10 117 127
% within SEX 16.7% 17.8% 17.7%
INDIRECT MECHANICAL
INJURY
Count 2 22 24
% within SEX 3.3% 3.3% 3.3%
DIRECT MECHANICAL
INJURY
Count 1 42 43
% within SEX 1.7% 6.4% 6.0%
MALFUNCTION Count 3 16 19
% within SEX 5.0% 2.4% 2.6%
Total Count 60 657 717
% within SEX 100.0% 100.0% 100.0%
Chi-Square Tests
Value df P value
Pearson Chi-Square 15.400a 9 .081
39
Power Tools that don’t lend a Helping Hand 2011
Table 21 - Frequency of behaviour causing injury with respect to age
BEHAVIOURAgeSmall
Total0-29 (Young) 30-69 (Middle Aged) 70+ (Elderly)
UNSPECIFIED Count 80 457 80 617
% within AgeSmall 33.2% 33.6% 39.4% 34.2%
OTHER Count 1 10 1 12
% within AgeSmall .4% .7% .5% .7%
INEXPERIENCE Count 9 32 0 41
% within AgeSmall 3.7% 2.3% .0% 2.3%
COMPLACENCY Count 41 222 33 296
% within AgeSmall 17.0% 16.3% 16.3% 16.4%
DISTRACTION/
INATTENTION
Count 32 126 24 182
% within AgeSmall 13.3% 9.3% 11.8% 10.1%
LACK OF ADEQUATE
SAFETY MEASURES
Count 1 34 6 41
% within AgeSmall .4% 2.5% 3.0% 2.3%
AYTPICAL
POSTIONING
Count 39 293 36 368
% within AgeSmall 16.2% 21.5% 17.7% 20.4%
INDIRECT
MECHANICAL
INJURY
Count 19 55 4 78
% within AgeSmall 7.9% 4.0% 2.0% 4.3%
DIRECT MECHANICAL
INJURY
Count 14 84 14 112
% within AgeSmall 5.8% 6.2% 6.9% 6.2%
MALFUNCTION Count 5 49 5 59
% within AgeSmall 2.1% 3.6% 2.5% 3.3%
Total Count 241 1362 203 1806
% within AgeSmall 100.0% 100.0% 100.0% 100.0%
Chi-Square Tests
Value df P value
Pearson Chi-Square 33.318a 18 .015
40

Power Tools that don’t lend a Helping Hand 2011
Authors ContributionsEvery member of this group contributed in their only particular way towards each section of this project. It was a group effort.
Author ContributionAmit Anand - Discussion
- Introduction- Conclusion- Shortcomings- Appendices- Methods
Nicholas Campion - Discussion- Data Analysis and Results- Appendices- Communication with Supervisor- Literature Review
James Cheshire - Discussion- Introduction- Shortcomings- Conclusion- Appendices- Methods
Thomas Haigh - Literature Review- Abstract- Aims and Objectives- Recommendations for Future Research- Appendices- Methods
James Leckenby - Literature review- Data Analysis and Results- Appendices- Communication with Supervisor
Project design, data gathering, and all other sections were done by all of us.
Every member of the group has both read and agreed the final version.
Signatures:
Amit Anand Nicholas Campion James Cheshire
Thomas Haigh James Leckenby
41


![Como Construir Herramientas de Carpinteria [ES] DIY How to Make Carpenter's Hand Tools](https://static.fdocuments.us/doc/165x107/5571fbff497959916996410e/como-construir-herramientas-de-carpinteria-es-diy-how-to-make-carpenters-hand-tools.jpg)