DIY INVESTOR TOOLKIT - fidelity.com
29
DIY INVESTOR TOOLKIT Mutual funds and ETFs and stocks, oh my! Brad Zucker, CFA, CAIA, FRM Director, iShares Product Consulting October 28, 2021 iCRMH1021U/S-1848565-1/29
Transcript of DIY INVESTOR TOOLKIT - fidelity.com

DIY INVESTOR TOOLKITMutual funds and ETFs and stocks, oh my!
Brad Zucker, CFA, CAIA, FRM
Director, iShares Product Consulting
October 28, 2021
iCRMH1021U/S-1848565-1/29
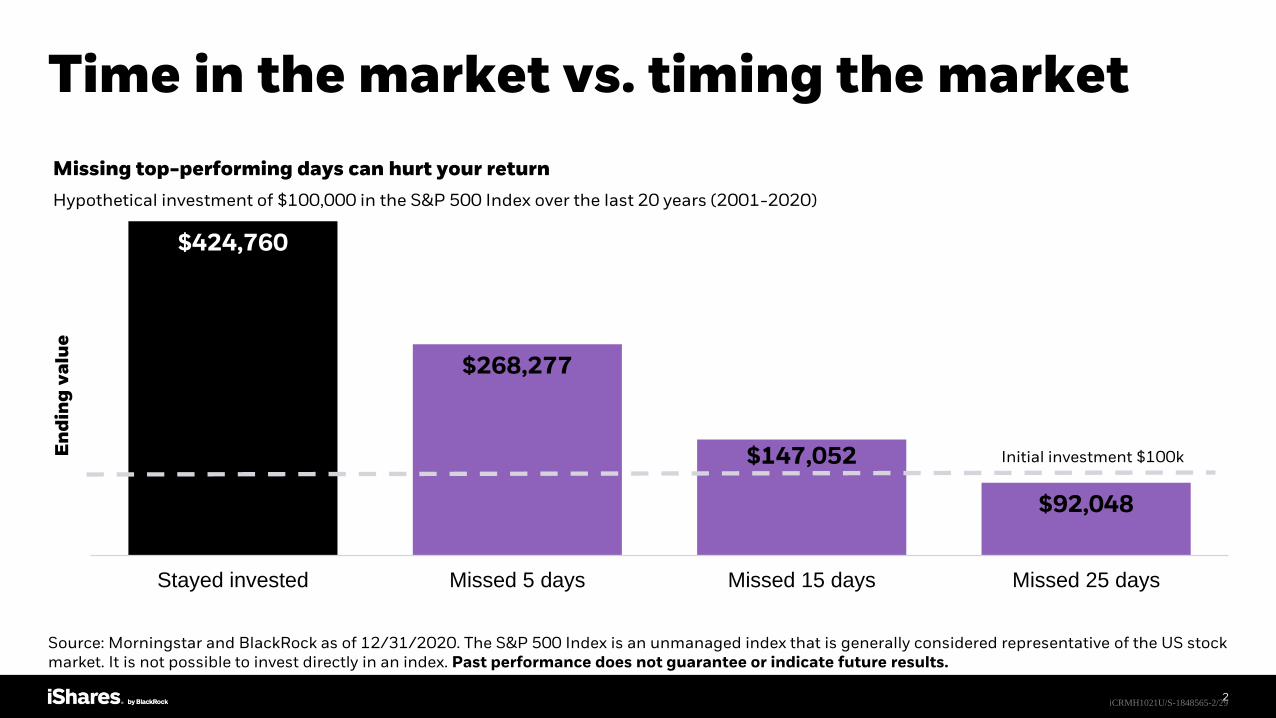
Time in the market vs. timing the market
Source: Morningstar and BlackRock as of 12/31/2020. The S&P 500 Index is an unmanaged index that is generally considered representative of the US stock market. It is not possible to invest directly in an index. Past performance does not guarantee or indicate future results.
$424,760
$268,277
$147,052
$92,048
Stayed invested Missed 5 days Missed 15 days Missed 25 days
En
din
g v
alu
e
Initial investment $100k
Missing top-performing days can hurt your return
Hypothetical investment of $100,000 in the S&P 500 Index over the last 20 years (2001-2020)
2iCRMH1021U/S-1848565-2/29

Agenda
Selecting the right vehicle
Tax & trading considerations
Tools in the DIY toolkit
3iCRMH1021U/S-1848565-3/29

4
TOOLS IN THE TOOLKIT
iCRMH1021U/S-1848565-4/29

Examples of investing and savings
5
Investment spectrum
Lower risk &lower potentialreturn
Higher risk & higher potentialreturn
Bonds
Stocks
Source: BlackRock. For illustrative purposes only.
Cash(Savings account, Bank CDs)
iCRMH1021U/S-1848565-5/29

More return, but also more risk
6
Average annual returns for various asset classes since 1926
3.3%
5.1%
10.4%
Cash/Savings U.S. bonds U.S. stocks
Risk
1.1 years out of 10
lost money on average
Inflation 2.9%
Source: Morningstar, BlackRock. Stocks are represented by the S&P 500 index from 3/4/57 to 6/30/21 and the IA SBBI U.S. large stock index from 1/1/26 and 3/4/57. U.S. bonds are represented by the Bbg U.S. Agg Bond TR index from 1/3/89 to 6/30/21 and the IA SBBI U.S. Gov IT index from 1/1/26 to 1/3/89. Cash/Savings are represented by the IA SBBI US 30 Day TBill TR Index from 1/1/26 to 6/30/21. Past performance does not guarantee or indicate future results. Index performance is for illustrative purposes only. You cannot invest directly in an index.
Risk
2.6 years out of 10
lost money on average
iCRMH1021U/S-1848565-6/29
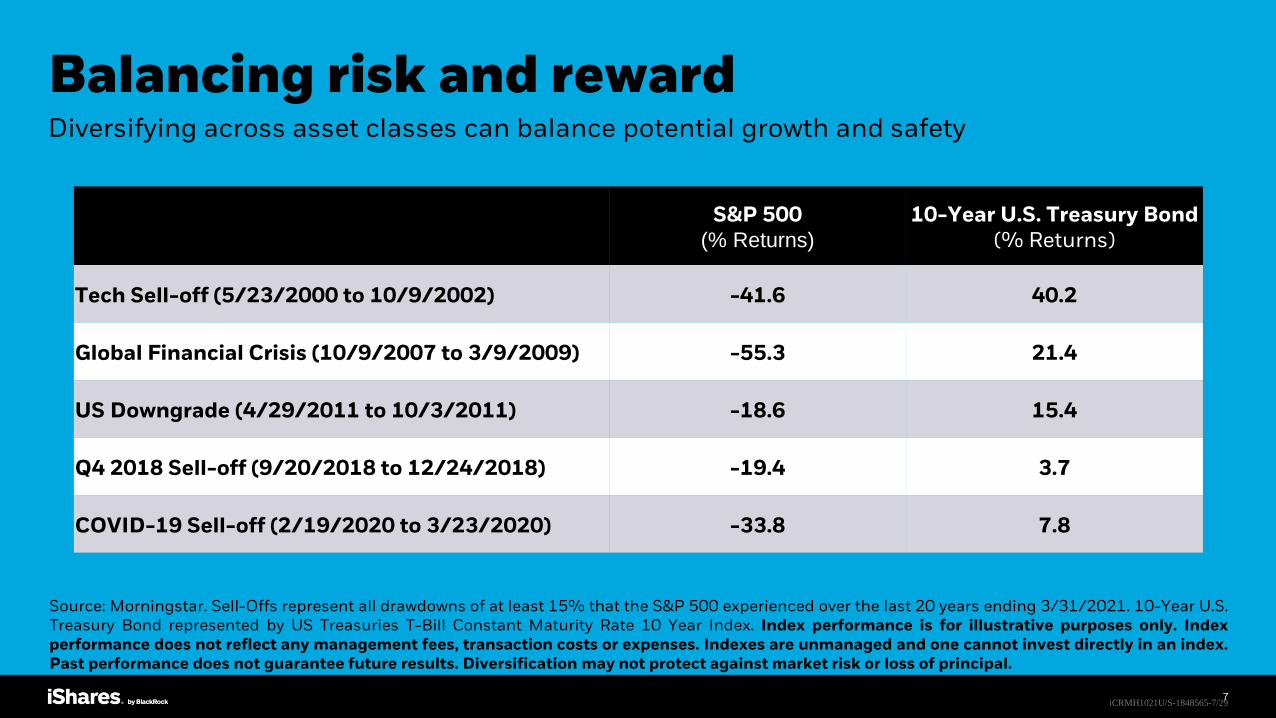
Balancing risk and reward
S&P 500(% Returns)
10-Year U.S. Treasury Bond (% Returns)
Tech Sell-off (5/23/2000 to 10/9/2002) -41.6 40.2
Global Financial Crisis (10/9/2007 to 3/9/2009) -55.3 21.4
US Downgrade (4/29/2011 to 10/3/2011) -18.6 15.4
Q4 2018 Sell-off (9/20/2018 to 12/24/2018) -19.4 3.7
COVID-19 Sell-off (2/19/2020 to 3/23/2020) -33.8 7.8
Source: Morningstar. Sell-Offs represent all drawdowns of at least 15% that the S&P 500 experienced over the last 20 years ending 3/31/2021. 10-Year U.S.Treasury Bond represented by US Treasuries T-Bill Constant Maturity Rate 10 Year Index. Index performance is for illustrative purposes only. Indexperformance does not reflect any management fees, transaction costs or expenses. Indexes are unmanaged and one cannot invest directly in an index.Past performance does not guarantee future results. Diversification may not protect against market risk or loss of principal.
7
Diversifying across asset classes can balance potential growth and safety
iCRMH1021U/S-1848565-7/29

ETFs (exchange traded funds) offer a diversified, low cost, and tax efficient way to invest
Ways to gain access
StockTradable duringthe day
Mutual fundDiversified
ETFsDiversified funds
that trade like stocks
Like a mutual fund, an ETFis a professionally
managed, diversifiedportfolio
Like a stock, an ETF can bebought and sold whenever
the market isopen
Transactions in shares of ETFs can result in brokerage commissions and will generate tax consequences. All regulated investment companies are obliged to distribute portfolio gains to shareholders. For more information on the differences between traditional mutual funds and ETFs, see the next slide.
8
Individual stocksETFs /
Mutual Funds
iCRMH1021U/S-1848565-8/29

What are the key differences?Individual Stocks ETFs Mutual funds
Management N/A Typically Passive (index funds) Typically Active
Performance goal N/ATypically to track a benchmark
indexTypically to outperform a
benchmark
Concentration1 Concentrated risk, based on prospects of a single company
Diversified exposure to many securities
Diversified exposure to many securities
Buying/selling sharesCan trade intraday on exchanges at
current market priceCan trade intraday on exchanges
at current market price
Once per day via fund company at end-of-day NAV, less fees.
Early redemption fees may apply.
Minimum investment2 N/A N/AMinimum investment
requirement varies by fund
Holdingstransparency
You own the security you purchased
Typically Disclosed Daily Typically Disclosed Quarterly
Fees Transaction / brokerage costsExpense ratio + transaction /
brokerage costsExpense ratio + any sales loads /
redemption fees
Tax impact ofbuyers/sellers3
Shareholders only impacted by their own action
Shareholders only impacted by their own action
Shareholders may be impacted by other shareholders’ actions
1 Different funds carry different amounts of risks and some funds may be more diversified than others. 2 Stocks and ETFs may be purchased in fractional shares on some platforms. 3 Due to fund structure, mutual fund holders may be subject to taxable capital gains distributions due to other investors’ redemptions directly to the mutual fund. Taxable capital gain distributions can occur to ETF investors based on stocks trading within the fund as the ETF creates and redeems shares and rebalances its holdings. ETFs and stocks will also distribute taxable capital gains when an investor sells their own shares. Certain traditional mutual funds can also be tax efficient.
9iCRMH1021U/S-1848565-9/29

Different goals What are your goals for the investment? What is their role?
10
Individual stocksCompanies you believe in
ActiveSeek to outperform a
benchmark index
IndexSeek to track the performance
of a specific benchmark
Outsized returnsSeek skilled managers deliveringalpha
Efficient market returnsStart with a low-cost,tax-efficient core
What you seek
Concentrated exposureCompanies that you want to own shares of directly
iCRMH1021U/S-1848565-10/29

Indexing can be more than just average
11
IVV US active fund large blend
IJHUS active fund mid-cap blend
IJRUS active
fund small blend
$578K
$434K
$656K
$484K
$691K
$488K
Hypothetical Growth of $100,000 over 20+ years(5/22/2000 to 6/30/2021)
IVV, IJH, and IJR have delivered strong performance over the last 20+ years and have outperformed the average actively managed fund in their Morningstar categories.
Source: Morningstar as of 6/30/2021. Performance data represents past performance and does not guarantee future results. Investment return and principal value will fluctuate with market conditions and may be lower or higher when you sell your shares. Current performance may differ from the performance shown. For most recent month-end performance see www.iShares.com. For standardized performance, please see the end of the presentation. The chart above reflects a hypothetical $100,000 investment and assumes reinvestment of dividends and capital gains. Fund expenses, including management fees and other expenses were deducted. The three active categories shown (US Active Fund Large Blend, US Active Fund Mid-Cap Blend, and US Active Fund Small Blend) are averages calculated by Morningstar that represent the equally weighted return for all actively managed funds in the respective Morningstar Category.
iCRMH1021U/S-1848565-11/29

SELECTING THE RIGHT VEHICLE For your objective
12iCRMH1021U/S-1848565-12/29
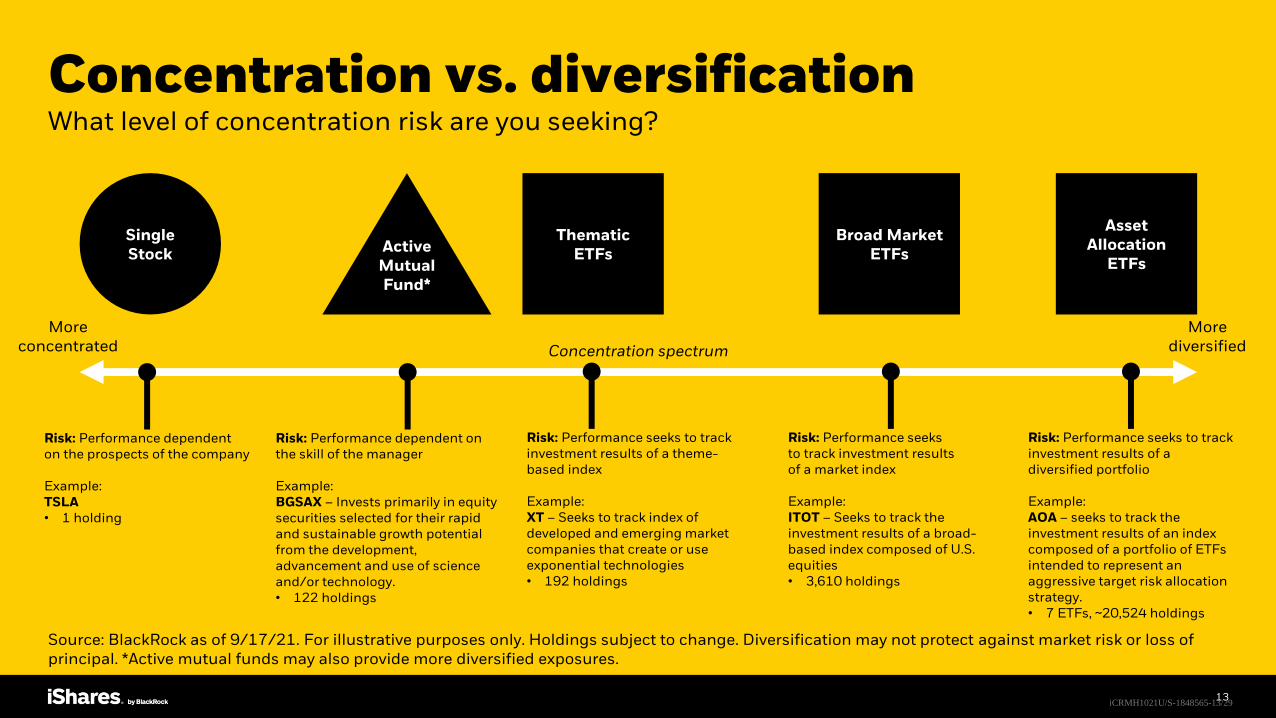
Concentration vs. diversificationWhat level of concentration risk are you seeking?
13
Single Stock Active
Mutual Fund*
Thematic ETFs
Broad Market ETFs
Asset Allocation
ETFs
Concentration spectrum
Risk: Performance dependent on the prospects of the company
Example:TSLA• 1 holding
Risk: Performance dependent on the skill of the manager
Example:BGSAX – Invests primarily in equity securities selected for their rapid and sustainable growth potential from the development, advancement and use of science and/or technology.• 122 holdings
Risk: Performance seeks to track investment results of a theme-based index
Example:XT – Seeks to track index of developed and emerging market companies that create or use exponential technologies• 192 holdings
Risk: Performance seeks to track investment results of a market index
Example:ITOT – Seeks to track the investment results of a broad-based index composed of U.S. equities • 3,610 holdings
Risk: Performance seeks to track investment results of a diversified portfolio
Example:AOA – seeks to track the investment results of an index composed of a portfolio of ETFs intended to represent an aggressive target risk allocation strategy.• 7 ETFs, ~20,524 holdings
Source: BlackRock as of 9/17/21. For illustrative purposes only. Holdings subject to change. Diversification may not protect against market risk or loss of principal. *Active mutual funds may also provide more diversified exposures.
More concentrated
More diversified
iCRMH1021U/S-1848565-13/29
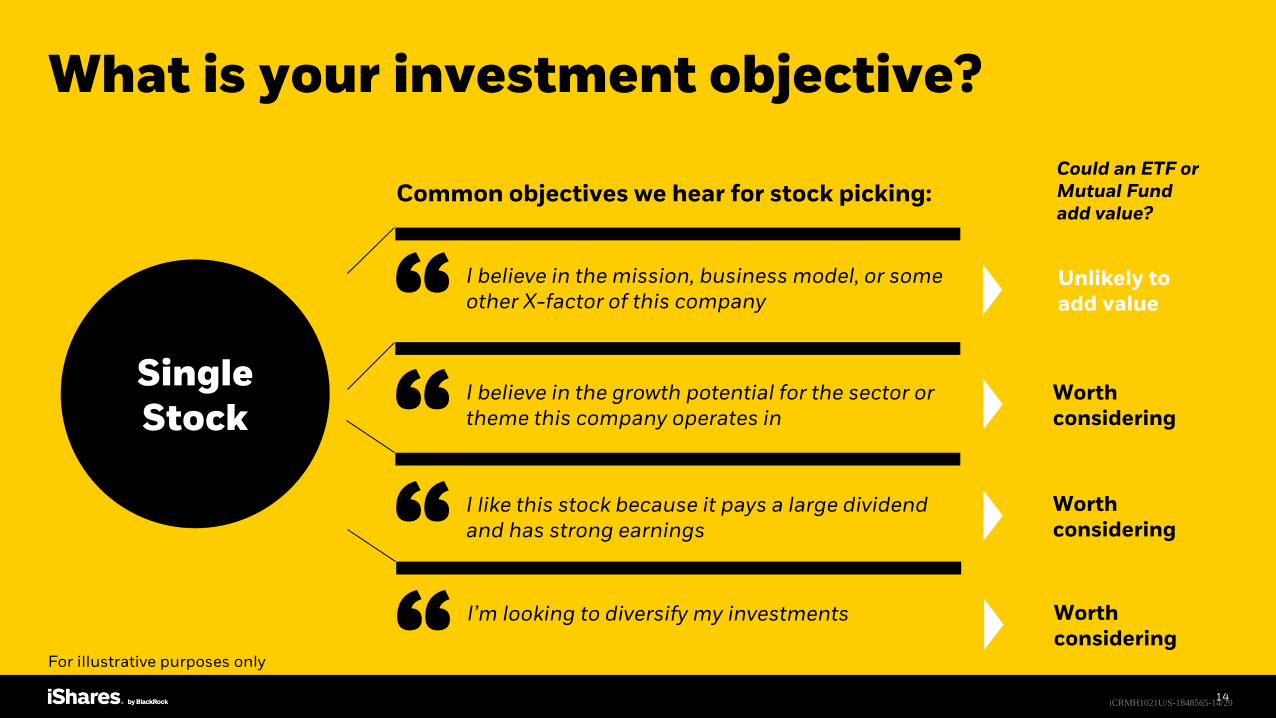
What is your investment objective?
14
Single Stock
I believe in the mission, business model, or some other X-factor of this company
I believe in the growth potential for the sector or theme this company operates in
I like this stock because it pays a large dividend and has strong earnings
Common objectives we hear for stock picking:
Unlikely to add value
Worth considering
Worth considering
Could an ETF or Mutual Fund add value?
For illustrative purposes only
I’m looking to diversify my investments Worth considering
iCRMH1021U/S-1848565-14/29

Case Study: Difficulty of picking the winner
5/99 6/99 7/99 8/99 9/99 10/99 11/99
Spotting the trend: Two “pure-play” e-commerce names had very different charts in 1999
Company A
up 213%
Company B
up 22%
For illustrative purposes only. Source: Bloomberg, May – December 1999.
15iCRMH1021U/S-1848565-15/29

Case Study: Difficulty of picking the winner
Growth from May 19, 1999 to May 30, 2019
For illustrative purposes only. Source: Bloomberg. Amazon total return was 2,502% between 05/19/1999 and 05/30/2019. Includes dividends. 2 eToys filed for bankruptcy in February, 2001. References to specific companies are strictly for illustrative purposes only and should not be construed as investment advice or recommendations regarding those companies. For holdings information for the iShares funds, please visit www.iShares.com.
5/99 5/03 5/07 5/11 5/15 5/19
Amazon gave investors a
25x return1
eToys filed for
bankruptcy2
16
Spotting the trend: They were even more different 20 years later
iCRMH1021U/S-1848565-16/29

Diversification can helpThe US stock market went up 21% last year, but many stocks lost money
47%
lost money
53% 91%
Individual U.S. Stocks U.S. Mutual Funds and ETFs
9%lost
money
Source: Morningstar as of 12/31/2020. Mutual Funds and ETFs are the Morningstar US Equity Category, oldest share class only. Individual US Stocksinclude all securities in the S&P Total Market Index. Analysis does not include obsolete mutual funds, ETFs or stocks as defined by Morningstar. Performanceis historical and does not guarantee or indicate future results.
17
Alternate styles of access
ITOT
IDRV
Total market exposure
iShares Core S&P Total U.S. Stock Market ETF• Expense Ratio: 0.03%
Thematic exposure
iShares Self-Driving EV and Tech ETF• Expense Ratio: 0.47%
iCRMH1021U/S-1848565-17/29

Filtering for specific characteristics
18
For illustrative purposes only. Source: BlackRock as of 8/31/2021. Dividends are not guaranteed and a company’s future ability to pay dividends may be limited. Past performance does not guarantee future results. Investment return and principal value will fluctuate with market conditions and may be lower or higher when you sell your shares. Current performance may differ from the performance shown. For most recent month-end performance see www.iShares.com.For standardized performance, see the end of this presentation.
Some investors screen for stocks with attributes like high dividends and healthy balance sheets. Some ETFs seek to do this for you.
Starting Universe
Multiple Screens
Final portfolio
HDV: iShares Core High Dividend ETF(expense ratio: 0.08%)
Did you know?
Dividends for HDV are paid on a quarterly basis to the investor
Example: seeking income with dividends
Universe of US stocks
High dividend yield
Financial health
Economic moat
75 high quality stocks
30 Day SEC Yield
3.47%
iCRMH1021U/S-1848565-18/29

Building blocks of a diversified portfolio
U.S. Equities
IVV0.03%
IJH0.05%
IJR0.06%
IEFA0.07%
IEMG0.11%
International Equities Bonds
AGG0.04%*
S&P 500
S&PMid Cap
S&PSmall Cap
MSCIDeveloped
MSCIEmerging
U.S.InvestmentGrade
ITOT0.03%
IUSB0.06%*
U.S. Total Bond Market
Total Market
For illustrative purposes only. The strategies discussed are strictly for illustrative and educational purposes and are not a recommendation, offer or solicitation to buy or sell any securities or to adopt any investment strategy. There is no guarantee that any strategies discussed will be effective. *Net expense ratios shown for IUSB and AGG reflect contractual fee waivers in place until 2/29/24 and 6/30/26 respectively. Gross expense ratios is 0.07% for IUSB and 0.05% for AGG. All fees above are as of 6/30/21.
iShares Core US Equity
iShares Core International Equity
iShares Core International Bond
iShares Core US Bond
Portfolio foundation
19
Expense ratios are shown below the ticker symbols.
iCRMH1021U/S-1848565-19/29

Rebalancing a portfolio
80
85
90
95
100
105
110
115
120
125
Jan-20 Feb-20 Mar-20 Apr-20 May-20 Jun-20 Jul-20 Aug-20 Sep-20 Oct-20 Nov-20 Dec-20 Jan-21 Feb-21 Mar-21
Hy
po
the
tic
al
Gro
wth
of
$1
00
60/40 Without Rebalancing 60/40 Rebalanced Portfolio
Source: Morningstar as of 3/31/2021, based to 100, using total return which assumes the reinvestment of dividends. Both portfolios start the year 60% invested in the S&P US Total Market Index and 40% invested in the Bloomberg US Aggregate Bond Index. The 60/40 portfolio rebalanced back to its target weights effective at the close of 3/31/2020. This information does not represent the actual current, past or future holdings or portfolio of any BlackRock client. Index performance is for illustrative purposes only. Index performance does not reflect any management fees, transaction costs or expenses. Indexes are unmanaged and one cannot invest directly in an index. Past performance does not guarantee future results.
A portfolio allocated 60/40 at the start of 2020 could have become a 50/50 portfolio
after the COVID-19 market sell-off
Rebalancing back to the target 60/40 would have packed more of a punch
during the recovery
20iCRMH1021U/S-1848565-20/29

Shortcut: All in oneAsset Allocation ETFs
80%
20%
40%
60%
30%
70% 60%
40%
Stocks
Bonds
Key
Conservative Moderate Growth Aggressive
AOK
EAOK
AOM
EAOM
AOR
EAOR
AOA
EAOA
Source: BlackRock, as of 6/30/21. Allocations shown for illustrative purposes only and are subject to change. The strategies discussed are strictly for illustrative and educational purposes and are not a recommendation, offer or solicitation to buy or sell any securities or to adopt any investment strategy. There is no guarantee that any strategies discussed will be effective.
Core:
Sustainable:
21iCRMH1021U/S-1848565-21/29

TAX & TRADING CONSIDERATIONS
22iCRMH1021U/S-1848565-22/29

Initial considerations
23
How much?What size of investment are
you aiming to make?
Consider:
✓ Fund minimums
✓ Stock and ETF fractional shares
How often?What timeframe are you
planning for this investment?
Consider:
✓ Short-term trading fees
✓ Trading hours
Where?What kind of account are you making this trade in?
Consider:
✓ Taxable vs. non-taxable accounts
For illustrative purposes only.
iCRMH1021U/S-1848565-23/29

Where to invest?
24
Taxable brokerage account
• Contributions: contribute as much after-tax money as you want.
• Withdrawals & Tax: can withdraw whenever you want. Investments subject to both income and capital gains taxes.
• Purpose: general wealth building, and to meet goals before retirement.
Individual retirement account (IRA)
• Contributions: $6,000 per year ($7,000 if age 50+) subject to limits based on annual income.
• Withdrawals & Tax: mandatory at age 70. If before age 59.5, subject to extra 10% penalty. Withdrawals taxed on Traditional, not on Roth.
• Purpose: Long-term, retirement-focused savings due to tax advantaged growth potential.
Source: BlackRock, Internal Revenue Service as of 12/31/20.
iCRMH1021U/S-1848565-24/29

Tax profiles differ by asset and fund type
25
Retirement account (IRA, 401k, etc.)Less tax efficient asset classes
Taxable accountMore tax efficient asset classes
Active Funds
Individual Stocks
Source: Morningstar as of 6/30/2021. 1 Source: Morningstar as of 12/31/2020. Average number of mutual funds that paid a capital gain distribution each year over 10 years compared to exchange traded fund. Universe includes all U.S. open ended mutual funds, oldest share class used. Universe includes all funds incepted before 10/31 in each year and excludes funds that closed before 10/31 in each year. All ETFs are index and active, oldest share class only. Past distributions are not indicative of future distributions.
ETFs
Individual Bonds
Asset LocationWhen implementing an asset allocation,
investors may consider holding more tax efficient assets in taxable
accounts
Did you know?
51% of active mutual funds paid capital gains distributions over the last 10 years vs. only 7.4% of ETFs1
iCRMH1021U/S-1848565-25/29

In summaryGETTING STARTED
TOOLS TO DIY
Individual Securities ETFs Mutual Funds
26
What vehicle meets your goals for the investment?
Where and how are you investing?
iCRMH1021U/S-1848565-26/29

Important notes: Standardized performance for the iShares funds as of 9/30/21
27
Fund NameFund
Inception Date
Gross Expense Ratio
30-Day SEC Yield*
Contractual Fee Waiver Expiration
(If Applicable)
1-Year Returns 5-Year Returns 10-Year Returns Since Inception
NAV Mkt Price NAV Mkt Price NAV Mkt Price NAV Mkt Price
iShares Core S&P 500 ETF 5/15/2000 0.03% 1.24% -- 29.96% 30.06% 16.86% 16.86% 16.58% 16.57% 7.21% 7.20%
iShares Core S&P Mid-Cap ETF 5/22/2000 0.05% 1.07% -- 43.59% 43.66% 12.90% 12.90% 14.63% 14.63% 9.91% 9.91%
iShares Core S&P Small-Cap ETF 5/22/2000 0.06% 1.00% -- 57.51% 57.35% 13.54% 13.54% 15.66% 15.66% 10.58% 10.58%
iShares Core High Dividend ETF 3/29/2011 0.08% 3.47% -- 21.35% 21.41% 6.83% 6.84% 10.42% 10.42% 9.91% 9.91%
*SEC Yield is as of 08/31/21. All Other Data as of 9/30/21
The performance quoted represents past performance of specific funds and does not guarantee future results for such funds. Investment return and principal value of an investment will fluctuate so that an investor’s shares, when sold or redeemed, may be worth more or less than the original cost. Current performance may be lower or higher than the performance quoted. Performance data current to the most recent month end may be obtained by visiting www.iShares.com or www.blackrock.com. Shares of ETFs are bought and sold at market price (not NAV) and are not individually redeemed from the fund. Any applicable brokerage commissions will reduce returns. Beginning August 10, 2020, market price returns for BlackRock and iShares ETFs are calculated using the closing price and account for distributions from the fund. Prior to August 10, 2020, market price returns for BlackRock and iShares ETFs were calculated using the midpoint price and accounted for distributions from the fund. The midpoint is the average of the bid/ask prices at 4:00 PM ET (when NAV is normally determined for most ETFs). The returns shown do not represent the returns you would receive if you traded shares at other times.
iCRMH1021U/S-1848565-27/29

Carefully consider the Funds' investment objectives, risk factors, and charges and expenses before investing. This and other information can be found in the Funds' prospectuses or, if available, the summary prospectuses which may be obtained by visiting www.iShares.com or www.blackrock.com. Read the prospectus carefully before investing.
Investing involves risk, including possible loss of principal.Fixed income risks include interest-rate and credit risk. Typically, when interest rates rise, there is a corresponding decline in bond values. Credit risk refers to the possibility that the bond issuer will not be able to make principal and interest payments. Non-investment-grade debt securities (high-yield/junk bonds) may be subject to greater market fluctuations, risk of default or loss of income and principal than higher-rated securities. There is no guarantee that dividends will be paid.
International investing involves risks, including risks related to foreign currency, limited liquidity, less government regulation and the possibility of substantial volatility due to adverse political, economic or other developments. These risks often are heightened for investments in emerging/developing markets, in concentrations of single countries or smaller capital markets. Funds that concentrate investments in specific industries, sectors, markets or asset classes may underperform or be more volatile than other industries, sectors, markets or asset classes and the general securities market.
A fund's environmental, social and governance (“ESG”) investment strategy limits the types and number of investment opportunities available to the fund and, as a result, the fund may underperform other funds that do not have an ESG focus. A fund's ESG investment strategy may result in the fund investing in securities or industry sectors that underperform the market as a whole or underperform other funds screened for ESG standards. In addition, companies selected by the index provider may not exhibit positive or favorable ESG characteristics.
Investment in a fund of funds is subject to the risks and expenses of the underlying funds.
This material does not constitute any specific legal, tax or accounting advice. Please consult with qualified professionals for this type of advice.
Important notes
28iCRMH1021U/S-1848565-28/29
Investment comparisons are for illustrative purposes only. To better understand the similarities and differences between investments, including investment objectives, risks, fees and expenses, it is important to read the products' prospectuses.
This material contains general information only and does not take into account an individual's financial circumstances. This information should not be relied upon as a primary basis for an investment decision. Rather, an assessment should be made as to whether the information is appropriate in individual circumstances and consideration should be given to talking to a financial professional before making an investment decision.
Prepared by BlackRock Investments, LLC, member FINRA.
The iShares Funds are not sponsored, endorsed, issued, sold or promoted by S&P Dow Jones Indices LLC, nor does this company make any representation regarding the advisability of investing in the Funds. BlackRock Investments, LLC is not affiliated with the company listed above.
This information should not be relied upon as research, investment advice, or a recommendation regarding any products, strategies, or any security in particular. This material is strictly for illustrative, educational, or informational purposes and is subject to change.
© 2021 BlackRock, Inc. All rights reserved. iSHARES and BLACKROCK are trademarks of BlackRock, Inc., or its subsidiaries in the United States and elsewhere. All other marks are the property of their respective owners.
The information provided in this communication is solely for educational purposes and should not be construed as advice or an investment recommendation. Fidelity Investments is a separate company, unaffiliated with BlackRock, Inc.. There is no form of partnership, agency affiliation, or similar relationship between BlackRock, Inc. and Fidelity Investments, nor is such a relationship created or implied by the information herein. Fidelity Investments has not been involved with the preparation of the content supplied by BlackRock, Inc. and does not guarantee or assume any responsibility for its accuracy or completeness.
Important notes continued
29iCRMH1021U/S-1848565-29/29