
DIVORCE IN SOUTH AFRICA: AN OVERVIEW
10
366 DIVORCE IN SOUTH AFRICA: AN OVERVIEW L Ackerman University of the Free State ABSTRACT This article provides an overview of South African divorce figures given for the past five years. The various ways in which divorce figures can be expressed are considered, with specific reference to South Africa. When studying the crude divorce rate, two things become apparent. Firstly, the South African crude divorce rate is relatively low when compared to various other countries (contrary to the popular belief that South Africa has one of the highest divorce rates in the world) and, secondly, the South African divorce rate is rising and will probably continue to rise. In conclusion, it is argued that various macro social forces are likely to increase the number of divorces in the near future. INTRODUCTION Divorce as a societal phenomenon is of interest to most fields in the social sciences, particularly to social work, psychology and sociology. This paper focuses on the various ways in which divorce figures can be reported, with specific reference to South African data. In addition, brief sociological insights into the macro reasons for divorce in South Africa are also presented. COLLECTING DATA In most countries divorce statistics are recorded at a central point. In South Africa this information is recorded at Statistics South Africa 1 . The data in this article that pertain to South Africa were gleaned mainly from this source. Statistics South Africa, through the registrars of the twelve Supreme Courts, administers the divorce form, and data capture and editing are all carried out at Statistics South Africa. It is important to remember that information up to 1999 only included marriages and divorces recorded by the civil registration system and excluded marriages solemnised under customary and certain religious rites 2 . Nevertheless, with the available information, certain trends can be discerned and, once the new information is available, it can be compared to older statistics to see what impact the inclusion of customary marriages has on statistics. In addition, all pre-1994 statistics excluded Black people and thus were not a true representation of the South African population as a whole (for this reason most tables in this article start from 1994). 1 Known as the Central Statistical Service prior to 1999. 2 The vital registration system now recognises and records those marriages solemnised under customary rites – enactment of the Recognition of Customary Marriages Act of 120 of 1998. These new figures have been included from the year 2000 (Statistics South Africa, 1999). http://socialwork.journals.ac.za/ http://dx.doi.org/10.15270/40-4-321
Transcript of DIVORCE IN SOUTH AFRICA: AN OVERVIEW

Social Work/Maatskaplike Werk 2004:40(4)
366
DIVORCE IN SOUTH AFRICA: AN OVERVIEW
L Ackerman
University of the Free State
ABSTRACT
This article provides an overview of South African divorce figures given for the past five years.
The various ways in which divorce figures can be expressed are considered, with specific
reference to South Africa. When studying the crude divorce rate, two things become apparent.
Firstly, the South African crude divorce rate is relatively low when compared to various other
countries (contrary to the popular belief that South Africa has one of the highest divorce rates
in the world) and, secondly, the South African divorce rate is rising and will probably continue
to rise. In conclusion, it is argued that various macro social forces are likely to increase the
number of divorces in the near future.
INTRODUCTION
Divorce as a societal phenomenon is of interest to most fields in the social sciences, particularly to
social work, psychology and sociology. This paper focuses on the various ways in which divorce
figures can be reported, with specific reference to South African data. In addition, brief
sociological insights into the macro reasons for divorce in South Africa are also presented.
COLLECTING DATA
In most countries divorce statistics are recorded at a central point. In South Africa this information
is recorded at Statistics South Africa1. The data in this article that pertain to South Africa were
gleaned mainly from this source. Statistics South Africa, through the registrars of the twelve
Supreme Courts, administers the divorce form, and data capture and editing are all carried out at
Statistics South Africa.
It is important to remember that information up to 1999 only included marriages and divorces
recorded by the civil registration system and excluded marriages solemnised under customary and
certain religious rites2. Nevertheless, with the available information, certain trends can be
discerned and, once the new information is available, it can be compared to older statistics to see
what impact the inclusion of customary marriages has on statistics.
In addition, all pre-1994 statistics excluded Black people and thus were not a true representation of
the South African population as a whole (for this reason most tables in this article start from
1994).
1 Known as the Central Statistical Service prior to 1999.
2 The vital registration system now recognises and records those marriages solemnised under customary rites
– enactment of the Recognition of Customary Marriages Act of 120 of 1998. These new figures have been
included from the year 2000 (Statistics South Africa, 1999).
http://socialwork.journals.ac.za/
http://dx.doi.org/10.15270/40-4-321

Social Work/Maatskaplike Werk 2004:40(4)
367
CLARIFYING CONCEPTS – APPLICATION TO SOUTH AFRICAN DATA
There are basically five ways of reporting divorce statistics. Any social scientist working with
divorce statistics should take note of the various ways in which this information can be expressed
and what each expression entails.
Absolute number of divorces
In this instance the actual number of divorces is counted for a certain area for a certain time period
(usually a year). The actual number of divorces does not reveal information about the actual risk of
divorce, because it does not consider the population base. The absolute number might go up
simply because there are more persons in a population (Starbuck, 2002:404).
TABLE 1
ABSOLUTE NUMBER OF DIVORCES IN SOUTH AFRICA PER POPULATION GROUP
(1990-1999)
Total Asian White Coloured Black Mixed Unspecified
1990 26 669 1421 20 031 5217 -
1991 23 865 1410 17 398 5057 -
1992 28 264 1850 21 006 5408 -
1993 26 616 1676 19 020 5920 -
1994 29 878 1684 18 250 5190 4754
1995 31 592 1601 16 788 5029 8174
1996 32 775 1489 15 831 4190 7243 191 3831
1997 34 231 1685 15 295 4634 7174 184 5259
1998 35 792 1753 14 443 3790 6673 250 8883
1999 37 098 1976 14 785 3938 6823 357 9219
[Compiled from: Statistics South Africa, 1999; Statistics South Africa, 2000b; Statistics South
Africa, 2002b]
The absolute number of divorces in South Africa has shown a steady increase, with 1999 (latest
available figure) showing the highest number of 37 098. Admittedly these numbers may increase
yearly because the actual number of people in South Africa increases yearly. This figure can,
however, give one an indication of the actual number of individuals and children affected by
divorce who may need help.
Divorce-to-marriage ratio
The second way of expressing divorce figures is by taking the number of divorces and dividing
this number by the number of marriages that took place in a given year – this gives a divorce-to-
marriage ratio. Starbuck (2002:404) points out that “Many people read these figures [divorce-to-
marriage ratio] as saying if the figure is .50 they interpret it as 50% of all marriages will end in
divorce. This is not necessarily the case, because the divorces in any given year are from
marriages from many previous years and are being compared to the marriages from only one
year.” Gelles (1995:390) states that: “Of all the possible ways of measuring the risk of divorce,
this one seems to be the most widely reported in the media and the most inaccurate and least
valid!”
http://socialwork.journals.ac.za/
http://dx.doi.org/10.15270/40-4-321
Social Work/Maatskaplike Werk 2004:40(4)
368
TABLE 2
SOUTH AFRICAN DIVORCE-TO-MARRIAGE RATIO (1992-1999)
Year Divorces/marriages Ratio
1992 28 264 / 111 557 0.253
1993 26 616 / 120 159 0.222
1994 29 878 / 133 309 0.224
1995 31 592 / 148 148 0.213
1996 32 775 / 146 732 0.223
1997 34 231 / 146 729 0.233
1998 35 729 / 146 741 0.243
1999 37 098 / 155 807 0.238
[Compiled from: Central Statistical Service, 1995; South African Institute of Race Relations, 1998;
Statistics South Africa, 1999; Statistics South Africa, 2000a; Statistics South Africa, 2000b;
Statistics South Africa, 2002b]
In 1999, 37 098 South Africans got divorced and 155 807 got married. Thus 37 098 divided by
155 807 gives a figure of 0.238. This, however, must not be interpreted as indicating that 23,8% of
all marriages will end in divorce.
The crude divorce rate
This is one of the most common ways of reporting divorce figures. The crude divorce rate can be
defined as the number of divorces per 1000 persons in the population (Davidson & Moore,
1992:460). This rate is obtained by dividing the number of divorces by the number of people in a
population and then multiplying by 1000. Some sources (such as Statistics South Africa) express
this figure per 100 000 of a population (Statistics South Africa, 2002:6). Whether per 1000 or
100 000 (of a population), it is important for a researcher to be able to convert the figure to a
comparable figure. Thus if a figure of 83.4 per 100 000 is given, it should be converted to 0.834
per 1000 when comparing with other countries.
TABLE 3
THE CRUDE DIVORCE RATE OF THE SOUTH AFRICAN POPULATION (1994-1999)
Divorces Population (mid-year
estimates) Crude rate per 1000
1994 29 878 38 630 500 0.7734
1995 31 592 39 477 100 0.8002
1996 32 775 40 342 300 0.8124
1997 34 231 41 226 700 0.8303
1998 35 792 42 130 500 0.8495
1999 37 098 43 054 300 0.8616
[Compiled from: Statistics South Africa, 1999; Statistics South Africa, 2000b; Statistics South
Africa, 2002b; South African Institute of Race Relations, 2000]
In 1999 there were 37 098 divorces in South Africa, divided by a total South African population of
43 054 300 and multiplied by 1000 gives a rate of 0.8616. The crude rate increased progressively
http://socialwork.journals.ac.za/
http://dx.doi.org/10.15270/40-4-321
Social Work/Maatskaplike Werk 2004:40(4)
369
in the 1994-1999 year period. Due to macro societal factors (which will be dealt with later in this
article), this rate will probably continue to rise.
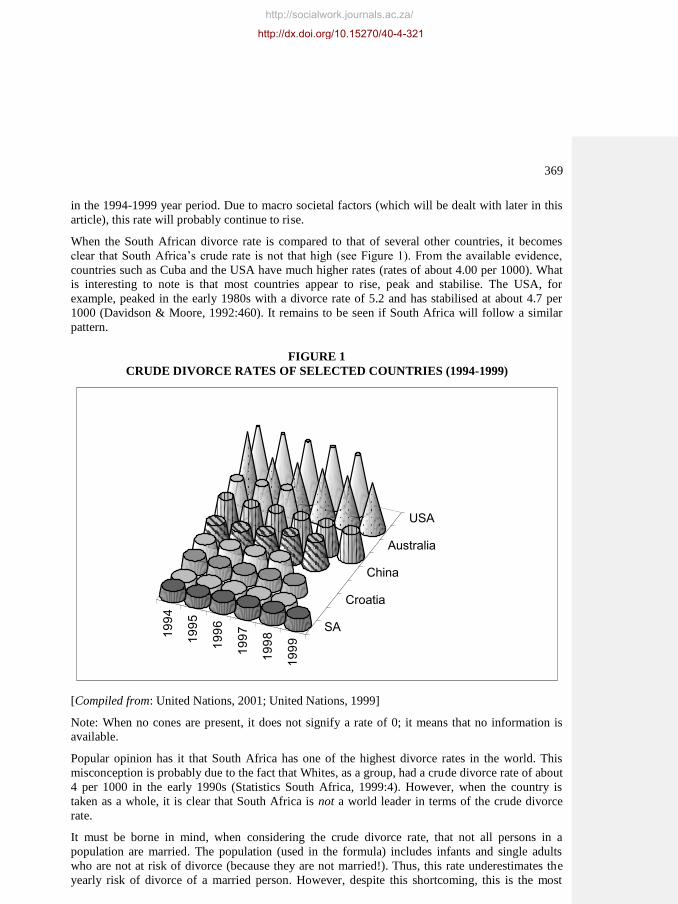
When the South African divorce rate is compared to that of several other countries, it becomes
clear that South Africa’s crude rate is not that high (see Figure 1). From the available evidence,
countries such as Cuba and the USA have much higher rates (rates of about 4.00 per 1000). What
is interesting to note is that most countries appear to rise, peak and stabilise. The USA, for
example, peaked in the early 1980s with a divorce rate of 5.2 and has stabilised at about 4.7 per
1000 (Davidson & Moore, 1992:460). It remains to be seen if South Africa will follow a similar
pattern.
FIGURE 1
CRUDE DIVORCE RATES OF SELECTED COUNTRIES (1994-1999)
1994
1995
1996
1997
1998
1999
SA
Croatia
China
Australia
USA
[Compiled from: United Nations, 2001; United Nations, 1999]
Note: When no cones are present, it does not signify a rate of 0; it means that no information is
available.
Popular opinion has it that South Africa has one of the highest divorce rates in the world. This
misconception is probably due to the fact that Whites, as a group, had a crude divorce rate of about
4 per 1000 in the early 1990s (Statistics South Africa, 1999:4). However, when the country is
taken as a whole, it is clear that South Africa is not a world leader in terms of the crude divorce
rate.
It must be borne in mind, when considering the crude divorce rate, that not all persons in a
population are married. The population (used in the formula) includes infants and single adults
who are not at risk of divorce (because they are not married!). Thus, this rate underestimates the
yearly risk of divorce of a married person. However, despite this shortcoming, this is the most
http://socialwork.journals.ac.za/
http://dx.doi.org/10.15270/40-4-321

Social Work/Maatskaplike Werk 2004:40(4)
370
common way of expressing the divorce rate and is found in most demographic yearbooks and is a
useful tool when comparing various countries with one another.
Refined divorce rate
Another, more precise, way of expressing divorce figures is the refined divorce rate (also termed
the modified crude divorce rate). The refined divorce rate is the number of divorces per 1000
married couples in a society. There are various ways of determining how many married couples
there are in a society (usually the number of married women is used as the denominator). The
refined rate is a more accurate figure as only those at risk of divorce are included in the formula.
However, despite the refined rate being a better way of expressing the divorce rate, most
international figures are expressed as a crude divorce rate.
TABLE 4
THE REFINED DIVORCE RATE FOR SOUTH AFRICA (1994-1999)
Divorces Married couples* Refined rate per 1000 married couples
1994 29 878 38 630 500 5.8966
1995 31 592 39 447 100 6.1011
1996 32 775 40 342 300 6.1570
1997 34 231 41 226 700 6.3303
1998 35 792 42 130 500 6.4770
1999 37 098 43 054 300 6.604
[Compiled from: Statistics South Africa, 1999; Statistics South Africa, 2000b; Statistics South
Africa, 2002b (with the help of Dr S Bah)]
* It is difficult to obtain an accurate figure of married couples in the years between censuses. This
table reflects Statistics South Africa’s calculations. The number of married couples was obtained
for the 1996 census and then the proportion of married couples for the population was worked out.
This proportion was then applied to the mid-year estimates of the years between censuses to
calculate the number of married couples.
The refined rate of 1999 is higher than the crude rate of the same year (6.604 and 0.8616
respectively). The refined rate, like the crude rate, has increased steadily over recent years,
revealing that a greater proportion of married people are getting divorced.
Average marriage risk and marital dissolution and survivorship
The most accurate way of determining what percentage of marriages will end in divorce would be
to determine the average marital risk. “This would be some figure that would indicate what
percentage of marriages that begin in a given year would eventually end in divorce… To calculate
this rate correctly would require a longitudinal study. All marriages registered in 1996, for
example, would be followed until they ended in divorce or death. After all marriages had ended,
the percentage ending in divorce could be calculated. This would take at least until 2076 … or one
could go back to 1916 and see how many marriages of that year ended in divorce. However, since
the divorce rate has gone up since then, that figure would not be very useful for predicting the
stability of today’s marriages” (Starbuck, 2002:405). Gelles (1995:392) claims that it is unlikely
that any researcher would undertake this time-consuming and expensive study – the results of
which would be dated by the time they were available!
http://socialwork.journals.ac.za/
http://dx.doi.org/10.15270/40-4-321

Social Work/Maatskaplike Werk 2004:40(4)
371
Another way of gaining an insight into the chances of a marriage ending in divorce is calculating
the figures that relate to marital dissolution and survivorship. This involves looking at marriages
that started in a certain year and then assessing how many of those marriages had ended in divorce
at the time of study. Thus, for example, one could look at marriages that started in 1993 and then
establish how many of these marriages had ended in divorce by the year 2003. Statistics South
Africa reported this information up until 1994, but unfortunately since this date such information
is no longer included in the “Marriage and Divorce” reports. For example, 30,45 % of all White
marriages that were solemnised in 1973 were dissolved by divorce by 1993 and 13,57% of
marriages that were solemnised in 1990 had already ended in divorce three years later (Central
Statistical Service, 1995:91).
Considering all the above, it is clear that the actual number of divorces is increasing as well as the
divorce rate itself (crude and refined).
MACRO REASONS FOR DIVORCE
When explaining divorce rates, most sociologists divide the reasons for divorce into: macro-level
reasons; demographic variables and interpersonal reasons (Benokraitis, 1996; Gelles, 1995;
Starbuck, 2002). This article will focus only on possible macro reasons for divorce.
When approaching divorce from a macro level one looks at changes in the broader society that:
may cause people to be more unhappy in their particular marriage (here one looks broader
influences that have an effect on expectations within a marriage and definitions of what
constitutes a good marriage);
may make it easier for people to escape an unhappy marriage (a higher divorce rate could
thus in fact point to increased mechanisms to escape an unhappy marriage). It is important to
keep in mind that a low divorce rate does not necessarily mean that marriages are happier,
but rather that individuals do not have ways of getting out of an unhappy marriage.
Legal institutions
When considering the legal institutions, laws prohibiting or making divorces easier have an effect
on the divorce rate. Many sociologists argue that the “no fault” divorce laws of the 1970s had a
tremendous effect on the number of people who divorced in the USA. Divorces became “...more
an administrative matter than an issue battled out in the courts” (Starbuck, 2002:406). Prior to the
divorce reforms, one spouse had to be guilty of some or other misbehaviour (such as adultery,
alcoholism, insanity, etc.), which made it more difficult for people to obtain a divorce. In South
Africa the no-fault divorce Act3 came into effect on 1 July 1979 (Barnard, 1983:39). In the years
following the new act there was a sharp increase in the number of divorces in South Africa
(Burman & Huvers, 1985:125).
In South Africa another two recent laws pertain to the divorce issue. The first is the Divorce
Courts Amendment Act of 1997, which came into effect in April 1998. This law made it possible
for people of all races to apply for divorce in either the High Court or the Central Divorce Court.
Obtaining a divorce in the Central Divorce Court is less costly because litigants do not require
legal representation – this option, prior to April 1998, was open only to Africans, but now – as
stated before – is open to all races (South African Institute of Race Relations, 1998:4). This in
itself could lead to more divorces as they are easier and cheaper to obtain. The second law is the
3 Divorce Act 70 of 1979.
http://socialwork.journals.ac.za/
http://dx.doi.org/10.15270/40-4-321

Social Work/Maatskaplike Werk 2004:40(4)
372
“Recognition of Customary Marriages Act” of 1998. This act provides for the recognition and
regulation of customary marriages (marriages concluded in accordance with customary law). The
act also recognises polygamy in customary marriages. This law will thus have a direct influence
on the number of marriages recorded and therefore ultimately divorce statistics.
Moreover, customary marriages (after commencement of the act) would be in community of
property, unless an antenuptial contract was signed; previously a women did not have any recourse
in the event of divorce unless her husband voluntarily gave her some of the assets (South African
Institute of Race Relations, 1999:4). Thus women in customary marriages may be more likely to
opt for a divorce as they have some form of legal protection, something they did not have in the
past.
Religious institutions
Social institutions are the accepted patterns of behaviour and ultimately shape the behaviour of
members in society. The strongest argument against divorce came from various religions,
prohibiting divorce. However, there has been changes in the way that religious organisations view
divorce and treat those who have been divorced. Many Christian denominations do not object to a
person marrying someone who has previously been divorced and also do not ostracise a member
who has divorced. In addition, the divorce and remarriage of high-profile ministers all point to an
increased acceptance of divorce within certain religious spheres. Changes within the religious
institution have an effect on the decisions that members of a society make. If religious institutions
no longer negatively sanction divorce as they did in the past, divorce becomes an option to be
considered by individual.
Changing gender roles and the entry of women into the labour market
In this instance an increase in the power of women in society in general and in marital
relationships in particular becomes relevant. With the democratisation of South Africa the idea of
equality and non-discrimination enjoys prominence. Values of gender equality are entrenched in
the law and, although gender discrimination has not been eliminated, it is unacceptable in the eyes
of the law and increasingly so in the eyes of members of society.
Coupled to this ideological change regarding equality between men and women is the entry of
women into the labour force. Women have increasingly become part of the labour force in South
Africa, as Table 5 indicates.
TABLE 5
PERCENTAGE OF SOUTH AFRICAN LABOUR FORCE THAT CONSISTS OF
WOMEN FOR SELECTED YEARS
Year Percentage of workforce consisting of women
1960 23%
1985 36%
1991 41%
1994 44%
1996 48%
[Source: De Jong, 1999:78; Popenoe, Cunningham & Boult, 1998:259]
The ideological changes as well as the entry of women into the labour force have the effect of
heightening the power of women in interpersonal relationships. Many sociologists (Benokraitis,
http://socialwork.journals.ac.za/
http://dx.doi.org/10.15270/40-4-321

Social Work/Maatskaplike Werk 2004:40(4)
373
1996:458; Davidson & Moore, 1992:464; Gelles, 1995:394-395) argue that this situation can
increase the likelihood of divorce because as far as women are concerned:
women are becoming more assertive regarding their needs (physical and emotional);
new gender role expectations are starting to arise. For example, women expect men to help
them with domestic tasks, something that has traditionally not been considered a man’s role;
women may experience increased unhappiness if new expectations are not met;
if women are employed, they are more likely to leave a relationship if the above needs are
not met, because they are able to support themselves;
women are more likely to divorce their husbands if the latter are unfaithful, as they are more
able to support themselves;
women may experience work stress and fatigue, which places more stress on the marriage.
On the other hand, the liberation of women also has an effect on the way that men view marriage
and thus also contributes to an increased divorce rate because:
men may feel less guilty about leaving their wives, as they believe that working wives can
care for themselves;
men may feel threatened if their wives earn more than what they do;
men may be unwilling to assist in household tasks they believe (or have been socialised to
believe) are not part of their role description (conflicting expectations regarding roles);
increasing opportunities to get custody of their children may encourage men to leave
unhappy marriages as in the past they had very little chance of getting custody of their
children and for their children’s sake remained in an unhappy marriage.
Looking at South Africa, women are indeed entering the labour force in greater numbers (Table 5)
and are making up a large proportion of the work force and changes regarding role expectations
are taking place. Seeing that much of the research shows that changing gender roles, especially
women’s growing presence in the labour force, are associated with an increase in divorce rates
(Benokraitis, 1996:458), it is likely that this factor will contribute considerably to an increase in
the South African divorce rate.
Cultural values
Although cultural values is a broad topic, one value that pertains to the divorce issue will be
touched on in this section. With an increase in the ideas of individual self-actualisation and self-
fulfilment, divorce is becoming more accepted and not considered as deviant as it was in the past.
In this regard Goode (1982:155) states that there is: “...one change in values has affected choices
in most of the modern world. This is the belief that people have a right to make decisions on the
basis of what they believe will bring them happiness, or satisfy their self-defined needs. This is
given the negative label of ‘hedonism’ in some discussions, and the positive label of ‘self-
fulfilment’ in others.”
The result is that divorce in no longer considered a scandal. Where traditionally marriage was seen
as a sacred institution, the foundation of a good society (Gelles, 1995:395) and as an “indissoluble
bond” (De Jong, 1999:76), this is no longer the case. If behaviour is no longer negatively
sanctioned by the majority of people in society, it makes it easier to engage in. The interaction
http://socialwork.journals.ac.za/
http://dx.doi.org/10.15270/40-4-321

Social Work/Maatskaplike Werk 2004:40(4)
374
between a decrease in negative perceptions regarding divorce and an increase in the more secular
view that you live life once and that life is too short to be wasted in an unhappy marriage has the
effect of increasing the divorce rate.
CONCLUDING COMMENTS
Reviewing the statistics, it is evident that the South African divorce rate (crude rate) is not high
when compared to that of other countries, but all indications are that it is rising steadily and will
probably continue to rise for some time. This can be due to various macro social forces in the
country that contribute to an increased divorce rate. It remains to be seen if the South African
divorce rate will peak, at what level this will happen and whether or not the different groups in
South Africa will eventually manifest similar rates.
However, despite the increase in divorce rate, marriage as an institution has not been rejected as
people continue to marry and remarry after divorce. In 1998 21,5%4 of people entering marriage
(in that year) had previously been divorced – thus divorce does not necessarily signal
dissatisfaction with marriage in general, but rather with a specific marriage.
Acknowledgements
Dr S Bah is acknowledged for his help regarding the calculation of the refined divorce rate.
REFERENCES
BARNARD, A.H. 1983. An evaluation of the divorce act 70 of 1979. Acta Juridica, 39-51.
BENOKRAITIS, N.V. 1996. Marriages and families: Changes choices and constraints (2nd
ed).
London: Prentice Hall.
BURMAN, S. & HUVERS, M. 1985. Church versus State? Divorce legislation and divided South
Africa. Journal of Southern African Studies, 12(1):116-135.
CENTRAL STATISTICAL SERVICE, 1994. South African Statistics 1994. Pretoria.
CENTRAL STATISTICAL SERVICE, 1995. Marriages and Divorces, 1993 (CSS report No.
03-07-01). Pretoria: Central Statistical Service.
CENTRAL STATISTICAL SERVICE, 1996. Marriages and Divorces, 1994 (CSS report No
03-07-01). Pretoria: Central Statistical Services.
CENTRAL STATISTICAL SERVICE, 1998. Marriages and Divorces, 1995 (CSS report No.
03-07-01). Pretoria: Central Statistical Service.
DAVIDSON, J.K. & MOORE, N.B. 1992. Marriage and family. Dubuque (Iowa) USA: Wim C.
Brown Publishers.
DE JONG, M. 1999. New trends regarding the maintenance of spouses upon divorce. Tydskrif vir
Hedendaagse Romeins Hollandse Reg, 62(1):75-87.
GELLES, R.J.1995 Contemporary families: a sociological view. California: Sage.
GOODE, W.J. 1982. The family (2nd
ed). Englewood Cliffs New Jersey: Prentice Hall.
POPENOE, D.; CUNNINGHAM, P. & BOULT, B. 1998. Sociology: First South African
Edition. South Africa: Prentice Hall.
SOUTH AFRICAN INSTITUTE OF RACE RELATIONS, 1998. South Africa Survey 1997/98.
Johannesburg: South African Institute of Race Relations.
4 Calculated from Statistics South Africa, 2000b.
http://socialwork.journals.ac.za/
http://dx.doi.org/10.15270/40-4-321

Social Work/Maatskaplike Werk 2004:40(4)
375
SOUTH AFRICAN INSTITUTE OF RACE RELATIONS, 2000. South Africa Survey
1999/2000 (Millenium edition): Johannesburg: South African Institute of Race Relations.
STARBUCK, G.H. 2002. Families in context. South Melbourne Australia: Wadsworth.
STATISTICS SOUTH AFRICA, 1999. Marriages and Divorces, 1996 (Report No. 03-07-01).
Pretoria: Statistics South Africa.
STATISTICS SOUTH AFRICA, 2000a. South African Statistics 2000. Pretoria: Statistics South
Africa.
STATISTICS SOUTH AFRICA, 2000b. Marriages and Divorces, 1997 and 1998 (Statistical
release P0307). Pretoria: Statistics South Africa.
STATISTICS SOUTH AFRICA, 2002a. South African Statistics 2001. Pretoria: Statistics South
Africa.
STATISTICS SOUTH AFRICA, 2002b. Marriages and Divorces, 1999 (Statistical release
P0307). Pretoria: Statistics South Africa.
STEINMETZ, S.K.; CLAVAN, S. & STEIN, K.F. 1990. Marriage and family realities:
Historical and contemporary perspectives. New York: Harper & Row.
UNITED NATIONS, 1999. Demographic Yearbook 1997 (Forty-ninth issue). Geneva: United
Nations.
UNITED NATIONS, 2001. Demographic Yearbook 1999 (Fifty-first issue). Geneva: United
Nations.
Ms L Ackermann, Lecturer at the Department of Sociology, Faculty of Humanities,
University of the Free State, Bloemfontein, South Africa.
http://socialwork.journals.ac.za/
http://dx.doi.org/10.15270/40-4-321