DIVISION OF AVIATION FISCAL YEAR 2018 BUDGET...
12
Division of Aviation Fiscal Year 2018 Budget Testimony 1 DIVISION OF AVIATION FISCAL YEAR 2018 BUDGET TESTIMONY APRIL 19, 2017 INTRODUCTION Good morning Council President Clarke and Members of City Council. I am Chellie Cameron, Chief Executive Officer of the Philadelphia International Airport. Joining me today are Tracy Borda, Chief Financial Officer, Folasade Olanipekun-Lewis, Chief Administrative Officer, as well as many other members of the Division of Aviation (the Division, or Aviation). DEPARTMENT MISSION & PLANS Mission: Proudly Connecting Philadelphia with the World. The Division is comprised of Philadelphia International Airport (PHL) and Philadelphia Northeast Airport (PNE) (PHL and PNE, collectively “the Airports”). The Division operates as a self-sustaining entity operating without the use of local tax dollars. In its endeavor to make PHL the region’s airport of choice, the Division collaborates with its stakeholders to offer the traveling public safe, clean, modern and convenient air transportation facilities and a wide array of products and services in order to provide a unique traveling experience. FISCAL YEAR 2017 ACCOMPLISHMENTS AND PLANS FOR FISCAL YEAR 2018: Capital Improvements: PHL’s ongoing capital development program manages various large- and small- scale improvements to modernize and enhance existing infrastructure, expand capacity, and improve overall efficiency. Recent projects include the opening of the Terminal E-F secure connector, which allows passengers to move among all Airport terminals without having to leave the secure area. Adjacent to the secure connector, the Airport opened a 34,000-square-foot baggage claim facility in Terminal F, which achieved LEED Gold certification for its Leadership in Energy and Environmental Design. PHL also completed upgrades to its emergency generators to meet Environmental Protection Agency (EPA) guidelines for engine emissions; installed security bollards along the Departures Roadway; constructed a new 2,000-ton salt dome facility building to improve snow removal efforts; upgraded mechanical rooms; replaced roofs in two of its seven terminals; and completed stormwater improvements to increase draining capacity. In order to promote regional economic development and improve customer satisfaction within its facilities, the Airport will look to continue to expand and modernize its facilities. Improvements will include investments to build new, and repair existing, infrastructure, including terminal improvements, with a complete transformation of the dining and retail experience in Terminal B. Additional plans also include: completion of a new Pavement and Grounds Administration Building; restroom upgrades; passenger loading bridge replacements; and other system infrastructure improvements. Renovations to the Airfield will include upgrades to the de-icing facility; completion of the Runway 9R-27L extension; and reconstruction of various taxiways and aprons. Security improvements will consist of the installation of bollards along the Arrivals Roadway; security hardening of critical sites; perimeter fencing; and airfield gate access upgrades. PHL also expects to complete the planning and design work for and begin construction of a consolidated rental car facility.
Transcript of DIVISION OF AVIATION FISCAL YEAR 2018 BUDGET...

Division of Aviation
Fiscal Year 2018 Budget Testimony 1
DIVISION OF AVIATION
FISCAL YEAR 2018 BUDGET TESTIMONY
APRIL 19, 2017
INTRODUCTION
Good morning Council President Clarke and Members of City Council. I am Chellie Cameron, Chief
Executive Officer of the Philadelphia International Airport. Joining me today are Tracy Borda, Chief
Financial Officer, Folasade Olanipekun-Lewis, Chief Administrative Officer, as well as many other
members of the Division of Aviation (the Division, or Aviation).
DEPARTMENT MISSION & PLANS
Mission: Proudly Connecting Philadelphia with the World. The Division is comprised of Philadelphia
International Airport (PHL) and Philadelphia Northeast Airport (PNE) (PHL and PNE, collectively “the
Airports”). The Division operates as a self-sustaining entity operating without the use of local tax dollars.
In its endeavor to make PHL the region’s airport of choice, the Division collaborates with its stakeholders
to offer the traveling public safe, clean, modern and convenient air transportation facilities and a wide array
of products and services in order to provide a unique traveling experience.
FISCAL YEAR 2017 ACCOMPLISHMENTS AND PLANS FOR FISCAL YEAR 2018:
Capital Improvements: PHL’s ongoing capital development program manages various large- and small-
scale improvements to modernize and enhance existing infrastructure, expand capacity, and improve overall
efficiency. Recent projects include the opening of the Terminal E-F secure connector, which allows
passengers to move among all Airport terminals without having to leave the secure area. Adjacent to the
secure connector, the Airport opened a 34,000-square-foot baggage claim facility in Terminal F, which
achieved LEED Gold certification for its Leadership in Energy and Environmental Design. PHL also
completed upgrades to its emergency generators to meet Environmental Protection Agency (EPA)
guidelines for engine emissions; installed security bollards along the Departures Roadway; constructed a
new 2,000-ton salt dome facility building to improve snow removal efforts; upgraded mechanical rooms;
replaced roofs in two of its seven terminals; and completed stormwater improvements to increase draining
capacity.
In order to promote regional economic development and improve customer satisfaction within its facilities,
the Airport will look to continue to expand and modernize its facilities. Improvements will include
investments to build new, and repair existing, infrastructure, including terminal improvements, with a
complete transformation of the dining and retail experience in Terminal B. Additional plans also include:
completion of a new Pavement and Grounds Administration Building; restroom upgrades; passenger
loading bridge replacements; and other system infrastructure improvements. Renovations to the Airfield
will include upgrades to the de-icing facility; completion of the Runway 9R-27L extension; and
reconstruction of various taxiways and aprons. Security improvements will consist of the installation of
bollards along the Arrivals Roadway; security hardening of critical sites; perimeter fencing; and airfield
gate access upgrades. PHL also expects to complete the planning and design work for and begin
construction of a consolidated rental car facility.
Division of Aviation
Fiscal Year 2018 Budget Testimony 2
The Airport, along with its airline partners American Airlines and MarketPlace Philadelphia, will embark
on a capital investment project that will transform Terminal B into a world-class setting that combines
comfort with beautiful, free-flowing spaces. The Terminal will be modernized with the introduction of 15
tech-driven gate lounges that allow guests to order food, drink, and amenities from the comfort of their
gate. Upon completion of the planned project, travelers waiting for a flight will be able to access more than
1,000 iPads positioned throughout restaurants and gate lounges. Featuring the highly-esteemed hospitality
group OTG’s award-winning customer experience platform flo® tech, the iPads will allow guests to track
their flight, browse the web, play games, and order food and amenities from intuitive visual menus, all
delivered directly to their seat. Customers will also have access to more than 1,000 power ports with the
redesigned terminal seating. The transformation of Terminal B is part of the Airport’s goal to improve the
travel experience of its passengers. Construction is expected to be completed in phases over the next 12 to
18 months.
Air Service: PHL endeavors to be the region’s airport of choice by attracting new airlines to serve its
passengers and offering air service to new destinations around the globe. PHL holds the status of being the
trans-Atlantic gateway for American Airlines, PHL’s dominant carrier. PHL currently offers a generous
mix of air carriers that serve over 124 nonstop destinations, including 33 international cities. In an effort to
continue to provide new air service destinations for the region, in October 2016, PHL announced Icelandair
would offer four seasonal nonstop flights per week between PHL and Reykjavik, Iceland, beginning in May
2017. In 2016, Frontier Airlines initiated air service to 13 new cities, including Nashville, New Orleans,
San Antonio, and Austin, among several others. Also, in the last year, PHL has seen additional domestic
service offerings from JetBlue Airways, Alaska Airlines, and Spirit Airlines. In alignment with PHL’s goal
to attract new airlines and offer new air service, PHL will continue its efforts to expand its air service
offerings to underserved domestic and international markets.
Customer Satisfaction: During the past year, the Airport has made numerous changes inside and outside the
terminals to enhance overall customer satisfaction. The Airport recently installed seven Service Animal
Relief Areas (SARAs) inside PHL’s terminals. These SARAs provide passengers a convenient place to take
their service dog, emotional support animal, or pet to relieve themselves without having to exit the terminal.
PHL also worked with one of its concessionaires, Minute Suites, to arrange thirty minutes of free time
inside the suites for nursing mothers. In addition, the Airport has been actively seeking feedback from
passengers by conducting passenger satisfaction surveys. This data is being analyzed to help the Airport
establish new customer satisfaction goals to enhance and create new hospitality and concession offerings.
Results of the surveys will be used to help determine the implementation of new or improved customer
hospitality programs, deployment of staffing and financial resources, possible new concessions and future
capital projects to meet passenger needs.
Enhancing the customer experience is a top priority at PHL. PHL endeavors to be a reflection of the city
and region through its art exhibitions, entertainment program, customer appreciation programs, hospitality,
and concessions. The image of the Airport – its look, feel, and all of its amenities – creates a welcoming
and memorable sense of place. PHL will continue its Exhibitions Program, which features artwork by artists
and arts institutions from the region. In addition, Just Plane Fun, the Airport’s summer-long customer
appreciation program, offers free daily entertainment and activities for travelers of all ages, frequent
promotional item giveaways, and an end-of-summer raffle with great prizes. To make unplanned overnight
stays at the Airport more comfortable for travelers, PHL provides a Hospitality Program that designates
sleeping zones where stranded passengers are provided cots, disposable pillows, and blankets, as well as

Division of Aviation
Fiscal Year 2018 Budget Testimony 3
vanity kits with personal care items. The Airport is also in the process of identifying space within the
terminal buildings to design and build quiet rooms to be used by the traveling public for meditation and
prayer. Lastly, PHL recently negotiated a contract with American Express (AE) to construct a “Centurion
Lounge,” which is an upscale lounge area available to AE cardholders, in Terminal A-West.
Leadership in Diversity & Inclusion: The Airports are committed to involving disadvantaged business
enterprises (DBEs) that possess the necessary qualifications in its contract and business opportunities. The
Division plays an active role in setting and monitoring participation goals for the City’s M/W/DSDBE
Program, and is also responsible for administering two federal DBE programs. The first federal program
applies to all contracts that utilize grant funding from the U.S. Department of Transportation. The Airport
receives significant funding from the Federal Aviation Administration, and all of these contracts carry
federal DBE goals. The second federal program applies to all Airport concession contracts (the Airport
Concession Disadvantaged Business Enterprise (ACDBE) Program). The Airport’s Office of Business
Diversity is responsible for following federal guidelines to set separate goals for these two programs, and
it is one of five organizations in Pennsylvania (and the only City organization) authorized to certify firms
for federal DBE participation. We consistently strive to meet or exceed goals for these three programs, as
evidenced by our achievements. The Division has just begun a third program required by the US
Department of Transportation; our Small Business Program. This program applies to FAA grants.
The Division continues to show its leadership in diversity and inclusion through its contract awards,
outreach events and accolades and has consistently achieved or surpassed its established Disadvantage
Business Enterprises (DBEs) goals. Aviation’s federal DBE goal for the last Federal Fiscal Year was 16.3%
and commitments/awards totaled 18%; our actual achievement on total dollars spent in FFY16 was 27.9%.
For FFY 2016, the Airport’s ACDBE participation goal was 16.5%, and its achievement totaled 26.2%.
The Division’s M/W/DSBE goal for Fiscal Year 2016 was 30%, and actual commitments/awards totaled
29.81%. In the first two quarters of Fiscal Year 2017 we’re achieving 30.89% participation on all contracts.
In October 2016, the Division of Aviation held a Business Opportunity Forum that was attended by more
than 500 business representatives. The event featured a networking session connecting prime contractors
and city agencies with minority firms. Attendees learned about the opportunities at the Airport in breakout
sessions on the vendor experience, professional services opportunities, construction opportunities and
concession opportunities. This year’s Forum focused our outreach to reach firms that actually provide the
kinds of goods and services that the Airport purchases and to outreach to large minority owned firms that
have the ability to be prime contractors on projects and act as mentors to smaller minority firms. We had
success in both of these goals. 90% of attendees rated the Forum as excellent.

Division of Aviation
Fiscal Year 2018 Budget Testimony 4
BUDGET SUMMARY & OTHER BUDGET DRIVERS
Staff Demographics Summary (as of December 2016)
Total Minority White Female
Number of Full-Time Staff 757 550 207 236
Number of Civil Service-Exempt Staff 14 5 9 7
Number of Executive Staff (deputy level
and above) 10 4 6 4
Average Salary, Full-Time Staff $46,466 $42,686 $56,508 $46,670
Average Salary, Civil Service-Exempt
Staff $144,286 $146,000 $143,333 $142,143
Average Salary, Executive Staff $167,000 $157,500 $173,333 $173,750
Median Salary, Full-Time Staff $40,755 $37,451 $48,603 $38,692
Median Salary, Civil Service-Exempt Staff $155,000 $150,000 $160,000 $150,000
Median Salary, Executive Staff $160,000 $155,000 $160,000 $165,000
Aviation Fund Financial Summary by Class – Division of Aviation Only
FY16 Original
Appropriations
FY16 Actual
Obligations
FY17 Original
Appropriations
FY17 Estimated
Obligations
FY18 Proposed
Appropriations
Difference: FY18-
FY17
Class 100 - Employee Compensation $46,218,000 $42,871,271 $47,716,649 $49,755,783 $49,755,783 $0
Class 200 - Purchase of Services $96,372,841 $75,169,808 $103,125,441 $103,125,441 $99,153,000 ($3,972,441)
Class 300 - Materials and Supplies $8,720,000 $5,336,927 $10,401,000 $10,401,000 $8,440,000 ($1,961,000)
Class 400 - Equipment $3,330,000 $849,615 $3,495,000 $3,495,000 $3,345,000 ($150,000)
Class 500 - Contributions $4,205,000 $2,098,956 $4,205,000 $4,205,000 $6,002,500 $1,797,500
Class 700 - Debt Service $0 $0 $0 $0 $0 $0
Class 800 - Payment to Other Funds $24,600,000 $7,539,461 $24,625,000 $24,625,000 $14,625,000 ($10,000,000)
Class 900 - Advances/Misc. Payments $0 $0 $0 $0 $0 $0
$183,455,841 $133,866,038 $193,568,090 $195,607,224 $181,321,283 ($14,285,941)
Aviation Fund Financial Summary by Class (inclusive of funding allocated to other City department budgets)
FY16 Original
Appropriations
FY16 Actual
Obligations
FY17 Original
Appropriations
FY17 Estimated
Obligations
FY18 Proposed
Appropriations
Difference:
FY18-FY17
Class 100 - Employee Compensation $129,068,250 $119,534,533 $132,390,694 $135,236,837 $139,917,218 $4,680,381
Class 200 - Purchase of Services $137,169,138 $107,817,981 $144,338,618 $144,337,618 $141,862,102 ($2,475,516)
Class 300 - Materials and Supplies $10,360,557 $6,714,072 $12,041,557 $12,040,357 $10,226,257 ($1,814,100)
Class 400 - Equipment $8,939,800 $2,774,803 $9,109,800 $9,109,800 $9,091,800 ($18,000)
Class 500 - Contributions $6,717,000 $2,098,956 $6,717,000 $6,717,000 $8,514,500 $1,797,500
Class 700 - Debt Service $123,505,128 $117,461,545 $139,626,331 $139,626,331 $159,428,123 $19,801,792
Class 800 - Payment to Other Funds $24,623,000 $7,539,461 $24,648,000 $24,648,000 $14,648,000 ($10,000,000)
Class 900 - Advances/Misc. Payments $0 $0 $0 $0 $0 $0
$440,382,873 $363,941,351 $468,872,000 $471,715,943 $483,688,000 $11,972,057
Employment Levels (as of December 2016)
Budgeted Filled
Number of Full-Time Positions 900 757
Number of Part-Time Positions 0 0
Number of Civil-Service Exempt
Positions 14 14
Number of Executive Positions 10 10
Average Salary of All Full-Time
Positions $43,315 $46,466
Median Salary of All Full-Time
Positions $43,457 $40,755

Division of Aviation
Fiscal Year 2018 Budget Testimony 5
Professional Services Contracts Summary
FY12 FY13 FY14 FY15 FY16 FY17 YTD
(Q1 & Q2)
Total amount of contracts $69,673,966 $62,159,051 $51,447,924 $67,074,967 $69,437,642 $32,581,360
Total amount to M/W/DSBE $21,811,096 $17,916,458 $15,527,663 $20,736,510 $20,953,089 $8,448,820
Participation Rate 31% 29% 30% 31% 30% 26%
M/W/DSBE Contract Participation Goal
FY16 FY17 FY18
M/W/DSBE Contract Participation Goal 30% 30% 32%

Division of Aviation
Fiscal Year 2018 Budget Testimony 6
PROPOSED BUDGET OVERVIEW
Proposed Funding Request:
The Aviation Fund is an enterprise fund of the City. The Aviation Fund is self-supporting, using aircraft
landing fees, terminal building rent, concession revenue and other facility charges to fund annual expenses.
The total FY 2018 Aviation Fund request is $483.6 million, an $11.9 million or 2.5% increase from the FY
2017 estimated obligations of $471.7 million. The request includes $181.3 million for appropriations for
the Division of Aviation and $142.9 million for appropriations directly related to the Police, Fire, Fleet
Management, Technology, Public Property, Sustainability, Law, Risk Management and Finance
Departments. The $11.9 million increase is inclusive of a $14.2 million decrease to the Division of
Aviation’s appropriations explained in the line item detail below, and also includes an increase of $19.8
million for debt service payments should the Airport issue new bonds in FY 2018. The chart titled
“Financial Summary by Class - Division of Aviation” shows the Division of Aviation’s budget, and the
additional financial summary chart shows the entire Aviation Enterprise Fund’s budget, which includes
funding for other City departments.
The proposed FY 2018 Aviation Fund budget includes:
• $49,755,783 in Class 100. There is no anticipated increase over FY 2017’s projected expenditures.
The original FY 2017 appropriated budget was increased by a mid-year ordinance due to
ratification of the DC 33 contract.
• $99,153,000 in Class 200. This is a reduction of $3,972,441 less than FY 2017 estimated
expenditures due to a decrease in maintenance and repair costs as newer infrastructure is brought
online.
• $8,440,000 in Class 300. It is anticipated that this Class will need $1,961,000 less than the FY 2017
projected expenditures due to one-time or periodic requirements in FY 2017 for upgraded runway
and taxiway lighting and badging supplies.
• $3,345,000 in Class 400. This amount reflects $150,000 less than the FY 2017 projected
expenditures due to a slight reduction in equipment purchases.
• $6,002,500 in Class 500. Aviation anticipates an increase of $1,797,500 over FY 2017 projected
expenditures due to tax obligations on recent and upcoming land acquisitions.
• $14,625,000 in Class 800. This amount reflects $10,000,000 less than the FY 2017 projected
expenditures. In Fiscal Year 2012, approximately $13 million was transferred from Aviation’s
Operating Budget to its Capital Budget for pay-go capital expenditures prior to the setup of a
commercial paper program. The decrease is because the Airport’s commercial paper program is
now established and in full use.

Division of Aviation
Fiscal Year 2018 Budget Testimony 7
STAFFING LEVELS
The Division of Aviation is requesting 900 positions in FY18, level with FY17 budgeted positions. As of
December 2016, the Division had 757 filled positions, not including temporary employees. Historically,
the Airports have had large turnover and difficulty filling custodial and skilled trades positions, which has
impacted our goal of reaching full staffing levels in FY17. In FY18, the Division will continue to work
toward a full complement of permanent employees, which will allow for the development of succession
plans and begin to fill future vacancies related to retirements, including 49 employees in the DROP
program. These positions will also allow the Division to hire additional staff to support improvements
related to customer service, airport facilities and infrastructure.
During calendar year 2016, the Division welcomed 82 new employees – a substantial increase from the 44
hired during 2015. These hires were 44% female and 56% male, and 63% Black, 20% White, 11%
Hispanic, 4% Asian, and 2% Other Races. Of these 82 new hires, 18 are bilingual and collectively speak
10 different languages including Spanish, Urdu, Hindi, French, Punjabi, Gujarati, Vietnamese, Arabic,
Yoruba, and American Sign Language. In total, 81 permanent members of the Aviation staff are bilingual
or multilingual. Thirty-one different languages are spoken amongst these employees; however, this number
grows to 39 languages when you include the 24 temporary employees who are a part of our staff.
NEW HIRES
New Hires
To
tal
Nu
mb
er
Sp
anis
h
Hin
di
Fre
nch
Urd
u
Pu
nja
bi
Gu
jara
ti
Vie
tnam
ese
Ara
bic
Yo
rub
a
Am
eric
an
Sig
n
Lan
gu
age
Black or African
American 52 - - 1 - - - - 1 1 -
Asian 3 - 2 - 1 1 1 1 - - -
Hispanic or Latino 9 8 - - - - - - - - -
White 16 - - - - - - - - - 1
Other 2 - - - - - - - - - -
Total 82 8 2 1 1 1 1 1 1 1 1
Division of Aviation
Fiscal Year 2018 Budget Testimony 8
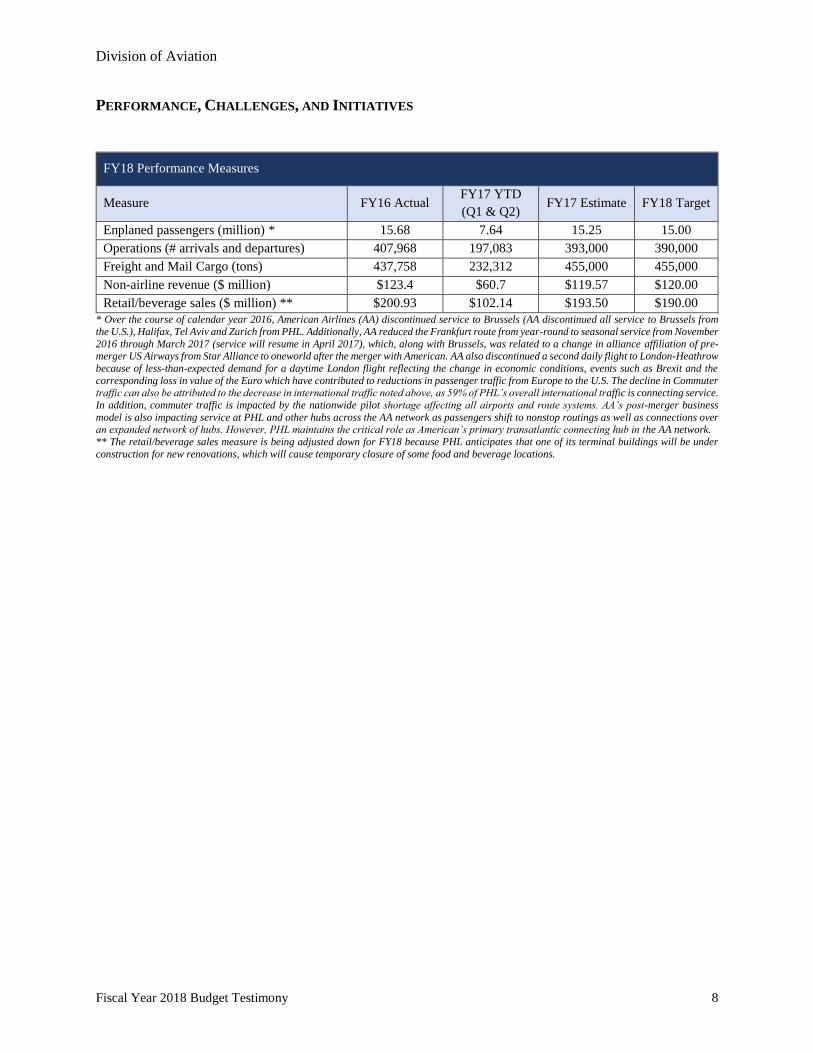
PERFORMANCE, CHALLENGES, AND INITIATIVES
FY18 Performance Measures
Measure FY16 Actual FY17 YTD
(Q1 & Q2) FY17 Estimate FY18 Target
Enplaned passengers (million) * 15.68 7.64 15.25 15.00
Operations (# arrivals and departures) 407,968 197,083 393,000 390,000
Freight and Mail Cargo (tons) 437,758 232,312 455,000 455,000
Non-airline revenue ($ million) $123.4 $60.7 $119.57 $120.00
Retail/beverage sales ($ million) ** $200.93 $102.14 $193.50 $190.00
* Over the course of calendar year 2016, American Airlines (AA) discontinued service to Brussels (AA discontinued all service to Brussels from
the U.S.), Halifax, Tel Aviv and Zurich from PHL. Additionally, AA reduced the Frankfurt route from year-round to seasonal service from November
2016 through March 2017 (service will resume in April 2017), which, along with Brussels, was related to a change in alliance affiliation of pre-merger US Airways from Star Alliance to oneworld after the merger with American. AA also discontinued a second daily flight to London-Heathrow
because of less-than-expected demand for a daytime London flight reflecting the change in economic conditions, events such as Brexit and the
corresponding loss in value of the Euro which have contributed to reductions in passenger traffic from Europe to the U.S. The decline in Commuter traffic can also be attributed to the decrease in international traffic noted above, as 59% of PHL’s overall international traffic is connecting service.
In addition, commuter traffic is impacted by the nationwide pilot shortage affecting all airports and route systems. AA’s post-merger business
model is also impacting service at PHL and other hubs across the AA network as passengers shift to nonstop routings as well as connections over an expanded network of hubs. However, PHL maintains the critical role as American’s primary transatlantic connecting hub in the AA network.
** The retail/beverage sales measure is being adjusted down for FY18 because PHL anticipates that one of its terminal buildings will be under
construction for new renovations, which will cause temporary closure of some food and beverage locations.

Division of Aviation
Fiscal Year 2018 Budget Testimony 9
OTHER BUDGETARY IMPACTS
Federal and State
The Division is keeping a watchful eye on any potential federal budget cuts that may have an impact on our
operations. In addition to bracing for potential cuts, per passenger based funding levels have not been
increased in nearly two decades leading to a decrease in buying power and capital development. Any
alteration to the user fees used for capital development (the Passenger Facility Charge) would need to be
authorized by Congress.
Grant Funding for Operating Requirements
The Transportation Security Administration (TSA) awards grants on an annual basis to help offset the
Airport’s cost of providing explosive detection through canine teams, and law enforcement officer support
at security checkpoints. The current TSA explosive detection canine contract allocates $555,500 per year
to PHL for a total of four years ending in 12/31/2020. The Airport received $392,955 in FFY2016. The
Law Enforcement Officer (LEO) Program funding received in Federal Fiscal Year (FFY) 2016 was
$829,840. The current LEO contract covers three years (FFY2016 - 2018), and it is expected to provide the
same level of funding as in previous years.
Grant Funding for Capital Projects
Under the Federal Aviation Administration’s (FAA) Airport Improvement Program (AIP), PHL Airport
was awarded almost $14 million in funding during FFY 2016 for airfield work being performed related to
the runway extension project. The Airport anticipates receiving approximately $5.5 million in AIP
entitlement funding for FFY 2017 and has applied for an additional $11 million in AIP discretionary
funding in FFY 2017.
FAA AIP entitlement funding of $150,000 for capital projects is received each year for Philadelphia
Northeast Airport (PNE). The FY2017 appropriation is scheduled to fund the airfield signage project
presently being bid.
PHL receives a state grant for $800,000 annually from the Pennsylvania Department of Transportation’s
Aviation Development Program through the Bureau of Aviation. This grant is a match to the AIP funds the
airport receives. PNE also receives a state matching grant which equals half of the local portion of the AIP
funded project(s).
Division of Aviation
Fiscal Year 2018 Budget Testimony 10
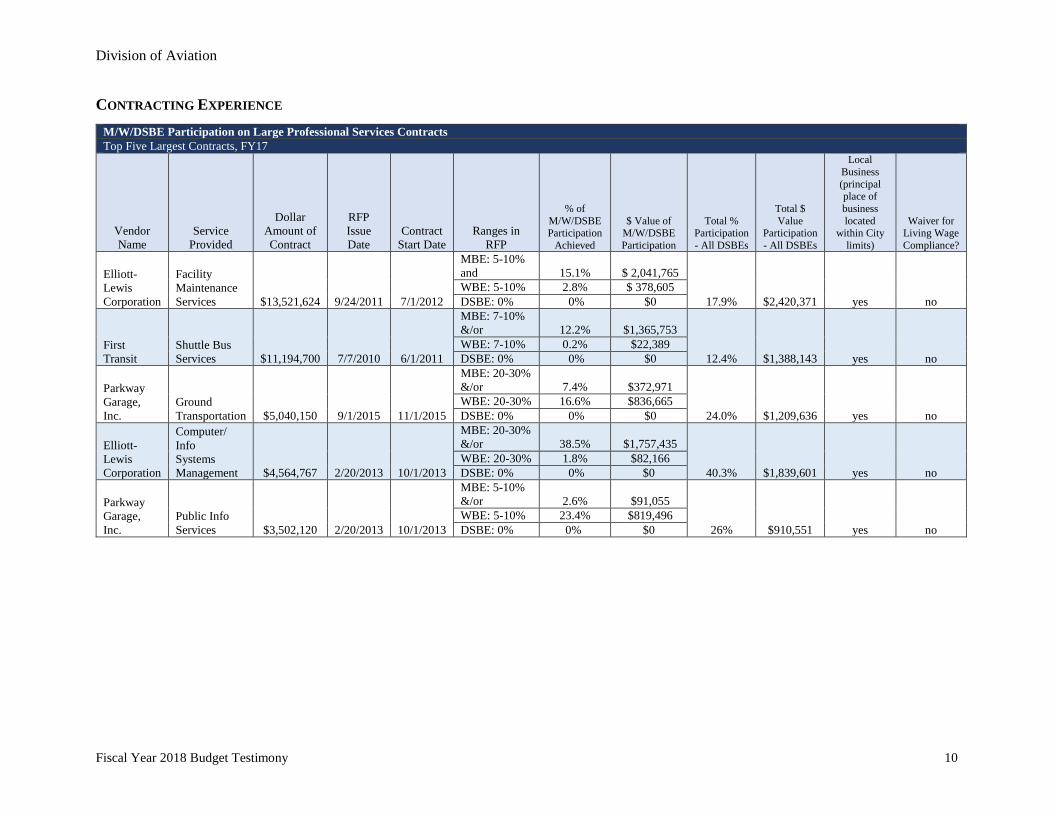
CONTRACTING EXPERIENCE
M/W/DSBE Participation on Large Professional Services Contracts
Top Five Largest Contracts, FY17
Vendor
Name
Service
Provided
Dollar
Amount of
Contract
RFP
Issue
Date
Contract
Start Date
Ranges in
RFP
% of
M/W/DSBE Participation
Achieved
$ Value of M/W/DSBE
Participation
Total % Participation
- All DSBEs
Total $
Value Participation
- All DSBEs
Local
Business
(principal place of
business
located within City
limits)
Waiver for Living Wage
Compliance?
Elliott-
Lewis
Corporation
Facility
Maintenance
Services $13,521,624 9/24/2011 7/1/2012
MBE: 5-10%
and 15.1% $ 2,041,765
17.9% $2,420,371 yes no
WBE: 5-10% 2.8% $ 378,605
DSBE: 0% 0% $0
First
Transit
Shuttle Bus
Services $11,194,700 7/7/2010 6/1/2011
MBE: 7-10%
&/or 12.2% $1,365,753
12.4% $1,388,143 yes no
WBE: 7-10% 0.2% $22,389
DSBE: 0% 0% $0
Parkway
Garage,
Inc.
Ground
Transportation $5,040,150 9/1/2015 11/1/2015
MBE: 20-30%
&/or 7.4% $372,971
24.0% $1,209,636 yes no
WBE: 20-30% 16.6% $836,665
DSBE: 0% 0% $0
Elliott-
Lewis
Corporation
Computer/
Info
Systems
Management $4,564,767 2/20/2013 10/1/2013
MBE: 20-30%
&/or 38.5% $1,757,435
40.3% $1,839,601 yes no
WBE: 20-30% 1.8% $82,166
DSBE: 0% 0% $0
Parkway
Garage,
Inc.
Public Info
Services $3,502,120 2/20/2013 10/1/2013
MBE: 5-10%
&/or 2.6% $91,055
26% $910,551 yes no
WBE: 5-10% 23.4% $819,496
DSBE: 0% 0% $0
Division of Aviation
Fiscal Year 2018 Budget Testimony 11
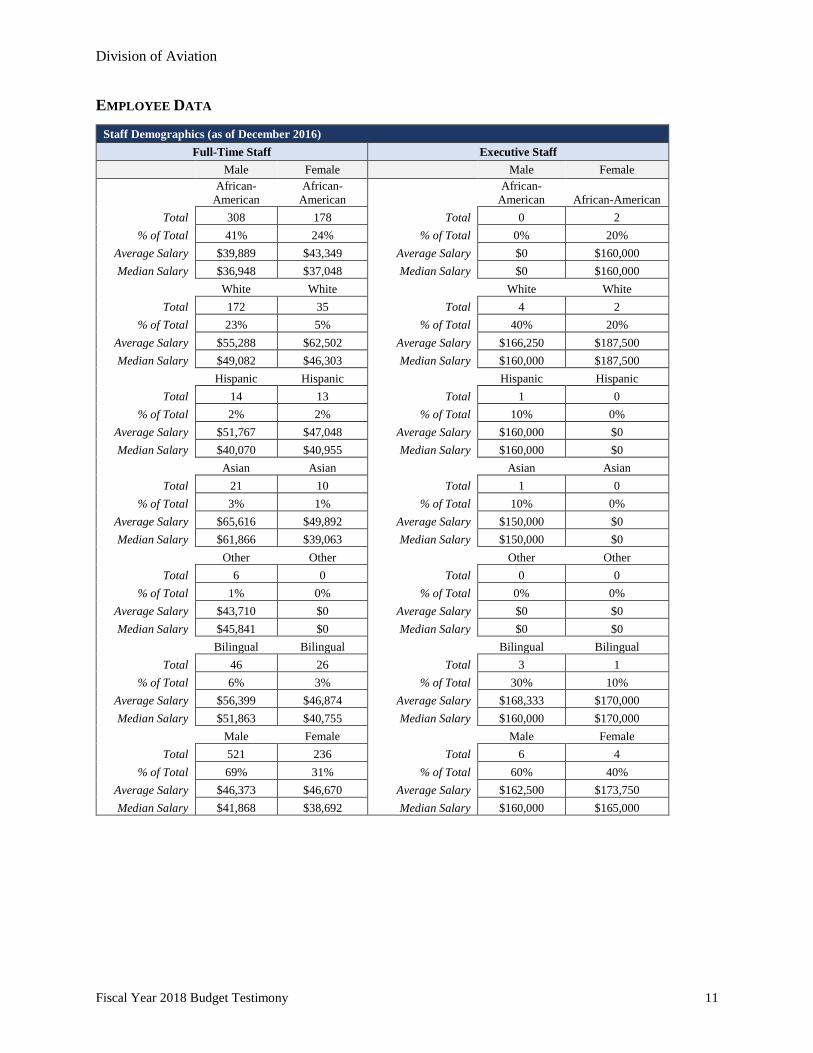
EMPLOYEE DATA
Staff Demographics (as of December 2016)
Full-Time Staff Executive Staff
Male Female Male Female
African-
American
African-
American
African-
American African-American
Total 308 178 Total 0 2
% of Total 41% 24% % of Total 0% 20%
Average Salary $39,889 $43,349 Average Salary $0 $160,000
Median Salary $36,948 $37,048 Median Salary $0 $160,000
White White White White
Total 172 35 Total 4 2
% of Total 23% 5% % of Total 40% 20%
Average Salary $55,288 $62,502 Average Salary $166,250 $187,500
Median Salary $49,082 $46,303 Median Salary $160,000 $187,500
Hispanic Hispanic Hispanic Hispanic
Total 14 13 Total 1 0
% of Total 2% 2% % of Total 10% 0%
Average Salary $51,767 $47,048 Average Salary $160,000 $0
Median Salary $40,070 $40,955 Median Salary $160,000 $0
Asian Asian Asian Asian
Total 21 10 Total 1 0
% of Total 3% 1% % of Total 10% 0%
Average Salary $65,616 $49,892 Average Salary $150,000 $0
Median Salary $61,866 $39,063 Median Salary $150,000 $0
Other Other Other Other
Total 6 0 Total 0 0
% of Total 1% 0% % of Total 0% 0%
Average Salary $43,710 $0 Average Salary $0 $0
Median Salary $45,841 $0 Median Salary $0 $0
Bilingual Bilingual Bilingual Bilingual
Total 46 26 Total 3 1
% of Total 6% 3% % of Total 30% 10%
Average Salary $56,399 $46,874 Average Salary $168,333 $170,000
Median Salary $51,863 $40,755 Median Salary $160,000 $170,000
Male Female Male Female
Total 521 236 Total 6 4
% of Total 69% 31% % of Total 60% 40%
Average Salary $46,373 $46,670 Average Salary $162,500 $173,750
Median Salary $41,868 $38,692 Median Salary $160,000 $165,000
Division of Aviation
Fiscal Year 2018 Budget Testimony 12
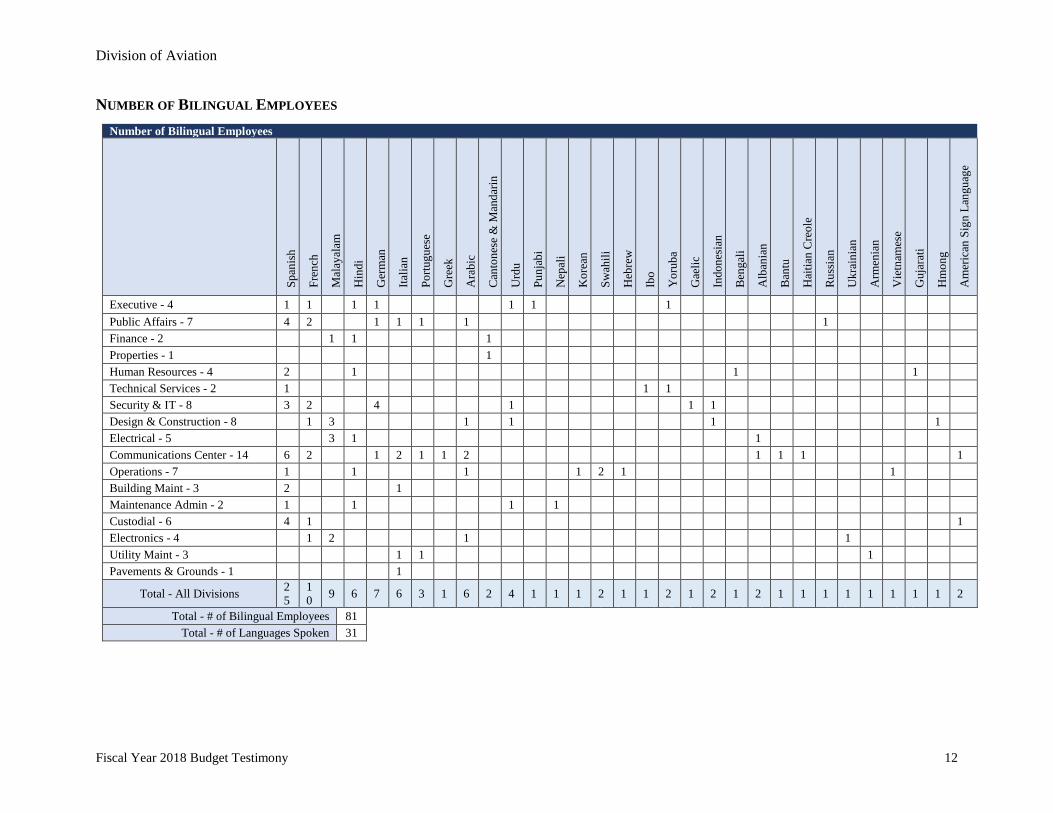
NUMBER OF BILINGUAL EMPLOYEES
Number of Bilingual Employees
Sp
anis
h
Fre
nch
Mal
ayal
am
Hin
di
Ger
man
Ital
ian
Po
rtug
ues
e
Gre
ek
Ara
bic
Can
ton
ese
& M
and
arin
Urd
u
Pu
nja
bi
Nep
ali
Ko
rean
Sw
ahil
i
Heb
rew
Ibo
Yo
rub
a
Gae
lic
Indo
nes
ian
Ben
gal
i
Alb
ania
n
Ban
tu
Hai
tian
Cre
ole
Ru
ssia
n
Uk
rain
ian
Arm
enia
n
Vie
tnam
ese
Gu
jara
ti
Hm
on
g
Am
eric
an S
ign
Lan
gu
age
Executive - 4 1 1 1 1 1 1 1
Public Affairs - 7 4 2 1 1 1 1 1
Finance - 2 1 1 1
Properties - 1 1
Human Resources - 4 2 1 1 1
Technical Services - 2 1 1 1
Security & IT - 8 3 2 4 1 1 1
Design & Construction - 8 1 3 1 1 1 1
Electrical - 5 3 1 1
Communications Center - 14 6 2 1 2 1 1 2 1 1 1 1
Operations - 7 1 1 1 1 2 1 1
Building Maint - 3 2 1
Maintenance Admin - 2 1 1 1 1
Custodial - 6 4 1 1
Electronics - 4 1 2 1 1
Utility Maint - 3 1 1 1
Pavements & Grounds - 1 1
Total - All Divisions 2
5
1
0 9 6 7 6 3 1 6 2 4 1 1 1 2 1 1 2 1 2 1 2 1 1 1 1 1 1 1 1 2
Total - # of Bilingual Employees 81 Total - # of Languages Spoken 31