DIVISION I WOMEN’S VOLLEYBALL RECORDS
66
Individual Records 2 Individual Leaders 4 Annual Individual Champions 19 Team Records 21 Team Leaders 23 Division I Winningest Teams 38 Annual Team Champions 40 AVCA Final Division I Polls 42 2020 AVCA Weekly Division I Polls 46 Division I Alignment History 47 DIVISION I WOMEN’S VOLLEYBALL RECORDS
Transcript of DIVISION I WOMEN’S VOLLEYBALL RECORDS

Individual Records 2Individual Leaders 4Annual Individual Champions 19Team Records 21Team Leaders 23Division I Winningest Teams 38Annual Team Champions 40AVCA Final Division I Polls 422020 AVCA Weekly Division I Polls 46Division I Alignment History 47
DIVISION I WOMEN’S
VOLLEYBALLRECORDS

Individual Records 2
The format of a match changed in 2008. The term “game” was changed to “set.” In addition, scoring for those sets moved from 30 points to 25 points, except in matches that go to the full five sets, in which the fifth set is still played to 15. The match format previously changed in 2001, with scoring for each set moving from 15 points to 30 points, except in matches that went the full five sets, in which the winning score again remained at 15. In reflection of these changes, category leaders under the different scoring formats are separated in order to avoid eliminating the achievements of those student-athletes who played under the previ-ous formats.Official NCAA volleyball records began with the 1981 season and are based on information submit-ted to the NCAA statistics service by institutions participating in the statistics rankings. In statisti-cal rankings, the rounding of percentages and/or averages may indicate ties where none exists. In these cases, the numerical order of the rankings is accurate.In 2011, individual season blocking categories were added for seasons since 2001. Research continues on single match and career data for those seasons. Information on blocking from 1981 to 2000 has not been included in the following records since there appeared to be a significant variance in the methods by which blocking statistics were kept during those years. Official career records include players whose career statistics were recorded during the era of official NCAA play. The 2020 season was split between the fall of 2020 and spring of 2021 due to the COVID-19 pandemic. The minimum number of matches played during the 2020 season for record book inclusion in single-season per game categories was 10 matches, which was the minimum required for at-large NCAA championship consideration.
ATTACKKillsThree-set match
40—Catalina Suarez, Kansas City vs. Northwest Mo. St., Nov. 4, 1989
Four-set match47—Sarah Noriega, LMU (CA) vs. San Diego,
Nov. 7, 1997Five-set match
56—Svetlana Vtyurina, George Washington vs. Georgetown, Sept. 14, 1995
Season965—Jill McCreary, Akron, 1990 (182 sets)
Career3,043—Svetlana Vtyurina, George Washington,
1992-95 (488 sets)
Kills Per SetSeason
7.78—Sarah McFarland, LMU (CA), 2000 (762 kills in 98 sets)
Career6.43—Sarah McFarland, LMU (CA), 1997-00
(2,020 kills in 314 sets)
Total AttacksThree-set match
89—Shelly Smith, Oregon St. vs. California, Nov. 12, 1993
Four-set match111—Sarah McFarland, LMU (CA) vs. Notre
Dame, Sept. 21, 2000Five-set match
119—Mindy Rice, Idaho vs. Montana, Nov. 19, 1994
Season2,175—Jill McCreary, Akron, 1990 (182 sets)
Career6,633—^Michelle Collier, South Fla., 1998-02
(481 sets)^Received medical redshirt for the 1999 season.
Attacks Per SetSeason
17.04—Sarah McFarland, LMU (CA), 2000 (1,670 attacks in 98 sets)
Career14.03—Sarah McFarland, LMU (CA), 1997-00
(4,405 attacks in 314 sets)
Hitting Percentage*10 or more attacks
1.000—Many times: Best performances: Shaney Lipscomb, New Mexico St. vs. Seattle U, March 2, 2021 (14-0/14); Sarah Barham, Wofford vs. The Citadel, Feb. 28, 2021 (11-0/11)/ Abbie Lehman, Wichita St. vs. Bradley, Oct. 25, 2014 (15-0/15); Samantha Thrower, Indiana vs. Buffalo, Sept. 3, 2011 (15-0/15); Katie Silliman, Arkansas St. vs. Jackson St., Oct. 11, 1998 (15-0/15)
15 or more attacks1.000—Abbie Lehman, Wichita St. vs. Bradley,
Oct. 25, 2014 (15-0/15); Samantha Thrower, Indiana vs. Buffalo, Sept. 3, 2011 (15-0/15); Katie Silliman, Arkansas St. vs. Jackson St., Oct. 11, 1998 (15-0/15)
20 or more attacks.955—Cathy Petrissans, LMU (CA) vs. Northern
Ariz., Oct. 11, 1986 (21-0/22)Season
.540—Arielle Wilson, Penn St., 2009 (337-36/557)
Career.476—Chloe Mann, Florida, 2010-13 (902-
134/1,614 in 297 sets)*Hitting percentage is derived by subtracting errors from kills and dividing that difference by total attacks.
SETTINGAssistsThree-set match
78—Janice Mounts, Southern California vs. Washington St., Oct. 11, 1996
Four-set match107—Jamie Pilbeam, UC Irvine vs. UTSA, Sept.
7, 2000Five-set match
109—Lori Endicott, Nebraska vs. Texas, Nov. 5, 1988
Season2,026—Tami Hamilton, BYU, 1984 (157 sets)
Career6,650—Tammy Robertson, UAB, 1989-92 (620
sets)
Assists Per SetSeason
15.54—Disney Bronnenberg, Kansas St., 1998 (1,694 assists in 109 sets)
Career14.56—Courtney Thompson, Washington,
2003-06 (6,552 assists in 450 sets)
SERVICEService AcesThree-set match
15—Jennifer Brandt, Nicholls St. vs. Alcorn, Sept. 14, 2011; Ivana Cebakova, American vs. Lehigh, Nov. 7, 2008; Veronica Canto-Ponce, Lafayette vs. Delaware St., Sept. 13, 2003; Janelle Tomlinson, Green Bay vs. Chicago St., Sept. 23, 2001
Four-set match16—Suzanne Negrotta, Southeastern La. vs.
Mississippi Val., Oct. 13, 1989Five-set match
14—Jackie Mendez, San Diego St. vs. Fresno St., Sept. 16, 1988; Marlene Melancon, New Orleans vs. Southeastern La., Sept. 20, 1983
Season207—Eileen Nicole Rodriguez, Albany (NY),
2002 (113 sets)Career
547—Eileen Nicole Rodriguez, Albany (NY), 2002-05 (453 sets)
Service Aces Per SetSeason
1.832—Eileen Nicole Rodriguez, Albany (NY), 2002 (207 aces in 113 sets)
Career1.227—Stephanie Cisneros, Hampton, 2003
(108 aces in 88 sets)
Consecutive Points Served
22—Chelsea Gebben, Mercer vs. Savannah St., Oct. 13, 2006
Consecutive Points Served To Start Match
13—Allison Kearney, Arkansas St. vs. Alcorn, Sept. 16, 2011
BLOCKINGTotal Blocks (Since 2001)Season
250—Melissa Elmer, Nebraska, 2005 (115 sets, 17 solo, 233 assists)
Blocks Per Set (Since 2001)Season
2.17—Melissa Elmer, Nebraska, 2005 (250 total blocks in 115 sets)
INDIVIDUAL RECORDS

Individual Records 3
DEFENSEDigsThree-set match
50—Chelsee Goins, Grambling vs. Jackson St., Oct. 29, 2011; Sydney Donahue, Arizona St. vs. LMU (CA), Aug. 26, 2006
Four-set match56—Catalina Suarez, Kansas City vs. UTEP,
Sept. 29, 1989Five-set match
62—Jessica Strama, McNeese vs. UT Arlington, Oct. 13, 2006
Season (1981-2000)777—Kim Diehlmann, Hartford, 1990 (152 sets)
Season with 30-point scoring format (2001-03)786—Sarah Gascon, Southeastern La., 2003
(118 sets)Season with 30-point scoring format/unlimited libero substitutions (2004-07)
942—Lara Newberry, Chattanooga, 2007 (131 sets)
Season with 25-point scoring format/unlimited libero substitutions (2008-present)
852—Kasey Elswick, UT Martin, 2011 (131 sets)Career
3,176—Lara Newberry, Chattanooga, 2005-08 (483 sets)
Digs Per SetSeason (1981-2000)
6.19—Catalina Suarez, Kansas City, 1989 (644 digs in 104 sets)
Season with 30-point scoring format (2001-03)6.66—Sarah Gascon, Southeastern La., 2003
(786 digs in 118 sets)Season with 30-point scoring format/unlimited libero substitutions (2004-07)
7.68—Amanda McCormick, Ball St., 2006 (852 digs in 111 sets)
Season with 25-point scoring format/unlimited libero substitutions (2008-present)
6.87—Kim Maroon, Villanova, 2011 (749 digs in 109 sets)
Career6.58—Lara Newberry, Chattanooga, 2005-08
(3,176 digs in 483 sets)
MISCELLANEOUSMatches PlayedCareer
172—Margie Kolat, Arkansas St., 1991-94
Consecutive Matches PlayedCareer
159—Cathy Koontz, Arkansas St., 1992-95
Sets PlayedCareer
649—Claudia Orban, Akron, 1988-91
Consecutive Sets PlayedCareer
551—Tuba Meto, Southeast Mo. St., 1994-97
Individual Leaders 4
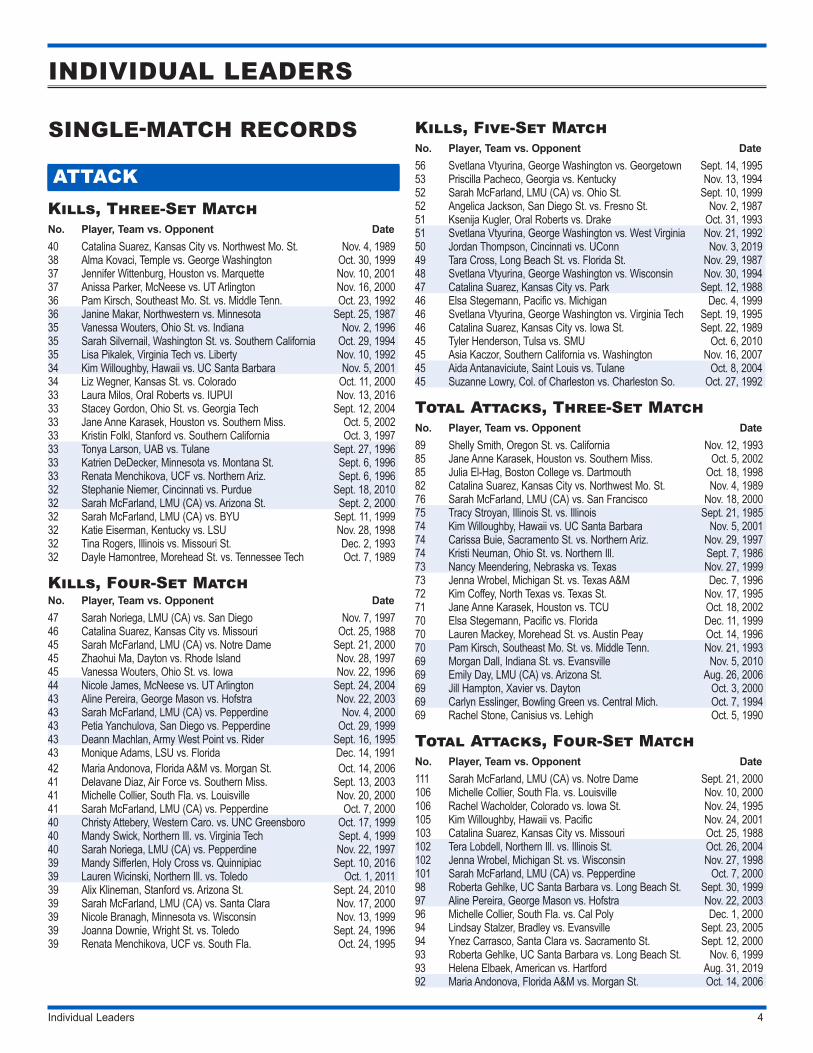
SINGLE-MATCH RECORDS
ATTACKKills, Three-Set MatchNo. Player, Team vs. Opponent Date 40 Catalina Suarez, Kansas City vs. Northwest Mo. St. Nov. 4, 198938 Alma Kovaci, Temple vs. George Washington Oct. 30, 199937 Jennifer Wittenburg, Houston vs. Marquette Nov. 10, 200137 Anissa Parker, McNeese vs. UT Arlington Nov. 16, 200036 Pam Kirsch, Southeast Mo. St. vs. Middle Tenn. Oct. 23, 199236 Janine Makar, Northwestern vs. Minnesota Sept. 25, 198735 Vanessa Wouters, Ohio St. vs. Indiana Nov. 2, 199635 Sarah Silvernail, Washington St. vs. Southern California Oct. 29, 199435 Lisa Pikalek, Virginia Tech vs. Liberty Nov. 10, 199234 Kim Willoughby, Hawaii vs. UC Santa Barbara Nov. 5, 200134 Liz Wegner, Kansas St. vs. Colorado Oct. 11, 200033 Laura Milos, Oral Roberts vs. IUPUI Nov. 13, 201633 Stacey Gordon, Ohio St. vs. Georgia Tech Sept. 12, 200433 Jane Anne Karasek, Houston vs. Southern Miss. Oct. 5, 200233 Kristin Folkl, Stanford vs. Southern California Oct. 3, 199733 Tonya Larson, UAB vs. Tulane Sept. 27, 199633 Katrien DeDecker, Minnesota vs. Montana St. Sept. 6, 199633 Renata Menchikova, UCF vs. Northern Ariz. Sept. 6, 199632 Stephanie Niemer, Cincinnati vs. Purdue Sept. 18, 201032 Sarah McFarland, LMU (CA) vs. Arizona St. Sept. 2, 200032 Sarah McFarland, LMU (CA) vs. BYU Sept. 11, 199932 Katie Eiserman, Kentucky vs. LSU Nov. 28, 199832 Tina Rogers, Illinois vs. Missouri St. Dec. 2, 199332 Dayle Hamontree, Morehead St. vs. Tennessee Tech Oct. 7, 1989
Kills, Four-Set MatchNo. Player, Team vs. Opponent Date 47 Sarah Noriega, LMU (CA) vs. San Diego Nov. 7, 199746 Catalina Suarez, Kansas City vs. Missouri Oct. 25, 198845 Sarah McFarland, LMU (CA) vs. Notre Dame Sept. 21, 200045 Zhaohui Ma, Dayton vs. Rhode Island Nov. 28, 199745 Vanessa Wouters, Ohio St. vs. Iowa Nov. 22, 199644 Nicole James, McNeese vs. UT Arlington Sept. 24, 200443 Aline Pereira, George Mason vs. Hofstra Nov. 22, 200343 Sarah McFarland, LMU (CA) vs. Pepperdine Nov. 4, 200043 Petia Yanchulova, San Diego vs. Pepperdine Oct. 29, 199943 Deann Machlan, Army West Point vs. Rider Sept. 16, 199543 Monique Adams, LSU vs. Florida Dec. 14, 199142 Maria Andonova, Florida A&M vs. Morgan St. Oct. 14, 200641 Delavane Diaz, Air Force vs. Southern Miss. Sept. 13, 200341 Michelle Collier, South Fla. vs. Louisville Nov. 20, 200041 Sarah McFarland, LMU (CA) vs. Pepperdine Oct. 7, 200040 Christy Attebery, Western Caro. vs. UNC Greensboro Oct. 17, 199940 Mandy Swick, Northern Ill. vs. Virginia Tech Sept. 4, 199940 Sarah Noriega, LMU (CA) vs. Pepperdine Nov. 22, 199739 Mandy Sifferlen, Holy Cross vs. Quinnipiac Sept. 10, 201639 Lauren Wicinski, Northern Ill. vs. Toledo Oct. 1, 201139 Alix Klineman, Stanford vs. Arizona St. Sept. 24, 201039 Sarah McFarland, LMU (CA) vs. Santa Clara Nov. 17, 200039 Nicole Branagh, Minnesota vs. Wisconsin Nov. 13, 199939 Joanna Downie, Wright St. vs. Toledo Sept. 24, 199639 Renata Menchikova, UCF vs. South Fla. Oct. 24, 1995
Kills, Five-Set MatchNo. Player, Team vs. Opponent Date 56 Svetlana Vtyurina, George Washington vs. Georgetown Sept. 14, 199553 Priscilla Pacheco, Georgia vs. Kentucky Nov. 13, 199452 Sarah McFarland, LMU (CA) vs. Ohio St. Sept. 10, 199952 Angelica Jackson, San Diego St. vs. Fresno St. Nov. 2, 198751 Ksenija Kugler, Oral Roberts vs. Drake Oct. 31, 199351 Svetlana Vtyurina, George Washington vs. West Virginia Nov. 21, 199250 Jordan Thompson, Cincinnati vs. UConn Nov. 3, 201949 Tara Cross, Long Beach St. vs. Florida St. Nov. 29, 198748 Svetlana Vtyurina, George Washington vs. Wisconsin Nov. 30, 199447 Catalina Suarez, Kansas City vs. Park Sept. 12, 198846 Elsa Stegemann, Pacific vs. Michigan Dec. 4, 199946 Svetlana Vtyurina, George Washington vs. Virginia Tech Sept. 19, 199546 Catalina Suarez, Kansas City vs. Iowa St. Sept. 22, 198945 Tyler Henderson, Tulsa vs. SMU Oct. 6, 201045 Asia Kaczor, Southern California vs. Washington Nov. 16, 200745 Aida Antanaviciute, Saint Louis vs. Tulane Oct. 8, 200445 Suzanne Lowry, Col. of Charleston vs. Charleston So. Oct. 27, 1992
Total Attacks, Three-Set MatchNo. Player, Team vs. Opponent Date 89 Shelly Smith, Oregon St. vs. California Nov. 12, 199385 Jane Anne Karasek, Houston vs. Southern Miss. Oct. 5, 200285 Julia El-Hag, Boston College vs. Dartmouth Oct. 18, 199882 Catalina Suarez, Kansas City vs. Northwest Mo. St. Nov. 4, 198976 Sarah McFarland, LMU (CA) vs. San Francisco Nov. 18, 200075 Tracy Stroyan, Illinois St. vs. Illinois Sept. 21, 198574 Kim Willoughby, Hawaii vs. UC Santa Barbara Nov. 5, 200174 Carissa Buie, Sacramento St. vs. Northern Ariz. Nov. 29, 199774 Kristi Neuman, Ohio St. vs. Northern Ill. Sept. 7, 198673 Nancy Meendering, Nebraska vs. Texas Nov. 27, 199973 Jenna Wrobel, Michigan St. vs. Texas A&M Dec. 7, 199672 Kim Coffey, North Texas vs. Texas St. Nov. 17, 199571 Jane Anne Karasek, Houston vs. TCU Oct. 18, 200270 Elsa Stegemann, Pacific vs. Florida Dec. 11, 199970 Lauren Mackey, Morehead St. vs. Austin Peay Oct. 14, 199670 Pam Kirsch, Southeast Mo. St. vs. Middle Tenn. Nov. 21, 199369 Morgan Dall, Indiana St. vs. Evansville Nov. 5, 201069 Emily Day, LMU (CA) vs. Arizona St. Aug. 26, 200669 Jill Hampton, Xavier vs. Dayton Oct. 3, 200069 Carlyn Esslinger, Bowling Green vs. Central Mich. Oct. 7, 199469 Rachel Stone, Canisius vs. Lehigh Oct. 5, 1990
Total Attacks, Four-Set MatchNo. Player, Team vs. Opponent Date 111 Sarah McFarland, LMU (CA) vs. Notre Dame Sept. 21, 2000106 Michelle Collier, South Fla. vs. Louisville Nov. 10, 2000106 Rachel Wacholder, Colorado vs. Iowa St. Nov. 24, 1995105 Kim Willoughby, Hawaii vs. Pacific Nov. 24, 2001103 Catalina Suarez, Kansas City vs. Missouri Oct. 25, 1988102 Tera Lobdell, Northern Ill. vs. Illinois St. Oct. 26, 2004102 Jenna Wrobel, Michigan St. vs. Wisconsin Nov. 27, 1998101 Sarah McFarland, LMU (CA) vs. Pepperdine Oct. 7, 200098 Roberta Gehlke, UC Santa Barbara vs. Long Beach St. Sept. 30, 199997 Aline Pereira, George Mason vs. Hofstra Nov. 22, 200396 Michelle Collier, South Fla. vs. Cal Poly Dec. 1, 200094 Lindsay Stalzer, Bradley vs. Evansville Sept. 23, 200594 Ynez Carrasco, Santa Clara vs. Sacramento St. Sept. 12, 200093 Roberta Gehlke, UC Santa Barbara vs. Long Beach St. Nov. 6, 199993 Helena Elbaek, American vs. Hartford Aug. 31, 201992 Maria Andonova, Florida A&M vs. Morgan St. Oct. 14, 2006
INDIVIDUAL LEADERS

Individual Leaders 5
No. Player, Team vs. Opponent Date 92 Kelly Paiva, Fla. Atlantic vs. Northern Colo. Oct. 1, 200592 Jennifer Wittenburg, Houston vs. Texas Sept. 30, 200092 Kristi Colson, Arizona vs. Washington St. Oct. 18, 199191 Nicole Branagh, Minnesota vs. Iowa Nov. 22, 200091 Renata Menchikova, UCF vs. South Fla. Oct. 24, 1995
Total Attacks, Five-Set MatchNo. Player, Team vs. Opponent Date 119 Mindy Rice, Idaho vs. Montana Nov. 19, 1994112 Aida Antanaviciute, Saint Louis vs. Tulane Oct. 8, 2004110 Angela Lewis, Sacramento St. vs. Eastern Wash. Sept. 30, 1999109 Sarah Snider, Lipscomb vs. Chattanooga Oct. 16, 2007109 Ann Pinkowski, Portland vs. Saint Mary’s (CA) Oct. 14, 1989109 Tara Cross, Long Beach St. vs. Hawaii Oct. 3, 1986108 Sarah Obras, Ball St. vs. Robert Morris Sept. 13, 2003108 Jill Beggs, Indiana vs. Iowa Nov. 5, 1988107 Sarah McFarland, LMU (CA) vs. Ohio St. Sept. 10, 1999107 Angelica Jackson, San Diego St. vs. William & Mary Nov. 21, 1987106 Andrea Duke, Wofford vs. UNCW Aug. 30, 2003106 Nicole Branagh, Minnesota vs. Penn St. Nov. 4, 2000106 Catalina Suarez, Kansas City vs. Iowa St. Sept. 22, 1989105 Kim Willoughby, Hawaii vs. Pacific Nov. 24, 2001105 Kim Polash, Furman vs. App State Nov. 20, 1994103 Dani Nyenhuis, North Carolina vs. Duke Sept. 25, 2009103 Teee Williams, Hawaii vs. Cal Poly Nov. 7, 1988102 Jordan Thompson, Cincinnati vs. UCF Nov. 9, 2018101 Brigitte Lourey, Wisconsin vs. Iowa Nov. 12, 1993101 Sue Faris, Alabama vs. Mississippi St. Oct. 3, 1989
Hitting Percentage*(10 or more attacks)Pct. (K-E/TA) Player, Team vs. Opponent Date1.000 14-0/14) Shaney Lipscomb, New Mexico St. vs. Seattle U March 3, 20211.000 11-0/11) Sarah Barham, Wofford vs. The Citadel Feb. 28, 20211.000 (15-0/15) Abbie Lehman, Wichita St. vs. Bradley Oct. 25, 20141.000 (15-0/15) Samantha Thrower, Indiana vs. Buffalo Sept. 3, 20111.000 (15-0/15) Katie Silliman, Arkansas St. vs. Jackson St. Oct. 11, 19981.000 (14-0/14) Angie Jeffries, Kansas City vs. Chicago St. Oct. 8, 19991.000 (13-0/13) Tracy Stalls, Nebraska vs. Texas Tech Nov. 24, 20071.000 (13-0/13) Meredith Mangum, Oral Roberts vs. IUPUI Nov. 18, 20001.000 (13-0/13) Staci Hintze, Oregon St. vs. Portland Oct. 22, 19961.000 (13-0/13) Amy Cooper, Stanford vs. California Oct. 9, 19901.000 (13-0/13) Debbie McDonald, Purdue vs. North Carolina
St. Sept. 25, 1987
1.000 (12-0/12) Kodie Comby, Georgia Tech vs. Arkansas Sept. 9, 20191.000 (12-0/12) Claire Felix, UCLA vs. California Nov. 16, 20141.000 (12-0/12) Ashley Hamilton, Eastern Wash. vs. Weber St. Oct. 23, 20091.000 (12-0/12) Meghan Macdonald, Illinois vs. Indiana Nov. 17, 20061.000 (12-0/12) Laura Klancnik, Butler vs. Providence Aug. 31, 20021.000 (12-0/12) Kenyatta Lovelace, Hawaii vs. Cal St. Fullerton Oct. 3, 19921.000 (11-0/11) Shaylen Jackson, Western Mich. vs. Maine Sept. 10, 20041.000 (11-0/11) Alexandra Preiss, Georgia Tech vs. Virginia Oct. 4, 20031.000 (11-0/11) Cara Smith, Penn St. vs. Army West Point Sept. 14, 20021.000 (11-0/11) Laura Pier, Southern Ill. vs. Northeastern Ill. Oct. 12, 19961.000 (11-0/11) Cindy Silldorff, San Diego vs. San Francisco Nov. 11, 19881.000 (10-0/10) Natasha Medic, Purdue Fort Wayne vs. South
Dakota St.Oct. 30, 2016
1.000 (10-0/10) Taylor Odom, Santa Clara vs. San Francisco Nov. 16, 20181.000 (10-0/10) Lauren Stivrins, Nebraska vs. Northwestern Sept. 28, 20181.000 (10-0/10) Hayden Huybers, Indiana vs. Northwestern Sept. 21, 20161.000 (10-0/10) Natalie Seiler, Purdue Fort Wayne vs. Northern
Ky.Sept. 3, 2016
1.000 (10-0/10) Jenna Radtke, Northern Ill. vs. Ball St. Nov. 7, 20151.000 (10-0/10) Devonne Ryter, Idaho vs. Weber St. Oct. 22, 20151.000 (10-0/10) Ginna Lopez-Chavez, Florida A&M vs.
Savannah St.Sept. 27, 2015
Pct. (K-E/TA) Player, Team vs. Opponent Date1.000 (10-0/10) Morgan Bergren, Kentucky vs. Arkansas Nov. 29, 20141.000 (10-0/10) Blaire Pickens, TCU vs. Grambling Sept. 5, 20141.000 (10-0/10) Adrien Richburg, Baylor vs. SMU Sept. 3, 20131.000 (10-0/10) Sara Todorovich, Eastern Wash. vs. Northern
Ariz.Nov. 14, 2009
1.000 (10-0/10) Kristen Arthurs, Purdue vs. Ball St. Aug. 28, 20091.000 (10-0/10) Jenna Gideon, Western Ky. vs. Belmont Oct. 25, 20051.000 (10-0/10) Jennifer Cruz, New Orleans vs. Southern U. Oct. 26, 20041.000 (10-0/10) Leslie Lasiter, SMU vs. East Tenn. St. Aug. 31, 20021.000 (10-0/10) Benavia Jenkins, Florida vs. Ole Miss Oct. 12, 20011.000 (10-0/10) Megan Korver, Nebraska vs. Iowa St. Sept. 25, 19981.000 (10-0/10) Brande Brown, Texas Tech vs. William & Mary Sept. 20, 19971.000 (10-0/10) Julia Civardi, Colgate vs. LIU Sept. 25, 19931.000 (10-0/10) Cris Omiecinski, Georgia Tech vs. West Ga. Oct. 10, 19921.000 (10-0/10) Laura Olesen, Stanford vs. Oregon St. Oct. 31, 1986
Hitting Percentage*(15 or more attacks)Pct. (K-E/TA) Player, Team vs. Opponent Date1.000 (15-0/15) Abbie Lehman, Wichita St. vs. Bradley Oct. 25, 20141.000 (15-0/15) Samantha Thrower, Indiana vs. Buffalo Sept. 3, 20111.000 (15-0/15) Katie Silliman, Arkansas St. vs. Jackson St. Oct. 11, 1998.955 (21-0/22) Cathy Petrissans, LMU (CA) vs. Northern Ariz. Oct. 11, 1986.944 (17-0/18) Melissa Peterson, VCU vs. Liberty Oct. 25, 2005.944 (17-0/18) Lauren Sauer, Georgia Tech vs. North Carolina
St.Oct. 3, 2002
.941 (16-0/17) Nancy Brookhart, Illinois vs. Michigan Oct. 23, 1987
.938 (15-0/16) Caitlyn Della, Wake Forest vs. N.C. Central Aug. 31, 2019
.938 (15-0/16) Lisa Argabright, Illinois vs. Manhattan Sept. 12, 2003
.938 (15-0/16) Elisabeth Bachman, UCLA vs. Washington Oct. 28, 1999
.938 (15-0/16) Cory Sivertson, Baylor vs. Rice Oct. 7, 1992
.938 (15-0/16) Kathy Tepe, Miami (OH) vs. Eastern Ky. Nov. 11, 1985
.933 (14-0/15) Gwen Murphy, New Mexico St. vs. Robert Morris
Sept. 11, 2015
.933 (14-0/15) Shannon Sitzmann, Winthrop vs. Gardner-Webb
Nov. 10, 2004
.933 (14-0/15) Kim Bates, Toledo vs. Eastern Mich. Sept. 18, 1992
.900 (18-0/20) Chloe Mann, Florida vs. LSU Nov. 11, 2011
.900 (18-0/20) Ashley Vogl, Western Mich. vs. Eastern Ky. Aug. 31, 2007
.900 (18-0/20) Jenny Geraci, Dayton vs. Xavier Sept. 26, 1992
.900 (18-0/20) Suzie Regul, Fresno St. vs. Oklahoma Sept. 13, 1991
.895 (17-0/19) Nina Foster, Alabama vs. Alabama St. Sept. 12, 1995
.895 (18-1/19) Danielle Scott, Long Beach St. vs. Utah St. Sept. 25, 1993
Hitting Percentage* (20 or more attacks)Pct. (K-E/TA) Player, Team vs. Opponent Date.955 (21-0/22) Cathy Petrissans, LMU (CA) vs. Northern Ariz. Oct. 11, 1986.900 (18-0/20) Chloe Mann, Florida vs. LSU Nov. 11, 2011.900 (18-0/20) Ashley Vogl, Western Mich. vs. Eastern Ky. Aug. 31, 2007.900 (18-0/20) Jenny Geraci, Dayton vs. Xavier Sept. 26, 1992.900 (18-0/20) Suzie Regul, Fresno St. vs. Oklahoma Sept. 13, 1991.875 (22-1/24) Nana Meriwether, UCLA vs. Florida Sept. 2, 2006.870 (21-1/23) Lori Rowe, South Carolina vs. App State Sept. 17, 1983.857 (18-0/21) Tia Jimerson, Ohio vs. Kent St. Nov. 7, 2019.857 (18-0/21) Aaliyah Muhammad, Nicholls St. vs. McNeese Sept. 22, 2007.857 (18-0/21) Jenelle Koester, UConn vs. Rutgers Nov. 6, 1998.857 (18-0/21) Heather Bown, Hawaii vs. UCLA Sept. 4, 1998.850 (18-1/20) Lauren Stivrins, Nebraska vs. Maryland Feb. 2, 2021.850 (17-0/20) Foluke Aki--adewo, Stanford vs. Arizona Oct. 28, 2006.850 (17-0/20) Maria Andonova, Florida A&M vs. Delaware St. Oct. 15, 2004.850 (17-0/20) Margaret Davidson, Wake Forest vs. Oklahoma Sept. 7, 2001.846 (23-1/26) Andrea Carson, Syracuse vs. Northeastern Sept. 14, 1991.833 (20-0/24) Foluke Aki--adewo, Stanford vs. William & Mary Sept. 5, 2008.833 (20-0/24) Page White, Texas A&M vs. Little Rock Sept. 9, 1994

Individual Leaders 6
Pct. (K-E/TA) Player, Team vs. Opponent Date.828 (25-1/29) Lauren Matthews, Western Ky. vs. Charlotte Feb. 22, 2021.826 (19-0/23) Sadie Limback, Omaha vs. South Dakota St. March 5, 2021.826 (20-1/23) Shelby Sullivan, Texas A&M vs. Auburn Sept. 28, 2014.826 (19-0/23) Carly Babin, San Francisco vs. San Diego Oct. 11, 2008.818 (18-0/22) Tarah Wylie, Pepperdine vs.Gonzaga Oct. 31, 2019.818 (18-0/22) Jenna Bridges, Hartford vs. Niagara Sept. 6, 2019.818 (18-0/22) Alana Cox, Alabama A&M vs. Southern Ill. Sept. 6, 2019.818 (19-1/22) Annalisa Muratore, Santa Clara vs. TCU Sept. 18, 2004*Hitting percentage is derived by subtracting errors from kills and dividing that difference by total attacks.
SETTINGAssists, Three-Set MatchNo. Player, Team vs. Opponent Date 78 Janice Mounts, Southern California vs. Washington St. Oct. 11, 199676 Julie Bremner, UCLA vs. Florida Dec. 17, 199275 Emily Sallee, Ball St. vs. Western Mich. Nov. 27, 199975 Kelly Campbell, Colorado vs. Texas Tech Oct. 6, 199975 Kelly Campbell, Colorado vs. Oklahoma Oct. 31, 199775 Linnea Mendoza, Michigan vs. Illinois Oct. 11, 199774 Andrea Nachtrieb, Georgia Tech vs. Clemson Sept. 25, 199673 Kara Gormsen, Pacific vs. Florida Dec. 11, 199973 Colleen Neels, Wisconsin vs. San Diego Dec. 5, 199873 Nikki Shade, Florida vs. UCLA Nov. 28, 199771 Melissa Beitz, Illinois vs. Minnesota Oct. 24, 199871 Melissa Beitz, Illinois vs. Arkansas Sept. 19, 199770 Erika Selsor, UCLA vs. Pepperdine Dec. 9, 199969 Katie Lindquist, San Diego vs. Wisconsin Dec. 5, 199869 Bethany Hill, Houston vs. Louisville Oct. 19, 199768 Disney Bronnenberg, Kansas St. vs. Kansas Oct. 4, 200068 Solana Lee, Temple vs. George Washington Oct. 30, 199968 Melissa Beitz, Illinois vs. Michigan Oct. 11, 199768 Tracy Holman, LMU (CA) vs. CSUN Nov. 1, 199468 Laura Davis, Ohio St. vs. Purdue Oct. 31, 1992
Assists, Four-Set MatchNo. Player, Team vs. Opponent Date 107 Jamie Pilbeam, UC Irvine vs. UTSA Sept. 7, 2000101 Heidi Miller, Oral Roberts vs. Col. of Charleston Sept. 2, 199495 Keri Nishimoto, Long Beach St. vs. UC Santa Barbara Sept. 30, 199995 Renata Menchikova, UCF vs. Oral Roberts Nov. 14, 199794 Dana Chuna, Baylor vs. Temple Dec. 3, 199989 Stacy Bollinger, San Diego St. vs. Colorado St. Nov. 13, 199389 Robin Ortgiesen, LMU (CA) vs. San Francisco Oct. 16, 199288 Jenna Moscovic, Texas A&M vs. Texas Oct. 18, 200088 Maureen Rafferty, Sacramento St. vs. Weber St. Sept. 17, 199788 Devon Ryning, Kansas St. vs. CSUN Dec. 4, 199687 Jenny Bowman, Northern Ill. vs. Bowling Green Oct. 14, 200087 Christy Johnson, Nebraska vs. Texas Dec. 16, 199587 Carolien Dikhoff, Illinois vs. Georgia Dec. 2, 199586 Denise Boylan, Notre Dame vs. Pittsburgh Oct. 8, 200086 Molly LaMere, Kansas vs. Auburn Sept. 11, 199985 Mica Wojinski, Murray St. vs. Morehead St. Oct. 24, 199885 Roz Pelayo, Santa Clara vs. San Diego Oct. 16, 199885 Tanja Dimitrijevic, Pacific vs. UC Santa Barbara Oct. 3, 199885 Lisa Hilgers, Texas Tech vs. Baylor Nov. 28, 199685 Kelly Flannigan, UCLA vs. Stanford Sept. 23, 199585 Nikki Stricker, Nebraska vs. Georgia Sept. 17, 199385 Keri Killebrew, Washington St. vs. Southern California Oct. 24, 1992
Assists, Five-Set MatchNo. Player, Team vs. Opponent Date 109 Lori Endicott, Nebraska vs. Texas Nov. 5, 1988108 Becci Roehl, Pepperdine vs. Rhode Island Dec. 2, 1995108 Kathy Whalen, Miami (OH) vs. Eastern Mich. Nov. 24, 1990106 Disney Bronnenberg, Kansas St. vs. Illinois Sept. 19, 1998103 Liz Towne, UC Santa Barbara vs. San Diego St. Nov. 20, 1986102 Barb Winsett, Illinois vs. Nebraska Nov. 11, 1989101 Dana Chuna, Baylor vs. Texas Nov. 3, 1999101 Melissa Haugen, Northern Ariz. vs. Montana St. Sept. 17, 1998100 Rachel McFarland, Sam Houston St. vs. Lamar Oct. 6, 199299 Disa Johnson, Illinois vs. Purdue Oct. 22, 198998 Julie Franzen, Sam Houston St. vs. Baylor Nov. 15, 199397 Kim Levey, Cal St. Fullerton vs. TCU Sept. 16, 200097 Sami Sawyer, Houston vs. Louisville Oct. 8, 199597 Michelle Farah, Col. of Charleston vs. Charleston So. Oct. 27, 199297 Holly McPeak, UCLA vs. Stanford Oct. 19, 1990
Service Aces, Three-Set MatchNo. Player, Team vs. Opponent Date 15 Jennifer Brandt, Nicholls St. vs. Alcorn Sept. 14, 201115 Ivana Cebakova, American vs. Lehigh Nov. 7, 200815 Veronica Canto-Ponce, Lafayette vs. Delaware St. Sept. 13, 200315 Janelle Tomlinson, Green Bay vs. Chicago St. Sept. 23, 200114 Eileen Nicole Rodriguez, Albany (NY) vs. UMBC Oct. 17, 200314 Eileen Nicole Rodriguez, Albany (NY) vs. Maine Oct. 11, 200314 Irie Cormier, Bethune-Cookman vs. Savannah St. Nov. 5, 200214 Erin Dixon, Wofford vs. Savannah St. Oct. 7, 200114 Janie Borcherding, Duke vs. Mercer Sept. 14, 199014 Belinda Spivey, South Fla. vs. Temple Nov. 8, 198613 Martina Wagner, LIU vs. Rutgers Oct. 17, 200713 Jessica Piscitelli, Niagara vs. Quinnipiac Sept. 2, 200613 Jana Milin, UMES vs. Howard Nov. 21, 200313 Chris Krabacher, Toledo vs. Michigan St. Sept. 6, 199113 Tammi Firth, Southern Miss. vs. Mississippi Val. Oct. 16, 198912 Megan Munce, TCU vs. Air Force Oct. 17, 200812 Stephanie Cisneros, Hampton vs. Southern U. Aug. 29, 200312 Tanja Radovic, Little Rock vs. Wyoming Sept. 11, 199912 April Rhodes, Ga. Southern vs. Coppin St. Aug. 30, 199712 Tiffany Hungerford, Coppin St. vs. UMES Nov. 9, 199512 Karlin Sander, Missouri St. vs. Tulsa Sept. 14, 199312 Casie Alexander, Seton Hall vs. Manhattan Sept. 6, 199112 Melinda Vogler, Dayton vs. Malone Sept. 20, 198612 Kelli Melerine, New Orleans vs. Southeastern La. Oct. 19, 1983
Service Aces, Four-Set MatchNo. Player, Team vs. Opponent Date 16 Suzanne Negrotta, Southeastern La. vs. Mississippi Val. Oct. 13, 198914 Sara Younes, Wichita St. vs. San Diego St. Sept. 13, 200314 Eileen Nicole Rodriguez, Albany (NY) vs. Hartford Nov. 16, 200214 Jean Ann Harrison, Toledo vs. Miami (OH) Oct. 29, 199413 Dawn Meester, UNI vs. Winona St. Nov. 6, 199113 Elita Powell, Army West Point vs. Colgate Sept. 29, 199012 Tiffany Graham, Indiana St. vs. Drake Oct. 27, 199012 Dawn Meester, UNI vs. St. Ambrose Sept. 18, 199012 Sue Faris, Alabama vs. Samford Oct. 14, 198912 Kris Keigan-Pfanstiel, Hofstra vs. Lehigh Oct. 2, 198811 Jen Myer, Belmont vs. Jacksonville Oct. 15, 201111 Svenja Engelhardt, Pacific vs. CSUN Oct. 13, 200711 Katie Gallagher, Miami (FL) vs. Jacksonville Aug. 25, 200711 Taylor Barnes, Baylor vs. Missouri Sept. 27, 200611 Eileen Nicole Rodriguez, Albany (NY) vs. UMBC Oct. 22, 200411 Taryn Lynn, Stetson vs. Western Caro. Sept. 14, 199711 Vicki Spahn, Evansville vs. Saint Louis Nov. 2, 199111 Casie Alexander, Seton Hall vs. Lehigh Sept. 18, 199111 Karen Bell, Houston vs. SFA Sept. 4, 1990

Individual Leaders 7
Service Aces, Five-Set MatchNo. Player, Team vs. Opponent Date 14 Jackie Mendez, San Diego St. vs. Fresno St. Sept. 16, 198814 Marlene Melancon, New Orleans vs. Southeastern La. Sept. 20, 198313 Jasmine Jackson, Delaware St. vs Hampton Nov. 13, 201513 Taryn Wright, Montana vs. Northern Colo. Nov. 16, 200613 Karen Crepeau, New Hampshire vs. Marist Sept. 9, 199513 Maureen Quinnett, Western Ill. vs. Michigan Nov. 13, 198213 Jill Halstead, Minnesota vs. Iowa St. Oct. 14, 198112 Laura Milos, Oral Roberts vs. South Dakota St. Oct. 25, 201512 Brooke Engel, North Texas vs. Little Rock Oct. 28, 200712 Tara Toepke, Winthrop vs. Charleston So. Oct. 12, 200712 Morgan Volkart, Lehigh vs. Holy Cross Nov. 6, 200412 Maureen McLaughlin, Michigan St. vs. Northwood Sept. 18, 198612 Mary Murphy, Western Ill. vs. Michigan Nov. 13, 198211 Amber Kaufman, Hawaii vs. Washington Sept. 13, 200811 Teri Connolly, Hartford vs. Quinnipiac Sept. 16, 200611 Nancy Winkler, Kent St. vs. Akron Oct. 23, 199011 Dayle Hamontree, Morehead St. vs. Murray St. Oct. 21, 198911 Tanya Champagne, NorthWestern Colo. vs. Nicholls St. Nov. 1, 198511 Jennifer Maurer, Utah vs. Utah St. Nov. 15, 198411 Beverly Robinson, Tennessee vs. Northwestern Dec. 4, 198211 Peg McEneely, Western Ill. vs. Michigan Nov. 13, 1982
Consecutive Points ServedNo. Player, Team vs. Opponent Date 22 Chelsea Gebben, Mercer vs. Savannah St. Oct. 13, 200619 Alison Woods, UAB vs. Alcorn Sept. 4, 200918 Jenna Orlandini, Washington vs. Coppin St. Sept. 19, 201318 Meredith Nelson, Minnesota vs. Northwestern Nov. 11, 200618 Jenna Link, Villanova vs. DePaul Sept. 23, 200618 Courtney Thompson, Washington vs. Gardner-Webb Aug. 26, 200517 Shelby Russell, Southern Miss. vs. Ark.-Pine Bluff Aug. 29, 201417 Elena Garcia, Ole Miss vs. Baylor Sept. 3, 200416 Jackie Choi, New Mexico St. vs. North Texas Oct. 3, 200415 Kerri Schuh, Milwaukee vs. UIC Nov. 13, 201015 Megan Welch, Delaware vs. Hofstra Nov. 18, 200715 Amanda McCormick, Ball St. vs. Central Mich. Oct. 21, 200515 Fabiana Souza, Purdue Fort Wayne vs. Ball St. Sept. 20, 200515 Jill Arganbright, UNI vs. Southern Ill. Nov. 2, 200215 Angie Nordquist, Valparaiso vs. Western Ill. Oct. 13, 200015 Jeanine Szczesniak, Michigan vs. Eastern Mich. Sept. 21, 199615 Cristi Curtis, Winthrop vs. Navy Sept. 6, 199615 Amy Stavinoha, Sam Houston St. vs. NorthWestern Colo. Nov. 8, 199515 Michelle Griffin, La.-Monroe vs. Alcorn Sept. 29, 1987Note: Consecutive points served includes only those serves that result in points for the player’s team.
Consecutive Points Served To Start a MatchNo. Player, Team vs. Opponent Date13 Allison Kearney, Arkansas St. vs. Alcorn Sept. 16, 201112 Katie Bova, Valparaiso vs. IUPUI Oct. 1, 200511 Kristin Carpenter, Penn St. vs. Princeton Sept. 18, 201011 Taylor Barnes, Baylor vs. La.-Monroe Sept. 1, 200610 Whitney Bower, BYU vs. VCU Sept. 14, 201910 Megan Carter, Lafayette vs. Providence Oct. 15, 2005
Digs, Three-Set MatchNo. Player, Team vs. Opponent Date 50 Chelsee Goins, Grambling vs. Jackson St. Oct. 29, 201150 Sydney Donahue, Arizona St. vs. LMU (CA) Aug. 26, 200649 Dayle Hamontree, Morehead St. vs. Tennessee Tech Nov. 4, 198946 Katrelle Armwood, Tennessee St. vs. Eastern Ky. Oct. 21, 200545 Chelsee Goins, Grambling vs. Prairie View Oct. 20, 2011
No. Player, Team vs. Opponent Date 42 Alexis Lonneman, Central Mich. vs. Northern Ill. Nov. 3, 200739 Courtney Pence, Illinois St. vs. Bradley Sept. 24, 201639 Alita Fisher, Saint Mary’s (CA) vs. Fresno St. Sept. 2, 200739 Amanda McCormick, Ball St. vs. Eastern Mich. Nov. 10, 200639 Paula Gentil, Minnesota vs. Michigan Sept. 25, 200439 Galina Fouks, South Fla. vs. VCU Oct. 11, 199039 Lee Ann Allen, Murray St. vs. Marshall Sept. 30, 198938 Becca Fernandez, Murrray St. vs. Eastern Ill. Nov. 9, 201838 Amanda McCormick, Ball St. vs. Akron Nov. 2, 200637 Jenna Story, Wright St. vs. Oakland Feb. 9, 202137 Amanda McCormick, Ball St. vs. Toledo Nov. 5, 200537 Allison Anderson, Boston College vs. UConn Nov. 11, 200437 Elisa Caraulia, Cleveland St. vs. Kent St. Oct. 16, 198736 Evan Sanders, Colorado St. vs. Utah Sept. 26, 201036 Stephanie Figgers, SFA vs. Sam Houston St. Oct. 7, 200636 Brittany Stowers, UTEP vs. North Texas Sept. 10, 200436 Linda Evans, Iowa St. vs. UIC Sept. 20, 198536 Catalina Suarez, Kansas vs. Baylor Sept. 13, 1985
Digs, Four-Set MatchNo. Player, Team vs. Opponent Date 56 Catalina Suarez, Kansas City vs. UTEP Sept. 29, 198954 Jenny McReynolds, Princeton vs. Dartmouth Oct. 29, 200553 Taylor Rayfield, North Carolina vs. Col. of Charleston Dec. 2, 200552 Brittany Stowers, Northern Ariz. vs. Green Bay Sept. 6, 200852 Meredith Forlic, Tennessee Tech vs. Austin Peay Nov. 22, 199650 Gina Guide, Northern Ill. vs. Toledo Oct. 13, 200649 Elvina Kung, Brown vs. Princeton Oct. 8, 200449 Lea Windlin, American vs. James Madison Nov. 22, 199149 Denise Pardoen, San Francisco vs. Oklahoma Sept. 19, 198748 Emma Raleigh, Bradley vs. Drake Oct. 12, 201947 Marie Dobrenz, Col. of Charleston vs. North Carolina Dec. 2, 200546 Katie Forsythe, Loyola Maryland vs. Holy Cross Oct. 26, 201946 Kasey Elswick, UT Martin vs. Eastern Ky. Sept. 23, 201146 Aime Cordeiro, San Diego St. vs. Northern Ill. Sept. 8, 200746 Elyse Cusack, Florida vs. LSU Nov. 3, 200646 Lori Snider, Akron vs. Robert Morris Sept. 3, 200446 Darcy Thompson, Robert Morris vs. Akron Sept. 3, 200445 Sabrina Baby, NJIT vs. South Dakota Nov. 5, 200945 Kim Maroon, Villanova vs. UConn Oct. 17, 200945 Brittany Nobilio, Eastern Ky. vs. Eastern Ill. Sept. 30, 200644 Melina Tedrow, Indiana St. vs Evansville Oct. 11, 201944 Sasha Karelov, Duke vs. Notre Dame Sept. 30, 201643 Gabriela Macedo, Evansville vs. Indiana St. Oct. 11, 201943 Emily Popp, Holy Cross vs. Bucknell Sept. 20, 201443 OJ Olson, SFA vs. NorthWestern Colo. Nov. 16, 201343 Stephanie Preach, Arizona St. vs. Southern California Oct. 8, 201143 Meagan Tracey, Coastal Carolina vs. Radford Oct. 2, 200943 Ann Mullins, Lipscomb vs. Tennessee Tech Sept. 17, 200543 Emily Orlowski, Sam Houston St. vs. UT Arlington Oct. 5, 200443 Jayne Duncan, New Orleans vs. Southeastern La. Sept. 4, 200443 Jill Doty, Murray St. vs. Evansville Nov. 17, 199043 Jennifer Beemsterboer, Georgia Tech vs. Western Caro. Oct. 28, 1989
Digs, Five-Set MatchNo. Player, Team vs. Opponent Date 62 Jessica Strama, McNeese vs. UT Arlington Oct. 13, 200658 Tanya Champagne, NorthWestern Colo. vs. Nicholls St. Nov. 1, 198557 Allison Anderson, Boston College vs. Villanova Oct. 10, 200455 Chelsee Goins, Grambling vs. Southern U. Oct. 24, 201155 Haley Stein, Eastern Mich. vs. Western Mich. Oct. 8, 201055 Debbie Carlson, Oklahoma vs. New Mexico Nov. 19, 198754 Becky Dreher, Oral Roberts vs. Western Ill. Nov. 5, 200453 Allison Anderson, Boston College vs. Clemson Nov. 19, 200553 Kelly King, Furman vs. Bucknell Sept. 20, 199752 Karen Beegle, Delaware vs. Princeton Sept. 14, 1990

Individual Leaders 8
No. Player, Team vs. Opponent Date 51 Lara Newberry, Chattanooga vs. Wofford Oct. 11, 200850 McKenzie Hart, North Dakota vs. Southern Utah Oct. 24, 201550 Roxanne McVey, Mississippi St. vs. LSU Sept. 28, 201250 Katie Kenline, Tennessee Tech vs. Eastern Ky. Nov. 11, 200650 Ashley Cudney, Eastern Mich. vs. Northern Ill. Oct. 7, 200650 Amanda McCormick, Ball St. vs. Toledo Sept. 28, 200650 Griselle Lopez Pereira, VCU vs. Davidson Sept. 3, 200450 Leslie Whitfield, UNC Asheville vs. Western Caro. Oct. 22, 200250 Amy McNeel, Oregon vs. California Sept. 15, 199550 Michelle Mingus, Western Ky. vs. Cincinnati Sept. 20, 199150 Catalina Suarez, Kansas City vs. North Texas Sept. 30, 1989
SEASON RECORDS
ATTACKKills (1981-2000)Player, Team Year Sets KillsJill McCreary, Akron 1990 182 965Javonne Brooks, New Orleans 1992 144 878Marsha Bond, Kentucky 1983 — 874Svetlana Vtyurina, George Washington 1995 120 847Svetlana Vtyurina, George Washington 1992 129 833Renata Menchikova, UCF 1995 138 830Jill Haas, Sacramento St. 1995 132 798Suzanne Lowry, Col. of Charleston 1991 185 797Jill McCreary, Akron 1989 174 792Bonnie Beard, Sam Houston St. 1985 156 791Priscilla Pacheco, Georgia 1994 127 785Tara Cross, Long Beach St. 1989 129 779
Kills With 30-Point Scoring Format (2001-07)Player, Team Year Sets KillsKim Willoughby, Hawaii 2001 118 850Stacey Gordon, Ohio St. 2004 119 842Ogonna Nnamani, Stanford 2004 133 823Cristina Pintilie, LIU 2002 144 816Martina Veiglova, Ga. Southern 2003 131 764Kelly Wing, UC Irvine 2003 133 764Aline Pereira, George Mason 2003 113 753Kim Willoughby, Hawaii 2003 114 752Michelle Collier, South Fla. 2002 131 738Stacey Gordon, Ohio St. 2002 123 735Aline Pereira, George Mason 2002 110 724Lindsay Stalzer, Bradley 2005 123 720Tera Lobdell, Northern Ill. 2004 123 713Missie Stidham, Sacramento St. 2007 134 710Stacey Gordon, Ohio St. 2003 107 708Shonda Cole, South Carolina 2006 122 703Mia Jerkov, California 2003 116 701Laura Jones, Texas A&M 2005 115 700Logan Pierce, Winthrop 2002 144 700Erin Martin, Minnesota 2004 139 695Sarah Obras, Ball St. 2003 129 695
Kills With 25-Point Scoring Format (2008-Present)Player, Team Year Sets KillsJordan Thompson, Cincinnati 2018 132 827Jordan Thompson, Cincinnati 2019 125 798Daneille Rygelski, Saint Louis 2016 119 715
Player, Team Year Sets KillsTyler Henderson, Tulsa 2010 114 710Krystal Rivers, Alabama 2016 120 705Karsta Lowe, UCLA 2014 118 703Katie Staiger, Baylor 2016 128 698Vendula Strakova, Hampton 2014 119 691Carnae Dillard, North Texas 2015 127 687Samantha Bricio, Southern California 2015 130 668Tyler Henderson, Tulsa 2012 128 668Lauren Wicinski, Northern Ill. 2011 124 662Yarimar Rosa, FIU 2008 126 657McKenzie Adams, UTSA 2013 113 653Kadi Kullerkann, Houston 2014 128 644Dani Drews, Utah 2019 137 643Lauren Wicinski, Northern Ill. 2010 132 636Stephanie Niemer, Cincinnati 2010 124 635Pilar Victoria, Arkansas 2017 116 634Madison Kingdon, Arizona 2014 119 634Edina Begic, Little Rock 2013 124 634
Kills Per Set (1981-2000)(Minimum 500 kills)Player, Team Year Sets Kills Avg.Sarah McFarland, LMU (CA) 2000 98 762 7.78Catalina Suarez, Kansas City 1988 71 535 7.54Sarah McFarland, LMU (CA) 1999 102 750 7.35Svetlana Vtyurina, George
Washington1995 120 847 7.06
Sarah Noriega, LMU (CA) 1997 89 614 6.90Catalina Suarez, Kansas City 1989 104 694 6.67Svetlana Vtyurina, George
Washington1992 129 833 6.46
Priscilla Pacheco, Georgia 1993 117 754 6.44Vanessa Wouters, Ohio St. 1996 119 765 6.43Tara Cross, Long Beach St. 1988 120 763 6.36Michelle Collier, South Fla. 2000 121 760 6.28Teee Williams, Hawaii 1989 101 625 6.19Priscilla Pacheco, Georgia 1994 127 785 6.18Jennifer Wittenburg, Houston 2000 88 542 6.16Sarah Silvernail, Washington St. 1996 106 649 6.12Javonne Brooks, New Orleans 1992 144 878 6.10Jill Haas, Sacramento St. 1995 132 798 6.05
Kills Per Set With 30-Point Scoring Format (2001-07) (Minimum 500 kills)Player, Team Year Sets Kills Avg.Kim Willoughby, Hawaii 2001 118 850 7.20Stacey Gordon, Ohio St. 2004 119 842 7.08Aline Pereira, George Mason 2003 113 753 6.66Stacey Gordon, Ohio St. 2003 107 708 6.62Kelly-Anne Billingy, Marshall 2006 101 668 6.61Kim Willoughby, Hawaii 2003 114 752 6.60Aline Pereira, George Mason 2002 110 724 6.58Kim Willoughby, Hawaii 2002 109 688 6.31Jennifer Wittenburg, Houston 2001 103 646 6.27Maria Andonova, Florida A&M 2006 98 614 6.27Aida Antanaviciute, Saint Louis 2004 109 680 6.24Ogonna Nnamani, Stanford 2004 133 823 6.19Laura Jones, Texas A&M 2005 115 700 6.09Cristina Pintilie, LIU 2003 111 672 6.05Mia Jerkov, California 2003 116 701 6.04Heather Wollyung, Quinnipiac 2001 92 550 5.98Stacey Gordon, Ohio St. 2002 123 735 5.98Kelly Paiva, Fla. Atlantic 2005 113 671 5.94Mia Jerkov, California 2002 98 578 5.90Lindsay Stalzer, Bradley 2005 123 720 5.85

Individual Leaders 9
Kills Per Set With 25-Point Scoring Format (2008-Present)(Based on qualifiers for annual statistical championship)Player, Team Year Sets Kills Avg.Jordan Thompson, Cincinnati 2019 125 798 6.38Jordan Thompson, Cincinnati 2018 132 827 6.27Tyler Henderson, Tulsa 2010 114 710 6.23Danielle Rygelski, Saint Louis 2016 119 715 6.01Karsta Lowe, UCLA 2014 118 703 5.96Krystal Rivers, Alabama 2016 120 705 5.88Lindsey Ruddins, UC Santa Barbara 2017 90 526 5.84Vendula Strakova, Hampton 2014 119 691 5.81Laura Milos, Oral Roberts 2016 109 631 5.79McKenzie Adams, UTSA 2013 113 653 5.78Vendula Strakova, Hampton 2013 112 626 5.59Yun Yi Zhang, Temple 2009 98 544 5.55Alix Klineman, Stanford 2010 109 605 5.55Pilar Victoria, Arkansas 2017 116 634 5.47Katie Staiger, Baylor 2016 128 698 5.45Yossiana Pressley, Baylor 2019 101 546 5.41Carnae Dillard, North Texas 2015 127 687 5.41Carnae Dillard, North Texas 2014 114 615 5.39Burgandy McCurty, Siena 2009 107 575 5.37Rachel Giustino, Murray St. 2019 114 610 5.35
Total Attacks (1981-2000)Player, Team Year Sets TAJill McCreary, Akron 1990 182 2,175Linda Santiago, UCF 1991 128 2,044Jill Haas, Sacramento St. 1996 126 1,959Jill Haas, Sacramento St. 1995 132 1,914Kerry House, LMU (CA) 1990 138 1,898Michelle Collier, South Fla. 2000 121 1,873Jodi Juergens, Akron 1989 174 1,826Krystal Osborne, Arkansas 1995 147 1,801Priscilla Pacheco, Georgia 1994 127 1,800Renata Menchikova, UCF 1995 138 1,797Lea Windlin, American 1991 137 1,784Javonne Brooks, New Orleans 1992 144 1,783Suzanne Lowry, Col. of Charleston 1991 185 1,750Jill McCreary, Akron 1989 174 1,747Vanessa Wouters, Ohio St. 1996 119 1,743Katrien DeDecker, Minnesota 1996 124 1,743Jennifer James, Eastern Ky. 1991 135 1,735Christy Attebery, Western Caro. 2000 127 1,728Anissa Parker, McNeese 2000 109 1,726Tonya Larson, UAB 1996 132 1,723
Total Attacks With 30-Point Scoring Format (2001-07)Player, Team Year Sets TATera Lobdell, Northern Ill. 2004 123 2,082Sarah Obras, Ball St. 2003 129 1,981Lindsay Stalzer, Bradley 2005 123 1,923Kelly Wing, UC Irvine 2003 133 1,868Kate McCullagh, Northern Ill. 2005 128 1,860Ogonna Nnamani, Stanford 2004 133 1,819Kelly Paiva, Fla. Atlantic 2005 113 1,818Fabiola Nepomuceno, Tulsa 2007 134 1,808Cristina Pintilie, LIU 2002 144 1,787Rachel VanMeter, Illinois 2005 116 1,786Kim Willoughby, Hawaii 2001 118 1,782Missie Stidham, Sacramento St. 2007 134 1,781Logan Pierce, Winthrop 2002 144 1,766Aline Pereira, George Mason 2003 113 1,753Carrie Sartain, Sam Houston St. 2002 126 1,753
Player, Team Year Sets TAErin Martin, Minnesota 2004 139 1,750Leslie Finn, Clemson 2004 122 1,739Stacey Gordon, Ohio St. 2004 119 1,729Michelle Collier, South Fla. 2002 131 1,723Justine Farmer, Houston 2006 133 1,707
Total Attacks With 25-point Scoring Format (2008-Present)Player, Team Year Sets TAJordan Thompson, Cincinnati 2018 132 1,807Leah Sully, UC Santa Barbara 2012 135 1,798Katie Staiger, Baylor 2016 128 1,773Carnae Dillard, North Texas 2015 127 1,768Lily Johnson, Missouri St. 2016 133 1,737Jordan Thompson, Cincinnati 2019 125 1,735Kayla Neto, Cal St. Fullerton 2012 125 1,730Lily Johnson, Missouri St. 2015 135 1,726Sarah Davis, Sacramento St. 2019 130 1,711Emily Thorson, Tulsa 2017 125 1,710Lily Johnson, Missouri St. 2017 127 1,705Lexi Erwin, Michigan 2012 145 1,701Ariel Turner, Purdue 2011 121 1,682Michelle Bartsch, Illinois 2011 143 1,676Shannon Boyle, Sacramento St. 2017 146 1,668Rachel Iaquaniello, Eastern Mich. 2012 126 1,666Macey Gardner, Arizona St. 2012 131 1,655Krystal Rivers, Alabama 2016 120 1,628Carlisa May, Arkansas St. 2018 123 1,627Ariel Turner, Purdue 2012 124 1,622
Total Attacks Per Set (1981-2000)(Minimum 1,200 attacks)Player, Team Year Sets TA Avg.Sarah McFarland, LMU (CA) 2000 98 1,670 17.04Sarah McFarland, LMU (CA) 1999 102 1,642 16.10Linda Santiago, UCF 1991 128 2,044 15.97Anissa Parker, McNeese 2000 109 1,726 15.83Jill Haas, Sacramento St. 1996 126 1,959 15.55Michelle Collier, South Fla. 2000 121 1,873 15.48Dawn Cady, Kansas St. 1999 109 1,671 15.33Catalina Suarez, Kansas City 1989 104 1,530 14.71Vanessa Wouters, Ohio St. 1996 119 1,743 14.65Jill Haas, Sacramento St. 1995 132 1,914 14.50Jill Pape, TCU 1996 120 1,713 14.28Ashley Wacholder, Duke 1994 100 1,426 14.26Priscilla Pacheco, Georgia 1994 127 1,800 14.17Shelly Smith, Oregon St. 1993 119 1,680 14.12Katrien DeDecker, Minnesota 1996 124 1,743 14.06Deann Machlan, Army West Point 1995 96 1,339 13.95Svetlana Vtyurina, George
Washington1995 120 1,656 13.80
Kerry House, LMU (CA) 1990 138 1,898 13.75Anissa Parker, McNeese 1999 117 1,602 13.69Christy Attebery, Western Caro. 2000 127 1,728 13.61
Total Attacks Per Set With 30-Point Scoring Format (2001-07)(Minimum 1,200 attacks)Player, Team Year Sets TA Avg.Tera Lobdell, Northern Ill. 2004 123 2,082 16.93Kelly Paiva, Fla. Atlantic 2005 113 1,818 16.09Lindsay Stalzer, Bradley 2005 123 1,923 15.63Aline Pereira, George Mason 2003 113 1,753 15.51Justine Farmer, Houston 2007 110 1,698 15.44

Individual Leaders 10
Player, Team Year Sets TA Avg.Rachel VanMeter, Illinois 2005 116 1,786 15.40Sarah Obras, Ball St. 2003 129 1,981 15.36Haley Larsen, Idaho 2007 110 1,677 15.25Kim Willoughby, Hawaii 2001 118 1,782 15.10Kimberly Noble, San Jose St. 2003 110 1,658 15.07Stacey Gordon, Ohio St. 2003 107 1,601 14.96Sara Meyermann, Iowa 2001 103 1,517 14.73Maria Andonova, Florida A&M 2006 98 1,437 14.66Jennifer Wittenburg, Houston 2001 103 1,505 14.61Janine Sandell, UC Santa Barbara 2005 109 1,592 14.61Laura Jones, Texas A&M 2005 115 1,672 14.54Kate McCullagh, Northern Ill. 2005 128 1,860 14.53Stacey Gordon, Ohio St. 2004 119 1,729 14.53Sarah Snider, Lipscomb 2007 117 1,690 14.44Jessica Brodie, Portland St. 2006 103 1,483 14.40
Total Attacks Per Set with 25-point Scoring Format (2008-Present)(Minimum 1,000 attacks)Player, Team Year Sets TA Avg.Lindsey Ruddins, UC Santa Barbara 2017 90 1,366 15.18Lindsey Ruddins, UC Santa Barbara 2018 110 1,597 14.52Mandy Sifferlen, Holy Cross 2016 100 1,445 14.45Mackenzie Angner, South Dakota St. 2008 99 1,423 14.37Alondra Vazquez, Evansville 2020 75 1,060 14.13Laura Milos, Oral Roberts 2016 109 1,535 14.08Carnae Dillard, North Texas 2015 127 1,768 13.92Ariel Turner, Purdue 2011 121 1,682 13.90Jordan Thompson, Cincinnati 2019 125 1,735 13.88Katie Staiger, Baylor 2016 128 1,773 13.85Kayla Neto, Cal St. Fullerton 2012 125 1,730 13.84Jordan Thompson, Cincinnati 2018 132 1,807 13.69Sydney Rowan, Charlotte 2019 111 1,513 13.63Danielle Rygelski, Saint Louis 2016 119 1,620 13.61Krystal Rivers, Alabama 2016 120 1,628 13.57Heidi Splinter, Wright St. 2012 111 1,499 13.50Yun Yi Zhang, Temple 2009 98 1,313 13.40Hayley Dotseth, South Dakota 2018 111 1,486 13.39Meaghan Wheeler, Fairleigh Dickinson 2012 104 1,387 13.34Leah Sully, UC Santa Barbara 2012 135 1,798 13.32
Hitting Percentage* (1981-2000)(Minimum 3 attacks per set through 1999 season; minimum 4 attacks per set in 2000. Must play in at least two-thirds of team’s sets for the season.)Player, Team Year Sets K-E/TA Pct.Tyrona Clark, Florida A&M 1988 98 224-35/364 .519JoAnn Elwell, Penn St. 1990 134 483-82/836 .480Mary Volkoff, Hofstra 1983 119 244-53/413 .462Mary Eggers, Illinois 1986 133 475-84/859 .455Virag Domokos, George Mason 1995 115 463-87/829 .454Danielle Scott, Long Beach St. 1992 111 498-119/839 .452Heather Wright, Florida 1999 121 400-76/718 .451Val Sterk, Michigan St. 1996 115 502-93/911 .449Traci Lehnhoff, Iona 1996 94 328-31/665 .447Melissa Wharton, Bucknell 1995 115 358-70/647 .445Anne Cooper, Saint Mary’s (CA) 1984 119 432-75/803 .445Erica Berggren, South Fla. 1993 93 200-33/377 .443Emily Bridson, UCF 1993 148 627-114/1,159 .443
Hitting Percentage* With 30-Point Scoring Format (2001-07) (Minimum 4 attacks per set. Must play in at least two-thirds of team’s sets for the season.)
Player, Team Year Sets K-E/TA Pct.Maria Andonova, Florida A&M 2004 95 332-51/558 .504Foluke Aki--adewo, Stanford 2007 118 485-70/831 .499Christa Harmotto, Penn St. 2007 121 375-62/636 .492Jayli Jackson, Florida A&M 2003 92 259-56/429 .473Tracy Stalls, Nebraska 2007 103 291-48/514 .473Sherri Williams, Florida 2003 117 358-67/630 .462Angela Knopf, Colorado St. 2001 111 449-82/805 .456Ana Yartseva-Stewart, Louisville 2004 109 268-63/452 .454Nana Meriwether, UCLA 2006 124 507-89/933 .448Hui Ping Huang, St. John’s (NY) 2007 113 529-92/978 .447Arielle Wilson, Penn St. 2007 83 198-40/354 .446Jennifer Hoffman, Louisville 2005 121 336-66/607 .445Lindsy Hartsock, BYU 2005 107 289-49/541 .444Maria Andonova, Florida A&M 2003 94 235-51/416 .442Sami Cash, UC Irvine 2004 108 314-61/573 .442Jennifer Hoffman, Louisville 2004 109 239-49/436 .436Bibiana Candelas, Southern California 2003 113 339-65/632 .434Elisha Thomas, Long Beach St. 2001 108 254-54/462 .433Lindsey Ensign, Princeton 2006 84 384-85/691 .433Foluke Aki--adewo, Stanford 2006 98 382-63/740 .431
Hitting Percentage* With 25-Point Scoring Format (2008-Present)(Minimum 4 attacks per set in 2008; minimum 3.33 attacks per set since 2009. Must play in at least two-thirds of team’s sets for the season.)Player, Team Year Sets K-E/TA Pct.Taryn Knuth, Florida St. 2020 50 123-11/204 .549Arielle Wilson, Penn St. 2009 122 337-36/557 .540Chloe Mann, Florida 2013 107 369-47/636 .506Brianna Barry, Florida St. 2009 116 289-42/502 .492Haleigh Washington, Penn St. 2017 123 370-46/659 .492Christa Harmotto, Penn St. 2008 113 275-51/461 .486Emma Clothier, Florida St. 2020 61 165-27/286 .483Lauren Paolini, Texas 2008 118 310-46/552 .478Paulina Hougaard-Jensen, Colorado St. 2017 113 257-41/459 .471Lauren Stivrins, Nebraska 2020 62 197-37/342 .468Ashley Andrade, Wichita St. 2013 123 401-70/708 .468Anota Adekunle, Rice 2020 61 168-30/298 .463Lauren Forte, Florida 2020 59 120-36/203 .463Whitney Little, Missouri 2013 113 264-36/492 .463Paige Wessel, Western Ky. 2013 113 323-61/572 .458Rhamat Alhassan, Florida 2014 113 301-67/511 .458Foluke Aki--adewo, Stanford 2008 118 376-68/674 .457Bianca Rowland, Washington 2009 104 252-47/450 .456Martina Samadan, Seattle 2015 107 360-59/663 .454Ginna Lopez-Chavez, Florida A&M 2013 83 245-49/432 .454Delaina Sarden, UCF 2014 123 334-74/577 .451Lianna Sybeldon, Washington 2015 116 302-47/567 .450Lauren Matthews, Western Ky. 2019 118 470-86/857 .448Brea Muhle, Denver 2013 108 253-40/479 .445*Hitting percentage is derived by subtracting errors from kills and dividing that difference by total attacks.
SETTINGAssists (1981-2000)Player, Team Year Sets AssistsTami Hamilton, BYU 1984 157 2,026Michelle Jaworski, Penn St. 1990 140 1,966Paige Boehlke, Col. of Charleston 1991 183 1,875Lisa Blanchard, Akron 1990 188 1,873Susan Buttry, Arkansas St. 1993 172 1,868Emily Sallee, Ball St. 1999 128 1,863

Individual Leaders 11
Player, Team Year Sets AssistsMelissa Beitz, Illinois 1998 120 1,859Andrea Nachtrieb, Georgia Tech 1996 127 1,857Lorelee Smith, UNC Asheville 1996 138 1,852Erika Selsor, UCLA 2000 124 1,824Julie Franzen, Sam Houston St. 1994 133 1,818Michelle Farah, Col. of Charleston 1993 139 1,788Susie Severyn, Sacramento St. 1995 129 1,786Nikki Hubbert, Hawaii 1998 122 1,782Ashley Duhon, New Orleans 1989 163 1,781Erin Berg, North Carolina 1998 131 1,780Emily Queisser, UCF 1995 138 1,779Ann Boyer, UCLA 1987 134 1,778Robin Ortgiesen, LMU (CA) 1992 126 1,776
Assists With 30-Point Scoring Format (2001-07)Player, Team Year Sets AssistsKele Eveland, Georgia Tech 2002 144 1,905Heather Watts, Memphis 2004 136 1,830Kele Eveland, Georgia Tech 2003 122 1,822Ashlie Hain, UC Irvine 2003 133 1,814Sara Noe, Western Ky. 2002 135 1,814Heather Watts, Memphis 2003 135 1,792Marisa Main, Ohio St. 2004 120 1,785Victoria Zimmerman, Indiana 2002 130 1,765Jenifer Sulewski, Western Mich. 2006 133 1,760Wioleta Leszczynska, St. John’s (NY) 2007 124 1,759Ale Domingos, South Fla. 2002 132 1,753Margot Wallace, Georgia 2004 137 1,745Bryn Kehoe, Stanford 2007 121 1,742Nevena Stefanov, UAB 2006 137 1,739Sam Tortorello, Penn St. 2003 129 1,739Jennifer Anderson, Florida St. 2002 131 1,734Lindsey Vander Well, Minnesota 2002 135 1,734Nellie Spicer, UCLA 2006 126 1,721Ali Hausfeld, Duke 2007 121 1,714Megan Welch, Delaware 2007 130 1,714
Assists with 25-point Scoring Format (2008-Present)Player, Team Year Sets AssistsLexi Dannemiller, Michigan 2012 143 1,622Lauren Plum, Oregon 2012 121 1,618Kennedy Kurtz, Sacramento St. 2017 146 1,611Annie Luhrsen, Illinois 2011 143 1,603Kendall Bateman, Southern California 2010 127 1,567Marissa Collins, Central Ark. 2012 127 1,562Lexie Pawlik, Western Mich. 2014 141 1,552Brittany Anderson, Valparaiso 2018 146 1,539Leslie Clark, Middle Tenn. 2008 134 1,534Heather Hook, UNI 2017 131 1,530Sierra Wilson, Alabama 2014 133 1,529Jo Wilks, Furman 2012 125 1,529Lexi Dannemiller, Michigan 2011 131 1,523Kinsey Batten, Missouri St. 2015 135 1,522Kristin Hoffman, Northern Ill. 2011 124 1,522Allison Beckman, Col. of Charleston 2018 129 1,521Jordyn Poulter, Illinois 2018 132 1,521Saige Ka’aha’aina, Utah 2019 134 1,518Erin McNorton, Kansas 2013 125 1,517Lexi Zimmerman, Michigan 2009 138 1,516
Assists Per Set (1981-2000) (Minimum 1,200 assists)
Player, Team Year Sets Assists Avg.Disney Bronnenberg, Kansas St. 1998 109 1,694 15.54Melissa Beitz, Illinois 1998 120 1,859 15.49Jen Boleyn, Ohio St. 1995 103 1,591 15.45Becci Roehl, Pepperdine 1996 84 1,284 15.29Janice Mounts, Southern California 1998 99 1,490 15.05Dana Chuha, Baylor 2000 108 1,623 15.03Disney Bronnenberg, Kansas St. 2000 113 1,696 15.01Kimberly Coleman, UCLA 1997 110 1,646 14.96Meredith Van Horn, Oklahoma 1997 116 1,726 14.88Jen Boleyn, Ohio St. 1996 108 1,599 14.81Cindy Cox, Colorado St. 1987 119 1,756 14.76Kelly Campbell, Colorado 1996 103 1,519 14.75Erika Selsor, UCLA 2000 124 1,824 14.71Dana Chuha, Baylor 1999 89 1,308 14.70Kelly Campbell, Colorado 1998 107 1,572 14.69Laura Davis, Ohio St. 1994 107 1,567 14.64Andrea Nachtrieb, Georgia Tech 1996 127 1,857 14.62Nikki Hubbert, Hawaii 1998 122 1,782 14.61Roz Pelayo, Santa Clara 1999 115 1,678 14.59Keri Nishimoto, Long Beach St. 1999 99 1,443 14.58
Assists Per Set With 30-Point Scoring Format (2001-07)(Minimum 1,200 assists)Player, Team Year Sets Assists Avg.Lindsey Laband, Georgia Tech 2004 108 1,663 15.40Kele Eveland, Georgia Tech 2003 122 1,822 14.93Courtney Thompson, Washington 2005 108 1,608 14.89Marisa Main, Ohio St. 2004 120 1,785 14.88Savanah Parra, Ohio 2005 116 1,704 14.69Courtney Thompson, Washington 2004 112 1,643 14.67Courtney Thompson, Washington 2006 118 1,711 14.50Lindsey Hunter, Missouri 2004 103 1,486 14.43Bailey Robinson, Princeton 2007 99 1,426 14.40Bryn Kehoe, Stanford 2007 121 1,742 14.40Kelli Sousa, Santa Clara 2002 112 1,610 14.38Lindsey Sherburne, San Diego 2003 107 1,524 14.24Katie Virtue, Ohio St. 2001 108 1,537 14.23Lindsey Hunter, Missouri 2005 106 1,507 14.22Courtney Thompson, Washington 2003 112 1,590 14.20Wioleta Leszczynska, St. John’s (NY) 2007 124 1,759 14.19Michelle Moriarty, Texas 2007 103 1,461 14.18Ali Hausfeld, Duke 2007 121 1,714 14.17Lindsey Sherburne, San Diego 2004 106 1,499 14.14Lindsey Hunter, Missouri 2002 120 1,690 14.08
Assists Per Set With 25-Point Scoring Format (2008-Present)(Based on qualifiers for annual statistical championship)Player, Team Year Sets Assists Avg.Lauren Plum, Oregon 2012 121 1,618 13.37Jordan Clampitt, Tulsa 2010 114 1,492 13.09Ivone Martinez, Fla. Atlantic 2017 90 1,153 12.81Molly Kreklow, Missouri 2013 117 1,480 12.65Caitlin Dotson, Lipscomb 2013 112 1,412 12.61Ivone Martinez, Fla. Atlantic 2018 101 1,264 12.51Kelsi Meyers, San Diego 2010 102 1,275 12.50Alisha Glass, Penn St. 2008 116 1,450 12.50Avery Acker, SMU 2015 119 1,482 12.45Kendall Bateman, Southern California 2009 115 1,431 12.44Nevena Djordjevic, Oregon 2009 110 1,362 12.38Madison Lilley, Kentucky 2020 83 1,027 12.37Aubrey Kirven, Towson 2012 100 1,236 12.36Allie Monserez, Florida 2016 101 1,248 12.36Kendall Bateman, Southern California 2010 127 1,567 12.34

Individual Leaders 12
Player, Team Year Sets Assists Avg.Marissa Collins, Central Ark. 2012 127 1,562 12.30Kristin Hoffman, Northern Ill. 2011 124 1,522 12.27Jenna Gray, Stanford 2018 121 1,485 12.27Jo Wilks, Furman 2012 125 1,529 12.23Samantha Seliger-Swenson, Minnesota 2017 118 1,441 12.21Elizabeth Koberstein, Marquette 2013 116 1,413 12.18
SERVICEService Aces (1981-2000)Player, Team Year Sets AcesKim Spotswood, Morgan St. 1991 — 171Belinda Spivey, South Fla. 1986 158 168Kaysonlee Watson, Florida A&M 1993 144 159Maribeth Masica, George Mason 1986 106 156Wendy Stammer, LSU 1986 159 151Patti Kozicki, Florida 1987 232 147Teri Montoya, South Carolina 1983 131 141Casie Alexander, Seton Hall 1990 127 140Farley Snow, Jacksonville 1990 103 135Kelli Melerine, New Orleans 1983 137 135Lara Nance, Nicholls St. 1988 125 131
Service Aces With 30-Point Scoring Format (2001-07)Player, Team Year Sets AcesEileen Nicole Rodriguez, Albany (NY) 2002 113 207Eileen Nicole Rodriguez, Albany (NY) 2003 126 143Brooke Engel, North Texas 2006 126 123Mary Hock, Winthrop 2005 115 123Jana Milin, UMES 2004 124 116Martina Wagner, LIU 2006 122 115Ana Brzova, Iona 2002 121 114Sara Younes, Wichita St. 2002 109 111Martina Wagner, LIU 2007 127 109Sara Younes, Wichita St. 2003 112 109Stephanie Cisneros, Hampton 2003 88 108Brooke Engel, North Texas 2007 120 104Jana Milin, UMES 2003 118 104Eileen Nicole Rodriguez, Albany (NY) 2005 109 99Eileen Nicole Rodriguez, Albany (NY) 2004 105 98Amie Hamilton, Memphis 2001 116 97Ori Zuzic, Oral Roberts 2005 121 96Jana Milin, UMES 2002 108 95Sarah Miller, Towson 2001 118 93Mary Hock, Winthrop 2004 128 91
Service Aces With 25-Point Scoring Format (2008-Present)Player, Team Year Sets AcesMicha Hancock, Penn St. 2014 127 126Christine Edwards, Jackson St. 2012 124 118Mariena Hayden, UNLV 2018 127 114Micha Hancock, Penn St. 2011 121 91Samantha Bricio, Southern California 2015 130 89Samantha Bricio, Southern California 2013 122 85Jen Myer, Belmont 2011 108 85Samantha Bricio, Southern California 2014 120 84Sophia Cerino, Western Ky. 2019 118 83Micha Hancock, Penn St. 2013 127 82Laura Milos, Oral Roberts 2016 109 81Micha Hancock, Penn St. 2012 125 81Lauren Wicinski, Michigan St. 2012 129 81
Player, Team Year Sets AcesKantessa Bryant, Mississippi Val. 2008 123 80Zoe Bowens, UMES 2010 118 79Catherine Hanners, UNC Greensboro 2008 123 77Aubrey Ezell, South Carolina 2018 112 75Jessica Hays, Central Ark. 2010 122 75Melissa Deatsch, Oakland 2016 125 74Emily Danks, Ohio St. 2010 128 73
Service Aces Per Set (1981-2000) (Minimum 75 aces)Player, Team Year Sets Aces Avg.Maribeth Masica, George Mason 1986 106 156 1.472Farley Snow, Jacksonville 1990 103 135 1.311Kaysonlee Watson, Florida A&M 1993 144 159 1.104Casie Alexander, Seton Hall 1990 127 140 1.102Dawn Meester, UNI 1992 90 98 1.089Teri Montoya, South Carolina 1983 131 141 1.076Belinda Spivey, South Fla. 1986 158 168 1.063Lara Nance, Nicholls St. 1988 125 131 1.048Judy Constantin, ETSU 1984 95 99 1.042Beverly Robinson, Tennessee 1982 121 126 1.041Melinda Vogler, Dayton 1987 127 126 .992Kelli Melerine, New Orleans 1983 137 135 .985
Service Aces Per Set With 30-Point Scoring Format (2001-07)(Minimum 75 aces)Player, Team Year Sets Aces Avg.Eileen Nicole Rodriguez, Albany (NY) 2002 113 207 1.832Stephanie Cisneros, Hampton 2003 88 108 1.227Eileen Nicole Rodriguez, Albany (NY) 2003 126 143 1.135Mary Hock, Winthrop 2005 115 123 1.070Sara Younes, Wichita St. 2002 109 111 1.018Brooke Engel, North Texas 2006 126 123 .976Sara Younes, Wichita St. 2003 112 109 .973Martina Wagner, LIU 2006 122 115 .943Ana Brzova, Iona 2002 121 114 .942Jana Milin, UMES 2004 124 116 .935Eileen Nicole Rodriguez, Albany (NY) 2004 105 98 .933Eileen Nicole Rodriguez, Albany (NY) 2005 109 99 .908Jana Milin, UMES 2003 118 104 .881Jana Milin, UMES 2002 108 95 .880Princess Dixson, Alabama A&M 2001 91 79 .868Brooke Engel, North Texas 2007 120 104 .867Martina Wagner, LIU 2007 127 109 .858Natasha Nguyen, Georgetown 2002 105 88 .838Amie Hamilton, Memphis 2001 116 97 .836Princess Dixson, Alabama A&M 2002 97 81 .835
Service Aces Per Set With 25-Point Scoring Format (2008-Present)(Based on qualifiers for annual statistical championship)Player, Team Year Sets Aces Avg.Micha Hancock, Penn St. 2014 127 126 .992Christine Edwards, Jackson St. 2012 124 118 .950Mariena Hayden, UNLV 2018 127 114 .898Jen Myer, Belmont 2011 108 85 .787Micha Hancock, Penn St. 2011 121 91 .752Laura Milos, Oral Roberts 2016 109 81 .743Sophia Cerino, Western Ky. 2019 118 83 .703Samantha Bricio, Southern California 2014 120 84 .700Samantha Bricio, Southern California 2013 122 85 .697Saitaua Iosia, UMES 2012 90 62 .690Mariena Hayden, UNLV 2019 102 70 .686

Individual Leaders 13
Player, Team Year Sets Aces Avg.Samantha Bricio, Southern California 2015 130 89 .685Sien Gallop, Saint Louis 2017 100 67 .670Aubrey Ezell, South Carolina 2018 112 75 .670Zoe Bowens, UMES 2010 118 79 .669Gulce Nazli Dikecligil, Stony Brook 2008 108 71 .657Kantessa Bryant, Mississippi Val. 2008 123 80 .650Micha Hancock, Penn St. 2012 125 81 .650Marcela Gurgel, South Fla. 2008 111 72 .649Malina Sanchez, McNeese 2014 108 70 .648
BLOCKINGTotal Blocks With 30-Point Scoring Format (2001-07)Player, Team Year Sets Solo Ast. TotalMelissa Elmer, Nebraska 2005 115 17 233 250Nana Meriwether, UCLA 2006 124 18 224 242Endia Oliver, Tennessee St. 2007 123 56 169 225Amy Allison, Arkansas 2005 122 34 189 223Lecia Brown, Louisville 2007 107 23 198 221Michelle Franz, Sacramento St. 2006 123 29 192 221Ivana Kuzmic, Little Rock 2002 100 36 180 216Sabrina Apker, Missouri St. 2004 120 22 188 210Sarah Blum, Tennessee 2006 114 24 185 209Emillie Toone, Utah 2006 107 19 188 207Lindsy Hartsock, BYU 2004 110 9 196 205Lauren Brewster, Notre Dame 2005 124 50 152 202Christa Harmotto, Penn St. 2007 121 33 167 200Melissa Elmer, Nebraska 2004 106 29 171 200Rachel Wagener, Maryland 2003 133 23 177 200Josephine Prince, Fayetteville St. 2002 110 94 195 199Jamie Bouyer, Cleveland St. 2003 128 33 166 199Jennifer Haaser, Arkansas 2001 119 25 174 199Molly O’Brien, UNI 2001 117 13 186 199Queen Nzenwa, Kentucky 2007 123 24 174 198Taylor Reineke, Wisconsin 2005 115 17 181 198Liz Suiter, Stanford 2004 133 50 148 198
Total Blocks With 25-Point Scoring Format (2008-Present)Player, Team Year Sets Solo Ast. TotalWhitney Young, BYU 2014 121 8 221 229Erin Kirby, Wyoming 2013 127 22 203 225Charmaine Whitmore, UT Arlington 2013 124 22 202 224Katie Slay, Penn St. 2013 127 30 177 207Erin Kirby, Wyoming 2012 115 5 199 204Kelli Browning, Creighton 2012 124 15 189 204Amy Boswell, BYU 2014 121 21 182 203Faith Dooley, North Dakota 2017 138 36 166 202Nicole Warner, BYU 2012 112 13 189 202Johannah Bangert, Illinois 2008 126 7 195 202Ali Bastianelli, Illinois 2016 112 14 187 201Meredith Hardy, ETSU 2012 139 25 176 201Tami Alade, Stanford 2018 107 12 188 200Briana Holman, LSU 2013 130 38 162 200Ali Bastianelli, Illinois 2017 124 19 180 199Amanda Gil, Washington 2012 109 8 190 198Ashley Neff, Florida St. 2011 127 24 173 197Taylor Odom, Santa Clara 2019 120 13 183 196Stephanie Lynch, Purdue 2008 135 22 174 196Reed Copeland, Wyoming 2018 119 23 172 195Rhamat Alhassan, Florida 2017 115 14 181 195Katie Post, Ohio 2010 133 30 165 195
Blocks Per Set With 30-Point Scoring Format (2001-07)(Based on qualifiers for annual statistical championship)Player, Team Year Sets Solo Ast. Total Avg.Melissa Elmer, Nebraska 2005 115 17 233 250 2.17Ivana Kuzmic, Little Rock 2002 100 36 180 216 2.16Heather Wollyung, Quinnipiac 2001 92 81 115 196 2.13Lecia Brown, Louisville 2007 107 23 198 221 2.07Amber Holmquist, Nebraska 2002 98 26 171 197 2.01Nana Meriwether, UCLA 2006 124 18 224 242 1.95Emillie Toone, Utah 2006 107 19 188 207 1.93Sheila Ocasio-Clemente, UNLV 2001 92 14 163 177 1.92Melissa Elmer, Nebraska 2004 106 29 171 200 1.89Lindsy Hartsock, BYU 2004 110 9 196 205 1.86Sarah Blum, Tennessee 2006 114 24 185 209 1.83Endia Oliver, Tennessee St. 2007 123 56 169 225 1.83Amy Allison, Arkansas 2005 122 34 189 223 1.83Amber Holmquist, Nebraska 2001 105 24 166 190 1.81Josephine Prince, Fayetteville St. 2002 110 94 105 199 1.81Michelle Franz, Sacramento St. 2006 123 29 192 221 1.80Arielle Wilson, Penn St. 2007 83 18 131 149 1.80Christina Kirk, Saint Mary’s (CA) 2005 101 13 167 180 1.78Lauren Brewster, Notre Dame 2003 104 30 155 185 1.78Annalisa Muratore, Santa Clara 2004 74 14 117 131 1.77Liz Mikos, Valparaiso 2003 111 46 150 196 1.77
Blocks Per Set With 25-Point Scoring Format (2008-Present)(Based on qualifiers for annual statistical championship)Player, Team Year Sets Solo Ast. Total Avg.Whitney Young, BYU 2014 121 8 221 229 1.89Tami Alade, Stanford 2018 107 12 188 200 1.87Amanda Gil, Washington 2012 109 8 190 198 1.82Charmaine Whitmore, UT Arlington 2013 124 22 202 224 1.81Nicole Warner, BYU 2012 112 13 189 202 1.80Ali Bastianelli, Illinois 2016 112 14 187 201 1.79Makaila Jarema, Utah Valley 2018 105 8 179 187 1.78Erin Kirby, Wyoming 2012 115 5 199 204 1.77Erin Kirby, Wyoming 2013 127 22 203 225 1.77Taryn Knuth, Florida St. 2018 109 30 158 188 1.72Megan Plourde, Colorado St. 2011 104 8 170 178 1.71Jasmin Sneed, VCU 2018 105 22 157 179 1.70Rhamat Alhassan, Florida 2017 115 14 181 195 1.70Amy Boswell, BYU 2014 121 21 182 204 1.68Brittany Hewitt, Hawaii 2010 101 12 158 170 1.68Reed Copeland, Wyoming 2015 113 24 166 190 1.68Jasmin Sneed, VCU 2019 112 22 165 187 1.67Martina Samadan, VCU 2012 103 17 155 172 1.67Kelli Browning, Creighton 2012 124 15 189 204 1.65Reed Copeland, Wyoming 2018 119 23 172 195 1.64Faimie Kingsley, Denver 2012 110 21 159 180 1.64
DEFENSEDigs (1981-2000)Player, Team Year Sets DigsKim Diehlmann, Hartford 1990 152 777Anne Marie Hammers, Virginia 1989 148 758Margie Kolat, Arkansas St. 1993 165 748Kerry House, LMU (CA) 1990 138 740Natasha Sylvain, American 1994 144 735Kim Diehlmann, Hartford 1991 135 725Kathy Shaw, Delaware 1994 150 716Claudia Orban, Akron 1990 181 694

Individual Leaders 14
Player, Team Year Sets DigsJill McCreary, Akron 1990 182 657Joanna Dusza, Delaware 1996 136 655Shelly Gross, Georgia 1986 144 655Shalynn McCoy, UTSA 1989 — 651Mara Mordini, Davidson 2000 130 645Catalina Suarez, Kansas City 1989 104 644Stacy Humphries, Towson 1994 121 642
Digs With 30-Point Scoring Format (2001-03)Player, Team Year Sets DigsSarah Gascon, Southeastern La. 2003 118 786Leslie Whitfield, UNC Asheville 2002 135 763Stephanie Keller, Ball St. 2003 129 758Sarah Gascon, Southeastern La. 2002 116 745Paula Gentil, Minnesota 2003 130 656Carol Marcengo, UTRGV 2003 126 641Becky Dreher, Oral Roberts 2003 126 638Whitney Ashcraft, Virginia 2003 123 627Marie Dobrenz, Col. of Charleston 2003 116 626Becky Dreher, Oral Roberts 2002 116 611Brenda Waterman, UC Irvine 2003 133 600Tracy May, Western Ky. 2002 140 599Megan Lippi, Ga. Southern 2003 127 597Megan McGrane, Pittsburgh 2003 111 595Griselle Lopez Pereira, VCU 2003 116 593
Digs With 30-Point Scoring Format/Unlimited Libero Substitutions (2004-07)Player, Team Year Sets DigsLara Newberry, Chattanooga 2007 131 942Paula Gentil, Minnesota 2004 138 924Ashley Smith, UT Arlington 2006 132 863Stephanie Figgers, SFA 2006 123 853Amanda McCormick, Ball St. 2006 111 852Allison Nieters, Iona 2007 125 849Stephanie Barry, Delaware 2007 130 831Becky Dreher, Oral Roberts 2004 117 821Marie Dobrenz, Col. of Charleston 2006 132 777Gina Guide, Northern Ill. 2006 112 777Liz Rondone, Western Caro. 2006 129 770Kristin Lutes, Sacramento St. 2006 123 768Stesha Selsky, Michigan 2007 128 761Katherine Kenline, Tennessee Tech 2007 128 755Kaena Apana, ETSU 2007 120 750Sydney Donahue, Arizona St. 2006 113 742Peachy Jankowski, Purdue Fort Wayne 2006 132 742Brittany Malicoat, Valparaiso 2007 128 740Elena Martinez, LSU 2007 132 740Kristen Kirch, Austin Peay 2007 120 736Lara Newberry, Chattanooga 2005 122 736
Digs With 25-Point Scoring Format/Unlimited Libero Substitutions (2008-Present)Player, Team Year Sets DigsKasey Elswick, UT Martin 2011 131 852Courtney Pence, Illinois St. 2017 131 821Taylor Horsfall, Tulsa 2019 132 805Taylor Formico, UC Santa Barbara 2012 135 792Kallie Seimet, Bowling Green 2017 116 790Lesli Akeo, Siena 2012 129 788
Player, Team Year Sets DigsMcKenzie Hart, North Dakota 2015 126 787Lara Newberry, Chattanooga 2008 115 777Kallie Seimet, Bowling Green 2018 114 768Alana Wittenburg, Drake 2010 132 764Markie Schaedig, Arkansas St. 2014 114 762Yavianliz Rosado, Bradley 2018 127 758Paula Passmore, Chattanooga 2012 119 757Haley Stein, Eastern Mich. 2010 132 757Taylor Horsfall, Tulsa 2017 125 755Tessa McGill, Purdue Fort Wayne 2012 124 755Taylor Root, Valparaiso 2010 127 754Katie Forsythe, Loyola Maryland 2019 122 753Kim Maroon, Villanova 2011 109 749Ryann DeJarld, Notre Dame 2017 122 747
Digs Per Set (1981-2000) (Minimum 400 digs)Player, Team Year Sets Digs Avg.Catalina Suarez, Kansas City 1989 104 644 6.19Steph Lewis, Chattanooga 1987 83 484 5.83Evette Hoeffner, Rider 2000 83 461 5.55Kim Diehlmann, Hartford 1991 135 725 5.37Kerry House, LMU (CA) 1990 138 740 5.36Ashley Wacholder, Duke 1994 100 531 5.31Stacy Humphries, Towson 1994 121 642 5.31Meredith Ferlic, Tennessee Tech 1998 109 566 5.19Kari Hogancamp, Massachusetts 1999 101 523 5.18Missi Olson, UNC Greensboro 1991 112 578 5.16Jennifer Borton, Akron 1994 113 582 5.15Trina Maso de Moya, Wake Forest 2000 103 528 5.13Anne Marie Hammers, Virginia 1989 148 758 5.12Kim Diehlmann, Hartford 1990 152 777 5.11Natasha Sylvain, American 1994 144 735 5.10
Digs Per Set With 30-Point Scoring Format (2001-03) (Minimum 400 digs)Player, Team Year Sets Digs Avg.Sarah Gascon, Southeastern La. 2003 118 786 6.66Sarah Gascon, Southeastern La. 2002 116 745 6.42Evette Hoeffner, Rider 2001 92 564 6.13Stephanie Keller, Ball St. 2003 129 758 5.88Leslie Whitfield, UNC Asheville 2002 135 763 5.65Laura Downey-Wallace, Kansas St. 2002 102 558 5.47Jenny McReynolds, Princeton 2003 88 481 5.47Marie Dobrenz, Col. of Charleston 2003 115 626 5.40Megan McGrane, Pittsburgh 2003 111 595 5.36Becky Dreher, Oral Roberts 2002 116 611 5.27Griselle Lopez Pereira, VCU 2003 116 593 5.11Whitney Ashcraft, Virginia 2003 123 627 5.10Carol Marcengo, UTRGV 2003 126 641 5.09Becky Dreher, Oral Roberts 2003 126 638 5.06Paula Gentil, Minnesota 2003 130 656 5.05
Digs Per Set With 30-Point Scoring Format/Unlimited Libero Substitutions (2004-07)(Minimum 400 digs)Player, Team Year Sets Digs Avg.Amanda McCormick, Ball St. 2006 111 852 7.68Lara Newberry, Chattanooga 2007 131 942 7.19Becky Dreher, Oral Roberts 2004 117 821 7.02Gina Guide, Northern Ill. 2006 112 777 6.94

Individual Leaders 15
Player, Team Year Sets Digs Avg.Stephanie Figgers, SFA 2006 123 853 6.93Jenny McReynolds, Princeton 2005 84 574 6.83Debora Seilhamer, Southern California 2005 102 696 6.82Elvina Kung, Brown 2004 95 648 6.82Allison Nieters, Iona 2007 125 849 6.79Paula Gentil, Minnesota 2004 138 924 6.70Sydney Donahue, Arizona St. 2006 113 742 6.57Ashley Smith, UT Arlington 2006 132 863 6.54Heather Norris, Murray St. 2006 104 675 6.49Sydney Donahue, Arizona St. 2005 98 628 6.41Jena Pierson, James Madison 2007 109 698 6.40Stephanie Barry, Delaware 2007 130 831 6.39Brittany Nobilio, Eastern Ky. 2006 109 692 6.35Debora Seilhamer, Southern California 2006 114 721 6.32Amanda McCormick, Ball St. 2005 115 727 6.32Julie Walroth, Evansville 2007 104 656 6.31
Digs Per Set With 25-Point Scoring Format/Unlimited Libero Substitutions (2008-Present)(Based on qualifiers for annual statistical championship)Player, Team Year Sets Digs Avg.Kim Maroon, Villanova 2011 109 749 6.87Kallie Seimet, Bowling Green 2017 116 790 6.81Lara Newberry, Chattanooga 2008 115 777 6.76Kallie Seimet, Bowling Green 2018 114 768 6.74Markie Schaedig, Arkansas St. 2014 114 762 6.68Madeline Garda, Bowling Green 2016 109 726 6.66Dani Shepherd, Penn 2012 94 617 6.56Kasey Elswick, UT Martin 2011 131 852 6.50Yumi Garcia, Charlotte 2019 112 725 6.47Rachel Wells, UNC Asheville 2013 117 746 6.38Paula Passmore, Chattanooga 2012 119 757 6.36Brittany Stowers, Northern Ariz. 2008 92 581 6.32Lindsay Wightman, Oakland 2020 58 366 6.31Sabrina Baby, NJIT 2009 97 608 6.27Courtney Pence, Illinois St. 2017 131 821 6.27McKenzie Hart, North Dakota 2015 126 787 6.25Brittany Groth, Green Bay 2012 109 680 6.24Jenna Story, Wright St. 2019 111 692 6.23Katie Forsythe, Loyola Maryland 2019 122 753 6.17Rylee Hunt, Niagara 2017 105 648 6.17
CAREER RECORDS
ATTACKKillsPlayer, Team Years Sets KillsSvetlana Vtyurina, George Washington 1992-95 488 3,043Javonne Brooks, New Orleans 1989-92 597 2,932Stacey Gordon, Ohio St. 2001-04 457 2,798Tara Cross, Long Beach St. 1986-89 488 2,767Michelle Collier, South Fla. ^1998-02 481 2,729Priscilla Pacheco, Georgia 1991-94 480 2,675Jordan Thompson, Cincinnati 2015-16, 18-19 492 2,664Kim Willoughby, Hawaii 2000-03 439 2,598Tyler Henderson, Tulsa 2009-12 484 2,525Kelly-Anne Billingy, Marshall 2004-07 433 2,481Aline Pereira, George Mason 2000-03 411 2,478Ogonna Nnamani, Stanford 2001-04 498 2,450
Player, Team Years Sets KillsJill McCreary, Akron 1987, 89-91 546 2,439Lauren Wicinski, Northern Ill./Michigan St. 2010-11, 12-13 510 2,424Nicole Branagh, Minnesota 1997-00 451 2,379Carnae Dillard, North Texas 2012-15 489 2,327Fabiana Souza, Purdue Fort Wayne 2002-05 472 2,305Ori Zuzic, Oral Roberts 2003-06 493 2,304Katrien DeDecker, Minnesota 1993-96 479 2,300Lily Johnson, Missouri St. 2014-17 519 2,293Lauren Mackey, Morehead St. 1995-98 502 2,293Jenna Wrobel, Michigan St. 1995-98 444 2,292Lori Barberich, Penn St. 1981-84 517 2,282Sarah-Jane Mungo, Georgia St. 1988-91 475 2,281Laura Milos, Oral Roberts 2014-17 445 2,276^Received medical redshirt for 1999 season.
Kills Per Set(Minimum 1,000 kills)Player, Team Years Sets Kills Avg.Sarah McFarland, LMU (CA) 1997-00 314 2,020 6.43Svetlana Vtyurina, George
Washington1992-95 488 3,043 6.24
Stacey Gordon, Ohio St. 2001-04 457 2,798 6.12Aline Pereira, George Mason 2000-03 411 2,478 6.03Kim Willoughby, Hawaii 2000-03 439 2,598 5.92Renata Menchikova, UCF 1995-97 368 2,151 5.85Kelly-Anne Billingy, Marshall 2004-07 433 2,481 5.73Kristee Porter, UCLA 1998-01 397 2,255 5.68Michelle Collier, South Fla. ^1998-02 481 2,729 5.67Tara Cross, Long Beach St. 1986-89 488 2,767 5.67Mia Jerkov, California 2001-03 247 1,390 5.63Priscilla Pacheco, Georgia 1991-94 480 2,675 5.57Jordan Thompson, Cincinnati 2015-16,
18-19492 2,664 5.41
Jennifer Wittenburg, Houston 1999-01 261 1,406 5.39Teee Williams, Hawaii 1987-89 350 1,873 5.35Martina Veiglova, Ga. Southern 2001-03 375 1,993 5.31Nicole Branagh, Minnesota 1997-00 451 2,379 5.27Kim Glass, Arizona 2002-05 408 2,151 5.27Tyler Henderson, Tulsa 2009-12 484 2,525 5.22Cristina Pintilie, LIU 2001-04 392 2,037 5.20Catalina Suarez, Kansas/Kansas City 1985-86,
88-89373 1,938 5.20
Stephanie Volckers, Hartford 2001-03 310 1,609 5.19Kelly Wing, UC Irvine 2001-04 437 2,267 5.19Jenna Wrobel, Michigan St. 1995-98 444 2,292 5.16Laura Milos, Oral Roberts 2014-17 445 2,276 5.11Yarimar Rosa, FIU 2006-09 412 2,105 5.11^Received medical redshirt for 1999 season.
Total Attacks Player, Team Years Sets AttacksMichelle Collier, South Fla. ^1998-02 481 6,633Lily Johnson, Missouri St. 2014-17 519 6,610Jordan Thompson, Cincinnati 2015-16, 18-19 492 6,070Carnae Dillard, North Texas 2012-15 489 6,063Stacey Gordon, Ohio St. 2001-04 457 6,051Ori Zuzic, Oral Roberts 2003-06 493 6,041Priscilla Pacheco, Georgia 1991-94 480 6,006Svetlana Vtyurina, George
Washington1992-95 488 5,975
Javonne Brooks, New Orleans 1989-92 597 5,939Lauren Mackey, Morehead St. 1995-98 502 5,933Mary-Kate Marshall, Oregon St. 2014-17 470 5,900Fabiana Souza, Purdue Fort Wayne 2002-05 472 5,837Justine Farmer, Houston 2005-08 475 5,820

Individual Leaders 16
Player, Team Years Sets AttacksEmily Spencer, Purdue Fort Wayne 2011-14 484 5,807Rachel Iaquaniello, Eastern Mich. 2009-12 506 5,755Jill Haas, UC Santa Barbara/
Sacramento St.1993, 94-96 463 5,738
Katrien DeDecker, Minnesota 1993-96 479 5,708Sarah Obras, Ball St. 2002-05 455 5,699Tara Cross, Long Beach St. 1986-89 488 5,694Lauren Wicinski, Northern Ill./
Michigan St.2010-11, 12-13 510 5,669
Elisha Polk, Baylor 1996-99 484 5,633Krystal Osborne, Arkansas 1994-97 553 5,626Kelly Wing, UC Irvine 2001-04 437 5,596Ariel Turner, Purdue 2009-12 490 5,578Stephanie Bishop, DePaul 1998-01 493 5,566^Received medical redshirt for 1999 season.
Attacks Per Set(Minimum 2,500 attacks)Player, Team Years Sets Attacks Avg.Sarah McFarland, LMU (CA) 1997-00 314 4,405 14.03Michelle Collier, South Fla. ^1998-02 481 6,633 13.79Mia Jerkov, California 2001-03 247 3,381 13.69Kelly Paiva, Fla. Atlantic 2003-05 233 3,130 13.43Leslie Wohlford, LMU (CA) 1985-88 315 4,225 13.41Aline Pereira, George Mason 2000-03 411 5,500 13.38Stacey Gordon, Ohio St. 2001-04 457 6,051 13.24Stephanie Volckers, Hartford 2001-03 310 4,063 13.11Anissa Parker, McNeese 1997-00 426 5,492 12.89Lindsey Ruddins, UC Santa Barbara 2016-19 409 5,249 12.83Elizabeth Bishop, Cornell 2003-06 354 4,539 12.82Kelly Wing, UC Irvine 2001-04 437 5,596 12.81Lily Johnson, Missouri St. 2014-17 519 6,610 12.74Kim Glass, Arizona 2002-05 408 5,173 12.68Renata Menchikova, UCF 1995-97 368 4,663 12.67Ashley Wacholder, Duke 1991-94 424 5,339 12.59Mary-Kate Marshall, Oregon St. 2014-17 470 5,900 12.55Madison Kingdon, Arizona 2011-14 451 5,656 12.54Jennifer Corral, Tennessee St. 2002-03 212 2,657 12.53Sarah Obras, Ball St. 2002-05 455 5,699 12.53Priscilla Pacheco, Georgia 1991-94 480 6,006 12.51Laura Milos, Oral Roberts 2014-17 445 5,555 12.48Kelly Johnson, Texas Tech 2001-04 413 5,141 12.45Kristee Porter, UCLA 1998-01 397 4,936 12.43Jill Haas, UC Santa Barbara/
Sacramento St.1993, 94-96
463 5,738 12.39
^Received medical redshirt for 1999 season.
Hitting Percentage(Minimum 1,500 attacks)Player, Team Years Sets K-E/TA Pct.Chloe Mann, Florida 2010-13 297 902-134/1,614 .476Arielle Wilson, Penn St. 2007-10 444 1,114-189/1,975 .468Haleigh Washington, Penn St. 2014-17 439 1,171-193/2,136 .458Foluke Akinradewo, Stanford 2005-08 446 1,682-300/3,101 .446Christa Harmotto, Penn St. 2005-08 439 1,244-263/2,263 .433Heather Wright, Florida 1997-00 337 973-217/1,784 .424Virag Domokos, George Mason 1993-96 449 1,562-331/2,911 .423Rhamat Alhassan, Florida 2014-17 442 1,278-259/2,410 .423Ana Yartseva-Stewart, Louisville 2003-06 413 981-246/1,743 .422Danielle Scott, Long Beach St. 1990-93 447 1,778-447/3,164 .421Mary Eggers, Illinois 1985-88 516 1,774-327/3,440 .421Dana Rettke, Wisconsin 2017-20 396 1,412-268/2,725 .420Erica Berggren, South Fla. 1993-96 427 1,438-288/2,768 .415Emily Adams, Southern California 2001-04 344 1,049-207/2,029 .415Chichi Ikwuazom, Columbia 2016-19 279 1,027-221/1,951 .413
Player, Team Years Sets K-E/TA Pct.Amber Erhahon, Dayton 2014-17 450 1,114-240/2,114 .413&Inky Ajanaku, Stanford 2012-16 474 1,370-313/2,561 .413Abby Lehman, Wichita St. 2014-17 463 1,378-243/2,764 .411Rachel Kramer, Florida 2016-19 434 1,028-236/1,936 .409Lindsey Ensign, Princeton 2005-08 324 1,239-293/2,314 .409Jessica Swarbrick, Washington 2005-08 376 871-228/1,584 .406Katie Slay, Penn St. 2010-13 423 864-187/1,674 .404%Chiaka Ogbogu, Texas 2013-17 406 947-199/1,852 .404Lori Rowe, South Carolina 1983-86 507 1,855-298/3,874 .402Alexis Olgard, Southern California 2010-13 394 770-132/1,591 .401Chloe Ferrari, San Diego 2010-13 415 1,228-272/2,385 .401Virginia Stahr, Nebraska 1986-89 448 1,395-323/2,675 .401&Received medical redshirt for 2015. %Received medical redshirt for 2016 season.*Hitting percentage is derived by subtracting errors from kills and dividing that difference by total attacks.
SETTINGAssistsPlayer, Team Years Sets AssistsTammy Robertson, UAB 1989-92 620 6,650Michelle Jaworski, Penn St. 1987-90 527 6,596Courtney Thompson, Washington 2003-06 450 6,552Maureen Rafferty, Sacramento St. 1996-99 491 6,510Kele Eveland, Georgia Tech 2000-03 483 6,464Kara Jakusz, DePaul 1998-01 487 6,445Kanoe Kamana’o, Hawaii 2003-06 472 6,428Emily Sallee, Ball St. 1997-00 463 6,408Dani Reis, LSU 1989-92 509 6,379Cindy Cox, Colorado St. 1985-88 497 6,340Sheri Sanders, Long Beach St. 1986-89 488 6,301Erika Selsor, UCLA 1998-01 445 6,234Kelly Campbell, Colorado 1996-99 431 6,228Ali Hausfeld, Duke 2004-07 458 6,183Andrea Nachtrieb, Georgia Tech 1993-96 468 6,102Lindsey Hunter, Missouri 2002-05 444 6,096Sam Tortorello, Penn St. 2002-05 456 6,087Jill Arganbright, UNI 2000-03 480 6,064Shelby Snyder, Northern Ill. 1991-94 490 6,052Mary Frances Scott, Virginia 1996-99 485 6,044Sharon Oesterling, Minnesota 1986-89 514 6,024Lindsey Sherburne, San Diego 2002-05 433 6,014Nellie Spicer, UCLA 2005-08 480 6,000Sarah Runka, South Fla. 1994-97 457 5,995Anna-Lena Smith, BYU 1996-99 461 5,975
Assists Per Set(Minimum 2,500 assists)Player, Team Years Sets Assists Avg.Courtney Thompson, Washington 2003-06 450 6,552 14.56Kelly Campbell, Colorado 1996-99 431 6,228 14.45Melissa Beitz, Illinois 1996-99 410 5,797 14.14Roz Pelayo, Santa Clara 1997-00 409 5,732 14.01Erika Selsor, UCLA 1998-01 445 6,234 14.01Lindsey Sherburne, San Diego 2002-05 433 6,014 13.89Katie Virtue, Ohio St. 1999-02 407 5,648 13.88Emily Sallee, Ball St. 1997-00 463 6,408 13.84Lindsey Hunter, Missouri 2002-05 444 6,096 13.73Michelle Moriarty, Texas 2004-07 427 5,819 13.63Kanoe Kamana’o, Hawaii 2003-06 472 6,428 13.62Ali Hausfeld, Duke 2004-07 458 6,183 13.50Rachel Holloway, Nebraska 2006-07 212 2,861 13.50Kele Eveland, Georgia Tech 2000-03 483 6,464 13.38Bailey Robinson, Princeton 2005-08 257 3,439 13.38

Individual Leaders 17
Player, Team Years Sets Assists Avg.Carla Muntz, Dayton 1997-00 414 5,531 13.36Sam Tortorello, Penn St. 2002-05 456 6,087 13.35Bryn Kehoe, Stanford 2004-07 447 5,956 13.32Maureen Rafferty, Sacramento St. 1996-99 491 6,510 13.26Andrea Clark, San Diego St. 1994-97 371 4,916 13.25Samantha Carter, California 2003-06 436 5,777 13.25Tracy Holman, LMU (CA) 1994-97 405 5,362 13.24Kara Jakusz, DePaul 1998-01 487 6,445 13.23Janice Mounts, Southern California 1995-98 322 4,258 13.22Kelli Sousa, Santa Clara 2000-03 395 5,207 13.18
SERVICEService AcesPlayer, Team Years Sets AcesEileen Nicole Rodriguez, Albany (NY) 2002-05 453 547Casie Alexander, Seton Hall 1990-93 459 416Mellissa Cobb, UAB 1988-91 622 388Farley Snow, Jacksonville 1989-92 401 386Micha Hancock, Penn St. 2011-14 500 380Belinda Spivey, South Fla. 1985-89 438 373Wendy Stammer, LSU 1983-86 — 365Mary Hock, Winthrop 2002-05 508 360Sara Younes, Wichita St. 2001-04 421 351Jenifer Kleyn, Auburn 1988-91 478 338Charlotte Gillespie, Eastern Ky. 1981-84 — 330Jana Milin, UMES 2002-04 350 315Sharon Oesterling, Minnesota 1986-89 514 314Patty Lake, North Carolina St. 1985-88 467 304Samantha Bricio, Southern California 2012-15 493 301Dayle Hamontree, Morehead St. 1987-90 — 301
Service Aces Per Set(Minimum 100 aces)Player, Team Years Sets Aces Avg.Stephanie Cisneros, Hampton 2003 88 108 1.227Eileen Nicole Rodriguez, Albany (NY) 2002-05 453 547 1.208Lisa Preiss, Cincinnati 1983-84 152 180 1.184Farley Snow, Jacksonville 1989-92 401 386 .963Casie Alexander, Seton Hall 1990-93 459 416 .906Jana Milin, UMES 2002-04 350 315 .900Belinda Spivey, South Fla. 1985-89 438 373 .852Teri Montoya, South Carolina 1983-84 254 214 .843Sara Younes, Wichita St. 2001-04 421 349 .829Kim Funchess, Florida A&M 1985-88 307 252 .821Ana Brzova, Iona 2002-03 237 188 .793Micha Hancock, Penn St. 2011-14 500 380 .760Martina Wagner, LIU 2005-07 389 292 .751Sue Faris, Alabama 1989-92 337 250 .742Mary Hock, Winthrop 2002-05 508 360 .709Jenifer Kleyn, Auburn 1988-91 478 338 .707Jelena Mijatovic, LSU 2004-05 198 135 .682Aleesha Woodruff, Alabama St. 2006-07 163 111 .681Monica Freitas, LSU 1987-88 243 165 .679Sari Virtanen, BYU 1985-86 283 191 .675Mariena Hayden, UNLV 2017-20 399 269 .674Gracie Schutt, San Diego St. 1990-92 357 237 .664Fran Lupo, LSU 1987-88 191 126 .660Lutasha Bradley, Alabama A&M 2001-03 247 162 .656Patty Lake, North Carolina St. 1985-88 467 304 .651Princess Dixson, Alabama A&M 2001-04 380 246 .647
DEFENSEDigsPlayer, Team Years Sets DigsLara Newberry, Chattanooga 2005-08 483 3,176Paula Gentil, Minnesota 2002-05 506 2,791Kim Diehlmann, Hartford 1989-92 545 2,780Courtney Pence, Illinois St. 2015-18 483 2,778Taylor Root, Valparaiso 2009-12 496 2,752Keelie Arneson, Clemson 2012-15 511 2,707Raquel Miotto, UNC Asheville 2006-09 510 2,694Allison Nieters, Iona 2007-10 457 2,682Ellie Blankenship, UNI 2007-10 475 2,656Kasey Elswick, UT Martin 2009-12 456 2,606Stephanie Figgers, SFA 2003-06 472 2,598Caitlin Strimel, Western Mich. 2006-09 511 2,583Lena Oliver, Western Mich. 2010-13 476 2,544Ali McCurdy, Duke 2010-13 483 2,538Dena Ott, Eastern Ky. 2011-14 499 2,518Rylee Cookerly, Valparaiso 2017-20 463 2,514Taylor Horsfall, Tulsa 2016-19 496 2,489Emily Butters, Missouri St. 2015-18 513 2,482Marie Dobrenz, Col. of Charleston 2003-06 431 2,475Michelle Walroth, Jacksonville 2006-09 444 2,456Brittany Nobilio, Eastern Ky. 2004-07 417 2,454Jaci Gonzalez, Houston 2002-05 473 2,451Challen Geraghty, Kent St. 2014-17 453 2,441Jessica Adams, Tulsa 2009-12 488 2,437Katherine Kenline, Tennessee Tech 2006-09 462 2,432
Digs Per Set(Minimum 1,500 digs)Player, Team Years Sets Digs Avg.Lara Newberry, Chattanooga 2005-08 483 3,176 6.58Jenny McReynolds, Princeton 2003-05,
07378 2,296 6.07
Sydney Donahue, Arizona St. 2004-07 399 2,385 5.98Brittany Nobilio, Eastern Ky. 2004-07 417 2,454 5.88Allison Nieters, Iona 2007-10 457 2,682 5.87Amanda McCormick, Nebraska/Ball St. 2003-04,
05-06396 2,297 5.80
Yumi Garcia, Charlotte 2016-19 350 2,023 5.78Courtney Pence, Illinois St. 2015-18 483 2,778 5.75Marie Dobrenz, Col. of Charleston 2003-06 431 2,475 5.74Kasey Elswick, UT Martin 2009-12 456 2,606 5.71Kim Maroon, Villanova 2008-11 418 2,369 5.67Ellie Blankenship, UNI 2007-10 475 2,656 5.59Taylor Root, Valparaiso 2009-12 496 2,752 5.55Michelle Walroth, Jacksonville 2006-09 444 2,456 5.53Paula Gentil, Minnesota 2002-05 506 2,791 5.52Megan McGrane, Pittsburgh 2002-05 440 2,424 5.51Brittany Groth, Green Bay 2009-12 336 1,851 5.51Stephanie Figgers, SFA 2003-06 472 2,598 5.50Natalia Skiba, Northeastern 2011-14 433 2,381 5.50Paula Passmore, Chattanooga 2009-12 436 2,386 5.47Rylee Cookerly , Valparaiso 2017-20 463 2,514 5.43Jessica Strama, McNeese 2004-07 396 2,148 5.42Jennifer Alexander, Western Ill. 2003-06 433 2,343 5.41Challen Geraghty, Kent St. 2014-17 453 2,441 5.39Abby Bottomley , High Point 2017-20 403 2,158 5.35Lena Oliver, Western Mich. 2010-13 476 2,544 5.34Tamari Miyashiro, Washington 2006-09 447 2,382 5.33Keelie Arneson, NorthWestern Colo. 2011-14 401 2,131 5.31Megan Mushovic, Cornell 2006-09 384 2,040 5.31

Individual Leaders 18
MISCELLANEOUSMatches PlayedPlayer, Team Years MatchesMargie Kolat, Arkansas St. 1991-94 172Emily Rome, Delaware 1992-95 166Karen Kunselman, Delaware 1993-96 164Nikki Brassell, Delaware 1992-95 164Amy Patchell, Arkansas St. 1991-94 164Jeanne Asper, Hofstra 1988-91 162Dylann Duncan, BYU 1985-88 162Cathy Koontz, Arkansas St. 1992-95 159Jerelyn Lawson, Delaware 1989-92 159Liz Masakayan, UCLA 1982-85 159Kendyl Sorge, UNI 2015-18 158Darlene DeNapoli, Hofstra 1987-90 157LaToya Clark, Jackson St. 2008-11 156Emily Queisser, UCF 1992-95 156Amie McKinney, Hofstra 1988-91 156Jessica Paarlberg, Syracuse 1988-91 156Terry Puccio, Hofstra 1987-90 155Julie Earhart, Delaware 1986-89 155Darci Starr, Southeastern La. 1992-95 154Karen Beegle, Delaware 1988-91 154Amy Sutt, Southern Miss. 1987-90 154Sue Gades, Hofstra 1982-85 154Brittany Larkin, Jackson St. 2007-10 153Gena Farris, Lamar 1990-93 153Michelle Griffin, La.-Monroe 1984-87 153Karyn Palgut, Florida St. 1981-84 153
Consecutive Matches PlayedPlayer, Team Years MatchesCathy Koontz, Arkansas St. 1992-95 159Kendyl Sorge, UNI 2015-18 158Emily Queisser, UCF 1992-95 156Jessica Paarlberg, Syracuse 1988-91 156Amy Sutt, Southern Miss. 1987-90 154Gena Farris, Lamar 1990-93 153Karyn Palgut, Florida St. 1981-84 153Tyra Harper, UCF 1994-97 151Miriam Metzcus, UCF 1991-94 151Julie Stempel, LSU 1988-91 151Tuba Meto, Southeast Mo. St. 1994-97 149Megan Hodge, Penn St. 2006-09 147Janelle Karlan, Notre Dame 1990-93 145Annette Bauer, Purdue 1981-84 145Anita Greichgauer, Nicholls St. 1994-97 144Stacy Thompson, Nicholls St. 1994-97 144Amy Vander Meer, Northern Ill. 1990-93 144Lori Rowe, South Carolina 1983-86 144Nicole Fawcett, Penn St. 2005-08 143Tori Grafeman, Winthrop 2003-06 143Taryn Surbaugh, Winthrop 2003-06 143Sarah Rogers, Western Ky. 2009-12 142Kelly Potts, Western Ky. 2007-10 142Lindsey Gould, Western Ky. 2006-09 142Megan Argabright, Western Ky. 2005-08 142Meredith Nelson, Minnesota 2003-06 142Jennifer Randall, Georgia Tech 2002-05 142Dionne Nash, Massachusetts 1993-96 142Carlyn Fisk, UIC 1988-91 142
Sets PlayedPlayer, Team Years SetsClaudia Orban, Akron 1988-91 649
Player, Team Years SetsDanielle Reaves, UAB 1988-91 630Mellissa Cobb, UAB 1988-91 622Tamin Uthoff, UTSA 1987-90 622Tammy Robertson, UAB 1989-92 620Karen Godzinski, Akron 1989-92 615Margie Kolat, Arkansas St. 1991-94 613Javonne Brooks, New Orleans 1989-92 597Marcy Haluska, Akron 1989-92 595Julie Myers, UAB 1986-89 595Hilary Beck, UAB 1988-92 573Tina Godzinski, Akron 1987-90 569Emily Rome, Delaware 1992-95 568Corinne Russel, BYU 1984-87 567Wendy Huber, UAB 1990-93 566Cathy Koontz, Arkansas St. 1992-95 562Karen Beegle, Delaware 1988-91 562Krystal Osborne, Arkansas 1994-97 553Tuba Meto, Southeast Mo. St. 1994-97 551LaToya Clark, Jackson St. 2008-11 550Tonya Larson, UAB 1994-97 550Jeanne Asper, Hofstra 1988-91 550Claudia Fann, Central Conn. St. 1991-94 549Sheri Hall, Charlotte 1985-88 549Jerelyn Lawson, Delaware 1989-92 547Amy Patchell, Arkansas St. 1991-94 546
Consecutive Sets PlayedPlayer, Team Years SetsTuba Meto, Southeast Mo. St. 1994-97 551Hannah Kirk, Jacksonville St. 2014-17 531Lily Johnson, Missouri St. 2014-17 519Katie Eberling, Western Mich. 2006-09 516Michelle Moore, Western Mich. 2006-09 516Heather Watts, Memphis 2001-04 515Jeanne Asper, Hofstra 1988-91 *515Emily Butters, Missouri St. 2015-18 513Kendyl Sorge, UNI 2015-18 512Lauren Smith, Creighton 2013-16 511Lindsey Gould, Western Ky. 2006-09 510Lexi Zimmerman, Michigan 2007-10 509Lori Rowe, South Carolina 1983-86 507Ashley Mason, Eastern Mich. 2008-11 506Taryn Surbaugh, Winthrop 2003-06 503Duygu Duzceler, Florida St. 2009-12 500Laura Cote, Memphis 2005-08 500Allyson Doyle, Western Mich. 2007-10 498Heather Thomas, UAB 2008-11 492Paige Erickson, Delaware 2007-10 490Greta Gibboney, Delaware 2007-10 490Alana Wittenburg, Drake 2007-10 490Sidney Stewart, SMU 2008-11 489Stephanie Barry, Delaware 2006-09 488Amanda Cecil, Western Ky. 2001-04 488Ashly Miller, Western Ky. 2001-04 488Tessa McGill, Purdue Fort Wayne 2009-12 487Sarah Rogers, Western Ky. 2009-12 487Kelsey Jewasko, UTSA 2008-11 487Stephanie Niemer, Cincinnati 2007-10 487*Missed one match in career. All other players in list played every set through career.

Annual Individual Champions 19
Kills Per SetYear Player, Team Sets Kills Avg.1994 Priscilla Pacheco, Georgia 127 785 6.181995 Svetlana Vtyurina, George Washington 120 847 7.061996 Vanessa Wouters, Ohio St. 119 765 6.431997 Sarah Noriega, LMU (CA) 89 614 6.901998 Jenna Wrobel, Michigan St. 108 641 5.941999 Sarah McFarland, LMU (CA) 102 750 7.352000 Sarah McFarland, LMU (CA) 98 762 *7.782001 Kim Willoughby, Hawaii 118 850 7.202002 Aline Pereira, George Mason 110 724 6.582003 Aline Pereira, George Mason 113 753 6.662004 Stacey Gordon, Ohio St. 119 842 7.082005 Laura Jones, Texas A&M 115 700 6.092006 Kelly-Anne Billingy, Marshall 101 668 6.612007 Kim Babcock, Northern Ariz. 91 512 5.632008 Yarimar Rosa, FIU 126 657 5.212009 Yun Yi Zhang, Temple 98 544 5.552010 Tyler Henderson, Tulsa 114 710 6.232011 Lauren Wicinski, Northern Ill. 124 662 5.342012 Tyler Henderson, Tulsa 128 668 5.222013 McKenzie Adams, UTSA 113 653 5.782014 Karsta Lowe, UCLA 118 703 5.962015 Carnae Dillard, North Texas 127 687 5.412016 Danielle Rygelski, Saint Louis 119 715 6.012017 Lindsey Ruddins, UC Santa Barbara 90 526 5.842018 Jordan Thompson, Cincinnati 132 827 6.272019 Jordan Thompson, Cincinnati 125 798 6.382020 Dani Drews, Utah 66 344 5.21*Record.
Assists Per SetYear Player, Team Sets Assists Avg.1994 Laura Davis, Ohio St. 107 1,567 14.641995 Jen Boleyn, Ohio St. 103 1,591 15.451996 Becci Roehl, Pepperdine 84 1,284 15.291997 Kimberly Coleman, UCLA 110 1,646 14.961998 Disney Bronnenberg, Kansas St. 109 1,694 *15.541999 Dana Chuha, Baylor 89 1,308 14.702000 Dana Chuha, Baylor 108 1,623 15.032001 Katie Virtue, Ohio St. 108 1,537 14.232002 Kelli Sousa, Santa Clara 112 1,610 14.382003 Kele Eveland, Georgia Tech 122 1,822 14.932004 Lindsey Laband, Georgia Tech 108 1,663 15.402005 Courtney Thompson, Washington 108 1,608 14.892006 Courtney Thompson, Washington 118 1,711 14.502007 Bailey Robinson, Princeton 99 1,426 14.402008 Alisha Glass, Penn St. 116 1,450 12.502009 Kendall Bateman, Southern California 115 1,431 12.442010 Jordan Clampitt, Tulsa 114 1,492 13.092011 Kristin Hoffman, Northern Ill. 124 1,522 12.272012 Lauren Plum, Oregon 121 1,618 13.372013 Molly Kreklow, Missouri 117 1,480 12.652014 Madi Bugg, Stanford 123 1,488 12.102015 Avery Acker, SMU 119 1,482 12.452016 Allie Monserez, Florida 101 1,248 12.362017 Ivone Martinez, Fla. Atlantic 90 1,153 12.812018 Ivone Martinez, Fla. Atlantic 101 1,264 12.512019 Armania Heckenmueller, Cincinnati 125 1,514 12.112020 Madison Lilley, Kentucky 83 1,027 12.37
*Record.
Service Aces Per SetYear Player, Team Sets Aces Avg.1994 Erica Smith, Mississippi Val. 90 84 .9331995 Zvjezdana Sirola, Oral Roberts 107 98 .9161996 Jenna Birkel, Duquesne 113 77 .6811997 Elicia Warner, Alabama St. 120 89 .7421998 Nalinya Davis, Southern U. 92 89 .9671999 Cassiana Costa, Centenary (LA) 119 87 .7312000 Kelly Weiler, South Alabama 106 74 .6982001 Princess Dixson, Alabama A&M 91 79 .8682002 Eileen Nicole Rodriguez, Albany (NY) 113 *207 *1.8322003 Stephanie Cisneros, Hampton 88 108 1.2272004 Jana Milin, UMES 124 116 .9352005 Mary Hock, Winthrop 115 123 1.0702006 Brooke Engel, North Texas 126 123 .9762007 Brooke Engel, North Texas 120 104 .8672008 Gulce Nazli Dikecligil, Stony Brook 108 71 .6572009 Ashley Herman, Delaware St. 107 67 .6262010 Zoe Bowens, UMES 118 79 .6692011 Jen Myer, Belmont 108 85 .7872012 Christine Edwards, Jackson St. 124 118 .9522013 Samantha Bricio, Southern California 122 85 .6972014 Micha Hancock, Penn St. 127 126 .9922015 Samantha Bricio, Southern California 130 89 .6852016 Laura Milos, Oral Roberts 109 81 .7432017 Sien Gallop, Saint Louis 100 67 .6702018 Mariena Hayden, UNLV 127 114 .9002019 Sophia Cerino, Western Ky. 118 83 .7002020 Mariena Hayden, UNLV 49 42 .860*Record.
Digs Per SetYear Player, Team Sets Digs Avg.1994 Ashley Wacholder, Duke 100 531 5.311995 Jill Raslevich, Youngstown St. 87 431 4.951996 Maureen Reindl, Duke 97 488 5.031997 Vickie Paciski, Troy 96 488 5.081998 Meredith Ferlic, Tennessee Tech 109 566 5.191999 Kari Hogancamp, Massachusetts 101 523 5.182000 Evette Hoeffner, Rider 83 461 5.552001 Evette Hoeffner, Rider 92 564 6.132002 Sarah Gascon, Southeastern La. 116 745 6.422003 Sarah Gascon, Southeastern La. 118 786 6.662004 Becky Dreher, Oral Roberts 117 821 7.022005 Jenny McReynolds, Princeton 84 574 6.832006 Amanda McCormick, Ball St. 111 852 *7.682007 Lara Newberry, Chattanooga 131 *942 7.192008 Lara Newberry, Chattanooga 115 777 6.762009 Sabrina Baby, NJIT 97 608 6.272010 Taylor Root, Valparaiso 127 754 5.942011 Kim Maroon, Villanova 109 749 6.872012 Dani Shepherd, Penn 94 617 6.562013 Rachel Wells, UNC Asheville 117 746 6.382014 Markie Schaedig, Arkansas St. 114 762 6.682015 McKenzie Hart, North Dakota 126 787 6.252016 Madeline Garda, Bowling Green 109 726 6.662017 Kallie Seimet, Bowling Green 116 790 6.812018 Kallie Seimet, Bowling Green 114 768 6.742019 Yumi Garcia, Charlotte 112 725 6.472020 Lindsay Wightman, Oakland 58 366 6.31*Record.
ANNUAL INDIVIDUAL CHAMPIONS

Annual Individual Champions 20
Hitting PercentageYear Player, Team Sets K E TA Pct.1994 Erica Berggren, South Fla. 118 394 79 728 .4331995 Virag Domokos, George Mason 115 463 87 829 .4541996 Val Sterk, Michigan St. 115 502 93 911 .4491997 Nique Crump, Long Beach St. 110 345 70 643 .4281998 Veronica Walls, Long Beach St. 90 209 46 383 .4261999 Heather Wright, Florida 121 400 76 718 .4512000 Marisa DaLee, Arizona 115 402 79 739 .4372001 Angela Knopf, Colorado St. 111 449 82 805 .4562002 Sara McGee, Stanford 129 402 102 705 .4262003 Jayli Jackson, Florida A&M 92 259 56 429 .4732004 Maria Andonova, Florida A&M 95 332 51 558 .5042005 Jennifer Hoffman, Louisville 121 336 66 607 .4452006 Nana Meriwether, UCLA 124 507 89 933 .4482007 Foluke Aki--adewo, Stanford 118 485 70 831 .4992008 Christa Harmotto, Penn St. 113 275 51 461 .4862009 Arielle Wilson, Penn St. 122 337 36 557 *.5402010 Rachael Adams, Texas 117 339 88 567 .4432011 Tindall Sewell, Davidson 106 241 41 465 .4302012 Chloe Mann, Florida 104 381 70 700 .4442013 Chloe Mann, Florida 107 369 47 636 .5062014 Rhamat Alhassan, Florida 113 301 67 511 .4582015 Martina Samadan, Seattle 107 360 59 663 .4542016 Emma Hagedorn, Kansas City 101 300 54 561 .4392017 Haleigh Washington, Penn St. 123 370 46 659 .4922018 Santita Ebangwese, Syracuse 108 253 50 478 .4252019 Lauren Matthews, Western Ky. 118 470 86 857 .4482020 Taryn Knuth, Florida St. 50 123 11 204 .549*Record.
Blocks Per SetYear Player, Team Sets Solo Ast. Tot. Avg.1994 Carla Ellis, Howard 134 74 192 266 1.991995 Kathy Brinkworth, Buffalo 121 37 186 223 1.841996 Angelica Ljungquist, Hawaii 123 35 201 236 1.921997 Makare Desilets, Washington 108 42 180 222 2.061998 Nina Puikkonen, BYU 107 38 194 232 2.171999 Heather Bown, Hawaii 102 32 198 230 2.252000 Amber Holmquist, Nebraska 111 21 199 220 1.982001 Heather Wollyung,
Quinnipiac92 81 115 196 2.13
2002 Ivana Kuzmic, Little Rock 100 36 180 216 2.162003 Lauren Brewster, Notre
Dame104 30 155 185 1.78
2004 Melissa Elmer, Nebraska 106 29 171 200 1.892005 Melissa Elmer, Nebraska 115 17 233 250 2.172006 Nana Meriwether, UCLA 124 18 224 242 1.952007 Lecia Brown, Louisville 107 23 198 221 2.072008 Johannah Bangert, Illinois 126 7 195 202 1.602009 Johannah Bangert, Illinois 113 11 168 179 1.582010 Brittany Hewitt, Hawaii 101 12 158 170 1.682011 Megan Plourde, Colorado St. 104 8 170 178 1.712012 Amanda Gil, Washington 109 8 190 198 1.822013 Charmaine Whitmore, UT
Arlington124 22 202 224 1.81
2014 Whitney Young, BYU 121 8 221 229 1.892015 Reed Copeland, Wyoming 113 24 166 190 1.682016 Ali Bastianelli, Illinois 112 14 187 201 1.792017 Rhamat Alhassan, Florida 115 14 181 195 1.702018 Tami Alade, Stanford 107 12 199 200 1.872019 Jasmin Sneed, VCU 112 22 165 187 1.672020 Amaya Tillman, Louisville 55 22 76 98 1.78
Points Per Set
Year Player, Team Sets Kills AcesBlock
SoloBlock Assist Pts. Avg.
2009 Destinee Hooker, Texas 104 526 47 33 54 633 6.092010 Tyler Henderson, Tulsa 114 710 12 16 44 760 6.672011 Lauren Wicinski,
Northern Ill.124 662 71 16 34 766 6.18
2012 Tyler Henderson, Tulsa 128 668 32 11 61 741.5 5.792013 Vendula Strakova,
Hampton112 626 65 8 61 729.5 6.51
2014 Karsta Lowe, UCLA 118 703 33 7 71 778.5 6.602015 Samantha Bricio,
Southern California130 668 89 9 74 803 6.18
2016 Danielle Rygelski, Saint Louis
119 715 65 3 50 808 6.79
2017 Lindsey Ruddins, UC Santa Barbara
90 526 25 12 37 581.5 6.46
2018 Jordan Thompson, Cincinnati
132 827 46 7 58 909 6.89
2019 Jordan Thompson, Cincinnati
125 798 48 5 38 870 6.96
2020 Dani Drews, Utah 66 344 18 3 27 378.5 5.73

Team Records 21
Official NCAA volleyball records began with the 1981 season and are based on information submitted to the NCAA statistics service by institutions partici-pating in the statistics rankings. In statistical rankings, the rounding of percent-ages and/or averages may indicate ties where none exists. In these cases, the numerical order of the rankings is accurate.In 2011, team season blocking categories were added for seasons since 2001. Research continues on single match data for those seasons. Information on blocking from 1981 to 2000 has not been included in the following records since there appeared to be a significant variance in the methods by which blocking statistics were kept during those years. An “M” located after a number under a “sets played” column indicates the number of matches played, as the number of sets is unavailable.The 2020 season was split between the fall of 2020 and spring of 2021 due to the COVID-19 pandemic. The minimum number of matches played during the 2020 season for record book inclusion in single-season per game categories was 10 matches, which was the minimum required for at-large NCAA cham-pionship consideration.
ATTACKKillsThree-set match
99—George Mason vs. Virginia, Nov. 6, 1992Four-set match
109—Texas A&M vs. Texas, Oct. 18, 2000; Eastern Ill. vs. Austin Peay, Sept. 29, 2000; UC Irvine vs. UTSA, Sept. 7, 2000; San Diego St. vs. Colorado St., Nov. 13, 1993
Five-set match130—Washington St. vs. Washington, Oct. 21, 1981
Season2,875—Kentucky, 1983 (194 sets)
Per set19.33—Santa Clara, 2000 (2,262 kills in 117 sets)
Total AttacksThree-set match
235—Illinois St. vs. Missouri, Sept. 9, 1984Four-set match
318—Austin Peay vs. Eastern Ill., Sept. 29, 2000Five-set match
359—Sacramento St. vs. Eastern Wash., Sept. 30, 1999Season
7,055—Akron, 1990 (197 sets)Per set
48.93—Ohio St., 1985 (5,236 in 107 sets)
Hitting Percentage*Three-set match
.800—Colorado St. vs. LMU (CA), Sept. 4, 1987 (45-5/50)Four-set match
.529—New Hampshire vs. Saint Peter’s, Sept. 22, 2000 (102-20/155)Five-set match
.485—Santa Clara vs. Missouri St., Sept. 25, 1993 (53-3/103)Season
.406—Hofstra, 1983 (1,317-283/2,546 in 120 sets)*Hitting percentage is derived by subtracting errors from kills and dividing that difference by total attacks.
SETTINGAssistsThree-set match
87—Illinois St. vs. Missouri, Sept. 9, 1984Four-set match
109—UC Irvine vs. UTSA, Sept. 7, 2000
Five-set match116—Nebraska vs. Texas, Nov. 5, 1988
Season2,435—Kentucky, 1983 (194 sets)
Per set17.87—Santa Clara, 2000 (2,091 assists in 117 sets)
SERVICEService AcesThree-set match
36—Alabama A&M vs. Alcorn, Oct. 11, 2011Four-set match
26—South Carolina St. vs. Howard, Aug. 30, 2002; UNI vs. Winona St., Nov. 6, 1991; Charlotte vs. Wake Forest, Nov. 7, 1985
Five-set match49—Western Ill. vs. Michigan, Nov. 13, 1982
Season544—LSU, 1983 (199 sets)
Per set3.81—Dayton, 1987 (510 aces in 134 sets)
BLOCKINGTotal Blocks (Since 2001)Season
517—Grambling, 2001 (139 sets, 262 solo, 510 assists)Per set
4.18—Nebraska, 2001 (451.0 total blocks in 108 sets)
DEFENSEDigsThree-set match
137—Wichita St. vs. North Texas, Sept. 29, 1989Four-set match
180—Santa Clara vs. Pepperdine, Oct. 10, 1991Five-set match
223—Hawaii vs. Cal Poly, Nov. 7, 1988Season
3,342—Akron, 1989 (189 sets)Per set
23.95—Clemson, 1986 (3,042 digs in 127 sets)
SCORINGMost Points ScoredThree-set match (1981-2000)
55—Oregon St. vs. Kentucky, Sept. 3, 1994 (15-2, 25-23, 15-13); San Jose St. vs. Nevada, Oct. 16, 1993 (15-13, 15-11, 25-23)
Three-set match with 30-point scoring format (2001-07)109—Fairfield vs. Mercer, Sept. 19, 2004 (30-20, 36-34, 43-41)
Three-set match with 25-point scoring format (2008-present)96—Manhattan vs. Rider, Oct. 23, 2009 (45-43, 26-24, 25-16)
Four-set match (1981-2000)69—Rhode Island vs. West Virginia, Oct. 15, 1988 (15-11, 14-16, 20-18,
20-18)Four-set match with 30-point scoring format (2001-07)
135—Texas A&M vs. Texas Tech, Oct. 10, 2001 (36-38, 39-37, 30-21, 30-25)
Four-set match with 25-point scoring format (2008-present)114—Cal St. Fullerton vs. Montana, Sept. 3, 2009 (25-23, 26-28, 25-14,
38-36)
TEAM RECORDS

Team Records 22
Five-set match (1981-2000)89—Hawaii vs. BYU, Nov. 28, 1998 (15-12,
21-19, 13-15, 16-18, 24-22)Five-set match with 30-point scoring format (2001-07)
150—James Madison vs. Georgia St., Oct. 26, 2007 (34-36, 30-19, 35-37, 30-21, 21-23)
Five-set match with 25-point scoring format (2008-present)
132—Saint Mary’s (CA) vs. Santa Clara, Nov. 21, 2017 (22-25, 25-22, 44-46, 26-24, 15-11)
Single set (1981-2000)28—Navy vs. Loyola Maryland, Nov. 7, 2000
(28-26)Single set with 30-point scoring format (2001-07)
48—Georgia Tech vs. Minnesota, Dec. 10, 2004 (48-46)
Single set with 25-point scoring format (2008-present)
46—Santa Clara vs. Saint Mary’s (CA), Nov. 21, 2017 (46-44)
Fewest Points AllowedThree-set match
0—Ga. Southern vs. Savannah St., Nov. 17, 2000 (15-0, 15-0, 15-0); Hofstra vs. Maine, Oct. 30, 1999 (15-0, 15-0, 15-0); Alabama A&M vs. Southern U., Sept. 3, 1999 (15-0, 15-0, 15-0); Long Beach St. vs. Southern U., Dec. 3, 1998 (15-0, 15-0, 15-0); Cincinnati vs. Chicago St., Sept. 15, 1997 (15-0, 15-0, 15-0); George Washington vs. Coppin St., Aug. 29, 1997 (15-0, 15-0, 15-0)
Four-set match19—Arkansas St. vs. Troy, Sept. 18, 1999 (15-
3, 15-1, 11-15, 15-0); Central Conn. St. vs. Hartford, Sept. 12, 1987 (15-1, 15-1, 6-15, 15-2)
Five-set match38—North Carolina vs. Georgia Tech, Sept. 8,
1989 (15-3, 12-15, 11-15, 15-4, 15-1)
MISCELLANEOUSBest Winning Percentage
1.000—Penn St., 2009 (38-0); Penn St., 2008 (38-0); Southern California, 2003 (35-0); Nebraska, 2000 (34-0); Long Beach St., 1998 (36-0)
Consecutive Winning Seasons
39—By four teams (Hawaii, Nebraska, Penn St., Stanford), 1981-20 (current)
Consecutive Nonlosing Seasons
39—By five teams (Hawaii, Nebraska, UNI, Penn St., Stanford), 1981-20 (current)
Matches Won In a Season
60—Texas, 1981
Matches Lost In a Season
40—Oklahoma, 1981
Consecutive Matches Won
109—Penn St., Sept. 21, 2007-Sept. 10, 2010
Consecutive Sets Won111—Penn St., Dec. 15, 2007-Dec. 18, 2008
Consecutive Home-Court Matches Won
94—Penn St., Sept. 1, 2006-Dec. 11, 2010
Consecutive Road Matches Won
55—Penn St., Sept. 28, 2007-Sept. 10, 2010
Consecutive Conference Matches Won(All matches vs. conference opponents)
132—Hawaii, Oct. 17, 1998-Oct. 11, 2006 (Western Athletic)
Consecutive Regular-Season Conference Matches Won(Regular-season matches vs. conference opponents)
145—Florida, Sept. 20, 1995-Nov. 12, 2004 (Southeastern)
Most Improved Won-Lost Record
28 matches—Arkansas St., 1988 (41-1, from 8-24 in 1987)
Consecutive Matches Lost
139—Chicago St., Oct. 4, 1993-Sept. 18, 1999
Longest Match3:38—Hawaii def. BYU, Nov. 28, 1998 (3-2)
Shortest Match0:27—VCU def. UMES, Sept. 10, 1999 (3-0)
Consecutive Matches With At Least One Service Ace
297—Kansas St., Nov. 13, 1998-Sept. 13, 2008

Team Leaders 23
SINGLE-MATCH RECORDSATTACKKills, Three-Set MatchNo. Team vs. Opponent Date99 George Mason vs. Virginia Nov. 6, 199298 Illinois St. vs. Missouri Sept. 9, 198493 Southern California vs. Washington St. Oct. 11, 199691 Colorado vs. Texas Tech Oct. 6, 199988 Citadel vs. Coppin St. Sept. 1, 200188 Pacific vs. Florida Dec. 11, 199986 Colorado vs. Oklahoma Oct. 31, 199785 Santa Clara vs. Saint Mary’s (CA) Oct. 13, 200085 Wisconsin vs. San Diego Dec. 5, 199885 Illinois vs. Minnesota Oct. 24, 199885 Illinois vs. Arkansas Sept. 17, 199783 Georgia Tech vs. Clemson Sept. 25, 199683 CSUN vs. LMU (CA) Nov. 1, 199483 BYU vs. Stanford Dec. 12, 198682 Colorado vs. Missouri Nov. 25, 200082 Colorado vs. Notre Dame Sept. 6, 199882 San Diego St. vs. Fresno St. Nov. 27, 199682 Fairfield vs. Army West Point Sept. 7, 199682 Hawaii vs. Long Beach St. Sept. 26, 198782 Texas vs. Texas Tech Oct. 10, 1984
Kills, Four-Set MatchNo. Team vs. Opponent Date 109 Texas A&M vs. Texas Oct. 18, 2000109 Eastern Ill. vs. Austin Peay Sept. 29, 2000109 UC Irvine vs. UTSA Sept. 7, 2000109 San Diego St. vs. Colorado St. Nov. 13, 1993108 Long Beach St. vs. UC Santa Barbara Sept. 30, 1999108 Northern Ill. vs. Virginia Tech Sept. 4, 1999108 Kansas St. vs. CSUN Dec. 4, 1996107 Ohio St. vs. Iowa Nov. 22, 1996107 LMU (CA) vs. Sacramento St. Sept. 16, 1995107 Kentucky vs. Duke Oct. 9, 1992106 Austin Peay vs. Eastern Ill. Sept. 29, 2000106 Purdue vs. Duke Oct. 15, 1986105 Baylor vs. Temple Dec. 3, 1999105 Pacific vs. UC Santa Barbara Oct. 3, 1998105 Purdue vs. Michigan Nov. 22, 1996
Kills, Five-Set MatchNo. Team vs. Opponent Date 130 Washington St. vs. Washington Oct. 21, 1981128 UCLA vs. Stanford Oct. 19, 1990121 Kansas St. vs. Illinois Sept. 19, 1998121 Illinois vs. Nebraska Nov. 11, 1989120 Sam Houston St. vs. Lamar Oct. 6, 1992120 Stanford vs. UCLA Oct. 19, 1990119 Hawaii vs. Cal Poly Nov. 7, 1988118 UT Arlington vs. Penn St. Nov. 24, 1989118 UC Santa Barbara vs. San Diego St. Nov. 20, 1986117 Oral Roberts vs. SMU Nov. 8, 2000116 Cal St. Fullerton vs. TCU Sept. 16, 2000116 Hawaii vs. BYU Nov. 28, 1998116 Miami (OH) vs. Eastern Mich. Nov. 24, 1990116 Nebraska vs. Texas Nov. 5, 1988
Total Attacks, Three-Set MatchNo. Team vs. Opponent Date235 Illinois St. vs. Missouri Sept. 9, 1984233 Sacramento St. vs. Northern Ariz. Nov. 29, 1997230 Northern Ariz. vs. Sacramento St. Nov. 29, 1997225 Citadel vs. Coppin St. Sept. 1, 2001221 Xavier vs. Dayton Oct. 3, 2000217 Wyoming vs. Saint Mary’s (CA) Sept. 20, 1996212 Missouri St. vs. Illinois St. Nov. 24, 2000212 BYU vs. Utah Nov. 6, 1991211 LMU (CA) vs. Arizona St. Aug. 26, 2006208 Sacramento St. vs. Weber St. Sept. 16, 2000208 Colorado vs. Texas Tech Oct. 6, 1999208 Ball St. vs. Miami (OH) Sept. 30, 1998206 Colorado vs. Texas A&M Nov. 1, 2000206 Brown vs. Yale Oct. 22, 1999205 Furman vs. Davidson Nov. 19, 2000
Total Attacks, Four-Set MatchNo. Team vs. Opponent Date 318 Austin Peay vs. Eastern Ill. Sept. 29, 2000301 Auburn vs. Mississippi St. Nov. 12, 1995300 Butler vs. Wright St. Oct. 16, 1998299 Cincinnati vs. Evansville Sept. 25, 1993297 Eastern Ill. vs. Austin Peay Sept. 29, 2000283 Morehead St. vs. Austin Peay Oct. 25, 1997281 Santa Clara vs. Sacramento St. Sept. 12, 2000281 Dartmouth vs. Princeton Nov. 13, 1998281 LMU (CA) vs. Sacramento St. Sept. 16, 1995280 Saint Mary’s (CA) vs. Portland Oct. 9, 1999279 Wright St. vs. Butler Oct. 16, 1998278 Southeast Mo. St. vs. UTEP Sept. 9, 2000278 Murray St. vs. Morehead St. Oct. 24, 1998277 Sam Houston St. vs. UT Arlington Oct. 5, 2004277 Lamar vs. UT Arlington Oct. 14, 2000
Total Attacks, Five-Set MatchNo. Team vs. Opponent Date 359 Sacramento St. vs. Eastern Wash. Sept. 30, 1999344 Cincinnati vs. Northeastern Ill. Sept. 24, 1993342 Portland vs. Oregon St. Oct. 15, 1991340 Eastern Wash. vs. Sacramento St. Sept. 30, 1999338 LMU (CA) vs. Portland Oct. 25, 1990329 Miami (OH) vs. Eastern Mich. Nov. 24, 1990329 Hawaii vs. Cal Poly Nov. 7, 1988328 UC Santa Barbara vs. Cal Poly Dec. 2, 1989323 Kansas vs. Notre Dame Sept. 20, 1986316 Hawaii vs. BYU Nov. 28, 1998315 Sacramento St. vs. Montana St. Oct. 22, 1999314 Indiana vs. Iowa Nov. 5, 1988313 Oregon St. vs. Portland Oct. 15, 1991311 UNC Asheville vs. UMBC Nov. 10, 1996311 Arkansas St. vs. Louisiana Oct. 6, 1984
Hitting Percentage, Three-Set Match(Minimum 15 attacks per set)Pct. (K-E/TA) Team vs. Opponent Date.800 (45-5/50) Colorado St. vs. LMU (CA) Sept. 4, 1987.725 (39-2/51) Mercer vs. Savannah St. Oct. 4, 2001.716 (56-3/74) Marshall vs. Savannah St. Sept. 13, 2003.709 (40-1/55) Fairfield vs. Iona Nov. 3, 1999
TEAM LEADERS

Team Leaders 24
Pct. (K-E/TA) Team vs. Opponent Date.702 (34-1/47) Penn St. vs. Buffalo Sept. 4, 2009.697 (49-3/66) Pepperdine vs. Air Force Nov. 22, 2011.691 (43-5/55) Pittsburgh vs. Savannah St. Sept. 13, 2002.689 (33-2/45) Northwestern vs. Towson Sept. 18, 1998.673 (35-2/49) American vs. Coppin St. Oct. 8, 1998.661 (43-4/59) Wisconsin vs. Savannah St. Sept. 14, 2012.661 (40-1/59) Oregon vs. Fresno St. Oct. 10, 1986.657 (49-3/70) Hawaii vs. Cal St. Fullerton Oct. 2, 1987.654 (36-2/52) Arkansas St. vs. Alcorn Sept. 16, 2011.652 (47-4/66) Illinois vs. Western Ky. Sept. 2, 2017.646 (45-3/65) New Orleans vs. Louisiana Tech Oct. 19, 1990.646 (35-4/48) Towson vs. Alabama A&M Aug. 27, 2016.646 (33-2/48) UNI vs. Tulsa Sept. 9, 1995
Hitting Percentage, Four-Set Match(Minimum 15 attacks per set)Pct. (K-E/TA) Team vs. Opponent Date.529 (102-20/155) New Hampshire vs. Saint Peter’s Sept. 22, 2000.490 (60-12/98) Colorado vs. Oakland Sept. 20, 2019.490 (61-12/100) Idaho St. vs. Montana St. Oct. 11, 1986.488 (73-11/127) Texas Tech vs. Liberty Sept. 4, 2000.486 (60-8/107) California vs. Chicago St. Aug. 31, 2019.481 (59-8/106) Boise St. vs. UC Riverside Sept. 19, 2015.479 (67-11/117) Baylor vs. Washington Dec. 14, 2019.479 (56-11/94) Seton Hall vs. Villanova Oct. 20, 1990.477 (68-7/128) Xavier vs. Georgetown Oct. 16, 2015.473 (54-11/91) Ga. Southern vs. Winthrop Sept. 24, 1993.472 (66-7/125) Jacksonville vs. NJIT Oct. 4, 2019.471 (67-10/121) Mississippi St. vs. Little Rock Sept. 2, 2016.468 (60-9/109) South Dakota vs. Wyoming Sept. 13, 2019.465 (79-13/142) Arkansas St. vs. New Orleans Nov. 19, 1999.462 (55-13/91) Toledo vs. Tulsa Sept. 17, 1988.461 (65-12/115) Missouri vs. Northern Ill. Sept. 7, 2019.461 (57-10/102) UMES vs. Delaware St. Oct. 20, 2017.461 (51-10/89) Long Beach St. vs. Lamar University Sept. 14, 2018.459 (37-9/61) Virginia vs. George Mason Sept. 22, 1990.459 (68-7/133) Minnesota vs. New Mexico St. Sept. 9, 1988
Hitting Percentage, Five-Set Match(Minimum 15 attacks per set)Pct. (K-E/TA) Team vs. Opponent Date.485 (53-3/103) Santa Clara vs. Missouri St. Sept. 25, 1993.477 (73-11/130) Michigan St. vs. South Alabama Sept. 15, 1989.470 (77-14/134) Omaha vs. North Dakota St. Sept. 23, 2018.445 (65-8/128) Penn St. vs. Cincinnati Dec. 13, 2019.444 (54-10/99) Saint Mary’s (CA) vs. Chaminade Sept. 13, 1991.432 (73-10/146) FGCU vs. USC Upstate Nov. 11, 2016.422 (77-15/147) UC Davis vs. CSUN Oct. 13, 2019.420 (81-8/174) Charlotte vs. South Alabama Nov. 13, 1986.411 (65-7/141) Hawaii vs. Western Mich. Sept. 18, 1984.410 (59-9/122) Providence vs. Georgetown Sept. 24, 2017.406 (64-12/128) Missouri vs. South Carolina Nov. 8, 2017.404 (83-9/183) Arkansas vs. Georgia Oct. 11, 1996.400 (80-10/175) Minnesota vs. Illinois Oct. 23, 1982.399 (91-22/173) ETSU vs. Western Caro. Nov. 12, 1989.397 (57-11/116) VCU vs. Saint Louis Nov. 15, 2019.396 (78-15/159) Bowling Green vs. UT Arlington Dec. 5, 1992.396 (76-15/154) Illinois vs. Tulsa Sept. 10, 2011.395 (65-20/114) Texas Southern vs. Grambling Oct. 14, 2011.392 (77-17/153) Southern California vs. Oregon Oct. 22, 2010.392 (58-9/125) Iowa St. vs. Omaha Sept. 5, 1988.392 (75-19/143) Virginia Tech vs. Iowa St. Aug. 25, 2017.392 (72-16/143) Texas A&M vs. Georgetown Oct. 21, 2016
SETTINGAssists, Three-Set MatchNo. Team vs. Opponent Date87 Illinois St. vs. Missouri Sept. 9, 198484 Southern California vs. Washington St. Oct. 11, 199682 Pacific vs. Florida Dec. 11, 199982 Colorado vs. Oklahoma Oct. 31, 199782 Fairfield vs. Army West Point Sept. 7, 199681 Seton Hall vs. Saint Peter’s Sept. 17, 198880 Colorado vs. Texas Tech Oct. 6, 199980 Wisconsin vs. San Diego Dec. 5, 199879 Colorado vs. Missouri Nov. 25, 200079 BYU vs. Stanford Dec. 12, 198678 Ball St. vs. Western Mich. Nov. 27, 199978 Michigan vs. Illinois Oct. 11, 199778 Fairfield vs. Yale Oct. 21, 199577 Santa Clara vs. Saint Mary’s (CA) Oct. 13, 200076 Kansas St. vs. Kansas Oct. 4, 2000
Assists, Four-Set MatchNo. Team vs. Opponent Date 109 UC Irvine vs. UTSA Sept. 7, 2000105 Eastern Ill. vs. Austin Peay Sept. 29, 2000104 Texas A&M vs. Texas Oct. 18, 2000104 Long Beach St. vs. UC Santa Barbara Sept. 30, 1999102 Florida A&M vs. Jacksonville Oct. 8, 2002100 Baylor vs. Temple Dec. 3, 1999100 Purdue vs. Michigan Nov. 22, 1996100 San Diego St. vs. Colorado St. Nov. 13, 199399 Washington St. vs. Southern California Oct. 24, 199298 Georgia Tech vs. Wake Forest Oct. 20, 200098 Murray St. vs. Southeast Mo. St. Oct. 15, 199998 Northern Ill. vs. Virginia Tech Sept. 4, 199998 Texas Tech vs. Baylor Nov. 28, 199696 LMU (CA) vs. San Francisco Oct. 16, 199295 Austin Peay vs. Eastern Ill. Sept. 29, 200095 Kansas St. vs. CSUN Dec. 4, 1996
Assists, Five-Set MatchNo. Team vs. Opponent Date 116 Nebraska vs. Texas Nov. 5, 1988114 Pepperdine vs. Rhode Island Dec. 2, 1995112 Miami (OH) vs. Eastern Mich. Nov. 24, 1990112 UCLA vs. Stanford Oct. 19, 1990111 Oral Roberts vs. SMU Nov. 8, 2000111 Kansas St. vs. Illinois Sept. 19, 1998111 Stanford vs. UCLA Oct. 19, 1990109 Southern California vs. Pacific Nov. 28, 1998109 Indiana vs. Purdue Nov. 7, 1998108 Colorado vs. Texas Tech Nov. 13, 1999108 Illinois vs. Nebraska Nov. 11, 1989108 Illinois vs. Purdue Oct. 22, 1986108 Southern California vs. UCLA Nov. 20, 1985107 Hawaii vs. BYU Nov. 28, 1998106 Georgia Tech vs. North Carolina Nov. 11, 2000106 Baylor vs. Texas Nov. 3, 1999106 Hawaii vs. Cal Poly Nov. 7, 1988
SERVICEService Aces, Three-Set MatchNo. Team vs. Opponent Date36 Alabama A&M vs. Alcorn Oct. 11, 2011

Team Leaders 25
No. Team vs. Opponent Date31 Nicholls St. vs. Alcorn Sept. 14, 201131 Hampton vs. Delaware St. Aug. 30, 200330 Wofford vs. Savannah St. Oct. 12, 200230 Albany (NY) vs. Wagner Sept. 27, 200229 Buffalo vs. Niagara Sept. 18, 199128 Navy vs. Coppin St. Sept. 3, 200228 Stetson vs. Savannah St. Oct. 10, 200128 Centenary (LA) vs. LSU-Shreveport Nov. 2, 199227 Wofford vs. Savannah St. Oct. 7, 200127 Delaware St. vs. UMES Sept. 1, 200025 UMES vs. Delaware St. Oct. 6, 200325 Coppin St. vs. UMES Sept. 14, 200025 Oral Roberts vs. Lincoln Memorial Oct. 5, 199125 Ga. Southern vs. Savannah St. Oct. 9, 199025 Duke vs. Western Caro. Oct. 5, 1989
Service Aces, Four-Set MatchNo. Team vs. Opponent Date 26 South Carolina St. vs. Howard Aug. 30, 200226 UNI vs. Winona St. Nov. 6, 199126 Charlotte vs. Wake Forest Nov. 7, 198525 Southern U. vs. Dillard Sept. 5, 200025 Wisconsin vs. UIC Sept. 7, 198324 UNC Greensboro vs. UT Martin Aug. 24, 200624 Seton Hall vs. Army West Point Sept. 9, 199324 Cornell vs. Saint Francis (PA) Oct. 8, 198824 Ga. Southern vs. Armstrong St. Oct. 4, 198824 Hofstra vs. Lehigh Oct. 2, 198824 Cincinnati vs. Akron Sept. 12, 198623 Campbell vs. N.C. Central Oct. 16, 200723 Winthrop vs. N.C. A&T Sept. 8, 199823 Florida vs. South Fla. Nov. 2, 198723 LSU vs. Tulane Sept. 22, 198723 Kansas St. vs. Tulsa Sept. 19, 1987
Service Aces, Five-Set MatchNo. Team vs. Opponent Date 49 Western Ill. vs. Michigan Nov. 13, 198234 Duquesne vs. Niagara Sept. 27, 199133 Michigan St. vs. Minnesota Oct. 7, 198332 La.-Monroe vs. Southeastern La. Oct. 9, 198431 New Orleans vs. Southeastern La. Sept. 20, 198331 New Orleans vs. Southern U. Sept. 9, 198327 Lipscomb vs. Radford Aug. 29, 200326 South Carolina St. vs. Mississippi Val. Sept. 13, 200226 Ga. Southern vs. Augusta Sept. 27, 199026 Clemson vs. Augusta Sept. 5, 198925 American vs. East Carolina Nov. 12, 198825 New Mexico vs. Arizona St. Sept. 7, 198424 Morehead St. vs. Jacksonville Oct. 12, 198924 ETSU vs. Marshall Oct. 15, 198824 Auburn vs. Tuskegee Oct. 7, 198624 Texas vs. Northwestern Oct. 2, 1982
DEFENSEDigs, Three-Set MatchNo. Team vs. Opponent Date137 Wichita St. vs. North Texas Sept. 29, 1989130 BYU vs. Utah Nov. 6, 1991130 Cincinnati vs. North Carolina Oct. 19, 1985124 Murray St. vs. Austin Peay Oct. 25, 1989123 Coastal Carolina vs. Elon Oct. 7, 2000121 Texas Southern vs. Prairie View Oct. 26, 1999
No. Team vs. Opponent Date120 Ga. Southern vs. Florida A&M Oct. 7, 1989118 LMU (CA) vs. Arizona St. Aug. 26, 2006118 Santa Clara vs. Wyoming Sept. 6, 1986117 Arizona St. vs. LMU (CA) Aug. 26, 2006117 Houston vs. Southern Miss. Oct. 5, 2002117 Prairie View vs. Texas Southern Oct. 26, 1999117 Milwaukee vs. Butler Oct. 3, 1997117 Murray St. vs. Tennessee Tech Oct. 14, 1989116 Illinois vs. Purdue Sept. 29, 1998
Digs, Four-Set MatchNo. Team vs. Opponent Date 180 Santa Clara vs. Pepperdine Oct. 10, 1991166 Morehead St. vs. Austin Peay Oct. 25, 1997162 Wisconsin vs. Michigan Sept. 21, 1985161 Southern Ill. vs. Alabama Sept. 9, 1990159 American vs. James Madison Nov. 22, 1991152 Eastern Ill. vs. Austin Peay Sept. 29, 2000148 Western Ill. vs. UNI Nov. 9, 1985145 UNC Asheville vs. Tennessee Nov. 1, 1997144 Austin Peay vs. Eastern Ill. Sept. 29, 2000144 Wright St. vs. Butler Oct. 16, 1998144 Duke vs. Kentucky Nov. 26, 1994144 Washington St. vs. Southern California Oct. 24, 1992144 North Carolina vs. Maryland Nov. 10, 1991143 Sam Houston St. vs. UT Arlington Oct. 5, 2004141 Eastern Ill. vs. Eastern Ky. Nov. 15, 1996140 Texas St. vs. SFA Nov. 4, 2006140 Arkansas St. vs. Texas Tech Oct. 5, 1991
Digs, Five-Set MatchNo. Team vs. Opponent Date 223 Hawaii vs. Cal Poly Nov. 7, 1988214 Canisius vs. Mercyhurst Sept. 13, 1990198 Oregon St. vs. Portland Oct. 15, 1991196 Western Ky. vs. Arkansas St. Nov. 17, 1991192 North Carolina St. vs. Georgetown Sept. 16, 1994186 Portland vs. Oregon St. Oct. 15, 1991183 Saint Mary’s (CA) vs. Portland Oct. 14, 1989182 Eastern Wash. vs. Sacramento St. Sept. 30, 1999181 LMU (CA) vs. Portland Oct. 25, 1990180 Kansas City vs. North Texas Sept. 30, 1989177 UC Santa Barbara vs. Cal Poly Dec. 2, 1989175 Michigan vs. Wisconsin Sept. 21, 1985174 Eastern Ill. vs. Wichita St. Nov. 3, 1989
SEASON RECORDS
ATTACKKills (1981-2000)Team Year Sets KillsKentucky 1983 194 2,875Akron 1990 197 2,684LSU 1982 200 2,583Northwestern 1981 193 2,579Georgia Tech 1996 140 2,551Akron 1989 189 2,548LSU 1983 199 2,486UCLA 1990 138 2,458BYU 1984 157 2,451UCLA 1983 161 2,436San Diego St. 1984 166 2,435

Team Leaders 26
Team Year Sets KillsBYU 1985 156 2,397UCLA 1986 141 2,364Col. of Charleston 1991 187 2,359LSU 1986 165 2,359UCF 1995 141 2,347BYU 1986 148 2,332Delaware 1994 181 2,327
Kills With 30-Point Scoring Format (2001-07)Team Year Sets KillsMinnesota 2004 139 2,458Georgia Tech 2002 145 2,423Georgia Tech 2003 129 2,355Temple 2002 138 2,271Hawaii 2003 125 2,270South Fla. 2002 136 2,270Winthrop 2002 144 2,267Western Ky. 2002 140 2,251UCF 2002 140 2,249Minnesota 2003 134 2,228LIU 2004 140 2,226Western Mich. 2006 133 2,218Ohio St. 2004 120 2,204Memphis 2003 135 2,204Sacramento St. 2007 135 2,199St. John’s (NY) 2007 125 2,197LIU 2005 142 2,190Memphis 2004 136 2,187Stanford 2007 125 2,182Minnesota 2002 136 2,176
Kills With 25-Point Scoring Format (2008-Present)Team Year Sets KillsWisconsin 2013 146 2,046Michigan 2012 146 2,031UNI 2017 131 1,997Illinois 2011 143 1,978Sacramento St. 2017 146 1,972Oregon 2012 123 1,962Tulane 2018 143 1,952Valparaiso 2018 146 1,938Southern California 2017 136 1,929Ohio St. 2011 135 1,928Texas St. 2020 141 1,927Michigan 2009 138 1,925Col. of Charleston 2018 135 1,913Utah 2019 137 1,909Southern California 2015 130 1,893UNI 2018 126 1,890Cincinnati 2019 125 1,889Wichita St. 2015 135 1,889Tulsa 2012 131 1,889Utah 2017 131 1,886
Kills Per Set (1981-2000)Team Year Sets Kills Avg.Santa Clara 2000 117 2,262 19.33Colorado 1998 107 2,034 19.01Texas A&M 2000 98 1,862 19.00Pepperdine 1996 93 1,763 18.96UCLA 1997 110 2,047 18.61Pacific 2000 103 1,915 18.59Ohio St. 1995 103 1,915 18.59
Team Year Sets Kills Avg.Colorado 1996 103 1,909 18.53Illinois 1998 120 2,220 18.50Illinois 1995 122 2,251 18.45UCLA 2000 124 2,282 18.40Long Beach St. 1999 118 2,168 18.37Southern California 1998 107 1,960 18.32Kansas St. 1998 109 1,993 18.28Georgia Tech 1996 140 2,551 18.22Georgia Tech 1992 115 2,094 18.21UCLA 1992 109 1,978 18.15Pepperdine 1997 113 2,043 18.08Hawaii 1998 124 2,237 18.04Colorado 1999 110 1,983 18.03
Kills Per Set With 30-Point Scoring Format (2001-07) Team Year Sets Kills Avg.Georgia Tech 2004 114 2,125 18.64Ohio St. 2004 120 2,204 18.37Georgia Tech 2003 129 2,355 18.26Hawaii 2002 114 2,074 18.19Hawaii 2003 125 2,270 18.16San Diego 2004 109 1,947 17.86Nebraska 2007 103 1,829 17.76Ohio 2005 120 2,125 17.71Southern California 2003 113 2,001 17.71Minnesota 2004 139 2,458 17.68Missouri 2004 103 1,820 17.67Pepperdine 2001 89 1,571 17.65Southern California 2002 107 1,884 17.61St. John’s (NY) 2007 125 2,197 17.58Duke 2007 122 2,139 17.53Washington 2005 108 1,892 17.52Ohio St. 2001 108 1,890 17.50Texas A&M 2001 112 1,960 17.50Florida 2007 109 1,906 17.49Penn St. 2004 109 1,906 17.49
Kills Per Set With 25-Point Scoring Format (2008-Present)Team Year Sets Kills Avg.Oregon 2012 123 1,962 15.95Boise St. 2015 105 1,632 15.54Fla. Atlantic 2018 99 1,517 15.32Valparaiso 2008 119 1,823 15.32Kentucky 2020 83 1,271 15.31San Diego 2010 104 1,592 15.31Missouri 2013 117 1,789 15.29UNI 2017 131 1,997 15.24UNI 2010 119 1,813 15.24Stanford 2010 109 1,658 15.21Tulsa 2010 114 1,730 15.18San Diego 2013 109 1,649 15.13Cincinnati 2019 125 1,889 15.11Kansas 2015 113 1,706 15.10UCLA 2014 121 1,827 15.10Texas A&M 2009 109 1,644 15.08Cal Poly 2017 101 1,522 15.07Fla. Atlantic 2017 99 1,491 15.06New Mexico St. 2020 61 918 15.05Lipscomb 2013 112 1,683 15.03
Total Attacks (1981-2000)Team Year Sets TAAkron 1990 197 7,055

Team Leaders 27
Team Year Sets TADelaware 1994 181 6,904Akron 1988 192 6,614LSU 1983 199 6,571Kentucky 1983 194 6,558Akron 1989 189 6,485Northwestern 1981 193 6,435LMU (CA) 1990 143 6,391LSU 1982 200 6,297Chattanooga 1996 149 6,280Morehead St. 1993 148 6,225Davidson 2000 136 6,214Georgia Tech 1996 140 6,167Col. of Charleston 1991 187 6,162Washington St. 1988 148 6,060Sam Houston St. 1996 145 6,045Eastern Ill. 1997 133 6,025Iowa 1988 136 6,015Sacramento St. 1999 124 5,997UNC Asheville 1996 138 5,983
Total Attacks With 30-Point Scoring Format (2001-07)Team Year Sets TAUT Arlington 2006 132 6,159Minnesota 2004 139 6,109Chattanooga 2007 131 6,056Centenary (LA) 2002 146 6,007North Carolina 2005 131 5,886Ball St. 2003 129 5,858Sacramento St. 2007 135 5,831Georgia Tech 2002 145 5,747Temple 2002 138 5,717Purdue Fort Wayne 2006 132 5,708Winthrop 2002 144 5,704Robert Morris 2001 135 5,690UNC Asheville 2004 139 5,686Tennessee Tech 2007 128 5,684Delaware 2007 130 5,683Marshall 2003 144 5,671UCF 2002 140 5,646UNC Greensboro 2007 137 5,638Houston 2006 137 5,629UCLA 2007 125 5,624
Total Attacks With 25-Point Scoring Format (2008-Present)Team Year Sets TASacramento St. 2017 146 5,732Valparaiso 2018 146 5,697UC Santa Barbara 2012 135 5,494Wisconsin 2013 146 5,458UNI 2017 131 5,368Michigan 2012 146 5,305Tulsa 2012 131 5,290North Dakota 2017 138 5,239Valparaiso 2010 130 5,239Houston 2019 141 5,231Bryant 2018 139 5,228Southeast Mo. St. 2012 134 5,214Texas St. 2014 132 5,212Illinois St. 2017 131 5,205Bradley 2018 127 5,200Illinois 2011 143 5,162UT Martin 2011 131 5,152Texas St. 2020 141 5,137
Team Year Sets TAUNI 2015 133 5,131Southern Ill. 2019 134 5,123
Total Attacks Per Set (1981-2000)Team Year Sets TA Avg.Ohio St. 1985 107 5,236 48.93Sacramento St. 1999 124 5,997 48.36Montana 1999 107 5,132 47.96Clemson 1986 124 5,846 47.15Sacramento St. 1996 126 5,939 47.13Texas A&M 2000 98 4,613 47.07Pepperdine 1996 93 4,361 46.89New Mexico 1996 105 4,920 46.86Colorado 1996 103 4,795 46.55Northern Ariz. 1999 111 5,125 46.17Creighton 2000 106 4,884 46.08Austin Peay 1999 129 5,943 46.07Santa Clara 2000 117 5,386 46.03Providence 1999 103 4,741 46.03Indiana 1990 110 5,063 46.03Eastern Ill. 1998 113 5,186 45.89Creighton 1999 106 4,848 45.74Kent St. 1999 120 5,487 45.73Davidson 2000 136 6,214 45.69Brown 1999 106 4,835 45.61
Total Attacks Per Set With 30-Point Scoring Format (2001-07)Team Year Sets TA Avg.Murray St. 2007 114 5,345 46.89Murray St. 2006 105 4,910 46.76UT Arlington 2006 132 6,159 46.66Pepperdine 2004 97 4,522 46.62Princeton 2004 108 5,028 46.56Austin Peay 2007 120 5,573 46.44Rider 2006 106 4,904 46.26Morehead St. 2002 117 5,412 46.26Chattanooga 2007 131 6,056 46.23Brown 2007 92 4,237 46.05Illinois St. 2007 117 5,381 45.99Milwaukee 2007 112 5,140 45.89Texas Tech 2001 119 5,449 45.79Morehead St. 2003 114 5,218 45.77Eastern Ky. 2006 112 5,109 45.62SFA 2006 123 5,602 45.54Austin Peay 2001 104 4,729 45.47Sam Houston St. 2006 94 4,273 45.46Southeastern La. 2001 100 4,543 45.43Ball St. 2003 129 5,858 45.41
Total Attacks Per Set With 25-Point Scoring Format (2008-Present)Team Year Sets TA Avg.Penn 2012 96 4,098 42.69Drake 2020 75 3,143 41.91Bradley 2020 69 2,879 41.72Valparaiso 2017 117 4,870 41.62Northern Ky. 2018 121 4,995 41.28IUPUI 2008 121 4,980 41.16Bradley 2018 127 5,220 41.10UNI 2017 131 5,368 40.98Drake 2017 121 4,935 40.79IUPUI 2018 108 4,402 40.76Cornell 2017 88 3,583 40.72UC Santa Barbara 2012 135 5,494 40.70

Team Leaders 28
Team Year Sets TA Avg.Southeast Mo. St. 2009 115 4,664 40.56Canisius 2020 49 1,980 40.41Tulsa 2012 131 5,290 40.38Valparaiso 2020 82 3,306 40.32Southern Miss. 2011 119 4,798 40.32Valparaiso 2010 130 5,239 40.30Memphis 2020 49 1,852 40.26Yale 2012 84 3,381 40.25Creighton 2010 124 4,991 40.25
Hitting Percentage* (1981-2000)Team Year Sets K-E/TA Pct.Hofstra 1983 120 1,317-283/2,546 .406Florida A&M 1988 98 1,261-368/2,344 .381Penn St. 1990 140 2,075-504/4,278 .367Saint Mary’s (CA) 1984 119 1,602-357/3,396 .367Penn St. 1998 114 1,854-462/4,020 .346Rhode Island 1984 115 1,445-373/3,112 .344Long Beach St. 1992 111 1,810-606/3,539 .340Long Beach St. 1998 116 1,910-562/3,990 .338Cincinnati 1983 184 1,975-631/3,985 .337LSU 1991 123 2,052-645/4,231 .333UCLA 1992 109 1,978-636/4,036 .333Nebraska 1986 122 1,913-501/4,261 .331Penn St. 1999 125 2,027-521/4,583 .329Illinois 1992 119 1,898-549/4,109 .328Long Beach St. 1993 110 1,857-629/3,746 .328
Hitting Percentage* With 30-Point Scoring Format (2001-07) Team Year Sets K-E/TA Pct.Florida A&M 2004 96 1,654-403/3,388 .369Florida A&M 2003 100 1,688-452/3,394 .364Long Beach St. 2001 108 1,868-514/3,770 .359Penn St. 2007 122 2,085-585/4,286 .350Texas 2007 103 1,788-491/3,780 .343Florida A&M 2001 97 1,540-465/3,148 .341Southern California 2003 113 2,001-511/4,380 .340Washington 2005 108 1,892-481/4,178 .338Hawaii 2003 125 2,270-640/4,849 .336Florida 2003 117 1,949-563/4,173 .332Georgia Tech 2003 129 2,355-651/5,151 .331Florida A&M 2005 91 1,410-406/3,047 .330Hawaii 2002 114 2,074-578/4,543 .329Nebraska 2007 103 1,829-506/4,051 .327Western Ky. 2005 114 1,934-579/4,150 .327Penn St. 2006 114 1,913-573/4,155 .323Nebraska 2002 103 1,747-481/3,927 .322Nebraska 2005 116 1,986-581/4,367 .322Florida 2002 122 1,981-628/4,249 .318Louisville 2005 122 2,035-596/4,545 .317
Hitting Percentage* With 25-Point Scoring Format (2008-Present)Team Year Sets K-E/TA Pct.Penn St. 2008 116 1,734-428/3,352 .390Penn St. 2009 122 1,784-410/3,605 .381Kentucky 2020 83 1,271-311/2,667 .360Missouri 2013 117 1,789-422/3,839 .356Western Ky. 2020 78 1,094-269/2,400 .344Penn St. 2014 127 1,867-498/4,006 .342Penn St. 2017 123 1,753-452/3,843 .339Texas 2009 104 1,517-395/3,321 .338Florida 2016 105 1,517-388/3,343 .338Texas 2020 102 1,495-357/3,407 .336
Team Year Sets K-E/TA Pct.Texas 2008 118 1,719-447/3,795 .335Western Ky. 2017 120 1,705-469/3,728 .332Florida 2013 108 1,607-427/3,569 .331Texas 2012 115 1,639-408/3,789 .325Texas 2019 98 1,355-334/3,145 .325Stanford 2010 109 1,658-441/3,811 .319Stanford 2107 119 1,713-488/3,842 .319Florida 2014 114 1,621-480/3,581 .319Kentucky 2017 119 1,786-501/4,035 .318Colorado St. 2017 116 1,624-475/3,638 .316*Hitting percentage is derived by subtracting errors from kills and dividing that difference by total attacks.
SETTINGAssists (1981-2000)Team Year Sets AssistsKentucky 1993 194 2,435Akron 1990 192 2,367Georgia Tech 1996 140 2,263North Carolina 1985 154 2,246BYU 1984 157 2,225UCLA 1990 138 2,192LSU 1983 199 2,164Akron 1989 189 2,124UCLA 2000 124 2,099Santa Clara 2000 117 2,091UCF 1995 141 2,079Sam Houston St. 1994 133 2,068LSU 1986 165 2,061Ball St. 1999 128 2,032Hawaii 1998 124 2,025UCLA 1986 141 2,017UCLA 1987 134 2,014Stanford 1986 126 2,011
Assists With 30-Point Scoring Format (2001-07)Team Year Sets AssistsMinnesota 2004 139 2,286Georgia Tech 2002 145 2,226Georgia Tech 2003 129 2,199Hawaii 2003 125 2,097Western Mich. 2006 133 2,076South Fla. 2002 136 2,076Temple 2002 138 2,073Minnesota 2003 134 2,065St. John’s (NY) 2007 125 2,056Western Ky. 2002 140 2,051Memphis 2003 135 2,037UCF 2002 140 2,037Memphis 2004 136 2,034Ohio St. 2004 120 2,033Stanford 2007 125 2,026LIU 2005 142 2,023UCLA 2006 128 2,022Stanford 2004 133 2,022UC Irvine 2003 133 2,002Duke 2007 122 1,997

Team Leaders 29
Assists With 25-Point Scoring Format (2008-Present)Team Year Sets AssistsWisconsin 2013 146 1,913Michigan 2012 146 1,903Tulane 2018 143 1,869UNI 2017 131 1,857Illinois 2011 143 1,857Sacramento St. 2017 146 1,852Oregon 2012 123 1,833Southern California 2017 136 1,810Ohio St. 2011 135 1,810Col. of Charleston 2018 135 1,807Valparaiso 2018 146 1,805Texas St. 2020 141 1,802Utah 2017 131 1,786UNI 2018 126 1,784Michigan 2009 138 1,784Southern California 2015 130 1,778Utah 2019 137 1,775Cincinnati 2019 125 1,775Creighton 2015 134 1,774Wichita St. 2015 135 1,771
Assists Per Set (1981-2000) Team Year Sets Assists Avg.Santa Clara 2000 117 2,091 17.87Colorado 1998 107 1,867 17.45Texas A&M 2000 98 1,687 17.21UCLA 1997 110 1,886 17.15Pepperdine 1996 93 1,586 17.05Ohio St. 1995 103 1,746 16.95UCLA 2000 124 2,099 16.93Pacific 2000 103 1,739 16.88Kansas St. 1998 109 1,830 16.79Colorado 1996 103 1,726 16.76Southern California 1998 107 1,789 16.72Long Beach St. 1999 118 1,968 16.68Illinois 1998 120 1,994 16.62Baylor 2000 108 1,775 16.44Colorado 1999 110 1,805 16.41LMU (CA) 1996 103 1,687 16.38Hawaii 1998 124 2,025 16.33Temple 1999 116 1,894 16.33Illinois 1995 122 1,991 16.32
Assists Per Set With 30-Point Scoring Format (2001-07)Team Year Sets Assists Avg.Georgia Tech 2004 114 1,977 17.34Georgia Tech 2003 129 2,199 17.05Ohio St. 2004 120 2,033 16.94Hawaii 2003 125 2,097 16.78Hawaii 2002 114 1,906 16.72Ohio 2005 120 1,983 16.53St. John’s (NY) 2007 125 2,056 16.45Minnesota 2004 139 2,286 16.45Nebraska 2007 103 1,691 16.42Duke 2007 122 1,997 16.37Southern California 2003 113 1,843 16.31Southern California 2002 107 1,743 16.29Florida 2007 109 1,775 16.28Missouri 2005 106 1,722 16.25Penn St. 2004 109 1,770 16.24Stanford 2007 125 2,026 16.21Nebraska 2006 115 1,863 16.20
Team Year Sets Assists Avg.San Diego 2004 109 1,763 16.17Hawaii 2001 120 1,940 16.17Missouri 2004 103 1,660 16.12
Assists Per Set With 25-Point Scoring Format (2008-Present)Team Year Sets Assists Avg.Oregon 2012 123 1,833 14.90Missouri 2013 117 1,704 14.56Boise St. 2015 105 1,529 14.56Fla. Atlantic 2018 99 1,440 14.55San Diego 2010 104 1,512 14.54Fla. Atlantic 2017 99 1,426 14.40Stanford 2010 109 1,570 14.40San Diego 2013 109 1,563 14.34Texas A&M 2009 109 1,555 14.27Valparaiso 2008 119 1,697 14.26UCLA 2014 121 1,725 14.26Cincinnati 2019 125 1,775 14.20UNI 2017 131 1,857 14.18Tulsa 2010 114 1,616 14.18Kansas 2015 113 1,601 14.17UNI 2018 126 1,784 14.16Kentucky 2020 83 1,173 14.13San Diego 2017 104 1,468 14.12Southern California 2009 115 1,619 14.08UNI 2010 119 1,675 14.08
SERVICEService Aces (1981-2000)Team Year Sets AcesLSU 1983 199 544Dayton 1987 134 510Northwestern 1981 193 510LSU 1985 167 506LSU 1982 200 489Hofstra 1984 144 477New Orleans 1983 137 477LSU 1986 165 472UIC 1985 170 471Minnesota 1981 168 469LSU 1987 141 466Charlotte 1985 151 464Texas St. 1984 131 463Cincinnati 1983 173 461
Service Aces With 30-Point Scoring Format (2001-07)Team Year Sets AcesAlbany (NY) 2002 115 393Mississippi Val. 2005 103 392N.C. A&T 2001 140 374UMES 2003 130 373LIU 2002 144 362Hampton 2003 105 358Albany (NY) 2003 131 355Ga. Southern 2001 122 347N.C. A&T 2005 142 339LIU 2006 123 338UAB 2006 139 336Alabama A&M 2002 105 334LIU 2007 131 314

Team Leaders 30
Team Year Sets AcesAmerican 2005 122 307Hampton 2002 111 306Manhattan 2002 117 305UMES 2007 107 304Winthrop 2005 115 304Iona 2002 137 303Towson 2001 120 303
Service Aces With 25-Point Scoring Format (2008-Present)Team Year Sets AcesGrambling 2008 123 270UMES 2017 134 268UMES 2019 127 263Sacred Heart 2009 112 261Belmont 2008 124 261Austin Peay 2010 126 260American 2008 116 256UMES 2009 100 254UNLV 2018 130 251Belmont 2009 124 250UMES 2008 118 249UMES 2010 118 246Sacred Heart 2008 114 245Penn St. 2014 127 243Manhattan 2015 127 242South Carolina St. 2011 115 242UNLV 2019 128 241Delaware St. 2009 120 237Coastal Carolina 2008 132 237Mississippi Val. 2010 123 236
Service Aces Per Set (1981-2000) Team Year Sets Aces Avg.Dayton 1987 134 510 3.81ETSU 1985 92 331 3.60Texas St. 1984 131 463 3.53New Orleans 1983 137 477 3.48Georgia Tech 1991 105 364 3.47UCF 1991 129 440 3.41South Carolina 1983 131 438 3.34Hofstra 1984 144 477 3.31LSU 1987 141 466 3.30Ohio St. 1985 107 352 3.29Duquesne 1991 89 291 3.27
Service Aces Per Set With 30-Point Scoring Format (2001-07)Team Year Sets Aces Avg.Mississippi Val. 2005 103 392 3.81Albany (NY) 2002 115 393 3.42Hampton 2003 105 358 3.41Alabama A&M 2002 105 334 3.18American 2001 98 298 3.04Florida A&M 2001 97 288 2.97UMES 2003 130 373 2.87Ga. Southern 2001 122 347 2.84UMES 2007 107 304 2.84Hampton 2002 111 306 2.76LIU 2006 123 338 2.75Albany (NY) 2003 131 355 2.71American 2006 110 295 2.68N.C. A&T 2001 140 374 2.67Alabama A&M 2001 103 275 2.67
Service Aces Per Set With 25-Point Scoring Format (2008-Present)(Based on qualifiers for annual statistical championship)Team Year Sets Aces Avg.UMES 2009 100 254 2.54Sacred Heart 2009 112 261 2.33American 2008 116 256 2.21Grambling 2008 123 270 2.20Sacred Heart 2008 114 245 2.15UMES 2008 118 249 2.11Belmont 2008 124 261 2.10South Carolina St. 2011 115 242 2.10Jackson St. 2012 130 273 2.10UMES 2016 102 214 2.10UMES 2010 118 246 2.08UMES 2019 127 263 2.07Austin Peay 2010 126 260 2.06Mississippi Val. 2011 96 198 2.06Belmont 2009 124 250 2.02Kennesaw St. 2019 115 231 2.01UMES 2017 134 268 2.00Delaware St. 2008 100 200 2.00Coastal Caro. 2019 116 231 1.99UMES 2012 129 257 1.99Denver 2018 110 219 1.99
BLOCKINGTotal Blocks With 30-Point Scoring Format (2001-07)Team Year Sets Solo Ast. TotalGrambling 2001 139 262 510 517.0Nebraska 2005 116 66 823 477.5Penn St. 2007 122 96 739 465.5Stanford 2002 129 141 645 463.5California 2007 123 89 730 454.0UCLA 2006 128 67 768 451.0Nebraska 2001 108 116 670 451.0Hawaii 2006 126 82 724 444.0Utah 2005 123 61 765 443.5Sacramento St. 2006 123 90 703 441.5Notre Dame 2005 124 174 534 441.0Stanford 2004 133 184 514 441.0Stanford 2001 122 108 661 438.5Louisville 2005 122 97 679 436.5Middle Tenn. 2007 129 51 757 429.5Nebraska 2004 106 89 675 426.5UNI 2006 128 68 709 422.5Montana St. 2002 120 71 703 422.5Louisville 2007 107 93 658 422.0Penn St. 2006 114 95 651 420.5
Total Blocks With 25-Point Scoring Format (2008-Present)Team Year Sets Solo Ast. TotalBYU 2014 121 60 811 465.5Stanford 2016 129 78 710 433.0Ohio 2010 133 109 631 424.5Washington St. 2016 128 87 653 413.5Stanford 2018 121 35 754 412.0Seton Hall 2014 132 90 608 394.0Washington 2012 117 29 729 393.5Penn St. 2009 122 52 683 393.5Penn St. 2013 127 107 561 387.5

Team Leaders 31
Team Year Sets Solo Ast. TotalUtah Valley 2018 141 37 700 387.0Florida St. 2011 129 63 644 385.0Wyoming 2012 117 30 705 382.5VCU 2017 116 63 637 381.5Utah 2013 132 37 688 381.0UT Arlington 2013 132 37 686 380.0Creighton 2012 124 54 650 379.0Idaho 2009 117 44 668 378.0Missouri 2017 131 104 547 377.5Penn St. 2012 125 103 547 376.5Jacksonville St. 2016 137 93 566 376.0Penn St. 2017 123 92 566 375.0Utah 2012 125 35 680 375.0
Blocks Per Set With 30-Point Scoring Format (2001-07)(Based on qualifiers for annual statistical championship)Team Year Sets Solo Ast. Total Avg.Nebraska 2001 108 116 670 451.0 4.18Nebraska 2005 116 66 823 477.5 4.12Nebraska 2004 106 89 675 426.5 4.02Louisville 2007 107 93 658 422.0 3.94Nebraska 2002 103 81 626 394.0 3.83Penn St. 2007 122 96 739 465.5 3.82Notre Dame 2003 109 116 580 406.0 3.82Grambling 2001 139 262 510 517.0 3.72Utah 2006 110 53 711 408.5 3.71California 2007 123 89 730 454.0 3.69Penn St. 2006 114 95 651 420.5 3.69Saint Mary’s (CA) 2005 110 51 706 404.0 3.67Notre Dame 2002 113 109 609 413.5 3.66Utah 2005 123 61 765 443.5 3.61Stanford 2001 122 108 661 438.5 3.59Stanford 2002 129 141 645 463.5 3.59Sacramento St. 2006 123 90 703 441.5 3.59Louisville 2005 122 97 679 436.5 3.58Penn St. 2005 111 106 582 397.0 3.58Notre Dame 2005 124 174 534 441.0 3.56
Blocks Per Set With 25-Point Scoring Format (2008-Present)(Based on qualifiers for annual statistical championship)Team Year Sets Solo Ast. Total Avg.BYU 2014 121 60 811 465.5 3.85Stanford 2018 121 35 754 412.0 3.40Louisville 2020 58 57 276 195.0 3.36Washington 2012 117 29 729 393.5 3.36Stanford 2016 129 78 710 433.0 3.36Colorado St. 2016 111 74 587 367.5 3.31VCU 2017 116 63 637 381.5 3.29Wyoming 2012 117 30 705 382.5 3.27Idaho 2009 117 44 668 378.0 3.23Washington St. 2016 128 87 653 413.5 3.23Penn St. 2009 122 52 683 393.5 3.23Penn St. 2008 116 75 597 373.5 3.22Ohio 2010 133 109 631 424.5 3.19VCU 2019 112 50 613 356.5 3.18Stanford 2011 113 67 584 359.0 3.18North Carolina 2014 110 49 599 348.5 3.17Long Beach St. 2011 114 91 540 361.0 3.17Maryland 2020 82 34 448 258.0 3.15Colorado St. 2011 107 43 588 337.0 3.15Col. of Charleston 2020 43 27 216 135.0 3.14Colorado St. 2010 110 53 582 344.0 3.13Syracuse 2015 120 80 589 374.5 3.12
DEFENSEDigs (1981-2000)Team Year Sets DigsAkron 1989 189 3,342Akron 1990 192 3,323Delaware 1994 181 3,278Murray St. 1989 155 3,078Col. of Charleston 1991 187 3,077UNCW 1992 134 3,072Clemson 1986 127 3,042Delaware 1993 158 3,022California 1985 142 2,956Murray St. 1990 142 2,901Virginia 1989 149 2,901Morehead St. 1993 148 2,895Towson 1993 131 2,868
Digs With 30-Point Scoring Format (2001-07)Team Year Sets DigsChattanooga 2007 131 2,964UT Arlington 2006 132 2,887Minnesota 2004 139 2,771Sacramento St. 2007 135 2,587SFA 2006 123 2,582Southeastern La. 2002 116 2,577Delaware 2007 130 2,568Liberty 2007 128 2,536North Carolina 2005 131 2,529Eastern Mich. 2002 120 2,529UTSA 2006 130 2,520Purdue Fort Wayne 2006 132 2,519Tennessee Tech 2007 128 2,518Morehead St. 2002 117 2,499Southeastern La. 2003 118 2,491Illinois St. 2007 117 2,479Tulsa 2007 134 2,469Murray St. 2006 105 2,465Eastern Mich. 2003 123 2,458Saint Peter’s 2007 136 2,457
Digs With 25-Point Scoring Format/Unlimited Libero Substitutions (2008-Present)Team Year Sets DigsValparaiso 2018 146 2,613UNI 2017 131 2,581North Dakota 2017 138 2,530Illinois St. 2017 131 2,515Bradley 2018 127 2,509Sacramento St. 2017 146 2,507UC Santa Barbara 2012 135 2,492Valparaiso 2010 130 2,447Missouri St. 2017 127 2,443UT Martin 2011 131 2,416Northern Ky. 2018 121 2,399Southeast Mo. St. 2012 134 2,392Col. of Charleston 2014 132 2,380Northern Ariz. 2018 132 2,376Drake 2010 132 2,375Southern Ill. 2019 134 2,368UNI 2015 133 2,368Seton Hall 2014 132 2,354Manhattan 2014 131 2,351

Team Leaders 32
Team Year Sets DigsTulsa 2012 131 2,349Creighton 2010 124 2,349
Digs Per Set (1981-2000) Team Year Sets Digs Avg.Clemson 1986 127 3,042 23.95Duke 1994 106 2,446 23.08UNCW 1992 134 3,072 22.93Georgia Tech 1989 103 2,357 22.88Iona 1994 90 2,026 22.51Mississippi St. 1995 125 2,765 22.12Chattanooga 1991 123 2,701 21.96Towson 1993 131 2,868 21.89Ohio St. 1985 107 2,331 21.79Duquesne 1991 89 1,938 21.78Sacramento St. 1995 133 2,864 21.53
Digs Per Set With 30-Point Scoring Format (2001-07) (Minimum 400 digs)Team Year Sets Digs Avg.Murray St. 2006 105 2,465 23.48Chattanooga 2007 131 2,964 22.63Southeastern La. 2002 116 2,577 22.22UT Arlington 2006 132 2,887 21.87Morehead St. 2002 117 2,499 21.36Illinois St. 2007 117 2,479 21.19Southeastern La. 2003 118 2,491 21.11Eastern Mich. 2002 120 2,529 21.08Rider 2001 95 1,996 21.01SFA 2006 123 2,582 20.99Princeton 2004 108 2,259 20.92Murray St. 2007 114 2,374 20.82Southeastern La. 2001 100 2,078 20.78Eastern Ky. 2006 112 2,326 20.77North Dakota St. 2007 106 2,197 20.73UT Arlington 2004 112 2,300 20.54Chattanooga 2006 115 2,354 20.47Col. of Charleston 2005 111 2,269 20.44Eastern Ky. 2004 115 2,346 20.40Milwaukee 2007 112 2,268 20.25
Digs Per Set With 25-Point Scoring Format/Unlimited Libero Substitutions (2008-Present)(Based on qualifiers for annual statistical championship)Team Year Sets Digs Avg.Penn 2012 96 2,067 21.53Canisius 2020 49 1,010 20.61Bradley 2020 69 1,409 20.42Valparaiso 2020 82 1,670 20.37Drake 2020 75 1,520 20.27Ark.-Pine Bluff 2020 45 908 20.18Valparaiso 2017 117 2,343 20.03Northern Ky. 2018 121 2,399 19.83NJIT 2009 97 1,922 19.81Bradley 2018 127 2,509 19.76UNI 2017 131 2,581 19.70Bowling Green 2018 114 2,228 19.54Yale 2012 84 1,636 19.48Wright St. 2019 111 2,156 19.42Yale 2010 94 1,818 19.34Southeast Mo. St. 2009 115 2,218 19.29Missouri St. 2017 127 2,443 19.24
Team Year Sets Digs Avg.Illinois St. 2017 131 2,515 19.20Wright St. 2020 66 1,266 19.18Drake 2017 121 2,314 19.12
MISCELLANEOUSWinning PercentageTeam Year W L Pct.Penn St. 2009 38 0 1.000Penn St. 2008 38 0 1.000Southern California 2003 35 0 1.000Nebraska 2000 34 0 1.000Long Beach St. 1998 36 0 1.000Penn St. 1990 44 1 .978Arkansas St. 1988 41 1 .976Penn St. 1999 36 1 .973UCLA 1990 36 1 .973Missouri 2013 35 1 .972Penn St. 1998 35 1 .972Stanford 2018 34 1 .971UCLA 1988 34 1 .971Nebraska 2006 33 1 .971Long Beach St. 2001 33 1 .971UCLA 1992 33 1 .971Hawaii 1982 33 1 .971Purdue 1981 33 1 .971Washington 2005 32 1 .970Nebraska 1995 32 1 .970Stanford 1994 32 1 .970Western Mich. 1983 32 1 .970
Consecutive Division I Winning Seasons Since 1981No. Team Years*40 Hawaii 1981-20*40 Penn St. 1981-20*39 Hawaii ^1981-1939 Stanford 1981-1934 UNI 1985-1932 UCLA 1981-12*30 Florida 1991-2030 Long Beach St. 1987-1629 Southern California 1991-19*26 Colorado St. 1995-2026 Louisville 1988-1325 Pacific 1981-05*23 Western Ky. 1998-2023 American 1997-1922 Notre Dame 1991-1221 Houston 1982-0221 BYU 1981-0120 Georgia Tech 1991-1019 Princeton 1990-0819 Texas 1981-9918 Cincinnati 1994-1118 SFA 1992-0918 LMU (CA) 1990-0718 UC Santa Barbara 1989-0618 Pittsburgh 1981-98*Active streak entering 2021 season. ^School did not participate in the 2020 season due to the COVID-19 pandemic.

Team Leaders 33
Consecutive Non-Losing Seasons Since 1981No. Team Years*40 Nebraska 1981-20*40 Penn St. 1981-20*39 Hawaii ^1981-1939 UNI 1981-1939 Stanford 1981-1937 UCLA 1981-17*30 Florida 1991-2030 Long Beach St. 1987-16*29 San Diego ^1991-1929 Southern California 1991-1928 Louisville 1988-1527 Princeton 1982-0826 UC Santa Barbara 1981-0625 Pacific 1981-05*23 Western Ky. 1998-2022 Notre Dame 1991-1221 Houston 1982-0221 BYU 1981-01*20 Texas 2001-2020 Georgia Tech 1991-1020 Pittsburgh 1981-0019 Texas 1981-99*Active streak entering 2021 season. ^School did not participate in the 2020 season due to the COVID-19 pandemic.
Matches Won In A SeasonNo. Team Year60 Texas 198154 Central Mich. 198148 Akron 198947 Akron 198347 Cornell 198147 Northwestern 198146 Georgia 198144 Penn St. 199044 Kentucky 198344 UCLA 198344 Penn St. 198143 Arkansas St. 198943 LSU 198243 Florida St. 1981
Matches Lost In A SeasonNo. Team Year40 Oklahoma 198139 Kent St. 198237 Seton Hall 198636 Cleveland St. 198735 Chattanooga 199435 Charlotte 198435 Towson 198134 Savannah St. 201233 Chicago St. 201033 Central Conn. St. 198933 Utah St. 198533 Mississippi St. 1982
Consecutive Matches WonNo. Team Dates of Streak109 Penn St. Sept. 21, 2007-Sept. 10, 201052 Southern California Nov. 2, 2002-Sept. 10, 200444 Penn St. Aug. 31-Dec. 7, 1990
No. Team Dates of Streak43 UCLA Nov. 16, 1991-Dec. 17, 199242 Long Beach St. Aug. 28, 1998-Sept. 10, 199937 Stanford Sept. 1, 2018-Sept. 13, 201937 Florida Aug. 24-Dec. 13, 199636 Florida Aug. 23-Dec. 18, 200336 Nebraska Sept. 1, 2000-Aug. 25, 200136 Penn St. Aug. 28-Dec. 18, 199935 Hawaii Aug. 29-Dec. 13, 200335 Penn St. Sept. 4-Dec. 17, 199835 UCLA Sept. 7, 1990-Sept. 6, 199134 Arkansas St. Sept. 16-Dec. 1, 198934 UCLA Sept. 2-Dec. 10, 198834 Pacific Oct. 12, 1986-Oct. 3, 198733 Long Beach St. Aug. 31-Dec. 13, 200133 Purdue Sept. 11-Dec. 11, 198232 Nebraska Sept. 1, 1995-Aug. 23, 199631 Hawaii Sept. 1-Dec. 7, 199531 Nebraska Sept. 2-Dec. 9, 199431 Florida Sept. 11-Dec. 17, 1992
Consecutive Sets WonNo. Team Dates of Streak111 Penn St. Dec. 15, 2007-Dec. 18, 2008105 Florida Aug. 23-Dec. 18, 200369 Long Beach St. Oct. 2-Dec. 19, 199868 Nebraska Sept. 1-Nov. 12, 199562 Hawaii Sept. 11-Nov. 23, 201059 Penn St. Oct. 10-Dec. 17, 199856 Arkansas Oct. 10-Dec. 6, 199754 Florida Sept. 21-Nov. 18, 200153 Nebraska Aug. 25-Oct. 24, 200753 Texas St. Oct. 4-Nov. 18, 198650 Pacific Sept. 28-Nov. 24, 200050 Oral Roberts Sept. 12-Oct. 29, 199848 Ohio Sept. 25-Nov. 20, 200447 Penn St. Dec. 18, 2008-Oct. 2, 200945 UCLA Oct. 3-Nov. 14, 199243 Nebraska Sept. 4-Nov. 14, 199841 Texas St. Sept. 16-Oct. 21, 200041 Florida Oct. 8-Nov. 20, 199941 Illinois Oct. 2-Nov. 8, 199239 Stanford Oct. 22-Dec. 9, 1995
Consecutive Home Court Matches WonNo. Team Dates of Streak94 Penn St. Sept. 1, 2006-Dec. 11, 201090 Nebraska Sept. 11, 2004-Sept. 11, 200987 Penn St. Nov. 25, 1995-Sept. 16, 200074 UNI Nov. 1, 1997-Sept. 18, 200463 Nebraska Sept. 29, 1999-Dec. 14, 200258 Florida Oct. 14, 1990-Sept. 4, 199457 Long Beach St. Nov. 14, 1996-Nov. 11, 199956 Oral Roberts Nov. 13, 1993-Nov. 2, 199955 Hawaii Oct. 23, 1986-Nov. 11, 198952 UCLA Nov. 4, 1987-Oct. 25, 199150 Stanford Nov. 23, 1993-Aug. 22, 199750 UNI Oct. 10, 1992-Oct. 4, 199649 Idaho Nov. 14, 1992-Sept. 17, 199648 Cincinnati Nov. 3, 2007-Nov. 6, 201147 Ohio Sept. 28, 2002-Sept. 28, 200745 Florida Sept. 28, 2001-Sept. 17, 200445 Stanford Sept. 1, 1997-Dec. 10, 199944 Colorado St. Sept. 6, 1998-Nov. 18, 200043 Nebraska Sept. 5, 1992-Dec. 18, 1994

Team Leaders 34
No. Team Dates of Streak42 Ball St. Sept. 17, 1999-Nov. 20, 200142 Penn St. Sept. 23, 1989-Sept. 27, 1991
Consecutive Road Matches Won(Includes Neutral-Site Matches)No. Team Dates of Streak55 Penn St. Sept. 28, 2007-Sept. 10, 201048 Southern California Nov. 15, 2001-Sept. 10, 200439 Hawaii Nov. 15, 1981-Nov. 7, 198432 Western Mich. Sept. 9, 1983-Oct. 29, 198529 UNI Sept. 10, 2010-Nov. 19, 201129 Nebraska Sept. 2, 1994-Aug. 23, 1996 27 Arkansas St. Sept. 16-Nov. 4, 198926 Nebraska Sept. 6, 2002-Nov. 8, 200326 Towson Aug. 31, 2001-Sept. 10, 200226 Purdue Oct. 20, 1981-Nov. 13, 198323 Winthrop Sept. 1-Nov. 24, 200622 UCLA Nov. 16, 1991-Dec. 17, 199221 Hawaii Sept. 14, 1995-Nov. 29, 199621 Penn St. Sept. 21-Dec. 7, 199020 Penn St. Sept. 28, 2005-Oct. 15, 200620 Florida A&M Sept. 10-Nov. 27, 200420 Long Beach St. Sept. 6-Nov. 25, 199620 UCLA Sept. 7, 1990-Sept. 6, 199120 Georgia Sept. 10-Oct. 2, 198219 UNI Sept. 4-Dec. 4, 200919 UCLA Aug. 26-Oct. 26, 200619 Florida Aug. 23-Dec. 18, 200319 Florida A&M Sept. 13-Dec. 4, 200319 UC Santa Barbara Aug. 30, 2002-Aug. 30, 200319 Hawaii Sept. 1, 1999-Nov. 24, 200019 Florida Aug. 24-Nov. 24, 199619 Akron Sept. 15-Oct. 28, 198919 UCLA Sept. 2-Nov. 26, 198819 Pacific Oct. 12, 1986-Oct. 10, 1987
Consecutive Conference Matches Won(Includes postseason)No. Team Dates of Streak Conference132 Hawaii Oct. 17, 1998-Oct. 11, 2006 Western Athletic121 Florida Sept. 25, 1998-Nov. 12, 2004 Southeastern112 Florida A&M Sept. 23, 2001-Oct. 12, 2008 Mid-Eastern106 Western Mich. Oct. 7, 1982-Nov. 5, 1989 Mid-American79 Notre Dame Oct. 18, 1991-Oct. 4, 1998 Midwestern
Collegiate/Big East78 American Oct. 14, 2000-Oct. 7, 2005 Colonial/Patriot78 Nebraska Oct. 29, 1999-Oct. 8, 2003 Big 1273 Texas Nov. 12, 1984-Oct. 21, 1991 Southwest71 Nebraska Oct. 23, 1982-Nov. 21, 1987 Big Eight69 UNI Sept. 18, 1998-Oct. 13, 2001 Missouri Valley68 Nebraska Oct. 5, 1988-Nov. 28, 1992 Big Eight67 Penn St. Nov. 11, 2006-Nov. 28, 2009 Big Ten67 UCLA Dec. 4, 1987-Oct. 18, 1991 Pacific-1066 UT Arlington Sept. 29, 1985-Oct. 17, 1991 Southland65 UNI Sept. 18, 2009-Sept. 29, 2012 Missouri Valley65 UCF Oct. 14, 1992-Sept. 29, 1998 Trans America64 Ohio Nov. 14, 2003-Sept. 21, 2007 Mid-American62 Winthrop Nov. 15, 2003-Oct. 26, 2007 Big South58 Fairfield Oct. 22, 2015-Sept. 29, 2018 Metro Atlantic56 William & Mary Sept. 25, 1985-Oct. 17, 1992 Colonial
Consecutive Regular-Season Conference Matches Won
No. Team Dates of Streak Conference145 Florida Sept. 20, 1995-Nov. 12, 2004 Southeastern114 Hawaii Oct. 17, 1998-Oct. 11, 2006 Western Athletic99 Western Mich. Oct. 7, 1982-Nov. 5, 1989 Mid-American98 Florida A&M Oct. 24, 1998-Oct. 12, 2008 Mid-Eastern77 Nebraska Oct. 29, 1999-Oct. 8, 2003 Big 1275 Hawaii Oct. 16, 2008-Oct. 11, 2013 Western Athletic/Big
West70 American Oct. 14, 2000-Oct. 7, 2005 Colonial/Patriot69 Texas Nov. 12, 1984-Oct. 21, 1991 Southwest66 UNI Nov. 8, 1997-Oct. 13, 2001 Missouri Valley 65 Penn St. Nov. 17, 2006-Nov. 29, 2009 Big Ten62 SFA Oct. 5, 2004-Oct. 26, 2007 Southland62 Notre Dame Oct. 18, 1991-Oct. 4, 1998 Midwestern Collegiate/
Big East62 UCLA Sept. 16, 1988-Oct. 18, 1991 Pacific-1061 Nebraska Oct. 5, 1988-Oct. 2, 1993 Big Eight59 UNI Sept. 18, 2009-Sept. 29, 2012 Missouri Valley58 UT Arlington Oct. 9, 1982-Oct. 17, 1991 Southland54 Arkansas St. Nov. 3, 1990-Oct. 2, 1997 American South/Sun
Belt 53 Hawaii Nov. 11, 1994-Oct. 9, 1998 Big West/Western
Athletic52 Fairfield Oct. 22, 2015-Sept. 29, 2018 Metro Atlantic52 Ohio Nov. 14, 2003-Sept. 21, 2007 Mid-American52 Nebraska Sept. 12, 1983-Nov. 14, 1987 Big Eight
Consecutive Matches LostNo. Team Dates of Streak139 Chicago St. Oct. 4, 1993-Sept. 18, 1999129 Coppin St. Oct. 19, 1993-Oct. 30, 199894 Chicago St. Nov. 16, 2007-Aug. 27, 201191 Savannah St. Nov. 9, 2010-Nov. 8, 201384 UMES Oct. 1998-Oct. 200181 St. Francis Brooklyn Oct. 5, 2004-Sept. 28, 200775 Saint Francis (PA) Oct. 14, 1989-Sept. 29, 199273 Jackson St. Oct. 1998-Sept. 23, 200070 Vermont Sept. 20, 1996-Sept. 10, 199968 Tennessee St. Sept. 1998-Oct. 3, 200061 Coppin St. Sept. 18, 2007-Oct. 2, 200958 Lafayette Sept. 8, 2000-Sept. 14, 200257 Alcorn Nov. 5, 2008-Sept. 6, 201148 Portland St. Sept. 4, 1999-Aug. 31, 200147 Kansas City Oct. 25, 1989-Sept. 26, 199146 Alcorn Nov. 7, 2006-Oct. 27, 200844 Alcorn Oct. 24, 2004-Sept. 21, 200643 Ark.-Pine Bluff Oct. 7, 2008-Sept. 2, 201043 St. Francis Brooklyn Nov. 4, 2007-Sept. 26, 200942 Chicago St. Oct. 8, 2005-Nov. 11, 2006
Points Scored, Three-Set Match (1981-2000)No. Team vs. Opponent Scores Date55 Oregon St. vs. Kentucky 15-2, 25-23, 15-13 Sept. 3, 199455 San Jose St. vs. Nevada 15-13, 15-11, 25-23 Oct. 16, 199352 Michigan St. vs. Purdue 20-18, 15-8, 17-15 Sept. 30, 199452 Texas A&M vs. Texas Tech 19-17, 18-16, 15-11 Sept. 30, 198851 Robert Morris vs. Clarion 15-12, 21-19, 15-10 Nov. 5, 200051 Bowling Green vs. Drake 15-5, 21-19, 15-11 Sept. 6, 199751 UNI vs. Colorado 15-7, 15-12, 21-19 Nov. 29, 199551 Illinois vs. Indiana 16-14, 19-17, 16-14 Nov. 11, 199451 Houston vs. Texas A&M 17-15, 19-17, 15-7 Oct. 12, 199451 Virginia Tech vs. Virginia 20-18, 15-8, 16-14 Sept. 1, 199251 Gonzaga vs. LMU (CA) 21-19, 15-11, 15-10 Oct. 26, 199050 Purdue vs. Boston College 16-14, 15-8, 19-17 Sept. 8, 200050 LSU vs. Louisiana 15-7, 20-18, 15-12 Aug. 30, 199750 Ga. Southern vs. South Carolina St. 20-18, 15-5, 15-11 Sept. 13, 1995

Team Leaders 35
No. Team vs. Opponent Scores Date50 Texas vs. Texas Tech 17-15, 18-16, 15-5 Oct. 12, 199450 Minnesota vs. North Carolina 15-7, 20-18, 15-7 Sept. 9, 199450 Butler vs. Dayton 15-12, 15-6, 20-18 Oct. 23, 199250 Wichita St. vs. UTSA 15-8, 20-18, 15-8 Sept. 22, 198450 Illinois St. vs. Louisville 20-18, 15-9, 15-11 Sept. 3, 1983
Points Scored, Three-Set Match With 30-Point Scoring Format (2001-07)No. Team vs. Opponent Scores Date109 Fairfield vs. Mercer 30-20, 36-34, 43-41 Sept. 19, 2004105 Arizona St. vs. Arizona 33-31, 30-26, 42-40 Sept. 27, 2002104 Cincinnati vs. Jacksonville St. 30-20, 44-42, 30-24 Sept. 16, 2005103 Bradley vs. Wichita St. 40-38, 30-28, 33-31 Nov. 23, 2002102 Hofstra vs. San Francisco 42-40, 30-28, 30-16 Sept. 20, 2002101 LIU vs. Fairleigh Dickinson 40-38, 30-20, 31-29 Nov. 9, 2002100 Missouri St. vs. Drake 30-15, 40-38, 30-17 Nov. 8, 200399 Syracuse vs. South Fla. 30-23, 39-37, 30-26 Sept. 29, 200699 Creighton vs. Arkansas St. 37-35, 30-16, 32-30 Sept. 11, 200499 Cincinnati vs. Austin Peay 30-28, 39-37, 30-22 Sept. 14, 200398 Penn St. vs. Purdue 30-18, 30-20, 38-36 Sept. 29, 200798 North Carolina vs. Wake Forest 38-36, 30-21, 30-27 Oct. 30, 200498 Missouri St. vs. Bradley 30-28, 38-36, 30-16 Nov. 15, 200397 Clemson vs. North Carolina 30-27, 30-27, 37-35 Oct. 14, 200697 Ball St. vs. Central Conn. St. 37-35, 30-27, 30-26 Sept. 9, 200597 Oral Roberts vs. Utah Valley 30-24, 37-35, 30-26 Sept. 29, 200497 Georgia Tech vs. Northwestern 30-22, 30-25, 37-35 Aug. 29, 200397 Wichita St. vs. Bradley 38-40, 28-30, 31-33 Nov. 23, 200297 Virginia Tech vs. Notre Dame 30-27, 37-35, 30-27 Nov. 17, 200297 Pepperdine vs. UCLA 37-35, 30-25, 30-25 Nov. 12, 2002
Points Scored, Three-Set Match With 25-Point Scoring Format (2008-Present)No. Team vs. Opponent Scores Date96 Manhattan vs. Rider 45-43, 26-24, 25-16 Oct. 23, 200993 Austin Peay vs. Murray St. 25-15, 25-21, 43-41 Oct. 8, 201189 Green Bay vs. Ball St. 32-30, 32-30, 25-18 Aug. 29, 200888 Indiana St. vs. Evansville 38-36, 25-18, 25-22 Nov. 5, 201088 Michigan vs. Indiana 25-23, 25-22, 38-36 Oct. 18, 200887 Prairie View vs. Grambling 25-15, 25-18, 37-35 Oct. 20, 201187 Albany (NY) vs. Yale 33-31, 25-13, 29-27 Sept. 21, 201187 Tennessee vs. Marshall 37-35, 25-16, 25-12 Sept. 12, 200986 Memphis vs. Alabama A&M 36-34, 25-22, 25-15 Aug. 26, 201186 Tulsa vs. Rice 25-15, 31-29, 30-29 Oct. 24, 201085 Oklahoma vs. Texas Tech 25-12, 25-19, 35-33 Nov. 23, 201185 Tennessee vs. Arkansas 29-27, 31-29, 25-18 Nov. 7, 200884 Florida St. vs. Notre Dame 34-32, 25-22, 25-19 Sept. 28, 201484 La Salle vs. Coppin St. 25-16, 34-32, 25-21 Nov. 9, 201184 San Diego St. vs. TCU 30-28, 28-26, 26-24 Nov. 5, 201184 Loyola Maryland vs. Saint Peter’s 25-15, 34-32, 25-11 Sept. 25, 201184 LIU vs. Rutgers 25-20, 25-19, 34-32 Sept. 17, 201184 South Carolina vs. Montana 34-32, 25-15, 25-15 Aug. 26, 201184 American vs. Navy 25-20, 34-32, 25-23 Oct. 7, 201084 Western Mich. vs. Bowling Green 26-24, 31-29, 27-25 Oct. 2, 201084 Fordham vs. Fairleigh Dickinson 25-18, 25-21, 34-32 Sept. 18, 201084 San Jose St. vs. UC Riverside 25-21, 25-16, 34-32 Sept. 3, 201084 San Diego St. vs. CSUN 25-21, 29-27, 30-28 Aug. 27, 2010
Points Scored, Four-Set Match (1981-2000)No. Team vs. Opponent Scores Date69 Rhode Island vs. West Virginia 15-11, 14-16, 20-18, 20-18 Oct. 15, 198868 Florida St. vs. LMU (CA) 18-16, 13-15, 20-18, 17-15 Sept. 13, 199167 Oklahoma vs. West Tex. A&M 15-5, 16-18, 16-14, 20-18 Sept. 30, 1983
No. Team vs. Opponent Scores Date65 Eastern Ill. vs. Indiana St. 16-14, 19-21, 15-5, 15-10 Sept. 1, 199265 LSU vs. Florida St. 15-10, 15-9, 20-22, 15-10 Nov. 6, 198865 Hawaii vs. New Mexico St. 20-22, 15-8, 15-0, 15-11 Sept. 5, 198665 Michigan St. vs. Western Mich. 15-17, 15-7, 20-18, 15-4 Oct. 13, 198164 Virginia Tech vs. App State 19-21, 15-11, 15-3, 15-13 Sept. 1, 200064 Northern Ariz. vs. Montana 15-9, 21-19, 13-15, 15-6 Nov. 18, 199964 Arizona vs. Oregon St. 14-16, 15-12, 20-18, 15-6 Sept. 16, 199464 LMU (CA) vs. Florida St. 16-18, 15-13, 18-20, 15-17 Sept. 13, 199164 Florida vs. North Carolina 18-16, 15-6, 15-17, 16-14 Nov. 7, 198764 Iowa St. vs. Iowa 14-16, 19-17, 16-14, 15-6 Sept. 28, 1985
Points Scored, Four-Set Match With 30-Point Scoring Format (2001-07)No. Team vs. Opponent Scores Date135 Texas A&M vs. Texas Tech 36-38, 39-37, 30-21, 30-25 Oct. 10, 2001131 Notre Dame vs. Pittsburgh 31-33, 30-32, 30-23, 40-42 Sept. 22, 2007131 Georgia vs. Alabama 30-23, 45-43, 25-30, 31-29 Nov. 10, 2002130 Pittsburgh vs. Notre Dame 33-31, 32-30, 23-30, 42-40 Sept. 22, 2007128 Notre Dame vs. Villanova 35-37, 30-24, 33-31, 30-18 Sept. 24, 2006128 Towson vs. James Madison 37-35, 31-33, 30-20, 30-25 Nov. 11, 2005128 Cincinnati vs. Western Ky. 38-36, 30-25, 30-32, 30-24 Oct. 5, 2005128 South Carolina vs. Houston 30-23, 30-21, 38-40, 30-28 Sept. 16, 2005128 Northern Ariz. vs. Montana 42-40, 26-30, 30-28, 30-22 Oct. 1, 2004128 Cincinnati vs. TCU 35-33, 33-35, 30-28, 30-10 Sept. 29, 2001127 LSU vs. Arkansas 39-37, 28-30, 30-27, 30-17 Nov. 12, 2004126 Clemson vs. Virginia 39-37, 30-27, 27-30, 30-17 Oct. 3, 2003126 Colorado St. vs. UNLV 29-31, 37-35, 30-26, 30-12 Nov. 1, 2002126 Eastern Mich. vs. Bowling
Green25-30, 31-29, 31-29, 39-37 Nov. 1, 2002
126 North Carolina vs. Wisconsin 30-28, 30-28, 36-38, 30-23 Aug. 31, 2002125 Creighton vs. Southern Ill. 35-37, 30-17, 30-25, 30-23 Oct. 29, 2004125 Pittsburgh vs. North Carolina 30-27, 35-37, 30-24, 30-26 Sept. 10, 2004125 IUPUI vs. Southeast Mo. St. 30-21, 34-32, 31-33, 30-25 Sept. 6, 2003125 Alabama vs. Georgia 23-30, 43-45, 30-25, 29-31 Nov. 10, 2002125 Bowling Green vs. Eastern
Mich. 30-25, 29-31, 29-31, 37-39 Nov. 1, 2002
125 North Carolina vs. San Diego 30-21, 35-37, 30-25, 30-16 Sept. 7, 2002125 Fresno St. vs. San Jose St. 25-30, 26-30, 30-17, 44-46 Nov. 3, 2001
Points Scored, Four-Set Match with 25-point Scoring Format (2008-Present)No. Team vs. Opponent Scores Date114 Cal St. Fullerton vs.
Montana25-23, 26-28, 25-14, 38-36 Sept. 3, 2009
113 Oregon vs. Minnesota 21-25, 41-39, 25-14, 26-24 Dec. 7, 2018113 LSU vs. Auburn 28-26, 33-35, 27-25, 25-23 Nov. 4, 2011113 FGCU vs. ETSU 31-29, 26-24, 31-33, 25-21 Oct. 15, 2011113 Southern Utah vs. CSUN 27-25, 24-26, 37-35, 25-18 Sept. 10, 2011112 UCLA vs. California 25-22, 37-39, 25-20, 25-16, Jan. 22, 2021112 Gonzaga vs. LMU (CA) 27-25, 31-29, 26-28, 28-26 Oct. 4, 2014112 Stony Brook vs. Central
Conn. St.39-37, 25-19, 23-25, 25-22 Aug. 30, 2008
111 Wright St. vs. Oakland 25-17, 25-20, 36-28, 25-21 Feb. 8, 2021111 FIU vs. Fla. Atlantic 25-19, 25-17, 36-38, 25-16 Nov. 2, 2010110 UT Arlington vs. Troy 25-23, 35-37, 25-23, 25-23 Oct. 19, 2014110 Georgia St. vs. UNCW 25-14, 24-26, 25-19, 36-34 Oct. 30, 2010110 Oregon vs. Oregon St. 39-37, 21-25, 25-22, 25-21 Oct. 27, 2009109 Texas vs. Baylor 25-18, 29-31, 30-28, 25-19 March 26, 2021109 Auburn vs. LSU 26-28, 35-33, 25-27, 23-25 Nov. 4, 2011109 Villanova vs. Delaware 27-25, 28-30, 25-20, 29-27 Sept. 6, 2011109 A&M-Corpus Christi vs.
UTGRV34-36, 25-16, 25-17, 25-22 Aug. 27, 2011
109 Coastal Carolina vs. Radford
34-32, 25-20, 25-27, 25-21 Oct. 16, 2010
109 Oklahoma vs. Missouri 25-19, 27-29, 25-19, 32-30 Oct. 9, 2010

Team Leaders 36
Points Scored, Five-Set Match (1981-2000)No. Team vs. Opponent Scores Date
89 Hawaii vs. BYU 15-12, 21-19, 13-15, 16-18, 24-22 Nov. 28, 199886 BYU vs. Hawaii 12-15, 19-21, 15-13, 18-16, 22-24 Nov. 28, 199881 Akron vs. Northern Ill. 10-15, 17-15, 15-4, 17-19, 22-24 Sept. 22, 200080 Eastern Wash. vs.
Sacramento St. 15-10, 16-18, 17-15, 16-18, 16-14 Sept. 30, 1999
79 Loyola Maryland vs. Drexel
16-14, 11-15, 15-6, 16-18, 21-23 Oct. 8, 1996
78 North Carolina vs. Duke 14-16, 10-15, 15-2, 15-12, 24-22 Oct. 3, 199778 Purdue vs. Northern Ill. 14-16, 16-14, 14-16, 15-10, 19-17 Sept. 11, 199278 Weber St. vs. Idaho 15-7, 17-19, 17-15, 14-16, 15-8 Sept. 27, 199077 Northern Ill. vs. Akron 15-10, 15-17, 4-15, 19-17, 24-22 Sept. 22, 200077 Nicholls St. vs. UTSA 15-4, 14-16, 12-15, 16-14, 20-18 Oct. 10, 199777 Rice vs. George Mason 15-17, 17-15, 15-13, 15-17, 15-10 Oct. 29, 199577 Rhode Island vs.
Washington12-15, 13-15, 15-10, 15-10, 22-20 Sept. 7, 1995
77 Centenary (LA) vs. LeTourneau
12-15, 13-15, 15-9, 15-11, 22-20 Oct. 16, 1992
Points Scored, Five-Set Match With 30-Point Scoring Format (2001-07)No. Team vs. Opponent Scores Date150 James Madison vs.
Georgia St.34-36, 30-19, 35-37, 30-21, 21-23 Oct. 26, 2007
149 Marquette vs. Duke 28-30, 33-31, 32-34, 39-37, 17-15 Aug. 30, 2003147 Duke vs. Marquette 30-28, 31-33, 34-32, 37-39, 15-17 Aug. 30, 2003146 Montana vs. Eastern
Wash.26-30, 37-35, 38-40, 30-22, 15-17 Oct. 25, 2007
145 Georgia St. vs. Fla. Atlantic
30-32, 38-40, 30-19, 30-20, 17-15 Nov. 22, 2002
144 Eastern Wash. vs. Montana
30-26, 35-37, 40-38, 22-30, 17-15 Oct. 25, 2007
142 Southern California vs. Nebraska
33-35, 30-27, 30-21, 34-36, 15-12 Dec. 11, 2004
138 Ball St. vs. Northern Ill. 30-25, 29-31, 34-36, 30-28, 15-13 Nov. 19, 2004138 Marshall vs. Ball St. 29-31, 32-30, 30-25, 30-32, 17-15 Oct. 10, 2003138 Ball St. vs. Toledo 30-26, 36-38, 27-30, 30-20, 15-11 Sept. 27, 2003137 South Carolina vs.
Arkansas30-24, 27-30, 35-37, 30-27, 15-13 Nov. 2, 2007
137 Ball St. vs. Bowling Green
28-30, 30-22, 25-30, 37-35, 17-15 Nov. 23, 2001
136 Georgia St. vs. James Madison
36-34, 19-30, 37-35, 21-30, 23-21 Oct. 26, 2007
136 Virginia Tech vs. App State
28-30, 30-28, 33-35, 30-21, 15-10 Sept. 9, 2006
136 Oral Roberts vs. Oklahoma
30-21, 25-30, 32-34, 30-24, 19-17 Oct. 5, 2005
136 Oakland vs. Western Ill. 29-31, 33-31, 29-31, 30-27, 15-8 Oct. 29, 2004 136 Wofford vs. ETSU 32-30, 28-30, 36-34, 25-30, 15-8 Oct. 19, 2003136 Duke vs. North Carolina 30-19, 30-32, 32-30, 35-33, 11-15 Oct. 17, 2003136 Texas A&M vs. Kansas 30-18, 32-34, 30-24, 29-31, 15-11 Oct. 15, 2003136 Virginia Tech vs.
Rutgers30-32, 30-26, 30-21, 31-29, 15-12 Oct. 13, 2002
Points Scored, Five-Set Match With 25-Point Scoring Format (2008-Present)No. Team vs. Opponent Scores Date132 Saint Mary’s (CA) vs.
Santa Clara22-25, 25-22, 44-46, 26-24, 15-11 Nov. 21, 2017
128 Santa Clara vs. Saint Mary’s (CA)
25-22, 22-25, 46-44, 24-26, 11-15 Nov. 21, 2017
127 Wichita St. vs. Bowling Green
25-22, 25-23, 28-30, 33-35, 16-14 Sept. 12, 2014
127 Oregon vs. Washington 24-16, 25-16, 25-21, 30-32, 23-25 Nov. 16, 2012
No. Team vs. Opponent Scores Date125 Iowa St. vs. UNI 29-27, 38-40, 23-25, 25-17, 10-15 Sept. 13, 2016125 Michigan vs. Pepperdine 30-32, 25-16, 25-27, 25-19, 20-18 Sept. 10, 2011125 Fordham vs. Fairfield 28-30, 25-13, 24-26, 33-31, 15-13 Oct. 29, 2008124 N.C. A&T vs. Delawre St. April 2, 2021124 Creighton vs. Butler 21-25, 38-36, 25-19, 25-17, 15-11 Nov. 12, 2017124 UNI vs. Iowa St. 27-29, 40-38, 25-23, 17-25, 15-10 Sept. 13, 2016124 Bowling Green vs.
Wichita St.22-25, 23-25, 30-28, 35-33, 14-16 Sept. 12, 2014
123 Providence vs. New Hampshire
29-31, 25-23, 31-29, 23-25, 15-8 Oct. 30, 2011
123 Idaho vs. Nevada 23-25, 25-23, 35-37, 25-22, 15-8 Nov. 4, 2010123 Colorado vs. Texas Tech 24-26, 20-25, 25-15, 26-24, 28-26 Oct. 13, 2010122 Delaware St. vs. N.C.
A&T.26-28, 22-25, 36-34, 25-22, 13-15 April 2, 2021
122 Northwestern vs. Iowa 24-26, 37-39, 25-23, 25-17, 11-15 Feb. 26, 2021122 Northern Ill. vs. Col. of
Charleston26-24, 25-15, 25-27, 31-33, 15-7 Aug. 28, 2010
121 Miami (OH) vs. Central Mich.
28-30, 23-25, 30-28, 25-22, 15-11 March 26, 2021
121 Cleveland St. vs. UIC 25-20, 26-28, 30-32, 25-18, 15-11 Nov. 4, 2011121 Charlotte vs. Kennesaw
St.20-25, 25-21, 38-36, 23-25, 15-9 Aug. 26, 2011
121 Kent St. vs. SIUE 23-25, 26-28, 25-18, 25-23, 22-20 Aug. 26, 2011121 UNC Greensboro vs.
Norfolk St.34-36, 21-25, 25-16, 25-8, 16-14 Aug. 28, 2010
121 Kansas vs. Wyoming 27-29, 23-25, 25-23, 26-24, 20-18 Sept. 12, 2008
Points Scored, Single Set (1981-2000)No. Team vs. Opponent Score Date
28 Navy vs. Loyola Maryland 28-26 Nov. 7, 200026 Loyola Maryland vs. Navy 26-28 Nov. 7, 200025 Oregon St. vs. Kentucky 25-23 Sept. 3, 199425 San Jose St. vs. Nevada 25-23 Oct. 16, 199324 Northern Ill. vs. Akron 24-22 Sept. 22, 200024 BYU vs. Hawaii 24-22 Nov. 28, 199824 North Carolina vs. Duke 24-22 Oct. 3, 199724 Colorado vs. Ball St. 24-22 Sept. 4, 199524 Utah vs. Oklahoma 24-22 Dec. 4, 199324 Marquette vs. Northern Ill. 24-22 Nov. 7, 198924 Oregon vs. Portland St. 24-22 Nov. 20, 198423 TCU vs. Cal St. Fullerton 23-21 Sept. 16, 200023 Drexel vs. Loyola Maryland 23-21 Oct. 8, 199623 Kentucky vs. Oregon St. 23-25 Sept. 3, 199423 Nevada vs. San Jose St. 23-25 Oct. 16, 199323 Kent St. vs. Eastern Ill. 23-21 Aug. 30, 199123 Indiana St. vs. Bradley 23-21 Oct. 20, 1990
Points Scored, Single Set With 30-Point Scoring Format (2001-07)No. Team vs. Opponent Score Date
48 Georgia Tech vs. Minnesota 48-46 Dec. 10, 200446 Minnesota vs. Georgia Tech 46-48 Dec. 10, 200446 San Jose St. vs. Fresno St. 46-44 Nov. 3, 200145 Georgia vs. Alabama 45-43 Nov. 10, 200245 Northern Ill. vs. Mississippi St. 45-43 Sept. 14, 200244 Cincinnati vs. Jacksonville St. 44-42 Sept. 16, 200544 Fresno St. vs. San Jose St. 44-46 Nov. 3, 200143 Fairfield vs. Mercer 43-41 Sept. 19, 200443 Alabama vs. Georgia 43-45 Nov. 10, 200243 Northwestern vs. Wisconsin 43-41 Oct. 23, 200243 Mississippi St. vs. Northern Ill. 43-45 Sept. 14, 200242 Pittsburgh vs. Notre Dame 42-40 Sept. 22, 200742 Jacksonville St. vs. Cincinnati 42-44 Sept. 16, 200542 Northern Ariz. vs. Montana 42-40 Oct. 1, 200442 Arizona St. vs. Arizona 42-40 Sept. 27, 200242 Hofstra vs. San Francisco 42-40 Sept. 20, 2002

Team Leaders 37
No. Team vs. Opponent Score Date41 Illinois vs. Wisconsin 41-39 Sept. 19, 200741 Florida St. vs. Wake Forest 41-39 Oct. 2, 200441 Mercer vs. Fairfield 41-43 Sept. 19, 200441 Col. of Charleston vs. Winthrop 41-39 Sept. 6, 200341 Wisconsin vs. Northwestern 41-43 Oct. 23, 2002
Points Scored, Single Set with 25-point Scoring Format (2008-Present)No. Team vs. Opponent Score Date
46 Santa Clara vs. Saint Mary’s (CA) 46-44 Nov. 21, 201745 Houston Baptist vs. Northern Colo. 45-43 Sept. 3, 201645 Manhattan vs. Rider 45-43 Oct. 23, 200944 Saint Mary’s (CA) vs. Santa Clara 44-46 Nov. 21, 201743 Purdue Fort Wayne vs. Liberty 43-41 Aug. 25, 201843 Northern Colo. vs. Houston Baptist 43-45 Sept. 3, 201643 Austin Peay vs. Murray St. 43-41 Oct. 8, 201143 Rider vs. Manhattan 43-45 Oct. 23, 200941 Oregon vs. Minnesota 41-39 Dec. 7, 201841 Liberty vs. Purdue Fort Wayne 41-43 Aug. 25, 201841 Murray St. vs. Austin Peay 41-43 Oct. 8, 201140 UNI vs. Iowa St. 40-38 Sept. 13, 201640 Louisiana vs. Houston Baptist 40-38 Sept. 3, 201039 Iowa vs. Northwestern 39-37 Feb. 26, 202139 California vs. UCLA 39-37 Jan. 22, 202139 Minnesota vs. Oregon 39-41 Dec. 7, 201839 Notre Dame vs. Virginia 39-37 Nov. 22, 201339 Louisiana vs. Little Rock 39-37 Oct. 30, 201139 SFA vs. North Texas 39-37 Sept. 15, 201039 Oregon vs. Oregon St. 39-37 Oct. 27, 200939 Stony Brook vs. Central Conn. St. 39-37 Aug. 30, 200838 Oakland vs. Wright St. 38-36 Feb. 8, 202138 Creighton vs. Butler 38-36 Nov. 12, 201738 Iowa St. vs. UNI 38-40 Sept. 13, 201638 Kennesaw St. vs. Eastern Ky. 38-36 Sept. 9, 201138 Charlotte vs. Kennesaw St. 38-36 Aug. 26, 201138 Indiana St. vs. Evansville 38-36 Nov. 5, 201038 Fla. Atlantic vs. FIU 38-36 Nov. 2, 201038 Northern Colo. vs. Georgia 38-36 Sept. 4, 201038 Cal St. Fullerton vs. Montana 38-36 Sept. 3, 200938 Michigan vs. Indiana 38-36 Oct. 18, 2008
Fewest Points Allowed, Three-Set MatchNo. Team vs. Opponent Score Date
0 Ga. Southern vs. Savannah St. 15-0, 15-0, 15-0 Nov. 17, 20000 Hofstra vs. Maine 15-0, 15-0, 15-0 Oct. 30, 19990 Alabama A&M vs. Southern U. 15-0, 15-0, 15-0 Sept. 3, 19990 Long Beach St. vs. Southern U. 15-0, 15-0, 15-0 Dec. 3, 19980 Cincinnati vs. Chicago St. 15-0, 15-0, 15-0 Sept. 15, 19970 George Washington vs. Coppin St. 15-0, 15-0, 15-0 Aug. 29, 19971 Nebraska vs. Oral Roberts 15-0, 15-1, 15-0 Sept. 4, 20001 Virginia Tech vs. Coppin St. 15-0, 15-1, 15-0 Sept. 12, 19981 Eastern Ill. vs. Chicago St. 15-0, 15-0, 15-1 Oct. 29, 19941 North Carolina vs. Georgia Tech 15-0, 15-1, 15-0 Oct. 16, 19832 IUPUI vs. Tennessee St. 15-1, 15-0, 15-1 Sept. 2, 20002 American vs. Coppin St. 15-0, 15-1, 15-1 Oct. 8, 19982 Penn St. vs. Bucknell 15-0, 15-2, 15-0 Sept. 15, 19982 Florida vs. South Carolina 15-2, 15-0, 15-0 Oct. 29, 19952 Centenary (LA) vs. LSU-Shreveport 15-1, 15-1, 15-0 Sept. 22, 19922 North Carolina vs. Georgia Tech 15-1, 15-0, 15-1 Oct. 29, 19982 Florida St. vs. FIU 15-0, 15-1, 15-1 Sept. 16, 19882 Kansas St. vs. Kansas City 15-0, 15-1, 15-1 Sept. 2, 19872 Hawaii vs. Fresno St. 15-2, 15-0, 15-0 Sept. 22, 1983
Fewest Points Allowed, Four-Set MatchNo. Team vs. Opponent Score Date19 Arkansas St. vs. Troy 15-3, 15-1, 11-15, 15-0 Sept. 18, 199919 Central Conn. St. vs. Hartford 15-1, 15-1, 6-15, 15-2 Sept. 12, 198720 Kent St. vs. Baldwin Wallace 15-4, 5-15, 15-0, 15-1 Sept. 27, 198821 Wisconsin vs. Northwestern 15-1, 15-1, 13-15, 15-4 Sept. 28, 199421 Texas vs. Baylor 14-16, 15-1, 15-2, 15-2 Nov. 12, 198422 Houston vs. Memphis 9-15, 15-1, 15-3, 15-3 Oct. 6, 199622 Rhode Island vs. Holy Cross 15-1, 15-5, 11-15, 15-1 Sept. 19, 198922 LSU vs. Missouri St. 11-15, 15-0, 15-2, 15-5 Oct. 2, 198723 Colorado vs. Colorado St. 15-4, 12-15, 15-3, 15-1 Nov. 9, 199423 Massachusetts vs. Central Conn.
St. 15-1, 13-15, 15-1, 15-6 Oct. 18, 1988
23 Houston vs. North Texas 11-15, 15-1, 15-1, 15-6 Sept. 3, 198823 Weber St. vs. Idaho St. 12-15, 15-0, 15-6, 15-2 Nov. 5, 1982
Fewest Points Allowed, Five-Set MatchNo. Team vs. Opponent Score Date38 North Carolina vs.
Georgia Tech15-3, 12-15, 11-15, 15-4, 15-1 Sept. 8, 1989
39 Texas vs. Texas A&M 8-15, 15-4, 15-4, 13-15, 15-1 Nov. 15, 199041 Massachusetts vs. MIT 8-15, 8-15, 15-4, 15-1, 15-6 Nov. 7, 198642 Houston vs. Florida St. 1-15, 15-5, 3-15, 15-3, 15-4 Oct. 7, 198842 Houston vs. Missouri
St.13-15, 14-16, 15-2, 15-5, 15-4 Oct. 1, 1983
43 Western Ky. vs. Murray St.
3-15, 15-2, 15-1, 3-15, 15-10 Sept. 29, 1998
43 Purdue vs. Denver 15-9, 10-15, 6-15, 15-1, 15-3 Sept. 11, 199843 Eastern Ky. vs. North
Carolina15-2, 7-15, 15-7, 4-15, 15-4 Oct. 20, 1990
43 Rhode Island vs. West Virginia
15-7, 13-15, 15-2, 10-15, 15-4 Oct. 7, 1989
43 Rhode Island vs. Boston College
15-4, 13-15, 14-16, 15-8, 15-0 Sept. 11, 1987
43 Weber St. vs. Indiana 12-15, 15-7, 10-15, 15-3, 15-3 Sept. 19, 1985

Division I Winningest Teams 38
ALL-TIME BY PERCENTAGE(Minimum of 10 years as a Division I institution)The rounding of percentages may indicate ties where none exists. In these cases, the numerical order is correct. All records are through 2020.
Team Years Won Lost Tied Pct.1. Penn St. 42 1309 218 0 .8572. Hawaii 45 1266 225 1 .8493. Nebraska 46 1381 253 12 .8434. Florida 37 1054 217 0 .8295. Stanford 45 1183 268 4 .8146. BYU 52 1324 363 5 .7847. Texas 47 1287 389 13 .7668. UCLA 51 1338 410 0 .7659. UNI 40 1020 317 0 .76310. Southern California 45 1079 389 4 .73411. Long Beach St. 56 1243 471 0 .72512. Colorado St. 45 967 406 0 .70413. FGCU 17 359 151 0 .70414. Missouri St. 49 1292 538 21 .70415. Pacific 45 1032 440 3 .70116. Minnesota 49 1249 534 6 .70017. Pittsburgh 47 1128 492 0 .69618. Col. of Charleston 24 531 239 0 .69019. Yale 23 401 186 0 .68320 Northern Colo. 40 964 453 0 .68021 American 40 889 420 0 .67922. Sacramento St. 45 1033 490 0 .67823. SFA 34 765 366 0 .67624. Florida St. 45 1044 505 1 .67425. Northern Ky. 46 1055 511 0 .674
ALL-TIME BY WINS(Minimum of 10 years as a Division I institution)
Team Years Won Lost Tied Pct.1. Nebraska 46 1381 253 12 .8432. UCLA 51 1338 410 0 .7653. BYU 52 1324 363 5 .7844. Penn St. 42 1309 218 0 .8575. Missouri St. 49 1292 538 21 .7046. Texas 47 1287 389 13 .7667. Hawaii 45 1266 225 1 .8498. Minnesota 49 1249 534 6 .7009. Long Beach St. 56 1243 471 0 .72510. North Dakota St. 56 1217 600 0 .67011. Stanford 45 1183 268 4 .81412. Dayton 51 1167 601 0 .66013. Portland St. 51 1153 577 4 .66614. Illinois St. 48 1144 583 0 .66215. Pittsburgh 47 1128 492 0 .69616. Milwaukee 48 1100 651 9 .62817. Ohio St. 50 1088 572 0 .65518. Southern California 45 1079 389 4 .73419. North Carolina 50 1071 604 0 .63920. Arkansas St. 46 1069 556 5 .65721. Omaha 50 1069 634 6 .62722. Texas A&M 46 1057 585 2 .64423. Florida 37 1054 217 0 .82924. UCF 46 1052 629 0 .62625. Florida St. 45 1044 505 1 .674
LAST FIVE YEARS BY PERCENTAGE
Minimum five years as a Division I institution. The rounding of percent-ages may indicate ties where none exists. In these cases, the numerical order is correct. Includes records from 2016-20.
Team Won Lost Pct.1. BYU 133 16 .8932. Western Ky. 136 20 .8723. Texas 127 19 .8704. Nebraska 136 22 .8615. Florida 131 22 .8566. Minnesota 127 24 .8417. Pittsburgh 130 25 .8398. Stanford 123 24 .8379. Kentucky 127 25 .83610. SFA 132 30 .81511. Creighton 120 30 .80012. Wisconsin 118 30 .79713. Dayton 112 29 .79414. New Mexico St. 112 29 .79415. Colorado St. 111 29 .79316. Cal Poly 91 24 .79117. FGCU 117 31 .79118. Penn St. 120 32 .78919. Denver 110 30 .78620. Washington 121 37 .76621. Hawaii 87 27 .76322. Baylor 115 37 .75723. Coastal Carolina 102 33 .75624. Marquette 111 36 .75525. Towson 103 34 .752
LAST FIVE YEARS BY WINSMinimum five years as a Division I institution. Includes records from 2016-20
Team Won Lost Pct.1. Nebraska 136 22 .861
Western Ky. 136 20 .8723. BYU 133 16 .8934. SFA 132 30 .8155. Florida 131 22 .8566. Pittsburgh 130 25 .8397. Texas St. 128 47 .7318. Texas 127 19 .870
Kentucky 127 25 .836Minnesota 127 24 .841
11. Stanford 123 24 .83712. Washington 121 37 .76613. Creighton 120 30 .800
Penn St. 120 32 .78915. Wisconsin 118 30 .79716. FGCU 117 31 .79117. Baylor 115 37 .75718. Dayton 112 29 .794
New Mexico St. 112 29 .79420. UCF 111 38 .745
Marquette 111 36 .755Colorado St. 111 29 .793Missouri 111 42 .725
24. South Dakota 110 37 .748Denver 110 30 .786
DIVISION I WINNINGEST TEAMS

Annual Team Champions 39
ANNUAL TEAM CHAMPIONS
Kills Per SetYear Team W-L Sets Kills Avg.1994 Ohio St. 29-3 111 1,974 17.781995 Ohio St. 22-8 103 1,915 18.591996 Pepperdine 13-11 93 1,763 18.961997 UCLA 17-13 110 2,047 18.611998 Colorado 22-8 107 2,034 19.011999 Long Beach St. 31-4 118 2,168 18.372000 Santa Clara 27-5 117 2,262 *19.332001 Pepperdine 23-4 89 1,571 17.652002 Hawaii 34-2 114 2,074 18.192003 Georgia Tech 34-4 129 2,355 18.262004 Georgia Tech 27-7 114 2,125 18.642005 Ohio 33-3 120 2,125 17.712006 Nebraska 33-1 115 2,001 17.402007 Nebraska 30-2 103 1,829 17.762008 Valparaiso 25-7 119 1,823 15.322009 Texas A&M 20-11 109 1,644 15.082010 San Diego 24-6 104 1,592 15.312011 Northern Ill. 28-7 125 1,877 15.022012 Oregon 30-5 123 1,962 15.952013 Missouri 35-1 117 1,789 15.292014 UCLA 22-12 121 1,827 15.102015 Kansas 30-3 113 1,706 15.102016 San Diego 24-6 107 1,597 14.932017 UNI 27-9 131 1,997 15.242018 Fla. Atlantic 21-7 99 1,517 15.322019 Cincinnati 27-7 125 1,889 15.112020 Kentucky 24-1 83 1,271 15.31*Record.
Assists Per SetYear Team W-L Sets Ast. Avg.1994 Ohio St. 29-3 111 1,808 16.291995 Ohio St. 22-8 103 1,746 16.951996 Pepperdine 13-11 93 1,586 17.051997 UCLA 17-13 110 1,886 17.151998 Colorado 22-8 107 1,867 17.451999 Long Beach St. 31-4 118 1,968 16.682000 Santa Clara 27-5 117 2,091 *17.872001 Hawaii 29-6 120 1,940 16.172002 Hawaii 34-2 114 1,906 16.722003 Georgia Tech 34-4 129 2,199 17.052004 Georgia Tech 27-7 114 1,977 17.342005 Ohio 33-3 120 1,983 16.532006 Nebraska 33-1 115 1,863 16.202007 St. John’s (NY) 33-4 125 2,056 16.452008 Valparaiso 25-7 119 1,697 14.262009 Texas A&M 20-11 109 1,555 14.272010 San Diego 24-6 104 1,512 14.542011 Northern Ill. 28-7 125 1,749 13.992012 Oregon 30-5 123 1,833 14.902013 Missouri 35-1 117 1,704 14.562014 UCLA 22-12 121 1,725 14.262015 Kansas 30-3 113 1,601 14.172016 Lipscomb 22-8 109 1,529 14.032017 Fla. Atlantic 18-9 99 1,426 14.402018 Fla. Atlantic 21-7 99 1,440 14.552019 Cincinnati 27-7 125 1,775 14.202020 Kentucky 24-1 83 1,171 14.13*Record.
Service Aces Per SetYear Team W-L Sets Aces Avg.1994 Seton Hall 31-4 120 350 2.921995 Manhattan 16-17 126 369 2.931996 Fairfield 23-12 123 373 3.031997 Hampton 16-20 123 317 2.581998 Grambling 29-12 150 452 3.011999 Centenary (LA) 21-13 121 328 2.712000 Iona 16-13 101 230 2.282001 American 26-4 98 298 3.042002 Albany (NY) 16-15 115 393 3.422003 Hampton 14-14 105 358 3.412004 Florida A&M 28-3 96 249 2.592005 Mississippi Val. 26-4 103 392 *3.812006 LIU 25-11 123 338 2.752007 UMES 24-4 107 304 2.842008 American 24-9 116 256 2.212009 UMES 24-7 100 254 2.542010 UMES 20-12 118 246 2.082011 South Carolina St. 17-16 115 242 2.102012 Jackson St. 24-12 130 273 2.102013 Hampton 19-11 112 218 1.952014 Penn St. 36-3 127 243 1.912015 UMES 22-7 103 204 1.982016 UMES 18-13 102 214 2.102017 UMES 27-9 134 268 2.002018 Denver 27-3 110 219 1.992019 UMES 12-19 127 263 2.072020 Denver 14-3 58 130 2.24*Record.
Digs Per SetYear Team W-L Sets Digs Avg.1994 Duke 24-6 106 2,446 23.081995 Mississippi St. 16-18 125 2,765 22.121996 Southeastern La. 28-6 128 2,673 20.881997 Eastern Ill. 21-14 133 2,845 21.391998 Eastern Ill. 24-7 113 2,376 21.031999 CSUN 11-11 87 1,872 21.522000 CSUN 16-10 105 2,190 20.862001 Rider 10-16 95 1,996 21.012002 Southeastern La. 18-14 116 2,577 22.222003 Southeastern La. 15-16 118 2,491 21.112004 Princeton 19-8 108 2,259 20.922005 Col. of Charleston 32-2 111 2,269 20.442006 Murray St. 19-8 105 2,465 *23.482007 Chattanooga 19-14 131 2,964 22.632008 IUPUI 16-15 121 2,257 18.652009 NJIT 17-11 97 1,922 19.812010 Yale 18-8 94 1,818 19.342011 Southern Miss. 17-15 119 2,231 18.752012 Penn 13-12 96 2,067 21.532013 Tulsa 24-7 121 2,218 18.332014 Illinois St. 27-6 124 2,269 18.302015 USC Upstate 15-15 112 2,005 17.902016 UNI 24-10 122 2,260 18.522017 Valparaiso 17-16 117 2,343 20.032018 Northern Ky. 21-10 121 2,399 19.832019 Wright St. 24-6 111 2,156 19.422020 Canisius 9-4 49 1,010 20.61*Record.
Hitting PercentageYear Team W-L Sets Kills Errors Att. Pct.1994 Nebraska 31-1 103 1,765 526 3,901 .3181995 Nebraska 32-1 106 1,774 532 3,954 .314

Annual Team Champions 40
Year Team W-L Sets Kills Errors Att. Pct.1996 George Mason 26-3 99 1,638 508 3,528 .3201997 Penn St. 34-2 120 1,999 564 4,546 .3161998 Penn St. 35-1 114 1,854 462 4,020 .3461999 Penn St. 36-1 125 2,027 521 4,583 .3292000 Arizona 28-5 115 2,048 628 4,441 .3202001 Long Beach St. 33-1 108 1,868 514 3,770 .3592002 Hawaii 34-2 114 2,074 578 4,543 .3292003 Florida A&M 27-4 100 1,688 452 3,394 .3642004 Florida A&M 28-3 96 1,654 403 3,388 .3692005 Washington 32-1 108 1,892 481 4,178 .3382006 Penn St. 32-3 114 1,913 573 4,155 .3232007 Penn St. 34-2 122 2,085 585 4,286 .3502008 Penn St. 38-0 116 1,734 428 3,352 *.3902009 Penn St. 38-0 122 1,784 410 3,605 .3812010 Stanford 27-4 109 1,658 441 3,811 .3192011 Florida 27-6 117 1,624 478 3,713 .3092012 Texas 29-4 115 1,639 408 3,789 .3252013 Missouri 35-1 117 1,789 422 3,839 .3562014 Penn St. 36-3 127 1,867 498 4,006 .3422015 Florida 25-7 117 1,663 467 3,822 .3132016 Florida 27-4 105 1,517 388 3,343 .3382017 Penn St. 33-2 123 1,753 452 3,843 .3392018 Texas 23-5 101 1,404 393 3,261 .3102019 Texas 23-4 98 1,355 334 3,145 .3252020 Kentucky 24-1 83 1,271 311 2,667 .360*Record.
Blocks Per SetYear Team W-L Sets Solo Ast. Tot. Avg.1994 Howard 26-10 134 202 644 524.0 3.911995 Texas 28-7 131 174 611 479.5 3.661996 Penn St. 31-3 115 122 657 450.5 3.921997 Washington 20-10 108 103 657 431.5 4.001998 Nebraska 32-2 115 91 723 452.5 3.931999 Hawaii 29-2 104 74 666 407.0 3.912000 Nebraska 34-0 115 107 741 477.5 4.152001 Nebraska 31-2 108 116 670 451.0 *4.182002 Nebraska 31-2 103 81 626 394.0 3.832003 Notre Dame 23-7 109 116 580 406.0 3.722004 Nebraska 30-2 106 89 675 426.5 4.022005 Nebraska 33-2 116 66 823 477.5 4.122006 Utah 28-4 110 53 711 408.5 3.712007 Louisville 22-8 107 93 658 422.0 3.942008 Penn St. 38-0 116 75 597 373.5 3.222009 Idaho 15-15 117 44 668 378.0 3.232010 Ohio 22-13 133 109 631 424.5 3.192011 Stanford 22-8 113 67 584 359.0 3.182012 Washington 25-7 117 29 729 393.5 3.362013 Creighton 23-9 121 74 592 370.0 3.062014 BYU 30-5 121 60 811 465.5 3.852015 Syracuse 23-8 120 80 589 374.5 3.122016 Stanford 27-7 129 78 710 433 3.362017 VCU 30-3 116 63 637 381.5 3.292018 Stanford 34-1 121 35 754 412 3.402019 VCU 24-7 112 50 613 356.5 3.182020 Louisville 14-3 58 57 276 195 3.36*Record.
Match Won-Lost PercentageYear Team W-L Pct.1994 Stanford 32-1 .9701995 Nebraska 32-1 .9701996 Florida 37-2 .9491997 Penn St. 34-2 .9441998 Long Beach St. 36-0 *1.0001999 Penn St. 36-1 .9732000 Nebraska 34-0 *1.0002001 Long Beach St. 33-1 .9712002 Southern California 31-1 .9692003 Southern California 35-0 *1.0002004 Hawaii 30-1 .9682005 Washington 32-1 .9702006 Nebraska 33-1 .9712007 Penn St. 34-2 .9442008 Penn St. 38-0 *1.0002009 Penn St. 38-0 *1.0002010 Florida 29-2 .9352011 UNI 33-2 .9432012 Penn St. 33-3 .9172013 Missouri 35-1 .9722014 Stanford 33-2 .9432015 Hawaii 29-2 .9352016 Dayton 30-2 .9382017 Penn St. 33-2 .9432018 Stanford 34-1 .9712019 Western Ky. 32-2 .9412020 Kentucky 24-1 .960*Record.

AVCA Final Division I Polls 41
AVCA FINAL DIVISION I POLLS
19821. Hawaii2. San Diego St.3. Southern California4. Stanford 5. Pacific6. Cal Poly7. UCLA8. Purdue9. Arizona St.10. California11. Arizona12. San Jose St.13. BYU14. Tennessee15. Nebraska16. Texas17. UC Santa Barbara18. Northwestern19. Pepperdine20. Texas A&M
19831. Hawaii 2. Pacific3. UCLA 4. Stanford5. Kentucky6. San Diego St.7. Texas8. BYU9. Western Mich.10. Arizona11. Southern California12. UC Santa Barbara13. Cal Poly14. Tennessee15. Purdue16. Nebraska17. California18. Arizona St.19. Oregon St.20. Colorado St.
19841. UCLA2. Stanford3. Pacific4. Cal Poly5. Southern California6. Hawaii7. Nebraska8. San Diego St.9. Texas10. Colorado St.11. San Jose St.12. Illinois St.13. Arizona14. Penn St.
15. BYU16. Northwestern17. Pepperdine18. Oregon19. Western Mich.20. Purdue
19851. Stanford 2. Pacific3. Cal Poly Southern California5. UCLA6. Nebraska7. San Jose St.8. Hawaii9. Texas10. Purdue11. Illinois12. UC Santa Barbara13. Arizona St.14. BYU15. Colorado St.16. Western Mich.17. Arizona18. Texas A&M19. San Diego St.20. Penn St.
19861. BYU2. Pacific3. Hawaii4. San Jose St.5. San Diego St.6. Nebraska7. UCLA8. Texas9. Illinois10. UC Santa Barbara11. Stanford12. Cal Poly13. Arizona St.14. Penn St.15. Oregon16. LSU17. Western Mich.18. Georgia19. Pepperdine20. Colorado St.
19871. Pacific2. Hawaii3. Stanford4. BYU5. UCLA6. Colorado St.7. Texas8. Illinois
9. Kentucky10. Nebraska11. San Jose St.12. Western Mich.13. UC Santa Barbara14. Cal Poly15. Southern California16. UT Arlington17. Oregon18. Pepperdine19. California20. Long Beach St.
19881. UCLA2. Stanford3. Hawaii4. Illinois5. Nebraska6. Texas7. UT Arlington8. Long Beach St.9. Washington10. Pacific11. Kentucky12. BYU13. Oklahoma14. Arizona St.15. San Diego St.16. Arizona17. Southern California18. San Jose St.19. New Mexico20. Penn St. Cal Poly
19891. UCLA 2. Hawaii3. Pacific4. Long Beach St.5. Nebraska6. Texas7. Illinois8. Stanford9. UT Arlington10. Washington11. Penn St.12. UC Santa Barbara13. Arizona14. Southern California15. Ohio St.16. Oregon17. LSU18. Wyoming19. Cal Poly20. California
19901. UCLA
2. Nebraska3. Stanford4. Hawaii5. Pacific6. Penn St.7. Texas8. UC Santa Barbara9. Long Beach St.10. San Jose St.11. Pepperdine12. BYU13. Wisconsin14. New Mexico15. Ohio St.16. Texas Tech17. LSU18. Pittsburgh19. San Diego St.20. Purdue
19911. Stanford 2. Long Beach St.3. Hawaii4. Pacific5. LSU6. UCLA7. Nebraska8. New Mexico9. BYU10. Florida11. Texas12. Ohio St.13. UC Santa Barbara14. Southern California15. Pepperdine16. Penn St.17. Texas Tech18. Georgia 19. Washington St.20. Fresno St.
19921. UCLA2. Stanford3. Long Beach St.4. Pacific5. Florida6. Illinois7. Nebraska8. BYU9. Penn St.10. Texas11. Southern California12. LSU13. UC Santa Barbara14. Arizona St.15. Colorado16. Kentucky
17. Texas Tech18. New Mexico19. Georgia20. Washington St.21. Ohio St.22. Notre Dame23. Fresno St.24. Houston25. CSUN
19931. UCLA2. Texas3. Long Beach St.4. BYU5. UC Santa Barbara6. Stanford7. Penn St.8. Nebraska9. Colorado10. Arizona St.11. Pacific12. Kentucky13. Southern California14. Florida15. Ohio St.16. Arizona17. Notre Dame18. Hawaii19. Georgia20. Duke21. Washington St.22. Santa Clara23. Illinois24. LMU (CA)25. Florida St.
19941. Nebraska2. Stanford3. UCLA4. Ohio St.5. Penn St.6. Hawaii7. Long Beach St.8. BYU9. UC Santa Barbara10. Southern California11. Pacific12. Notre Dame13. Colorado14. Florida15. Arizona St.16. Arizona17. Houston18. Georgia19. Idaho20. New Mexico21. Duke

AVCA Final Division I Polls 42
22. Washington23. Montana24. Texas25. Washington St.
19951. Nebraska2. Texas3. Stanford4. Michigan St.5. Hawaii6. Florida7. UCLA8. Penn St.9. Ohio St.10. Oral Roberts11. Arizona St.12. Southern California13. San Diego St.14. Notre Dame15. Texas A&M16. Illinois17. Washington St.18. UC Santa Barbara19. Pacific20. Long Beach St.21. LMU (CA)22. Georgia Tech23. BYU24. UNI25. Texas Tech
19961. Stanford2. Hawaii3. Nebraska4. Florida5. Penn St.6. Michigan St.7. Washington St.8. BYU9. LMU (CA) 10. Long Beach St.11. Texas12. Pacific13. Ohio St.14. Southern California15. Wisconsin16. Louisville17. UC Santa Barbara18. Washington19. Texas A&M20. George Mason21. Maryland22. South Fla.23. Arizona24. Kansas St.25. Notre Dame
19971. Stanford2. Penn St.3. Long Beach St.4. Florida
5. Wisconsin6. UC Santa Barbara7. BYU8. Nebraska9. Southern California10. Texas11. Washington12. Washington St.13. Texas A&M14. Colorado15. Ohio St.16. Pacific17. LMU (CA)18. Notre Dame19. Colorado St.20. San Diego21. Arkansas22. Arizona23. Maryland24. Pepperdine25. Hawaii
19981. Long Beach St.2. Penn St.3. Nebraska4. Florida5. Hawaii6. BYU7. Wisconsin8. Texas9. Stanford10. Pacific11. Southern California12. UC Santa Barbara13. Arkansas14. Illinois15. Pepperdine16. UCLA17. Colorado18. Texas A&M19. San Diego20. Arizona21. Louisville22. Michigan St.23. Kansas St.24. Ohio St.25. Indiana
19991. Penn St.2. Stanford3. Pacific4. Long Beach St.5. Florida6. UC Santa Barbara7. UCLA8. Hawaii9. Texas A&M10. Pepperdine11. Nebraska12. Colorado St.13. BYU
14. Arizona15. UNI16. Minnesota17. Southern California18. Texas19. Kansas St.20. Baylor21. North Carolina22. Clemson23. Wisconsin24. San Diego25. Arkansas
20001. Nebraska2. Wisconsin3. Hawaii4. Southern California5. Arizona6. Penn St.7. UCLA8. Pacific9. UC Santa Barbara10. Colorado St.11. Minnesota12. Florida13. BYU14. Long Beach St.15. Ohio St.16. Kansas St.17. Santa Clara18. Pepperdine19. Stanford20. Utah21. Notre Dame22. Utah St.23. Texas A&M24. UNI25. LMU (CA)
20011. Stanford2. Long Beach St.3. Nebraska4. Arizona5. Southern California6. Florida7. Wisconsin8. Pepperdine9. UCLA10. Colorado St.11. Texas A&M12. Ohio St.13. Hawaii14. Pacific15. Utah16. UNI17. Penn St.18. Kansas St.19. Michigan St. 20. Illinois21. Utah St.22. BYU
23. Colorado24. San Jose St.25. San Diego
20021. Southern California2. Stanford3. Hawaii4. Florida5. Nebraska6. Pepperdine7. Washington St.8. UC Santa Barbara9. UNI10. Arizona11. Minnesota12. North Carolina13. Ohio St.14. Long Beach St.15. UCLA16. Penn St.17. Georgia Tech18. Wisconsin19. Santa Clara20. Missouri21. Kansas St.22. Michigan St.23. Miami (FL)24. Eastern Wash.25. Temple
20031. Southern California2. Florida3. Hawaii4. Minnesota5. UCLA6. Pepperdine7. Penn St.8. Georgia Tech9. Washington10. Stanford11. Kansas St.12. California13. Nebraska14. Colorado St.15. Illinois16. Texas A&M17. LMU (CA)18. UNI19. Santa Clara20. Louisville21. Wisconsin22. UC Santa Barbara23. Utah24. Notre Dame25. Maryland
20041. Stanford2. Minnesota3. Washington4. Southern California5. Nebraska
6. Ohio St.7. Penn St.8. Hawaii9. UCLA10. Tennessee11. Texas12. San Diego13. Saint Mary’s (CA)14. Wisconsin15. Florida16. Louisville17. Georgia Tech18. California19. Colorado St.20. Texas A&M21. UC Santa Barbara22. Arizona23. Kansas St.24. Missouri25. Florida A&M
20051. Washington2. Nebraska3. Florida4. Santa Clara5. Penn St.6. Tennessee7. Arizona8. Missouri9. Hawaii10. Wisconsin11. Louisville12. Notre Dame13. Stanford14. Ohio15. UCLA16. Texas17. Purdue18. Pepperdine19. Southern California20. California21. Minnesota22. San Diego23. Ohio St.24. Kansas St.25. Utah Wichita St.
20061. Nebraska 2. Stanford 3. UCLA4. Washington 5. Penn St. 6. Minnesota 7. Texas 8. Southern California 9. Hawaii 10. Florida 11. Wisconsin 12. Oklahoma 13. California

AVCA Final Division I Polls 43
14. San Diego15. Utah16. Ohio St.17. Cal Poly 18. Purdue19. LSU20. BYU21. Missouri 22. Duke 23. New Mexico St.24. Colorado25. Ohio
20071. Penn St.2. Stanford3. Southern California4. California5. Nebraska6. Texas7. UCLA8. Florida9. Oregon10. Washington11. Cal Poly12. BYU13. St. John’s (NY)14. Wisconsin15. Middle Tenn.16. Kansas St.17. Iowa St.18. Hawaii19. Michigan20. Michigan St.21. New Mexico St.22. Clemson23. Long Beach St.24. Dayton25. San Diego
20081. Penn St.2. Stanford3. Nebraska4. Texas5. Washington6. California7. Hawaii8. UCLA9. Oregon10. Florida11. Illinois12. Iowa St.13. Southern California14. Minnesota15. Purdue16. Utah17. Michigan18. Wichita St.19. San Diego20. Kansas St.21. Saint Louis22. Kentucky
23. Long Beach St.24. Colorado St.25. Santa Clara
20091. Penn St.2. Texas3. Hawaii 4. Minnesota5. Nebraska6. Iowa St.7. Stanford8. California9. Michigan10. Illinois11. Florida St.12. Kentucky13. Washington14. UCLA15. Florida16. Southern California17. Colorado St.18. Oregon19. LSU20. Baylor21. Texas A&M22. Saint Mary’s (CA)23. UNI24. Tennessee25. Dayton
20101. Penn St.2. California3. Southern California4. Texas5. Stanford6. Washington7. Nebraska8. Florida9. Illinois10. Minnesota11. Purdue12. UCLA13. Hawaii14. UNI15. Dayton16. Colorado St.17. San Diego18. Duke19. Ohio St.20. Tulsa21. Oklahoma22. Missouri23. Indiana24. Tennessee25. Iowa St.
20111. UCLA2. Illinois3. Southern California4. Texas
5. Hawaii6. Pepperdine7. Florida St.8. Iowa St.9. Penn St.10. Purdue11. Florida12. Nebraska13. Kentucky14. Stanford15. Minnesota16. California17. Washington18. UNI19. Tennessee20. Michigan San Diego22. Kansas St.23. Ohio St.24. Oregon25. Colorado St.
20121. Texas2. Oregon3. Penn St.4. Stanford5. Michigan6. Southern California7. Nebraska8. Minnesota9. Washington10. Florida11. Hawaii12. BYU13. UCLA14. Iowa St.15. Purdue16. Michigan St.17. Louisville18. Florida St.19. Dayton20. Kentucky21. Western Ky.22. Ohio St.23. Wichita St.24. Creighton25. Kansas
20131. Penn St.2. Wisconsin3. Texas4. Washington5. Stanford6. Southern California7. Nebraska8. Purdue9. San Diego10. Minnesota11. Florida St.12. Missouri13. BYU
14. Michigan St.15. Florida16. Illinois17. Kansas18. Hawaii19. American20. Kentucky21. Colorado St.22. Duke23. Marquette24. Oregon25. North Carolina
20141. Penn St.2. Stanford3. BYU4. Wisconsin5. Texas6. Florida7. North Carolina8. Nebraska9. Washington10. Florida St.11. Illinois12. Colorado St.13. Ohio St.14. Oregon15. UCLA16. Arizona17. Kentucky 18. Utah19. Long Beach St.20. Oregon St.21. Colorado22. Arizona St.23. Hawaii24. Little Rock25. Duke
20151. Nebraska2. Texas3. Minnesota4. Kansas5. Southern California6. Washington7. Hawaii 8. Florida9. Penn St.10. Wisconsin11. BYU12. UCLA13. Ohio St.14. Stanford15. Illinois16. LMU (CA)17. Purdue18. Texas A&M19. Creighton20. Florida St.21. Louisville22. Western Ky.
23. Colorado St.24. Michigan25. North Carolina
20161. Stanford2. Texas3. Minnesota4. Nebraska5. Wisconsin6. UCLA7. Washington8. BYU9. Creighton10. Penn St.11. North Carolina12. Kansas13. Florida St.14. Michigan15. Florida16. Missouri17. Hawaii18. Ohio St.19. Michigan St.20. Arizona21. Oregon22. San Diego23. Kentucky24. Washington St.25. Utah
20171. Nebraska2. Florida3. Penn St.4. Stanford5. Texas6. Kentucky7. Southern California8. Michigan St.9. BYU10. Minnesota11. Utah12. Wisconsin13. San Diego14. UCLA15. Washington16. Creighton17. Illinois18. Purdue19. Colorado20. Missouri21. Baylor22. Cal Poly23. Wichita St.24. Colorado St.25. Iowa St.
20181. Stanford2. Nebraska3. Illinois4. BYU

AVCA Final Division I Polls 44
5. Texas6. Penn St.7. Minnesota8. Wisconsin9. Oregon10. Kentucky11. Florida12. Michigan13. Creighton14. Pittsburgh15. Marquette16. Washington St.17. Purdue18. Washington19. Tennessee20. San Diego21. Southern California22. Cal Poly23. Missouri24. Baylor25. Arizona UCF
20191 Stanford2. Wisconsin3. Baylor4. Minnesota5. Nebraska6. Washington7. Penn St.8. Texas9. Utah10. Florida11. Pittsburgh12. Kentucky13. Purdue14. Louisville15. Hawaii16. Creighton17. BYU18. Texas A&M19. Cincinnati20. Marquette21. San Diego22. Western Kentucky23. Colorado St.24. Rice25. UCLA
20201. Kentucky 2. Texas3. Wisconsin4. Washington5. Florida6. Nebraska7. Purdue8. Pittsburgh9. Minnesota10. Ohio St.11. Louisville12. Penn St.13. Baylor14. Oregon15. BYU16. Western Ky.17. Utah18. Washington St.19. UCLA20. Pepperdine21. San Diego22. Georgia Tech23. Rice24. Notre Dame25. Missouri

AVCA Final Division I Polls 45
2020 AVCA WEEKLY DIVISION I POLLSTeam PS 1/26 2/1 2/8 2/15 2/22 3/1 3/8 3/15 3/22 3/29 4/5 F Baylor 6 6 5 6 6 6 6 6 6 6 9 11 13BYU 16 16 14 12 12 12 15 15 16 15 14 14 15Creighton 15 14 19 21 T20 23 23 23 24 NR NR NR NRFlorida 11 10 10 9 9 8 8 7 7 7 6 6 5Florida State NR NR NR NR NR NR NR NR 25 25 NR NR NRGeorgia Tech 18 19 17 17 16 16 18 20 23 22 23 23 22Hawai'i 21 23 NR NR NR NR NR NR NR NR NR NR NRKentucky 4 5 3 3 3 3 3 3 3 3 2 2 1Louisville 12 12 12 14 14 13 13 13 13 14 13 13 11Marquette 20 25 25 25 24 24 24 NR NR NR NR NR NRMichigan 24 22 23 24 NR NR NR NR NR NR NR NR NRMinnesota 7 7 6 5 5 5 5 5 4 4 3 3 9Missouri 17 17 16 16 25 25 NR 25 NR 24 25 25 25Nebraska 5 4 4 4 4 4 4 4 5 5 4 4 6Notre Dame 14 15 15 13 13 14 14 14 18 23 22 22 24Ohio State NR NR NR NR NR 19 19 11 9 9 10 8 10Oregon NR NR NR NR 22 22 20 19 17 16 16 16 14Penn State 9 9 9 8 8 10 10 12 12 11 11 12 12Pepperdine NR NR NR NR NR NR 25 24 22 20 20 20 20Pittsburgh 19 20 20 19 19 21 22 22 19 19 18 19 8Purdue 13 13 13 11 11 11 11 10 10 10 8 9 7Rice NR NR NR NR NR NR NR NR NR NR 24 24 23San Diego 23 21 21 20 18 18 17 18 21 21 21 21 21Stanford 3 3 7 15 23 NR NR NR NR NR NR NR NRTexas 2 2 2 2 2 2 2 2 2 2 5 5 2UCLA 22 18 18 18 15 15 12 17 15 17 17 15 19Utah 10 8 8 7 7 7 9 9 11 12 12 10 17Washington 8 11 11 10 10 9 7 8 8 8 7 7 4Washington State NR NR 24 22 17 17 16 16 14 13 15 17 18Wisconsin 1 1 1 1 1 1 1 1 1 1 1 1 3WKU 25 24 22 23 T20 20 21 21 20 18 19 18 16PS - preseason poll (Jan. 5); F -
final poll (April 26).
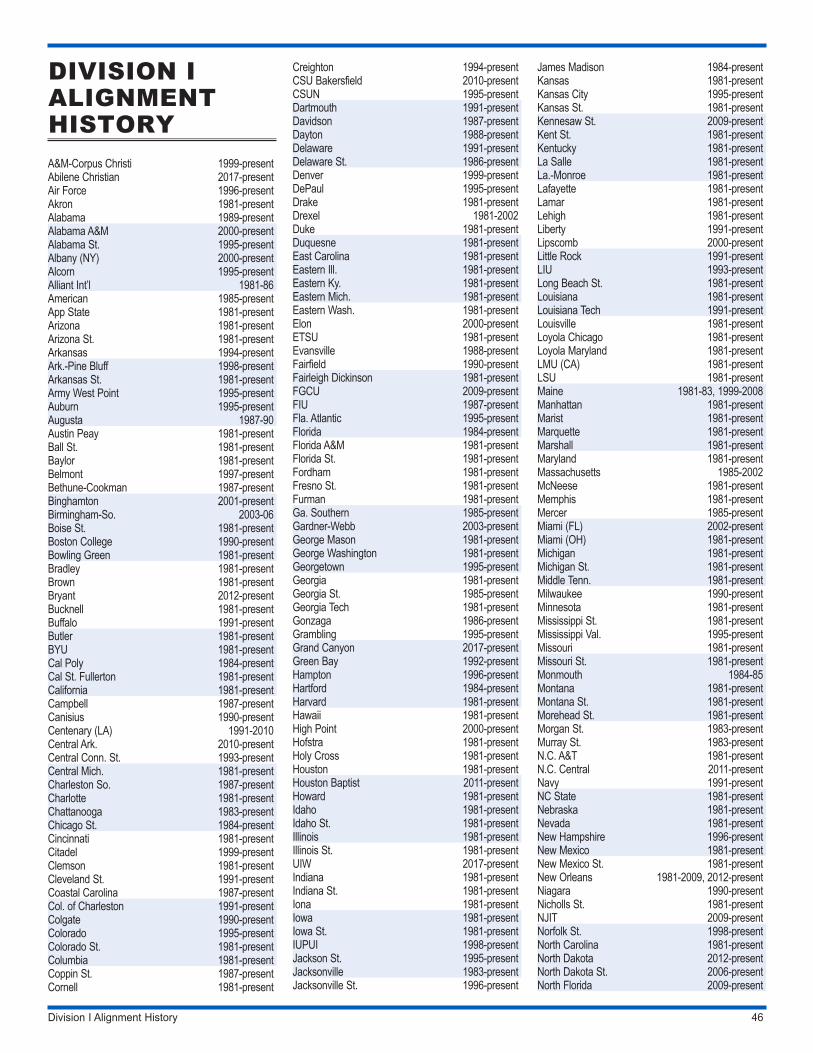
Division I Alignment History 46
DIVISION I ALIGNMENT HISTORY A&M-Corpus Christi 1999-presentAbilene Christian 2017-presentAir Force 1996-presentAkron 1981-presentAlabama 1989-presentAlabama A&M 2000-presentAlabama St. 1995-presentAlbany (NY) 2000-presentAlcorn 1995-presentAlliant Int’l 1981-86American 1985-presentApp State 1981-presentArizona 1981-presentArizona St. 1981-presentArkansas 1994-presentArk.-Pine Bluff 1998-presentArkansas St. 1981-presentArmy West Point 1995-presentAuburn 1995-presentAugusta 1987-90Austin Peay 1981-presentBall St. 1981-presentBaylor 1981-presentBelmont 1997-presentBethune-Cookman 1987-presentBinghamton 2001-presentBirmingham-So. 2003-06Boise St. 1981-presentBoston College 1990-presentBowling Green 1981-presentBradley 1981-presentBrown 1981-presentBryant 2012-presentBucknell 1981-presentBuffalo 1991-presentButler 1981-presentBYU 1981-presentCal Poly 1984-presentCal St. Fullerton 1981-presentCalifornia 1981-presentCampbell 1987-presentCanisius 1990-presentCentenary (LA) 1991-2010Central Ark. 2010-presentCentral Conn. St. 1993-presentCentral Mich. 1981-presentCharleston So. 1987-presentCharlotte 1981-presentChattanooga 1983-presentChicago St. 1984-presentCincinnati 1981-presentCitadel 1999-presentClemson 1981-presentCleveland St. 1991-presentCoastal Carolina 1987-presentCol. of Charleston 1991-presentColgate 1990-presentColorado 1995-presentColorado St. 1981-presentColumbia 1981-presentCoppin St. 1987-presentCornell 1981-present
Creighton 1994-presentCSU Bakersfield 2010-presentCSUN 1995-presentDartmouth 1991-presentDavidson 1987-presentDayton 1988-presentDelaware 1991-presentDelaware St. 1986-presentDenver 1999-presentDePaul 1995-presentDrake 1981-presentDrexel 1981-2002Duke 1981-presentDuquesne 1981-presentEast Carolina 1981-presentEastern Ill. 1981-presentEastern Ky. 1981-presentEastern Mich. 1981-presentEastern Wash. 1981-presentElon 2000-presentETSU 1981-presentEvansville 1988-presentFairfield 1990-presentFairleigh Dickinson 1981-presentFGCU 2009-presentFIU 1987-presentFla. Atlantic 1995-presentFlorida 1984-presentFlorida A&M 1981-presentFlorida St. 1981-presentFordham 1981-presentFresno St. 1981-presentFurman 1981-presentGa. Southern 1985-presentGardner-Webb 2003-presentGeorge Mason 1981-presentGeorge Washington 1981-presentGeorgetown 1995-presentGeorgia 1981-presentGeorgia St. 1985-presentGeorgia Tech 1981-presentGonzaga 1986-presentGrambling 1995-presentGrand Canyon 2017-presentGreen Bay 1992-presentHampton 1996-presentHartford 1984-presentHarvard 1981-presentHawaii 1981-presentHigh Point 2000-presentHofstra 1981-presentHoly Cross 1981-presentHouston 1981-presentHouston Baptist 2011-presentHoward 1981-presentIdaho 1981-presentIdaho St. 1981-presentIllinois 1981-presentIllinois St. 1981-presentUIW 2017-presentIndiana 1981-presentIndiana St. 1981-presentIona 1981-presentIowa 1981-presentIowa St. 1981-presentIUPUI 1998-presentJackson St. 1995-presentJacksonville 1983-presentJacksonville St. 1996-present
James Madison 1984-presentKansas 1981-presentKansas City 1995-presentKansas St. 1981-presentKennesaw St. 2009-presentKent St. 1981-presentKentucky 1981-presentLa Salle 1981-presentLa.-Monroe 1981-presentLafayette 1981-presentLamar 1981-presentLehigh 1981-presentLiberty 1991-presentLipscomb 2000-presentLittle Rock 1991-presentLIU 1993-presentLong Beach St. 1981-presentLouisiana 1981-presentLouisiana Tech 1991-presentLouisville 1981-presentLoyola Chicago 1981-presentLoyola Maryland 1981-presentLMU (CA) 1981-presentLSU 1981-presentMaine 1981-83, 1999-2008Manhattan 1981-presentMarist 1981-presentMarquette 1981-presentMarshall 1981-presentMaryland 1981-presentMassachusetts 1985-2002McNeese 1981-presentMemphis 1981-presentMercer 1985-presentMiami (FL) 2002-presentMiami (OH) 1981-presentMichigan 1981-presentMichigan St. 1981-presentMiddle Tenn. 1981-presentMilwaukee 1990-presentMinnesota 1981-presentMississippi St. 1981-presentMississippi Val. 1995-presentMissouri 1981-presentMissouri St. 1981-presentMonmouth 1984-85Montana 1981-presentMontana St. 1981-presentMorehead St. 1981-presentMorgan St. 1983-presentMurray St. 1983-presentN.C. A&T 1981-presentN.C. Central 2011-presentNavy 1991-presentNC State 1981-presentNebraska 1981-presentNevada 1981-presentNew Hampshire 1996-presentNew Mexico 1981-presentNew Mexico St. 1981-presentNew Orleans 1981-2009, 2012-presentNiagara 1990-presentNicholls St. 1981-presentNJIT 2009-presentNorfolk St. 1998-presentNorth Carolina 1981-presentNorth Dakota 2012-presentNorth Dakota St. 2006-presentNorth Florida 2009-present

Division I Alignment History 47
North Texas 1981-presentNortheastern 1991-presentNorthern Ariz. 1981-presentNorthern Colo. 2007-presentNorthern Ill. 1983-presentNorthwestern 1981-presentNorthWestern Colo. 1987-presentNotre Dame 1981-presentOakland 2000-presentOhio 1981-presentOhio St. 1981-presentOklahoma 1992-presentOle Miss 1981-presentOmaha 2015-presentOral Roberts 1995-presentOregon 1981-presentOregon St. 1981-presentPacific 1981-presentPenn 1987-presentPenn St. 1981-presentPepperdine 1981-presentPittsburgh 1981-presentPortland 1987-presentPortland St. 1999-presentPrairie View 1995-presentPresbyterian 2007-presentPrinceton 1981-presentProvidence 1981-presentPurdue 1981-presentPurdue Fort Wayne 2003-presentQuinnipiac 1999-presentRadford 1987-presentRhode Island 1981-presentRice 1981-presentRider 1981-presentRobert Morris 1987-presentRutgers 1981-presentSacramento St. 1991-presentSacred Heart 2000-presentSaint Francis (PA) 1981-presentSaint Louis 1981-presentSaint Mary’s (CA) 1981-presentSaint Peter’s 1990-presentSam Houston St. 1987-presentSamford 1987-presentSan Diego 1981-presentSan Diego St. 1981-presentSan Francisco 1981-presentSan Jose St. 1981-presentSanta Clara 1981-presentSavannah St. 2003-presentSFA 1987-presentSeattle 2012-presentSeton Hall 1987-presentSiena 1990-presentSIUE 2012-presentSMU 1997-presentSouth Alabama 1981-presentSouth Carolina 1981-presentSouth Carolina St. 1981-presentSouth Dakota 2012-presentSouth Dakota St. 2006-presentSouth Fla. 1981-presentSoutheast Mo. St. 1989-presentSoutheastern La. 1981-presentSouthern California 1981-presentSouthern Ill. 1981-presentSouthern Miss. 1981-presentSouthern U. 1981-present
Southern Utah 2009-presentSt. Bonaventure 1981-99St. Francis Brooklyn 1981-presentSt. John’s (NY) 1994-presentStanford 1981-presentStetson 1981-presentStony Brook 2000-presentSyracuse 1981-presentTCU 1997-presentTemple 1981-presentTennessee 1981-presentTennessee St. 1987-presentTennessee Tech 1981-presentTexas 1981-presentTexas A&M 1981-presentTexas Southern 1995-presentTexas St. 1987-presentTexas Tech 1981-presentToledo 1981-presentTowson 1992-presentTroy 1994-presentTulane 1981-presentTulsa 1981-presentUAB 1982-presentUC Davis 2007-presentUC Irvine 1981-presentUC Riverside 2001-presentUC Santa Barbara 1981-presentUCF 1985-presentUCLA 1981-presentUConn 1981-presentUIC 1981-presentUMass Lowell 2017-presentUMBC 1992-presentUMES 1995-presentUNC Asheville 1987-presentUNC Greensboro 1992-presentUNCW 1984-presentUNI 1981-presentUNLV 1984-85, 1996-presentUSC Upstate 2011-presentUT Arlington 1981-presentUT Martin 1992-presentUtah 1981-presentUtah St. 1981-presentUtah Valley 2009-presentUTEP 1991-presentUTRGV 1987-presentUTSA 1991-presentValparaiso 1981-presentVCU 1981-presentVermont 1982-2002Villanova 1981-presentVirginia 1981-presentVirginia Tech 1981-presentWagner 1992-2008Wake Forest 1997-presentWashington 1981-presentWashington St. 1981-presentWeber St. 1981-presentWest Virginia 1981-presentWestern Caro. 1981-presentWestern Ill. 1981-presentWestern Ky. 1981-presentWestern Mich. 1981-presentWichita St. 1981-presentWilliam & Mary 1981-presentWinthrop 1986-presentWisconsin 1981-present
Wofford 1996-presentWright St. 1991-presentWyoming 1981-presentXavier 1981-presentYale 1987-presentYoungstown St. 1981-present
Teams that are reclassifying to Division I status will remain listed with Division II until they have fully completed the process. Currently, California Baptist and North Alabama are in the reclas-sification process. Provisional members are not listed in divisional alignments until achieving full divisional status.

48

49

50

51

52

53

54

55

56

57

58

59

60

61

62

63

64

65

66