Divisible Good Auctions with Asymmetric Information: An...
54
Divisible Good Auctions with Asymmetric Information: An Experimental Examination ∗ Emmanuel Morales-Camargo College of Business The University of Texas Arlington Orly Sade Jerusalem School of Business Hebrew University of Jerusalem Charles Schnitzlein College of Business Administration University of Central Florida Jaime F. Zender Leeds School of Business University of Colorado at Boulder First Draft: 1/16/10 This Draft: 7/14/12 ∗ We thank the University of New Mexico, New York University, and the Hebrew University of Jerusalem for their financial support of this research. In addition, Sade thanks the Kruger Center at the Hebrew University and the Israel Science Foundation (ISF 480/05). We also thank conference participants at the 2009 International Meeting of the Economic Science Association in Washington DC, the 2009 North American meeting of the Economic Science Association in Tucson Arizona, 2011 meeting of the Financial Management Association, seminar participants at the University of Colorado, Kent Daniel, Atanu Sinha, John Lynch and especially an anonymous referee for valuable comments. Sade thanks the Stern School of Business at NYU and the IE School of Business for support and hospitality . Corresponding author: [email protected], (303) 492-4689.
Transcript of Divisible Good Auctions with Asymmetric Information: An...
Divisible Good Auctions with Asymmetric Information:
An Experimental Examination∗∗∗∗
Emmanuel Morales-Camargo College of Business
The University of Texas Arlington
Orly Sade Jerusalem School of Business
Hebrew University of Jerusalem
Charles Schnitzlein College of Business Administration
University of Central Florida
Jaime F. Zender Leeds School of Business
University of Colorado at Boulder
First Draft: 1/16/10 This Draft: 7/14/12
∗ We thank the University of New Mexico, New York University, and the Hebrew University of Jerusalem for their
financial support of this research. In addition, Sade thanks the Kruger Center at the Hebrew University and the Israel
Science Foundation (ISF 480/05). We also thank conference participants at the 2009 International Meeting of the
Economic Science Association in Washington DC, the 2009 North American meeting of the Economic Science
Association in Tucson Arizona, 2011 meeting of the Financial Management Association, seminar participants at the
University of Colorado, Kent Daniel, Atanu Sinha, John Lynch and especially an anonymous referee for valuable
comments. Sade thanks the Stern School of Business at NYU and the IE School of Business for support and
hospitality . Corresponding author: [email protected], (303) 492-4689.
Divisible Good Auctions with Asymmetric Information:
An Experimental Examination
Abstract
An experimental approach is used to compare bidding behavior and auction performance
in uniform-price and discriminatory auctions when there is incomplete information concerning
the common value of the auctioned good. In a symmetric information environment, the different
auction formats provide the same average revenue. However, when information is asymmetric
the discriminatory auction results in higher average revenue than the uniform-price auction. The
volatility of revenue is higher in the uniform-price auctions in all treatments. The results,
therefore, provide support for the use of the discriminatory format. Subject characteristics and
measures of experience in recent auctions are found to be useful in explaining bidding behavior.
1
I. Introduction
Divisible good or multi-unit auctions are an important market mechanism for a variety of
goods around the world. Most countries use an auction mechanism as the primary market for
their government’s debt. In some countries initial public offerings of equity and/or corporate
bonds are made via auction. Goods ranging from gold to electricity, from drilling rights to
emission permits, are sold in divisible good auctions. The practical importance of these auctions
and the pivotal role effective governmental borrowing has played around the globe in the
struggle to overcome the recent financial crisis serve as reminders of the importance of
developing our understanding of this market mechanism.
The choice over pricing rules in divisible good auctions across different environments
remains an open question. The most commonly used mechanisms are the discriminatory and the
uniform-price auctions. In uniform-price auctions, units of the good are awarded for bids at or
above the market clearing price, and bidders pay the market clearing price for all units awarded.
In discriminatory auctions, units are also awarded for bids at or above the market clearing price,
however the bid price is paid for all units awarded. The divisible good auction literature has
identified a tradeoff between a less severe winner’s curse (in the uniform-price relative to the
discriminatory auction) and collusive-seeming behavior or bid shading (more prominent in the
uniform-price auction) as primary considerations in the revenue comparison for these auctions.
However, theoretical comparison of the standard divisible good auctions is complicated by the
existence of multiple equilibria. Back and Zender (1993) and Wang and Zender (2002) examine
the nature of the equilibria and discuss difficulties associated with the standard comparisons.1
1 Back and Zender (2001) and Kremer and Nyborg (2004) examine features of auctions that may limit or eliminate
certain equilibria in uniform-price auctions however these features are not commonly employed. Recently Rostek,

2
Empirically, there are limited and conflicting results concerning the relative attractiveness of the
different auctions.2 In practice, even in the relatively simple realm of government debt auctions,
different countries use different auctions (see Brenner, Galai, and Sade (2009)).
This study uses a laboratory experiment to compare auction performance and bidding
behavior in uniform-price and discriminatory auctions of a good with a common value, multi-
unit demands, and incomplete (symmetric and asymmetric) information concerning the value of
the auctioned good.3 Previous experimental work has examined divisible good auctions in which
the value of the good is publicly known prior to the auction (e.g. Goswami, Noe, and Rebello,
(1996), Sade Schnitzlein and Zender (2006a) and (2006b)). The theory of divisible good
auctions indicates that the differential susceptibility of the two types of auctions to the strategic
aspects of bidding will be highlighted in treatments when information is symmetric. An
examination of the adjustment for the winner’s curse and the relative ability of these auctions to
extract bidders’ private information will be highlighted when information is asymmetric.
We examine standard measures of auction performance (average revenue, volatility of
revenue, and allocations) and bidding behavior (the elasticity of bid schedules and the adjustment
for the winner’s curse). We also examine how ex ante bidder characteristics such as confidence, Weretka, and Pycia (2010) provide interesting characterizations of the differences between uniform-price and
discriminatory auctions by limiting attention to linear equilibria. The restriction to linear equilibria has, however,
been demonstrated to be problematic (see Wang and Zender (2002)).
2 Compare Simon’s (1992) finding that the discriminatory auctions raised more revenue for the US treasury than the
uniform-price auctions to the results in Umlauf (1993) or Tenorio (1993) who find the reverse in other markets.
Further, Hortacsu and McAdams (2010) find that a change from the discriminatory auction for Turkish treasuries to
a uniform-price auction would not significantly alter revenue.
3 For a review of the experimental economics papers investigating single unit and multiple unit auctions see Kagel
(1997) and Kagel and Levin (2008).
3
gender, and education affect bidding and auction outcomes. Finally, the effect of subject
experience is examined in two ways: the experience gained within a session as well as the effect
of experience in a prior session.
An important difference between the approach taken in this paper and some of the
experimental literature is that the complexity of the space of possible equilibria for the auctions
does not allow us to compare actual behavior to equilibrium bidding behavior (or even a
qualitatively similar family of equilibrium behaviors4). Rather the theory is used to generate
qualitative descriptions of how behaviors under alternate auction pricing rules will differ and the
empirical results examine these descriptions in order to inform the debate concerning the choice
of auction mechanism.5
Our main results are summarized as follows. Consistent with the predicted behavior, on
average, bidders make a greater allowance for the winners curse and submit more elastic bid
schedules in discriminatory auctions than in uniform-price auctions. Under symmetric
information, the evidence suggests that the different auction formats have the same average
revenue. However, when information is asymmetric, the discriminatory auction results in
significantly higher revenue. Furthermore, the volatility of revenue is higher in uniform-price
auctions and there is, on average, no difference in the auction’s ability to extract bidders’ private
information or in the symmetry of allocations across the formats. The findings regarding
revenue volatility, allocations, and the ability of the mechanism to extract bidders’ private
information support the use of discriminatory auctions, particularly when asymmetric
information is an important consideration. 4 See, for example Sade, Schnitzlein, and Zender (2006) (examining Back and Zender (2001)) or Engelbrecht-
Wiggans, List, and Reiley (2006) (examining Engelbrecht-Wiggans and Kahn (1998)).
5 An example of this approach in an asset market context is Bloomfield, O'Hara, and Saar (2005).
4
Subjects become more adept at bidding as they gain experience; both within the
inexperienced sessions (when subjects have had no prior experience) and between the
inexperienced and experienced sessions (when subjects have participated in a prior session).6
Average bidder profit is negative for the inexperienced sessions, however, profits improve over
the inexperienced sessions; i.e., profits are higher in later auctions. Average profit is near zero in
the experienced sessions and there is improvement in per auction profit within the sessions,
particularly under asymmetric information.
We also explore the impact of bidder characteristics and experiential variables within a
session on strategies and outcomes. A growing financial literature documents individual’s
overconfidence about their abilities.7 The “above the average (median)” effect (examined in this
paper) occurs when agents think (or predict) their own abilities are better, on average (median),
than an unbiased statistical estimator would predict. For example, when Svenson (1981) asked
subjects to compare their driving ability to a group of peers, 70–80% of subjects rated
themselves as above the median in ability.8
Before (after) each session, subjects were asked to estimate the probability their
performance would be (was) above the median performance for that session. We are therefore
able to investigate the relation between confidence level, bidding behavior, and performance.
While there is a large amount of dispersion in confidence, on average about half of the subjects
6 For a discussion of learning in experiments see Sunder (1997).
7 This literature relates over-confidence either to “miscalibration” or the “above the average” effect. Miscalibration
refers to the tendency of individuals to overestimate the accuracy of their knowledge.
8 Over confidence has been widely documented in health care (Larwood (1978)), managerial skill (Larwood and
Whittaker (1977)) and business success (Camerer and Lovallo (1999)). In the finance literature Glaser and Weber
(2007) find that overconfidence is associated with a higher level of trading for online investors.
5
identified themselves as being above the median in expected performance, indicating no general
level of overconfidence. However, we find that subject’s estimates of their abilities are not well
calibrated; subjects identifying themselves as being more confident before a session displayed no
difference in performance or bidding behavior relative to those with less confidence.
Given the nature of the uncertainty and information in the experiment, it should not be
the case that past realizations of private signals relative to realized values affect future strategies.
However, in the asymmetric information sessions we find that (controlling for the level of past
profits) subjects who observe signals lower (higher) than the realized value of the good in
previous auctions tend to increase (decrease) the level of their bids relative to their received
signals in later auctions. The random nature of signals and values implies that this adjustment is
inconsistent with the idea that Bayesian behavior is common knowledge amongst the subjects.
Interestingly, this common adaptive behavior leads to lower subsequent profits.
This paper is organized as follows. Section II presents the theoretical foundations and
develops the empirical hypotheses. Section III describes the experiment. Section IV presents the
empirical analysis. Section V concludes. The appendix contains a glossary of variables used in
the statistical tests.9
II. Theory
A. Divisible Good Auction Theory
In divisible good or multi-unit auctions a seller offers multiple units of a good for sale via
an auction. Bidders submit multiple price-quantity pairs as bids. The submission of bid
9 An internet appendix contains the instructions provided to the subjects, illustrations of the computer interface, and
a copy of the post experiment questionnaire.
6
schedules or “demand curves” as bids (rather than a single price) is a complicating aspect of the
theory of bidding in multi-unit auctions.10 An important consequence of this complication is the
presence of multiple equilibria in these auctions. For a given set of parameter values, a
continuum of Nash Equilibria exist, differentiated by the extent to which bidders exert their
strategic advantage or “market power” in each of the equilibria. Wang and Zender (2002)
provide theoretical results based on assumptions that are comparable to the experimental
environment considered here. They study equilibrium bidding behavior in uniform-price and
discriminatory auctions for a perfectly divisible good with a common value. The multi-unit bid
schedules are continuous and the environment is characterized by symmetric and asymmetric
information. Risk neutral and risk averse bidders are considered. The precise nature of bidder
utility functions and the existence and extent of risk averse behavior in the auctions has a
material impact on the functional forms of the equilibria. As these are inherently unobservable,
we cannot compare the functional form of the equilibrium bid schedules with the subject’s
observed behavior. The theory, however, does provide qualitative descriptions of bidding
behavior that can be used to formulate empirical hypotheses.
Wang and Zender (2002) show there is a tension between information revelation and
strategic behavior in the equilibrium bidding strategies in these auctions. The impact of strategic
behavior is most dramatically illustrated by considering their results under symmetric
information. Under symmetric information, in both the uniform-price and the discriminatory
auctions the equilibrium bid schedules have an intercept (the price for zero quantity or the
“level” of the bid schedule) equal to the expected resale value of the good. The elasticity of the
bid schedule determines the extent of the strategic advantage employed by the bidders for each
10 See for example Back and Zender (1993), Ausubel and Cramton (1996), and Wang and Zender (2002).
7
of the possible equilibria. In the discriminatory auction the only equilibrium bid schedules are
perfectly elastic, indicating that no strategic advantage can survive in equilibrium (Wang and
Zender (2002) Cor. 3.2). In the uniform-price auction (for a given set of parameter values), there
are a continuum of equilibria (Wang and Zender (2002) Cor. 3.1). Intuitively, if all bidders in a
uniform-price submit very inelastic bid schedules the aggregate bid schedule will also be very
inelastic and the expected stop-out price11 will be very low. A low expected stop-out price
provides an incentive for a bidder to deviate and attempt to capture additional units of the good.
However, the inelasticity of the aggregate bid schedule implies that any deviation used by a
bidder to capture additional quantity sharply increases the stop-out price, raising the price paid
for all units and causing the deviation to be unprofitable. As a limiting case in the uniform-price
auction it is an equilibrium for bidders to submit perfectly elastic bid schedules. Therefore in
almost all equilibria of the uniform-price auction with symmetric information and risk neutral
bidders, bidder profits are higher and the seller’s revenue is lower than that in the unique
equilibrium of the discriminatory auction (Wang and Zender (2002) Prop. 3.3).
The extreme contrast between the different mechanisms is tempered when bidders are
risk averse; however, the qualitative comparisons remain the same. Risk aversion combined
with uncertainty in the value of the good cause bidders in a discriminatory auction to bid less
aggressively. Proposition 3.6 in Wang and Zender (2002) indicates that due to the greater
strategic advantage available in the equilibria of the uniform-price auction and its effect on
11 The stop-out price is the highest price for which the aggregate quantity bids (at or above that price) equals or
exceeds the available supply.
8
competition, the stop-out price and the seller’s revenue are larger in the discriminatory auction
than in “most”12 equilibria of the uniform-price auction.
With asymmetric information, the nature of the equilibrium bid schedules becomes
richer. The bidders’ strategic advantage in uniform-price auctions is balanced by a greater
adjustment for the winner’s curse in the discriminatory auction. The intercept of the equilibrium
bid schedules in both the uniform-price and the discriminatory auctions equals the expected
value of the auctioned good given a bidder’s private signal and the information concerning other
bidders’ signals revealed by “winning” the “first unit”. In other words, the intercepts of the
equilibrium bid schedules capture the standard notion of the winner’s curse (Wang and Zender
(2002), eq. 19). The elasticity of equilibrium bid schedules is determined by the level of risk
aversion, the extent to which the bidders employ their strategic advantage, and adjustments for
the “champion’s plague” (see Ausubel (1997)). The champion’s plague is an extension of the
winner’s curse in auctions with multi-unit demand (loosely, if winning a unit conveys bad news,
winning many units conveys very bad news). The expected stop-out price and revenue, under
asymmetric information, are influenced by the extent to which bidders employ their strategic
advantage, risk aversion, and the adjustments for the winner’s curse/champion’s plague. There
is, therefore, no generic revenue ranking for the two auctions under asymmetric information.
With asymmetric information, the intercepts of continuous bid schedules reflect the
bidders’ allowance for the winner’s curse. All other points on the bid schedule will, in
equilibrium, also contain adjustments for the champion’s plague. The precise nature of the
12 With a large enough number of bidders, there exist equilibria of the uniform-price auction (if bidders fail to
employ their strategic advantage) for which the expected seller’s revenue and the expected stop-out price is larger in
the uniform-price auction than in the discriminatory auction. However, as under risk neutrality, for the majority of
the parameter space the discriminatory auction generates higher expected revenue.
9
adjustments for larger quantities is specific to the particular equilibrium. However, the
difference between expected resale value given a bidder’s private signal and the intercept of that
bidder’s submitted bid schedule will provide one measure of the bidder’s adjustment for the
winner’s curse. It will, therefore, be interesting to examine how this measure is affected by the
pricing rule, subject’s experience, as well as other subject characteristics and the feedback (gains
or losses) from prior auctions in the session.
B. Empirical Implications
The theory described above provides qualitative descriptions of equilibrium bidding
behavior and auction outcomes that can be tested empirically. In particular, we are able to
examine the nature of individual bid schedules, stop-out prices, revenue, allocations, and the
winner’s curse. The empirical hypotheses include:
1. With symmetric information, relative to resale value, the stop-out price and the seller’s
revenue is expected to be weakly higher in the discriminatory auctions than in the uniform-price
auctions. With asymmetric information, there is no clear prediction concerning the level of
revenue, profits or the stop-out price across the auction formats.
2. In all treatments, the volatility of the seller's revenue is expected to be higher in uniform-price
auctions.
3. In the asymmetric information treatments, the stop-out price and the seller’s revenue should be
positively related to resale value. Because the private signals jointly determine resale value, the
strength of the relation between resale value and revenue/stop-out price measures the auction’s
ability to extract the bidders’ private information.
4. Allocations are expected to be more symmetric in the symmetric information treatments than
in the asymmetric information treatments.
10
5. Bids are expected to be positively related to private signals, therefore, allocations should be
“partially efficient” in the asymmetric information treatments in the sense that the bidders
receiving the highest signals should receive the largest allocations.
6. Reflecting the bidders’ use of their strategic advantage, bid schedules are expected to be more
inelastic in the uniform-price auctions than they are in the discriminatory auctions.
7. In the asymmetric information treatments, the allowance for the winner’s curse is expected to
be positive, increasing in the level of the received signal, and greater in the discriminatory
auctions than in the uniform-price auctions.
III. Experimental Design
In each session, bidders participated in a sequence of auctions for a divisible good. In each
auction, subjects submitted bid schedules at computer terminals. Monetary values were
denominated in an experimental currency referred to as “lab dollars” (L$). Prior to every auction,
the resale value of each unit of the good (called widgets) was determined randomly and subjects
received a signal useful in updating the prior distribution governing value. The signals were either
constrained to be common (symmetric information) or allowed to differ across bidders (asymmetric
information). A bidder’s payoff in an auction was calculated as the sum, over units allocated to that
bidder, of the difference between the resale value and the price paid for that unit. Bidders were not
allowed to communicate before or during the sessions nor were they given information concerning
any other bidder’s bids or allocations.
Each experimental session involved a cohort of five subjects and each cohort participated
in a single experimental treatment. Table 1 summarizes the implementation of the experiment.
The typical session was made up of a sequence of 20 auctions. Senior undergraduate and MBA

11
students from two universities were employed as subjects. All had had at least one course in
finance, as well as courses in statistics and economics.
We examine four treatments differing on two dimensions: pricing mechanism and the
allocation of information. Specifically, we compare uniform-price and discriminatory auctions
in an uncertain, common value environment when bidders have either symmetric or asymmetric
information concerning the value of the good. Seventeen sessions of discriminatory auctions
with symmetric information (10 with inexperienced subjects and 7 with experienced subjects -
subjects who had participated in a session of the same treatment) and eighteen (11 inexperienced
and 7 experienced) sessions of uniform-price auctions with symmetric information were
conducted. Nineteen sessions of discriminatory auctions with asymmetric information (12
inexperienced and 7 experienced) and 21 sessions of uniform-price auctions with asymmetric
information (14 inexperienced and 7 experienced) were conducted.13 To minimize the impact of
subjects who did not fully understand the task, subjects with losses in excess of the initial
endowment in their inexperienced sessions were not invited to participate as experienced
subjects. Analysis shows these subjects did not exhibit learning within the inexperienced
session.14 We expect this type of parsing of the subject pool would occur naturally in the
markets we are ultimately interested in. We stress that our “experienced” subject pool includes
many with losses in the first session. Our intention was to screen based on learning facility
rather than bidding aggressiveness, although we recognize that perfectly disentangling the two
effects is not possible.
13 See Table 1 for further details of the different treatment implementations.
14 Losses were higher in sessions with asymmetric information. To avoid introducing a bias across mechanisms, we
excluded the same number of subjects (9) from the both types of auctions in these sessions,.
12
In each auction, 26 units were offered for sale. Subjects were allowed to bid for as much
or as little of the supply as they desired. Subjects were allowed to submit step function bid
schedules for any integer quantity in the interval [0, 26] at each integer price in the interval
[L$10, L$30]. The aggregate quantity demanded on each bid schedule was limited to 26 units.
Once all subjects had submitted a bid schedule in a given auction, the computer aggregated the
bids and determined the stop-out price for that auction. All bids submitted at prices above the
stop-out price were winning bids and any necessary rationing at the stop-out price was done on a
pro-rata basis (fractional allocations were allocated). In uniform-price auctions the stop-out
price was the unique price paid for all allocated units and in discriminatory auctions the price
paid on all winning bids was the bid price. Auctions were conducted using custom designed
software. The software graphed individual bid schedules as subjects initiated the bidding process
and provided historical information pertaining to each subject’s bidding, matched with the profit
and the portion of total supply received for each prior auction.
In the symmetric information sessions it was public knowledge that all subjects received
the same signal regarding resale value. Resale value was drawn from a discrete, uni-modal
distribution (see Figure 1) over the integers in the interval [L$10, L$30]. The distribution was
symmetric with a mean of L$20 and a standard deviation of L$2.8. For purposes of comparison,
resale value was kept constant auction by auction across pricing rules for each level of
experience (i.e. the same sequence of random draws for resale value was used for all symmetric
information sessions with the same experience level).
Under asymmetric information, prior to each auction each subject observed a private
signal drawn from the integers in the interval [L$18, L$22]. Each signal allowed that bidder to
identify a posterior distribution governing resale value (depicted numerically and graphically in
13
the instructions). In each auction, the resale value of all units was uniquely determined by the
received signals. For each signal received by a subject, the difference between that signal and 20
was computed. Resale value was the sum of these differences across all subjects plus 20. This
implied that each subject had a posterior distribution with the same variance but (typically) a
different mean.15 The distribution of resale value in the symmetric information sessions was
equivalent to the posterior distribution facing a subject receiving a signal of 20 in an asymmetric
information auction (see Figure 1). Again, for purposes of comparison, resale value and the
signals received by subjects auction by auction were held constant across auction types for
sessions with the same level of experience.
At the start of each experimental session, subjects were seated in a conference room, given
30-40 minutes with the written instructions, and an opportunity to ask clarifying questions. The
instructions explained the auction rules, the basis on which cash payments would be made, and
included images introducing the subjects to the software. Subjects were given a quiz to confirm
their understanding of the bidding and allocation rules, and the session only began after all five
subjects were able to get a perfect score on the quiz.
Subjects were not allowed to communicate with each other before or during the sessions,
minimizing the possibility that any collusive behavior can be attributed to subject interaction. In
addition, the layout of the computer lab prevented each subject from seeing the screen of any
other subject. Subjects were informed that such behavior was contrary to the auctions rules,
ensuring that bidding behavior remained private knowledge. To maintain subjects’ privacy, at
15 This structure, therefore, does not generate the difficulties associated with the “wallet game” (see Klemperer
(1998)). However, as noted above there are a vast number of equilibria in the bidding game.
14
the completion of the final auction in each session, each subject’s screen automatically reverted
to a blank screen and subjects were paid individually in a side room.
Subjects were paid a US$5 upfront participation fee as well as “winnings” based on their
total profit. Each subject was given an initial endowment of L$250. Gains and losses from each
auction were added to this endowment. Subjects were allowed to go bankrupt, allowed to bid
when bankrupt, and encouraged to continue in an attempt to recover their losses. To mitigate
extreme behavior in bankruptcy, as in Bloomfield, O’Hara, and Saar (2005), at the beginning of
each session subjects were informed that they would receive an additional random endowment at
the end of the session.16 The exchange rate between L$ and US$ (the currency in which subjects
were paid) was US$ = L$20. Payments to subjects averaged US$19.27. Experimental sessions
with inexperienced subjects lasted an average of approximately 90 minutes while sessions with
experienced subjects lasted an average of 30 - 45 minutes.
IV. Experimental Results
We assess the experimental outcomes along the following dimensions: bidding strategies,
stop-out prices, bidder profits, seller’s revenue, and the nature of allocations.
A. Auction Basics
Summary statistics are provided in Table 2. We report means, medians, and standard
deviations for a variety of variables from the experimental sessions to provide information
concerning bidding behavior and auction outcomes for the four auction types (uniform-price with
symmetric information, discriminatory with symmetric information, uniform-price with
16 The random endowment was drawn from a discrete uniform distribution with a mean of L$100.

15
asymmetric information, and discriminatory with asymmetric information) with inexperienced as
well as experienced subjects. All analysis was performed ignoring the first three auctions in each
session so the results are not clouded by early extreme outcomes or behavior driven by subjects’
unfamiliarity with the experiment.17 To be as conservative as possible regarding standard errors,
when comparing between treatments for auction level variables, we first calculate a mean using
each auction in a session and then use the session means as the unit of observation to perform t-
tests.18 When comparing bidder level variables we first calculate a session level mean for each
bidder and use this mean as the unit of observation for that bidder.
As shown in Table 2, the seller’s average revenue across all treatments is L$538.08, the
average stop-out price is L$20.42, and the average price paid is L$20.70. Comparing these
values with the average resale value, L$20, given 26 units sold in each auction, these figures are
consistent with the average bidder loss of L$4.19. These results indicate that on average, across
all treatments, bids were “too high.”
The “levels” of the bid schedules may be compared using the bidders' highest bid or their
highest bid relative to observed signal. Under asymmetric information, the latter measure
captures the allowance for the winner’s curse. Consistent with the empirical hypotheses, Table 2
shows both measures are significantly higher in the uniform-price than the discriminatory
auctions, for all four treatment categories.
17 Nearly all of the results are robust to alternative rules to establish the cutoff point of the excluded data. The
exception is that increasing the cutoff to the first 5 auctions in each session causes some of the results regarding
learning within a session to become insignificant.
18 For robustness, we also performed a non-parametric randomization test as well as an ANOVA on auction-level
data with cluster robust standard errors. The results are nearly identical and are not reported.

16
Also consistent with the empirical hypotheses, bid schedules in the uniform-price
auctions are more inelastic19 than those in discriminatory auctions. For example, in the uniform-
price auction with symmetric information, the average elasticity of individual bid schedules
measured at the level of the bidders’ signal was -10.24 in the inexperienced sessions and -13.37
in the experienced sessions. For the discriminatory auctions with symmetric information the
average elasticity of the bid schedules is -15.65 in the inexperienced sessions and -18.04 in the
experienced sessions. In the asymmetric information sessions, the differences are smaller but
remain highly significant.
The average maximal demand (total demand per bid schedule) ranges from 23.04 to
24.56, indicating the coverage ratio (aggregate demand at a price of 10 relative to supply) is large
in all auctions. The median maximal demand is always very close to 26, indicating that bidders
commonly bid for the entire supply. Average maximal demand tends to be lower in the
experienced relative to the inexperienced sessions; however this is not true for all types of
auctions nor is the difference economically meaningful.
Subjects tended to submit multiple price/quantity pairs as bids. Across all auctions, the
mean (median) number of distinct prices included in individual bid schedules is 3.76 (3.65). The
average number of prices included in bid schedules is higher in the uniform-price auctions than
19 Formally the bid schedules are step functions. Therefore at any price bid elasticity is not well defined. The
variable elasticity of individual bid schedules at the Bidder's Signal is calculated by dividing the percentage change
in cumulative demand exhibited by that bidder over the percentage change in price, as we move from the bidder's
signal in that auction to the next higher price available on the bid schedule. Whenever the signal in an auction is
outside a bidder's pricing range, this variable is not well defined for that bidder in that auction. The same occurs if
the bidder does not submit any bids that auction.
17
in the discriminatory auctions. Only in the asymmetric information auctions with experienced
subjects is the difference insignificant.
Finally note that, on average, the allocations in the auctions are quite symmetric. The
median number of bidders receiving a positive allocation in the auctions was five and the
average was very close to five. The minimum number of bidders in an auction to receive a
positive allocation is three, and this occurred in only one auction of one session. The average
Herfindahl index of the allocations (the sum across bidders of squared percentage allocations, for
which a value of 0.20 identifies perfect symmetry) indicates more symmetric allocations in the
symmetric information sessions and in the experienced sessions. However, none of the
differences are significant.
The broad averages reported in Table 2 highlight significant differences in bidding
between uniform-price and discriminatory auctions. This is true in the symmetric and
asymmetric information sessions with inexperienced and experienced bidders. This finding
verifies the caution that a change in pricing rules will result in “a radical change in bidding
behavior,” raised by many scholars evaluating the choice over auction pricing mechanisms (see
for example, Kahn, et al. (2001)).
B. Symmetric Information
Table 3 examines the variables of interest in a regression context to control for factors
that may explain bidding and outcomes in the symmetric information auctions. Each column
reports the results of a regression in which the dependent variable is identified in the column
heading. The independent variables are auction type dummy variables, realized resale value, and
the natural logarithm of auction number interacted with the auction type dummies (to capture
18
learning within a session). Regressions 1 – 3 are estimated at the auction level and standard
errors are estimated adjusting for correlation in residuals within the same experimental session.
Regressions 4 – 7 are estimated at the auction-bidder level and standard errors are estimated
adjusting for correlation within the same session and bidder.
The dependent variable in Regression 1 of Table 3 is seller’s revenue. The coefficient
estimates on the auction type dummies, with the test statistics in Panel B, show that at the
beginning of the inexperienced sessions average revenue in the uniform-price (L$576.91) and
discriminatory (L$554.06) auctions are not significantly different. The estimated coefficient on
the interaction between the inexperienced discriminatory dummy and auction number is
significantly negative (-9.94). This indicates that revenue falls significantly throughout the
discriminatory auction session with inexperienced bidders. The estimated coefficient on the
interaction term between the inexperienced uniform-price dummy and auction number (-9.84) is
only slightly smaller in absolute terms but, due to greater volatility, is not significant. Thus,
while revenue in the different auctions was similar at the beginning of the inexperienced
sessions, subjects in discriminatory auctions learn to bid more effectively. With experienced
subjects, revenue is indistinguishable across the auction types at the beginning of the sessions
and there is no significant evidence of learning within the experienced sessions for either type of
auction. For both types of auctions, we see that initially, revenue is significantly lower in the
experienced sessions than in the inexperienced sessions.
These results are mirrored in Regressions 3 (average price paid) and 4 (average bidder
profit) of Table 3. Consider bidder profits (Regression 4). The coefficient estimates on the
auction type dummy variables for inexperienced uniform-price (-23.39) and inexperienced
discriminatory (-18.81) are significantly negative but (see Panel B) not significantly different.

19
The interaction terms (with auction number) show estimated coefficients of 6.90 and 6.92 (both
significant at the 1% level) for the inexperienced uniform-price and inexperienced discriminatory
auctions, respectively. Thus inexperienced bidders lose money in the early auctions but see a
significant increase in profits within the sessions. In both types of auctions, initial bidder profits
are significantly larger for experienced bidders than for inexperienced bidders.
Regression 2 reports results using the stop-out price as the dependent variable. The stop-
out price is initially significantly higher in the inexperienced uniform-price sessions than in the
inexperienced discriminatory sessions (L$22.09 vs. L$19.79) and there is no significant evidence
of learning across the auctions in these sessions. In the experienced sessions, the initial stop-out
price is not statistically different across the auction types and there is again no significant
evidence of learning.
Regressions 5 (intercept) and 6 (elasticity) of Table 3 characterize the bidding strategies.
Consistent with predictions, for both experienced and inexperienced bidders, initially the highest
bids on bid schedules submitted in discriminatory auctions are significantly lower than those on
bid schedules submitted in uniform-price auctions. Comparing the inexperienced to the
experienced sessions, in both types of auctions, the bid schedules submitted by experienced
bidders were at significantly lower levels than those submitted by inexperienced bidders. In the
inexperienced sessions for both types of auctions the highest bids decrease over the session
(significantly so in the discriminatory auctions). There is no significant evidence of change in
the level of the bid schedules across the auctions of the experienced sessions.
The elasticity of bid schedules submitted in the uniform-price and the discriminatory
auctions are initially indistinguishable for both inexperienced and experienced bidders. The
differences in averages reflected in Table 2 are explained by learning within the sessions. In the
20
inexperienced sessions the bid schedules submitted in the discriminatory auctions become
significantly more elastic as the sessions progress. In contrast, in the experienced sessions, in the
uniform-price auctions the bid schedules become significantly more inelastic. Comparing the
inexperienced to the experienced sessions, the bid schedules initially submitted in the
experienced sessions are significantly more elastic than those in the inexperienced sessions.
Finally, as expected with symmetric information, individual allocations (Regression 7)
are very symmetric with no differences across auction types. Naturally, the average allocation is
5.20 in each type of auction. Furthermore, none of the other independent variables has a
significant coefficient estimate. As a robustness test, we estimated the same regression using
squared individual allocations as the dependent variable to highlight differences from the
average. Identical conclusions are reached.
The results show that while bidding behavior differs significantly across auction types
there is little evidence that auction outcomes differ. There is marked improvement in bidding
within the inexperienced sessions and this improvement was greater in the discriminatory
auctions. The results also show that, in general, experienced bidders exhibit bidding behavior
that corresponds with the empirical hypotheses.
C. Asymmetric Information
A main motivation for this study is the examination of the effect of asymmetric
information on bidding behavior and auction outcomes in the different auctions. As discussed
above, theory provides expectations as to the level of the bid schedules. Under symmetric
information, the level or highest price bid on equilibrium bid schedules should be based upon the
(common) conditional expected resale value of the good. In the asymmetric information case,

21
the highest bid price on an individual bid schedule should reflect the expected resale value
conditional on that bidder’s private signal and the information concerning other bidders’ signals
revealed by the realization of that price as the stop-out price. Thus, examining the level of the
bid schedules will allow us to examine adjustments for the winner’s curse. Theory also suggests
that, as under symmetric information, the equilibrium bid schedules submitted in the uniform-
price auctions will be more inelastic than those submitted in the discriminatory auctions. Finally,
we are able to examine the extent to which the pricing mechanisms are able to extract private
information from the subjects and use it in establishing auction prices.
Panel A of Table 4 contains the results of regression analysis using data generated by the
asymmetric information sessions and shows findings similar to those in Tables 2 and 3 regarding
outcomes across the auction types. Inexperienced bidders over-bid on average. Consider bidder
profits for inexperienced bidders. Fitting Regression 4 at the sample mean values of the
statistically significant independent variables, inexperienced bidders in uniform-price auctions
see an average loss of L$7.58 (-58.38 + 20(2.54)) in the first auction. Similarly, inexperienced
bidders in discriminatory auctions see an average loss of L$9.30 (-60.10 + 20(2.54)) in the first
auction of a session. Contrary to the findings under symmetric information, there is only weak
evidence of learning within the inexperienced sessions of the discriminatory auctions and no
significant evidence of learning within the inexperienced sessions of the uniform-price auctions.
Experienced bidders performed better in the asymmetric information treatments. Using
the fitted values as above, we see that with asymmetric information, experienced bidders in the
uniform-price auctions initially lose L$9.30 while those in the discriminatory auctions initially
lose of L$13.84. However, the experienced bidders exhibited significant improvement within
both the uniform-price and discriminatory auction sessions. The estimated coefficients on the
22
interaction between auction type and auction number are 4.43 for the uniform-price and 5.38 for
the discriminatory auctions; both highly significant. The most significant evidence of learning in
the asymmetric information sessions is the improvement in bidder profits across the experienced
sessions. This difference from the symmetric information case may be due to the increased
complexity introduced by asymmetric information. Consistent with these results, Table 2
indicates that revenue and average price paid are significantly lower in the experienced sessions
of both types of auction relative to the corresponding inexperienced sessions.
Within the inexperienced sessions of the asymmetric information treatments, initial
seller’s revenue in the uniform-price and discriminatory auctions are statistically
indistinguishable. In the experienced sessions, initial revenue in the uniform-price auctions is
significantly lower than in the discriminatory auctions. This finding is consistent with the notion
that experienced bidders in the uniform-price auctions exploit more of their strategic advantage.
Support for this conclusion is presented in Table 2 which indicates that inexperienced and
experienced bidders in uniform-price auctions with asymmetric information use significantly
more inelastic bid schedules than do bidders in discriminatory auctions. Furthermore,
Regression 5 shows that controlling for the level of individual signals and learning within the
sessions, the differences in elasticity are initially insignificant, but that experienced bidders in the
uniform-price auctions submit (significantly) more inelastic bid schedules as these sessions
progress while there is no significant change in the elasticity of the bid schedules submitted in
the discriminatory auctions across the experienced sessions.
In Regression 6 of Table 4 the dependent variable is expected resale value conditional on
a bidder’s signal less the highest price bid submitted by that bidder, a measure of the adjustment
for the winner’s curse. For inexperienced subjects, this quantity is initially negative for both

23
types of auctions (-L$1.91 for uniform-price auctions and -L$1.78 for discriminatory auctions,
evaluating the significant regressors at the sample mean), indicating bidders are not making a
proper adjustment for the winner’s curse.20 This regression also shows that inexperienced
subjects in the discriminatory auctions with asymmetric information make significantly positive
adjustments across auctions within the inexperienced sessions. Experienced subjects’ bid
schedules contain, on average, a positive adjustment for the winner’s curse. While the
coefficients on the auction type dummy variables are negative, they are smaller in absolute value
than for inexperienced sessions, resulting in a positive average adjustment for the winner’s curse
(0.36 in uniform price and 0.43 in discriminatory auctions) when we evaluate the significant
regressors (signal and resale value) at their sample means. Finally, there is a significantly
positive coefficient on the signal received by each subject in each auction, indicating that a
relatively larger adjustment for the winner’s curse was associated with higher realized signals.
Regression 7 examines allocations. There are no significant differences in average
allocation across auction type or as sessions progress. Allocations are, however, not symmetric.
The source of the asymmetry is that allocations are strongly responsive to the value of an
individual bidder’s signal (the estimated coefficient is 2.23, significant at the 1% level), holding
resale value constant. Regression 7, therefore, provides support for the “partial efficiency” of the
allocations; a greater portion of the supply goes to bidders with the highest valuation.
Conversely, controlling for signal, there is a significantly (1% level) negative relation (-0.44)
between resale value and allocation. Indicating that, for a given signal received by a bidder, the
higher are the other private signals (in aggregate) the lower is that bidder’s allocation.
20 Their behavior in this respect was similar to that of inexperienced subjects under symmetric information, where
the maximum individual bid was on average higher than L$20.
24
In addition to providing an indication of subjects’ ability to bid effectively in auctions
with asymmetric information, Regressions 2 and 3 of Table 4 provide information concerning the
ability of the auction mechanisms to extract the bidders’ private information. The informational
structure in the market is such that, in the aggregate, the information possessed by the bidders is
perfectly revealing of the resale value. Thus, the extent to which the stop-out price and the
average price paid by bidders in the auctions reflect ex post resale value is a measure of the
mechanism’s ability to extract the bidder’s private information. The estimated coefficients of
0.09 on resale value in the stop-out price regression (2) and 0.08 in the average price paid
regression (3) are both positive and highly significant.
Untabulated robustness results show that for both the stop-out price and the average price
paid regressions, in both the inexperienced and the experienced sessions, estimated coefficients
on interactions between the auction type dummies and resale value are all significantly positive,
indicating that the stop-out price and average price paid are positively related to resale value
regardless of auction type or subject experience. The response of both measures of price to value
is weaker in the inexperienced sessions than in the experienced sessions for both the uniform-
price (0.07 versus 0.10) and the discriminatory auctions (0.07 versus 0.12); however the
difference is significant only for the discriminatory auctions. Holding the level of experience
constant there are no significant differences in these coefficients across auction types. The
evidence indicates that the auctions’ ability to extract bidders’ private information is enhanced
with bidder experience, but that this ability does not differ across pricing rules.
Generally, the results in the asymmetric information sessions show bidding behavior and
auction outcomes from the experienced sessions conform to the empirical hypotheses.
Experienced bidders in both types of auctions make allowances for the winner’s curse.
25
Consistent with the empirical hypotheses, bid schedules submitted in the uniform-price auctions
are more inelastic than those submitted in the discriminatory auctions. Also consistent with the
predictions, with experienced bidders, the seller’s revenue is initially significantly lower in the
uniform-price auctions than in the discriminatory auctions, and there is no significant of learning
across the experienced sessions of either type of auction. Finally, the auction types appear to be
indistinguishable with respect to allocations across the bidders and their abilities to extract
bidders’ private information.
D. Experience
By examining the fixed pool of subjects that participated in both the inexperienced and
the experienced sessions, we can examine the impact of a prior session’s experience on bidding
behavior. Table 5 reports the results of regressions at the bidder level in each auction, holding
the subject pool constant across the inexperienced and the experienced sessions. In Regression
1, where the average price paid is the dependent variable, the estimated coefficients show that
average price paid declines with experience. Panel B indicates that all the comparisons across
experience levels are statistically significant, except for the comparison between inexperienced
and experienced bidders in discriminatory auctions under symmetric information.
In Regression 2 (bidder profits) the coefficient estimates indicate that profits rise with
experience for all types of auctions, however, none of these differences is statistically significant.
These findings are consistent with those reported in Table 4 for the asymmetric information
sessions. Table 3, however, indicated a significant increase in profits from experience under
symmetric information for both auction types.
26
The point estimates of the coefficients in Regressions 3 (elasticity of individual bid
schedules, measured at the level of the bidder’s signal) and 4 (the adjustment for the winner’s
curse) in Table 5 indicate that subjects tended to lower their bid schedules and make them more
elastic as they gain experience. However as Panel B of Table 5 shows, none of the differences of
the level or elasticity of the bid schedules between experienced and inexperienced sessions is
statistically significant.
Similar to the results discussed in Section IV.C, Regression 1 in Table 5 (average price
paid) shows a positive and significant coefficient on resale value, indicating that both auction
mechanisms are able to extract bidder’s private information. An untabulated alternate
specification in which the auction type dummies are interacted with resale value was used to
examine the degree to which the different mechanisms are able to extract bidder’s private
information. The results are numerically identical to those reported in Section IV.C again
indicating that the uniform-price and discriminatory auctions are equivalent in their ability to
extract bidders’ private information and that this ability is enhanced with bidder experience.
E. Subject Characteristics
Panel A of Table 6 presents descriptive statistics for subject characteristics. 24% of
subjects were graduate students and 69% were male. As the tests of differences in means and
medians show, there is no significance difference in the proportion of graduate-to-undergraduate
students between any of the treatments. With the exception of our inexperienced cohorts with
symmetric information, in which a significantly higher percentage of males participated in the
uniform-price auctions than in the discriminatory auctions, the same assertion can be made about
the proportion of male-to-female subjects.
27
We also solicited indications of pre and post experiment confidence levels from each
subject. Pre experiment confidence is a subject's assessment, prior to a session, of the
probability that his/her performance will be above the median of subjects participating in that
session. Post experiment confidence is the subject’s assessment of this probability after the
session has been completed.
The average level of pre experiment confidence of inexperienced subjects (initial
confidence) is 51%, which is not significantly different from the neutral prediction of 50%. If
we restrict the sample to subjects that participate in two sessions, the confidence measure prior to
their inexperienced session averages 50.2%. We therefore do not find any indication of
systematic over or under pre confidence in inexperienced subjects.
Although initial confidence is neutral, there is substantial variation across subjects; the
standard deviation equals 0.21. Consistent with many other studies,21 initial confidence in male
subjects (53.1%) is significantly higher than that in female subjects (45.5%, p=0.03). There are
no significant differences in initial confidence by student type (graduate vs. undergraduate),
experiment location (experiments were conducted at two universities), mechanism (uniform
price vs. discriminatory), or information structure (symmetric vs. asymmetric).22
F. Subject Characteristics and Bidding Behavior
21 Croson and Gneezy (2009) is a general survey of experimental studies of gender differences in risk and
competitive preferences. They cite numerous studies consistent with this result.
22 Moore and Cain (2007) provide evidence that people believe they are below average in difficult skill-based tasks.
The lack of a significant difference in initial confidence by mechanism or information structure is therefore indirect
evidence that subjects do not perceive the treatments to differ in difficulty.
28
Panel B of Table 6 presents the results of regressions, similar to those in Table 5, based
on data gathered from all subjects. We include subject characteristics (male, graduate student)
and experiential explanatory variables to examine the extent to which these variables affect
bidding behavior. Previous Cumulative Profits measures, for each auction, the cumulative profit
earned by that subject in all prior auctions of the session. Negative Cash Balance Dummy is a
variable that takes the value one if the subject’s cash balance at the end of the previous auction is
negative. Signal Extremity measures the extremity of the bidder’s signal accumulated over the
last three auctions. For each bidder in each auction, signal extremity represents the difference
between the realized resale value and the received signal. Positive values of this variable
indicate the subject has, on average, observed signals below the realized resale value in recent
auctions.23 Finally, we include pre experiment confidence as an explanatory variable.
Given the substantial variation in initial confidence we first examine whether subjects are
well-calibrated; whether confidence prior to a session predicts performance. Regressions 1 – 4
in Table 6 Panel B indicate that this is not the case. The dependent variables are the average
price paid, bidder profits, the elasticity of bid schedules, and the expected resale value
conditional on the observed signal less the highest bid price. Confidence is an insignificant
explanatory variable in regressions 1-4; more confident bidders do not pay a significantly lower
price nor do they earn significantly higher profits. The estimated coefficients indicate that more
confident bidders tend to bid more aggressively (less of an adjustment for the winner’s curse and
more inelastic bid schedules), however, the estimates are not statistically significant.
23 Using signal extremity for the last auction or the cumulative signal extremity for all previous auctions provides
the same qualitative results.
29
Examining bidder characteristics, the significantly negative coefficient (-1.065) on
Dummy Male in Regression 2, indicates that male subjects experience lower profits relative to
female. Regressions 1, 3, and 4 however, indicate that the average price paid and the level and
elasticity of the bid schedules do not differ by gender. This contradiction may be explained by
males’ response to previous profits. The significant coefficients in Regressions 1, 2 and 4, for
the interaction between the Dummy Male and Previous Cumulative Profits suggests that after
male subjects realize greater cumulative profits, they bid more aggressively, submitting bid
schedules with smaller adjustments for the winner’s curse and ultimately paying higher average
prices and realizing lower profits. An alternative hypothesis is that male subjects are less risk
averse than are female subjects. Bidders that are less risk averse will, all else equal, submit bid
schedules at a higher level than will more risk averse bidders. The coefficient in regression 4 on
Dummy Male is indeed negative but insignificant.
The estimated coefficient on Dummy Graduate Student in Regression 4 shows that
graduate students tend to make larger adjustments for the winner’s curse than undergraduate
students. This could be a reflection of a greater understanding of the auction environment or a
reflection of a greater level of risk aversion. As Regression 2 shows, the difference in these
adjustments does not translate into higher profits. The significant coefficient estimate in
Regression 2 for the interaction between Dummy Graduate Student and Previous Cumulative
Profits suggests that as graduate students accumulate greater profits, they tend to realize lower
profits in subsequent auctions relative to undergraduate students. This may indicate that
Graduate students become overly cautious as they act to protect existing gains.
The experiential variables, Previous Cumulative Profit and Signal Extremity, have
significant impacts on subsequent bidding and performance. Table 6B indicates that, on average,
30
as bidders achieve higher cumulative profits they bid less aggressively, making greater
adjustments for the winner’s curse and submitting more elastic bid schedules. These adjustments
have a significantly positive impact on subsequent profits.
Signal Extremity measures the extent to which a subject has observed signals that were
not equal to the realized resale value in the three most recent auctions. Under the informational
structure of this experiment, if Bayesian updating on the part of all bidders is common
knowledge, subjects would not alter their bidding strategies based on the observed relation
between their signal and the realized resale value.
Signal extremity is, however, a significant explanatory variable for the level and elasticity
of subsequent bid schedules, as well as for subsequent realizations of average price paid and
bidder profits. Regressions 1 through 4 in Table 6B show, on average, as subjects observe
signals below (above) the realized resale value in recent auctions, they tend to bid more (less)
aggressively, raising (lowering) the level of their bid schedules and making them more (less)
inelastic. Bidder profits have a significantly negative relation to signal extremity, suggesting this
adaptation is self-defeating. The observed change could be due to subjects’ attempts to
anticipate the behavior of other bidders in subsequent auctions. However it seems more likely
that the response to past profitability of strategies is a more direct way to identify that type of
updating. Alternatively, such an adjustment in strategies would make sense in a real-world
context in which bidders are attempting to update their strategies based on signals of unknown
precision. Finally, the explanation for this behavior may be that subjects do not understand the
nature of the uncertainty in the experiment and there is consequently a failure in Bayesian
updating following observations of signals and resale values that appear consistently different.
31
Finally Regression 5 in Table 6B examines post experiment confidence. The results
indicate that post experiment confidence is positively related to pre experiment confidence;
consistent with an updating process. While cumulative profits are not significantly related to
post experiment confidence, the estimated coefficient on the negative cash dummy indicates that
if a subject ends the experiment with negative profits there is a significant downward adjustment
in confidence.
V. Conclusion
This paper presents the results of an experiment in decision making under uncertainty. In
each experimental session subjects participated in a series of auctions for a divisible good in
which the common value of the good was uncertain. In some sessions it was common
knowledge that all subjects received the same information concerning resale value, while in other
sessions subjects received different signals of resale value. We find that the strategies employed
by the subjects in our experiments qualitatively match the equilibrium strategies suggested by the
theory of divisible good auctions.
The evidence from the experienced sessions provides support for the use of the
discriminatory auction, particularly when information is distributed asymmetrically across
bidders. With experienced bidders, average revenue is not significantly different across the two
auction types when information is symmetric but is significantly higher in the discriminatory
auction when information is asymmetric. More importantly, in all treatments, the volatility of
revenue is lower in discriminatory auctions, and there is no significant difference in allocations
or the ability of the auction to extract the bidders’ private information across the auction types.
These findings are consistent with Brenner, Galai, and Sade’s (2009) result that the use of the
32
uniform-price auction as a mechanism for selling government debt is most prevalent in countries
with highly developed financial markets. Our support for the use of the discriminatory auction is
contrary to the conclusions of Friedman (1960), McAfee and McMillan (1987), and Milgrom
(1989) that the uniform-price auction would result in higher revenue.
Subjects become more adept at bidding in the auctions as they gain experience, both
within the inexperienced sessions and between the inexperienced and the experienced sessions.
For example, bidder profits are negative on average over the inexperienced sessions. This
improves over the inexperienced sessions, as profits are higher in the later auctions of these
sessions than they are in the earlier auctions. In turn, average profits are near zero or marginally
positive in the experienced sessions. In accord with empirical hypotheses, experienced bidders
submit more elastic bid schedules in discriminatory auctions than in the corresponding uniform-
price auctions.
We also explore the impact of bidder characteristics and experiential variables on bidder
strategies and auction outcomes. Most interestingly, higher previous profits appear to promote
more cautious bidding and higher subsequent profits. Furthermore, subjects in the asymmetric
information sessions that observe signals lower than the realized resale value in previous
auctions tend to increase the level of their bids relative to their received signals in future
auctions. The random nature of signals and values in the experiment makes this adaptation in
strategies something of a puzzle.
A topic for future research is to examine the impact of an increase in the number of
bidders on these results. The auction literature has identified encouraging bidder participation as
a top priority in auction design and this is an important and interesting issue that seems ideally
suited for investigation within the experimental laboratory.

33
Appendix – Variable Definitions
Glossary of variables used in the statistical tests conducted throughout the study, from Table 2
through Table 6; presented in alphabetical order.
Asym_DP_Exp is a dummy variable that takes a value of one when a discriminatory price
auction is conducted with experienced subjects in an asymmetric information environment and
zero otherwise. Subjects are deemed to be experienced if they have all at least participated
previously in one auction under identical treatment settings.
Asym_DP_Inexp is a dummy variable that takes a value of one when a discriminatory price
auction is conducted with inexperienced subjects in an asymmetric information environment and
zero otherwise.
Asym_UP_Exp is a dummy variable that takes a value of one when a uniform price auction is
conducted with experienced subjects in an asymmetric information environment and zero
otherwise. Subjects are deemed to be experienced if they have all at least participated previously
in one auction under identical treatment settings.
Asym_UP_Inexp is a dummy variable that takes a value of one when a uniform price auction is
conducted with inexperienced subjects in an asymmetric information environment and zero
otherwise.
34
Auction is a variable used to control for inter-session learning effects and is given by the natural
logarithm of the auction number within a session, which ranges from 1 to 20.
Average elasticity of individual subjects' bid schedule per auction is obtained by first
calculating the ratio of the percentage change in cumulative demand exhibited by an individual
bidder over the percentage change in price, as we move up the price grid from the lowest price at
which the bidder submitted a bid to the highest price at which the bidder submitted a bid, and
then averaging those ratios over the number of prices in the observed bid-range. In any given
auction, this variable is not well defined for bidders who did not submit any bids that auction.
Average price paid per widget per auction equals seller revenue per auction divided by 26, the
number of units auctioned.
Change in Pre Experiment Confidence measures, for subjects who participated in more than
one session, the difference between Pre Experiment Confidence (i.e. Pre-Probability) before the
second session and Pre Experiment Confidence before the first session.
DP_Exp is a dummy variable that takes a value of one when a discriminatory price auction is
conducted with experienced subjects and zero otherwise. Subjects are deemed to be experienced
if they have all at least participated previously in one auction under identical treatment settings.
DP_Inexp is a dummy variable that takes a value of one when a discriminatory price auction is
conducted with inexperienced subjects and zero otherwise.

35
Dummy Graduate Student is a variable that takes a value of one if the subject participating in a
session is a graduate student and zero otherwise.
Dummy Male Student is a variable that takes a value of one if the subject participating in a
session is a male student and zero otherwise.
Elasticity of individual bid schedules at the Bidder's Signal per Auction is obtained for each
bidder in an auction by dividing the percentage change in cumulative demand exhibited by that
bidder over the percentage change in price, as we move from the bidder's signal in that auction to
the next higher price available in the price grid. Whenever the signal in an auction is outside a
bidder's pricing range, this variable is not well defined for that bidder in that auction. The same
occurs if the bidder does not submit any bids that auction.
Expected resale value conditional on a bidder's signal less the highest price bid by that
bidder in the auction is just the signal received by a bidder in an auction minus the highest price
bid by that bidder in the auction, as defined below. The signal for all auctions conducted under
the symmetric information setting is assumed to be L$20, the unconditional expected resale
value of the widgets. Whenever a bidder decided not to acquire a signal in an asymmetric
information auction, the signal was assumed to be L$20. For those bidders who decided not to
participate in an auction or submitted no bids in an auction, the variable is undefined.

36
Herfindah index of allocations (per auction) is computed by adding the squared of the
percentage of the total supply of widgets that each of the bidders obtained in an auction.
Highest price bid by individual bidders in an auction shows the highest price in the grid
(from L$10 to L$21) at which each individual bidder submitted a bid in an auction. For those
bidders who decided not to participate in an auction, or submitted no bids in an auction, the
variable is not well defined.
Individual bidder allocation per auction represents the number of widgets each individual
bidder was allotted in each auction.
Individual bidder profit per auction is the laboratory dollar value of the difference between an
individual bidder's ending balance (without incorporating early show up fee and the final random
adjustment) and the beginning balance of L$250. That is, individual bidder profit per auction
captures exclusively the trading profits an individual bidder was able to generate.
Negative Cash Balance Dummy is a dummy variable that takes the value one if the subject’s
cash balance at the end of the previous auction is negative and zero otherwise.
Number of bidders with positive allocation per auction shows how many bidders participated
in an auction and succeeded in obtaining any amount of widgets (even a fraction of a widget).
37
Number of prices at which individual bidders submitted bids in an auction shows the
number of different prices at which each individual bidder in an auction submitted bids for any
positive amount of widgets. Whenever a bidder submitted a bid for multiple widgets at one price,
that price is only counted once.
Payment Rank measures the performance rank each bidder obtained in a given session. The
ranks are measured from 1 to 5, where a rank of 1 is assigned to the top performing bidder in a
session and a rank of 5 is assigned to the worse performing bidder in a session.
Performance Payment is the laboratory dollar payment each subject obtained in a session,
excluding the early shop up fee, and the initial (L$250) and final random endowments. That is,
this variable measures only the trading profits each bidder generated during a session.
Post-Probability (Post Experiment Confidence) is the subject's assessment once an
experimental session has concluded of the probability (%) that his/her performance will be above
the median (top 50%) of all those subjects who participated in that experimental session.
Pre-Probability (Pre Experiment Confidence) is the subject's assessment before an
experimental session begins of the probability (%) that his/her performance will be above the
median (top 50%) of all those subjects who participate in that experimental session.
Previous Cumulative Profits measures, for each bidder in each auction, the cumulative profit
earned by that bidder in all prior auctions of that session.

38
Prior Experience Dummy is a dummy variable that takes a value of one when a session is
conducted with experienced subjects and zero otherwise.
Resale Value is the common, random liquidation value of all widgets purchased by bidders in an
auction. For each auction, this resale value is randomly drawn from a discrete distribution with a
support in the interval [L$10, L$30], with increments of L$1. The distribution is symmetric with
a mean of L$20 and a standard deviation of L$2.8.
Seller’s revenue per auction is the sum of the revenue collected (in L$) by the seller across the
26 widgets auctioned.
Signal represents the informative signal (an integer ranging from L$18 to L$22) concerning the
resale value of the widgets that each bidder in an asymmetric environment auction receives
before each auction. While in the asymmetric information auctions each bidder received a
(potentially) different, but equally informative signal, in the symmetric information sessions it
was common knowledge that all subjects received the same signal (namely L$20).
Signal Extremity measures, for each bidder and each auction in a session (beginning with
Auction 4), the extremity of the bidder’s signal accumulated over the last three auctions. For
each auction, the extremity of the bidder’s signal represents the difference between the realized
resale value of the widgets and the signal received by the subject about the widgets’ resale value

39
that auction. Positive values of this variable indicate the extent to which the subject has, on
average, observed signals below the realized resale value in the recent sequence of auctions.
Stop-out price per auction is the highest price (in L$) at which the cumulative demand for
widgets in an auction equals or exceeds the 26 widgets auctioned.
Symmetric Information Dummy is a dummy variable that takes a value of one when an auction
is conducted within a symmetric information environment and zero otherwise.
Symm_DP_Exp is a dummy variable that takes a value of one when a discriminatory price
auction is conducted with experienced subjects in a symmetric information environment and zero
otherwise. Subjects are deemed to be experienced if they have all at least participated previously
in one auction under identical treatment settings.
Symm_DP_Inexp is a dummy variable that takes a value of one when a discriminatory price
auction is conducted with inexperienced subjects in a symmetric information environment and
zero otherwise.
Symm_UP_Exp is a dummy variable that takes a value of one when a uniform price auction is
conducted with experienced subjects in a symmetric information environment and zero
otherwise. Subjects are deemed to be experienced if they have all at least participated previously
in one auction under identical treatment settings.
40
Symm_UP_Inexp is a dummy variable that takes a value of one when a uniform price auction is
conducted with inexperienced subjects in a symmetric information environment and zero
otherwise.
Units bid for by individual bidders in an auction shows the number of widgets each individual
bidder requested in an auction. Since each bidder could request anywhere between zero and 26
widgets, the variable could take any value in between those two figures, including zero and 26.
Uniform Price Dummy is a dummy variable that takes a value of one when an auction is
conducted using a uniform price mechanism and zero otherwise.
UP_Exp is a dummy variable that takes a value of one when a uniform price auction is
conducted with experienced subjects and zero otherwise. Subjects are deemed to be experienced
if they have all at least participated previously in one auction under identical treatment settings.
UP_Inexp is a dummy variable that takes a value of one when a uniform price auction is
conducted with inexperienced subjects and zero otherwise.
41
References
Ausubel, L. “An Efficient Ascending-Bid Auction for Multiple Objects.” (2004), The American
Economic Review, 94(5), 1452-1475.
Ausubel, L.M., P. Cramton, M. Pycia, M. Rostek, and M. Weretka. “Demand Reduction,
Inefficiency and Revenues in Multi-Unit Auctions.” (2011), University of Wisconsin working
paper available at www.ssc.wisc.edu/~mrostek/UniformvsDiscriminatory.pdf.
Back, K., and J. F. Zender. “Auctions of Divisible Goods: On the Rationale for the Treasury
Experiment.” Review of Financial Studies, 6 (1993), 733-764.
Back, K. and J. F. Zender. “Auctions of Divisible Goods with Endogenous Supply.” Economics
Letters, 73 (2001), 29-34.
Bloomfield, R., M. O'Hara, and G. Saar. "The "Make or Take" Decision in an Electronic Market:
Evidence on the Evolution of Liquidity." Journal of Financial Economics, 75 (2005), 165-199.
Brenner M, D Galai and O. Sade. "Sovereign debt auctions: Uniform or discriminatory.” Journal
of Monetary Economics, 56 (2009), 267-274.
Camerer C and Lovallo D. “Overconfidence and Excess Entry: An Experimental Approach.” The
American Economic Review, 89 (1999), 306-318.
42
Croson, Rachel and Uri Gneezy. "Gender Differences in Preferences." Journal of Economic
Literature, 47 (2009), 448–74
Engelbrecht-Wiggans, R. and C. Kahn. “Multi-Unit Auctions with Uniform Prices.” Economic
Theory 12 (1998), 227-258.
Engelbrecht-Wiggans, R., J. A. List, and D. H. Reiley. Demand Reductin in Multi-Unit Auctions
with Varying Numbers of Bidders: Theory and Evidence from a Field Experiment.” International
Economic Review 47 (2006), 203-231.
Friedman, M. “A Program for Monetary Stability.” Fordham University Press, New York (1960).
Goswami, G., T. Noe, and M. Rebello. “Collusion in Uniform-Price Auctions: Experimental
Evidence and Implications for Treasury Auctions.” Review of Financial Studies, 9 (1996), 757-
785.
Glaser, M and Weber, M. “Overconfidence and Trading Volume.” Geneva Risk and Insurance
Review 32(1) (2007), 1-36.
Hortacsu, A. and D. McAdams. “Mechanism Choice and Strategic Bidding in Divisible Good
Auctions: An Empirical Analysis of the Turkish Treasury Auction Market.” Journal of Political
Economy, (2010), 118 (5), 833-865.

43
Kagel, J. “Auctions: A Survey of Experimental Research.” In J. Kagel and A. Roth, ed.: The
Handbook of Experimental Economics, Princeton University Press (1997).
Kagel, J. and R. Levin. “Auctions: A Survey of Experimental Research 1995 – 2008.” In J.
Kagel and A. Roth, eds. The Handbook of Experimental Economics, Volume II, Princeton
University Press (2008).
Kahn, A, P. Cramton, R. Porter, and R. Tabors. “Uniform Pricing or Pay-as-Bid Pricing: A
Dilemma for California and Beyond.” The Electricity Journal, 14 (2001), 70 – 79.
Klemperer, P. “Auctions with Almost Common Values: The ‘Wallet Game” and its
Applications.” European Economic Review 42 (1998), 757-769.
Kremer, I., and K. Nyborg. “Underpricing and Market Power in Uniform-Price Auctions.”
Review of Financial Studies 17 (2004), 849-877.
Larwood, L. “Swine flu: A field study of self-serving biases.” Journal of Applied Social
Psychology, 8 (1978), 283-289.
Larwood L., and W. Whittaker. “Managerial myopia: self-serving biases in organizational
planning.” Journal of Applied Psychology, 62 (1977), 194–198.
44
McAfee, R. P., and J. McMillan. “Auctions and Bidding.” Journal of Economic Literature, 30
(1987), 699 – 738.
Milgrom, P. “Auctions and Bidding: A Primer.” Journal of Economic Perspectives, 3 (1989), 3 –
22.
Moore, Don A. and D. M. Cain. "Overconfidence and Underconfidence: When and why people
underestimate (and overestimate) the competition." Organizational Behavior and Human
Decision Processes, 103 (2007), 197-213.
Rostek, M., M. Weretka, and M. Pycia. “Design of Divisible Good Markets.” working paper,
University of Wisconsin, (2010).
Sade, O., C. Schnitzlein, and J. F. Zender. “Competition and Cooperation in Divisible Good
Auctions: An Experimental Examination.” Review of Financial Studies, 19 (2006a), 195 – 235.
Sade, O., C. Schnitzlein, and J. F. Zender. “When Less (Potential Demand) Is More (Revenue):
Asymmetric Bidding Capacities in Divisible Good Auctions.” Review of Finance, 10 (2006b),
389 – 416.
Simon, D. “The Treasury’s Experiment with Single-Price Auctions in the Mid-1970s: Winner’s
or Taxpayer’s Curse?” working paper, Federal Reserve Board of Governors, (1992).

45
Sunder, S. “Experimental Asset Markets: A Survey.” In J. Kagel and A. Roth, eds. The
Handbook of Experimental Economics, Princeton University Press (1997).
Svenson O. “Are We All Less Risky and More Skilful Than Our Fellow Drivers?” Acta
Psychologica, 47 (1981), 143 - 48.
Tenorio, R. “Revenue-Equivalence and Bidding Behavior in a Multi-Unit Auction Market: An
Empirical Analysis.” Review of Economics and Statistics, 75 (1993), 302-314.
Umlauf, S., 1993, ‘‘An Empirical Study of the Mexican Treasury Bill Auction,’’ Journal of
Financial Economics, 33 (1993), 313–340.
Wang, J. J. D., and J. F. Zender. “Auctioning Divisible Goods.” Economic Theory, 19 (2002),
673-705.
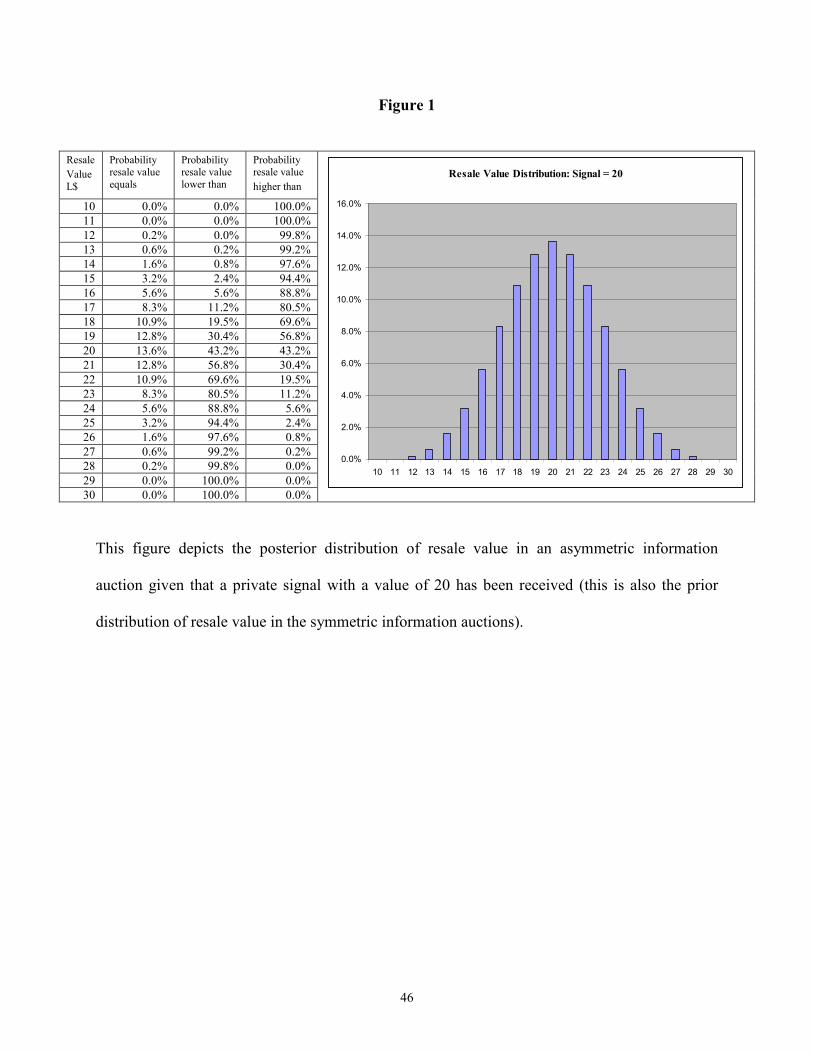
46
Figure 1
This figure depicts the posterior distribution of resale value in an asymmetric information
auction given that a private signal with a value of 20 has been received (this is also the prior
distribution of resale value in the symmetric information auctions).
Resale
Value L$
Probability resale value equals
Probability resale value lower than
Probability resale value
higher than
10 0.0% 0.0% 100.0%
11 0.0% 0.0% 100.0%
12 0.2% 0.0% 99.8%
13 0.6% 0.2% 99.2%
14 1.6% 0.8% 97.6%
15 3.2% 2.4% 94.4%
16 5.6% 5.6% 88.8%
17 8.3% 11.2% 80.5%
18 10.9% 19.5% 69.6%
19 12.8% 30.4% 56.8%
20 13.6% 43.2% 43.2%
21 12.8% 56.8% 30.4%
22 10.9% 69.6% 19.5%
23 8.3% 80.5% 11.2%
24 5.6% 88.8% 5.6%
25 3.2% 94.4% 2.4%
26 1.6% 97.6% 0.8%
27 0.6% 99.2% 0.2%
28 0.2% 99.8% 0.0%
29 0.0% 100.0% 0.0%
30 0.0% 100.0% 0.0%
Resale Value Distribution: Signal = 20
0.0%
2.0%
4.0%
6.0%
8.0%
10.0%
12.0%
14.0%
16.0%
10 11 12 13 14 15 16 17 18 19 20 21 22 23 24 25 26 27 28 29 30
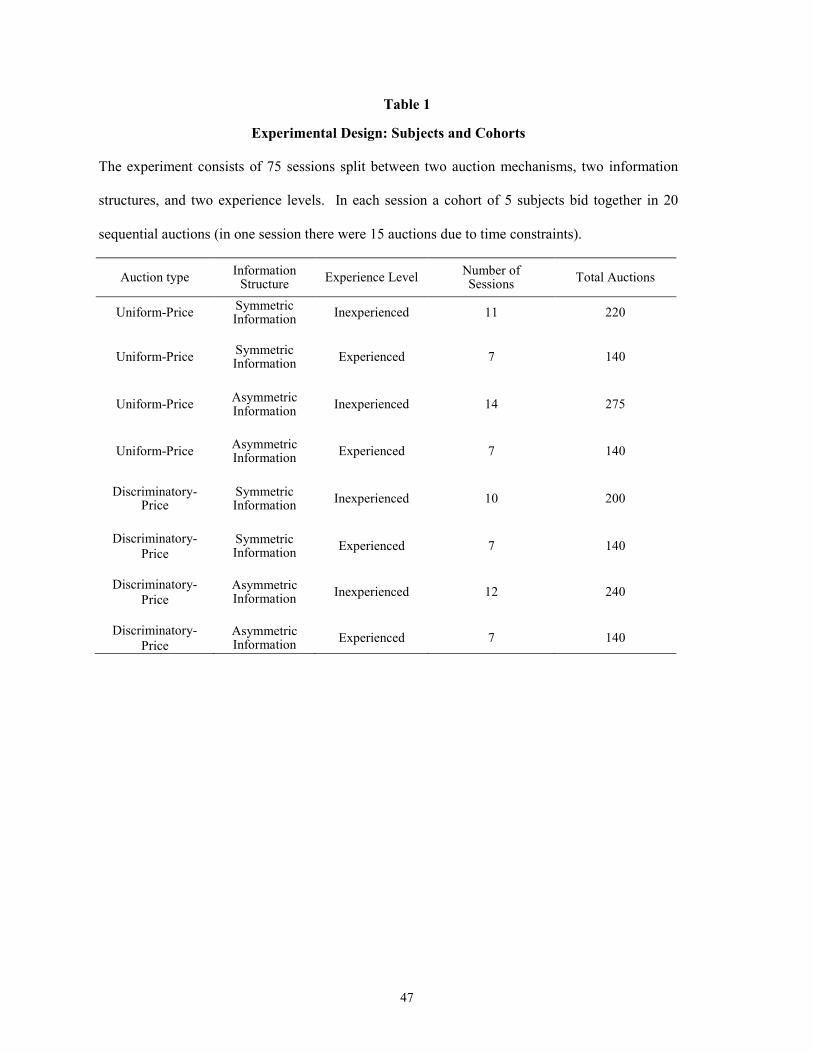
47
Table 1
Auction type Information
Structure Experience Level
Number of Sessions
Total Auctions
Uniform-Price Symmetric Information
Inexperienced 11 220
Uniform-Price Symmetric Information
Experienced 7 140
Uniform-Price Asymmetric Information
Inexperienced 14 275
Uniform-Price Asymmetric Information
Experienced 7 140
Discriminatory-Price
Symmetric Information
Inexperienced 10 200
Discriminatory-Price
Symmetric Information
Experienced 7 140
Discriminatory-Price
Asymmetric Information
Inexperienced 12 240
Discriminatory-Price
Asymmetric Information
Experienced 7 140
Experimental Design: Subjects and Cohorts
The experiment consists of 75 sessions split between two auction mechanisms, two information
structures, and two experience levels. In each session a cohort of 5 subjects bid together in 20
sequential auctions (in one session there were 15 auctions due to time constraints).
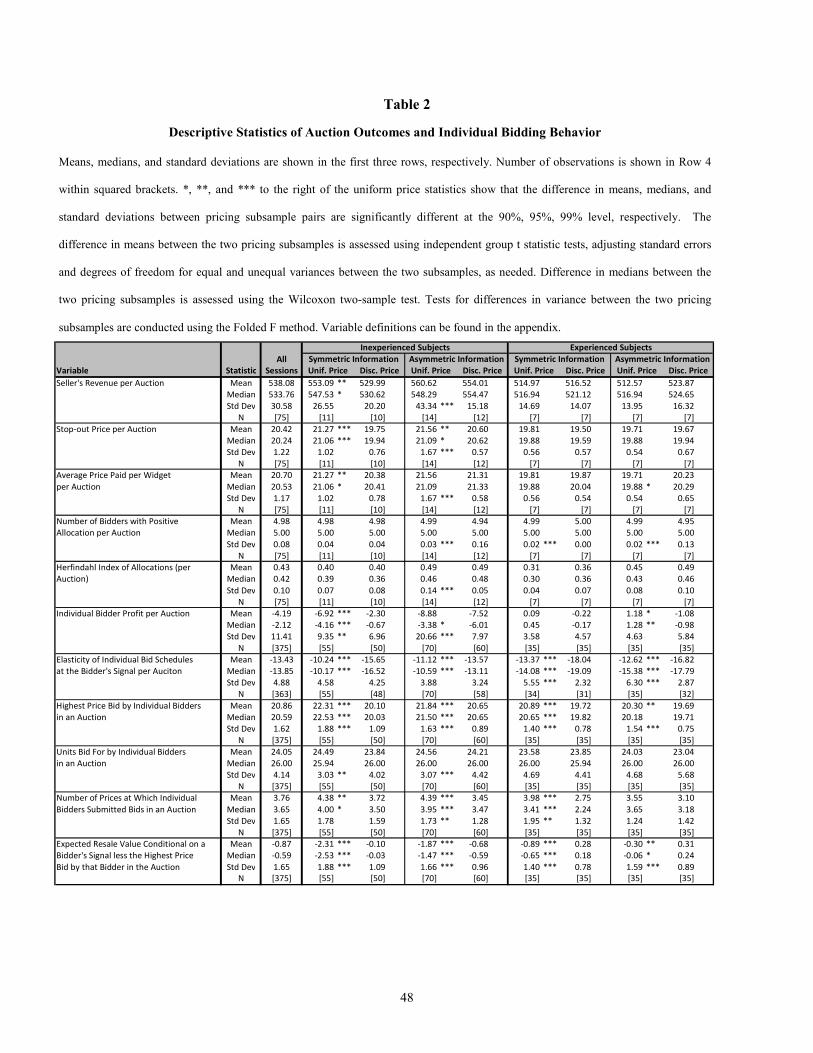
48
Table 2
Descriptive Statistics of Auction Outcomes and Individual Bidding Behavior
Means, medians, and standard deviations are shown in the first three rows, respectively. Number of observations is shown in Row 4
within squared brackets. *, **, and *** to the right of the uniform price statistics show that the difference in means, medians, and
standard deviations between pricing subsample pairs are significantly different at the 90%, 95%, 99% level, respectively. The
difference in means between the two pricing subsamples is assessed using independent group t statistic tests, adjusting standard errors
and degrees of freedom for equal and unequal variances between the two subsamples, as needed. Difference in medians between the
two pricing subsamples is assessed using the Wilcoxon two-sample test. Tests for differences in variance between the two pricing
subsamples are conducted using the Folded F method. Variable definitions can be found in the appendix.
All
Variable Statistic Sessions
Seller's Revenue per Auction Mean 538.08 553.09 ** 529.99 560.62 554.01 514.97 516.52 512.57 523.87
Median 533.76 547.53 * 530.62 548.29 554.47 516.94 521.12 516.94 524.65
Std Dev 30.58 26.55 20.20 43.34 *** 15.18 14.69 14.07 13.95 16.32
N [75] [11] [10] [14] [12] [7] [7] [7] [7]
Stop-out Price per Auction Mean 20.42 21.27 *** 19.75 21.56 ** 20.60 19.81 19.50 19.71 19.67
Median 20.24 21.06 *** 19.94 21.09 * 20.62 19.88 19.59 19.88 19.94
Std Dev 1.22 1.02 0.76 1.67 *** 0.57 0.56 0.57 0.54 0.67
N [75] [11] [10] [14] [12] [7] [7] [7] [7]
Average Price Paid per Widget Mean 20.70 21.27 ** 20.38 21.56 21.31 19.81 19.87 19.71 20.23
per Auction Median 20.53 21.06 * 20.41 21.09 21.33 19.88 20.04 19.88 * 20.29
Std Dev 1.17 1.02 0.78 1.67 *** 0.58 0.56 0.54 0.54 0.65
N [75] [11] [10] [14] [12] [7] [7] [7] [7]
Number of Bidders with Positive Mean 4.98 4.98 4.98 4.99 4.94 4.99 5.00 4.99 4.95
Allocation per Auction Median 5.00 5.00 5.00 5.00 5.00 5.00 5.00 5.00 5.00
Std Dev 0.08 0.04 0.04 0.03 *** 0.16 0.02 *** 0.00 0.02 *** 0.13
N [75] [11] [10] [14] [12] [7] [7] [7] [7]
Herfindahl Index of Allocations (per Mean 0.43 0.40 0.40 0.49 0.49 0.31 0.36 0.45 0.49
Auction) Median 0.42 0.39 0.36 0.46 0.48 0.30 0.36 0.43 0.46
Std Dev 0.10 0.07 0.08 0.14 *** 0.05 0.04 0.07 0.08 0.10
N [75] [11] [10] [14] [12] [7] [7] [7] [7]
Individual Bidder Profit per Auction Mean -4.19 -6.92 *** -2.30 -8.88 -7.52 0.09 -0.22 1.18 * -1.08
Median -2.12 -4.16 *** -0.67 -3.38 * -6.01 0.45 -0.17 1.28 ** -0.98
Std Dev 11.41 9.35 ** 6.96 20.66 *** 7.97 3.58 4.57 4.63 5.84
N [375] [55] [50] [70] [60] [35] [35] [35] [35]
Elasticity of Individual Bid Schedules Mean -13.43 -10.24 *** -15.65 -11.12 *** -13.57 -13.37 *** -18.04 -12.62 *** -16.82
at the Bidder's Signal per Auciton Median -13.85 -10.17 *** -16.52 -10.59 *** -13.11 -14.08 *** -19.09 -15.38 *** -17.79
Std Dev 4.88 4.58 4.25 3.88 3.24 5.55 *** 2.32 6.30 *** 2.87
N [363] [55] [48] [70] [58] [34] [31] [35] [32]
Highest Price Bid by Individual Bidders Mean 20.86 22.31 *** 20.10 21.84 *** 20.65 20.89 *** 19.72 20.30 ** 19.69
in an Auction Median 20.59 22.53 *** 20.03 21.50 *** 20.65 20.65 *** 19.82 20.18 19.71
Std Dev 1.62 1.88 *** 1.09 1.63 *** 0.89 1.40 *** 0.78 1.54 *** 0.75
N [375] [55] [50] [70] [60] [35] [35] [35] [35]
Units Bid For by Individual Bidders Mean 24.05 24.49 23.84 24.56 24.21 23.58 23.85 24.03 23.04
in an Auction Median 26.00 25.94 26.00 26.00 26.00 26.00 25.94 26.00 26.00
Std Dev 4.14 3.03 ** 4.02 3.07 *** 4.42 4.69 4.41 4.68 5.68
N [375] [55] [50] [70] [60] [35] [35] [35] [35]
Number of Prices at Which Individual Mean 3.76 4.38 ** 3.72 4.39 *** 3.45 3.98 *** 2.75 3.55 3.10
Bidders Submitted Bids in an Auction Median 3.65 4.00 * 3.50 3.95 *** 3.47 3.41 *** 2.24 3.65 3.18
Std Dev 1.65 1.78 1.59 1.73 ** 1.28 1.95 ** 1.32 1.24 1.42
N [375] [55] [50] [70] [60] [35] [35] [35] [35]
Expected Resale Value Conditional on a Mean -0.87 -2.31 *** -0.10 -1.87 *** -0.68 -0.89 *** 0.28 -0.30 ** 0.31
Bidder's Signal less the Highest Price Median -0.59 -2.53 *** -0.03 -1.47 *** -0.59 -0.65 *** 0.18 -0.06 * 0.24
Bid by that Bidder in the Auction Std Dev 1.65 1.88 *** 1.09 1.66 *** 0.96 1.40 *** 0.78 1.59 *** 0.89
N [375] [55] [50] [70] [60] [35] [35] [35] [35]
Disc. PriceDisc. Price Unif. Price Disc. Price Unif. PriceUnif. Price Disc. Price Unif. Price
Symmetric Information Asymmetric Information
Inexperienced Subjects Experienced Subjects
Symmetric Information Asymmetric Information
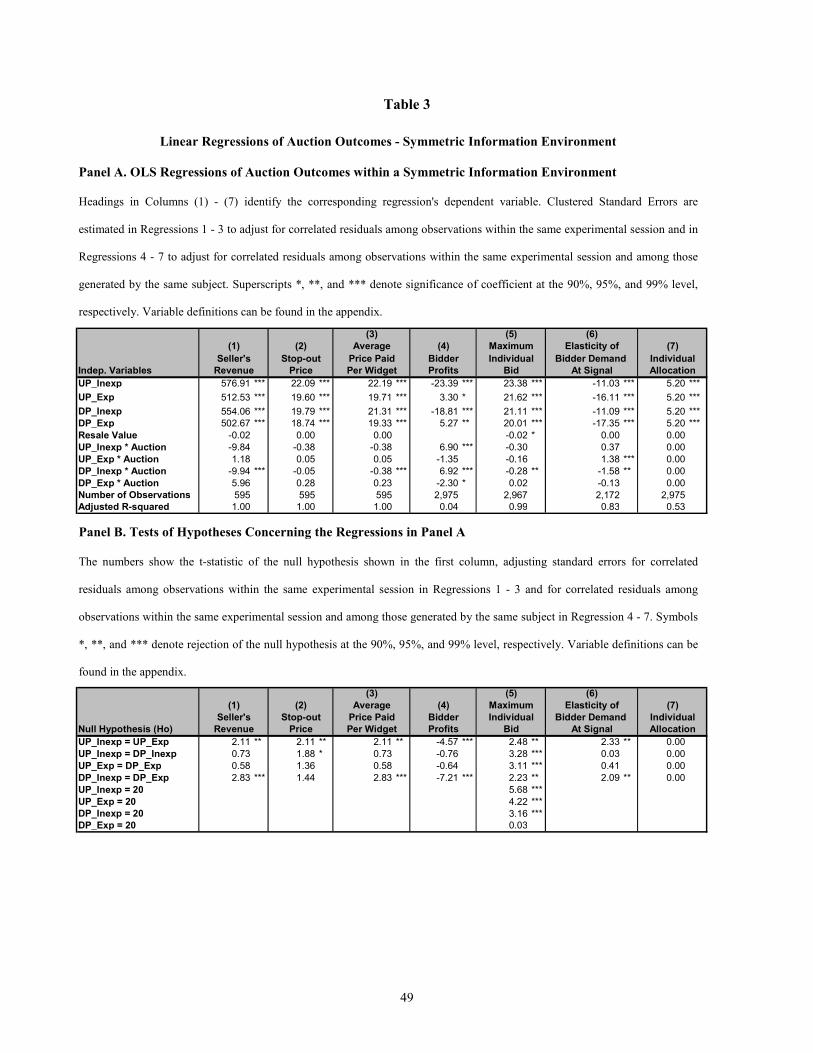
49
Table 3
Indep. Variables
UP_Inexp 576.91 *** 22.09 *** 22.19 *** -23.39 *** 23.38 *** -11.03 *** 5.20 ***
UP_Exp 512.53 *** 19.60 *** 19.71 *** 3.30 * 21.62 *** -16.11 *** 5.20 ***
DP_Inexp 554.06 *** 19.79 *** 21.31 *** -18.81 *** 21.11 *** -11.09 *** 5.20 ***
DP_Exp 502.67 *** 18.74 *** 19.33 *** 5.27 ** 20.01 *** -17.35 *** 5.20 ***
Resale Value -0.02 0.00 0.00 -0.02 * 0.00 0.00
UP_Inexp * Auction -9.84 -0.38 -0.38 6.90 *** -0.30 0.37 0.00
UP_Exp * Auction 1.18 0.05 0.05 -1.35 -0.16 1.38 *** 0.00
DP_Inexp * Auction -9.94 *** -0.05 -0.38 *** 6.92 *** -0.28 ** -1.58 ** 0.00
DP_Exp * Auction 5.96 0.28 0.23 -2.30 * 0.02 -0.13 0.00
Number of Observations 595 595 595 2,975 2,967 2,172 2,975
Adjusted R-squared 1.00 1.00 1.00 0.04 0.99 0.83 0.53
Maximum(2)
At Signal
Bidder
(1) Average (4) Elasticity of
Seller's
Revenue Price Per Widget Profits
Stop-out Price Paid
(6)
(7)
Individual
AllocationBid
Individual Bidder Demand
(5)(3)
Linear Regressions of Auction Outcomes - Symmetric Information Environment
Panel A. OLS Regressions of Auction Outcomes within a Symmetric Information Environment
Headings in Columns (1) - (7) identify the corresponding regression's dependent variable. Clustered Standard Errors are
estimated in Regressions 1 - 3 to adjust for correlated residuals among observations within the same experimental session and in
Regressions 4 - 7 to adjust for correlated residuals among observations within the same experimental session and among those
generated by the same subject. Superscripts *, **, and *** denote significance of coefficient at the 90%, 95%, and 99% level,
respectively. Variable definitions can be found in the appendix.
Null Hypothesis (Ho)
UP_Inexp = UP_Exp 2.11 ** 2.11 ** 2.11 ** -4.57 *** 2.48 ** 2.33 ** 0.00
UP_Inexp = DP_Inexp 0.73 1.88 * 0.73 -0.76 3.28 *** 0.03 0.00
UP_Exp = DP_Exp 0.58 1.36 0.58 -0.64 3.11 *** 0.41 0.00
DP_Inexp = DP_Exp 2.83 *** 1.44 2.83 *** -7.21 *** 2.23 ** 2.09 ** 0.00
UP_Inexp = 20 5.68 ***
UP_Exp = 20 4.22 ***
DP_Inexp = 20 3.16 ***
DP_Exp = 20 0.03
ProfitsRevenue Price Per Widget
(1) Elasticity ofMaximum
(6)(5)
(2) Average (4)
(3)
Seller's Stop-out Price Paid Bidder
At SignalBid Allocation
(7)
Bidder Demand Individual Individual
Panel B. Tests of Hypotheses Concerning the Regressions in Panel A
The numbers show the t-statistic of the null hypothesis shown in the first column, adjusting standard errors for correlated
residuals among observations within the same experimental session in Regressions 1 - 3 and for correlated residuals among
observations within the same experimental session and among those generated by the same subject in Regression 4 - 7. Symbols
*, **, and *** denote rejection of the null hypothesis at the 90%, 95%, and 99% level, respectively. Variable definitions can be
found in the appendix.
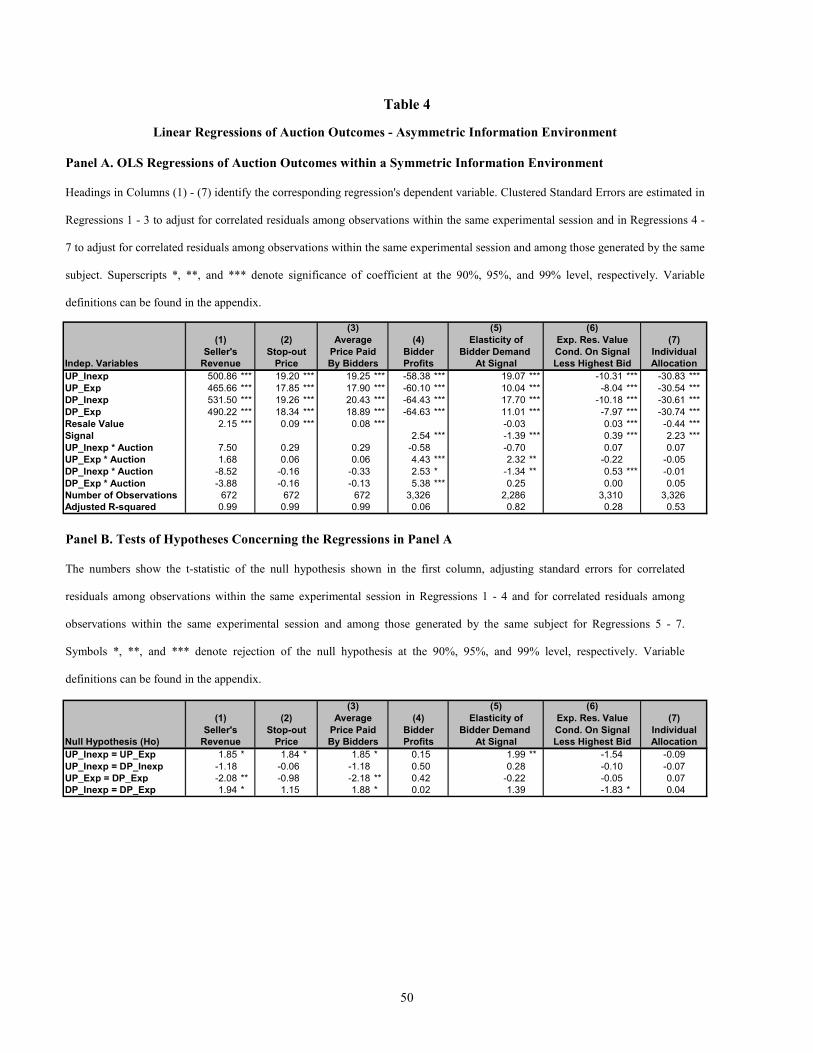
50
Table 4
Indep. Variables
UP_Inexp 500.86 *** 19.20 *** 19.25 *** -58.38 *** 19.07 *** -10.31 *** -30.83 ***
UP_Exp 465.66 *** 17.85 *** 17.90 *** -60.10 *** 10.04 *** -8.04 *** -30.54 ***
DP_Inexp 531.50 *** 19.26 *** 20.43 *** -64.43 *** 17.70 *** -10.18 *** -30.61 ***
DP_Exp 490.22 *** 18.34 *** 18.89 *** -64.63 *** 11.01 *** -7.97 *** -30.74 ***
Resale Value 2.15 *** 0.09 *** 0.08 *** -0.03 0.03 *** -0.44 ***
Signal 2.54 *** -1.39 *** 0.39 *** 2.23 ***
UP_Inexp * Auction 7.50 0.29 0.29 -0.58 -0.70 0.07 0.07
UP_Exp * Auction 1.68 0.06 0.06 4.43 *** 2.32 ** -0.22 -0.05
DP_Inexp * Auction -8.52 -0.16 -0.33 2.53 * -1.34 ** 0.53 *** -0.01
DP_Exp * Auction -3.88 -0.16 -0.13 5.38 *** 0.25 0.00 0.05
Number of Observations 672 672 672 3,326 2,286 3,310 3,326
Adjusted R-squared 0.99 0.99 0.99 0.06 0.82 0.28 0.53
(7)
At Signal
Bidder Demand Individual
Allocation
Elasticity of(4)
Revenue Price By Bidders Profits
Seller's Stop-out Price Paid Bidder
Exp. Res. Value(1) (2) Average
Less Highest Bid
Cond. On Signal
(5) (6)(3)
Linear Regressions of Auction Outcomes - Asymmetric Information Environment
Panel A. OLS Regressions of Auction Outcomes within a Symmetric Information Environment
Headings in Columns (1) - (7) identify the corresponding regression's dependent variable. Clustered Standard Errors are estimated in
Regressions 1 - 3 to adjust for correlated residuals among observations within the same experimental session and in Regressions 4 -
7 to adjust for correlated residuals among observations within the same experimental session and among those generated by the same
subject. Superscripts *, **, and *** denote significance of coefficient at the 90%, 95%, and 99% level, respectively. Variable
definitions can be found in the appendix.
Null Hypothesis (Ho)
UP_Inexp = UP_Exp 1.85 * 1.84 * 1.85 * 0.15 1.99 ** -1.54 -0.09
UP_Inexp = DP_Inexp -1.18 -0.06 -1.18 0.50 0.28 -0.10 -0.07
UP_Exp = DP_Exp -2.08 ** -0.98 -2.18 ** 0.42 -0.22 -0.05 0.07
DP_Inexp = DP_Exp 1.94 * 1.15 1.88 * 0.02 1.39 -1.83 * 0.04
At Signal Less Highest BidBy Bidders Profits
Bidder Bidder Demand Cond. On Signal
(5) (6)
Elasticity of Exp. Res. Value
Price Paid
(3)
(1) (2) Average (4)
Seller's Stop-out
Revenue Price
(7)
Individual
Allocation
Panel B. Tests of Hypotheses Concerning the Regressions in Panel A
The numbers show the t-statistic of the null hypothesis shown in the first column, adjusting standard errors for correlated
residuals among observations within the same experimental session in Regressions 1 - 4 and for correlated residuals among
observations within the same experimental session and among those generated by the same subject for Regressions 5 - 7.
Symbols *, **, and *** denote rejection of the null hypothesis at the 90%, 95%, and 99% level, respectively. Variable
definitions can be found in the appendix.
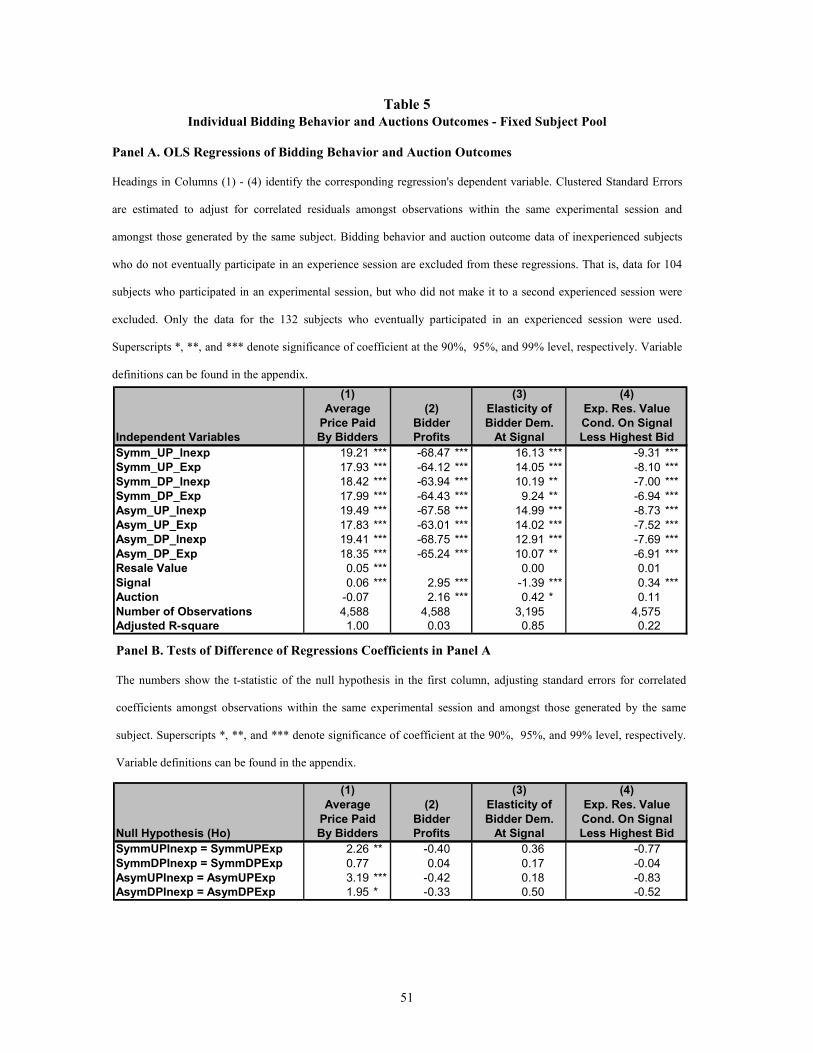
51
Table 5
Individual Bidding Behavior and Auctions Outcomes - Fixed Subject Pool
Panel A. OLS Regressions of Bidding Behavior and Auction Outcomes
Headings in Columns (1) - (4) identify the corresponding regression's dependent variable. Clustered Standard Errors
are estimated to adjust for correlated residuals amongst observations within the same experimental session and
amongst those generated by the same subject. Bidding behavior and auction outcome data of inexperienced subjects
who do not eventually participate in an experience session are excluded from these regressions. That is, data for 104
subjects who participated in an experimental session, but who did not make it to a second experienced session were
excluded. Only the data for the 132 subjects who eventually participated in an experienced session were used.
Superscripts *, **, and *** denote significance of coefficient at the 90%, 95%, and 99% level, respectively. Variable
definitions can be found in the appendix.
Independent Variables
Symm_UP_Inexp 19.21 *** -68.47 *** 16.13 *** -9.31 ***
Symm_UP_Exp 17.93 *** -64.12 *** 14.05 *** -8.10 ***
Symm_DP_Inexp 18.42 *** -63.94 *** 10.19 ** -7.00 ***
Symm_DP_Exp 17.99 *** -64.43 *** 9.24 ** -6.94 ***
Asym_UP_Inexp 19.49 *** -67.58 *** 14.99 *** -8.73 ***
Asym_UP_Exp 17.83 *** -63.01 *** 14.02 *** -7.52 ***
Asym_DP_Inexp 19.41 *** -68.75 *** 12.91 *** -7.69 ***
Asym_DP_Exp 18.35 *** -65.24 *** 10.07 ** -6.91 ***
Resale Value 0.05 *** 0.00 0.01
Signal 0.06 *** 2.95 *** -1.39 *** 0.34 ***
Auction -0.07 2.16 *** 0.42 * 0.11
Number of Observations 4,588 4,588 3,195 4,575
Adjusted R-square 1.00 0.03 0.85 0.22
Price Paid Bidder Bidder Dem. Cond. On Signal
By Bidders Profits At Signal Less Highest Bid
(1) (3) (4)
(2) Elasticity of Exp. Res. ValueAverage
Null Hypothesis (Ho)
SymmUPInexp = SymmUPExp 2.26 ** -0.40 0.36 -0.77
SymmDPInexp = SymmDPExp 0.77 0.04 0.17 -0.04
AsymUPInexp = AsymUPExp 3.19 *** -0.42 0.18 -0.83
AsymDPInexp = AsymDPExp 1.95 * -0.33 0.50 -0.52
(1) (3) (4)
Average (2) Elasticity of Exp. Res. Value
Price Paid Bidder Bidder Dem. Cond. On Signal
By Bidders Profits At Signal Less Highest Bid
Panel B. Tests of Difference of Regressions Coefficients in Panel A
The numbers show the t-statistic of the null hypothesis in the first column, adjusting standard errors for correlated
coefficients amongst observations within the same experimental session and amongst those generated by the same
subject. Superscripts *, **, and *** denote significance of coefficient at the 90%, 95%, and 99% level, respectively.
Variable definitions can be found in the appendix.
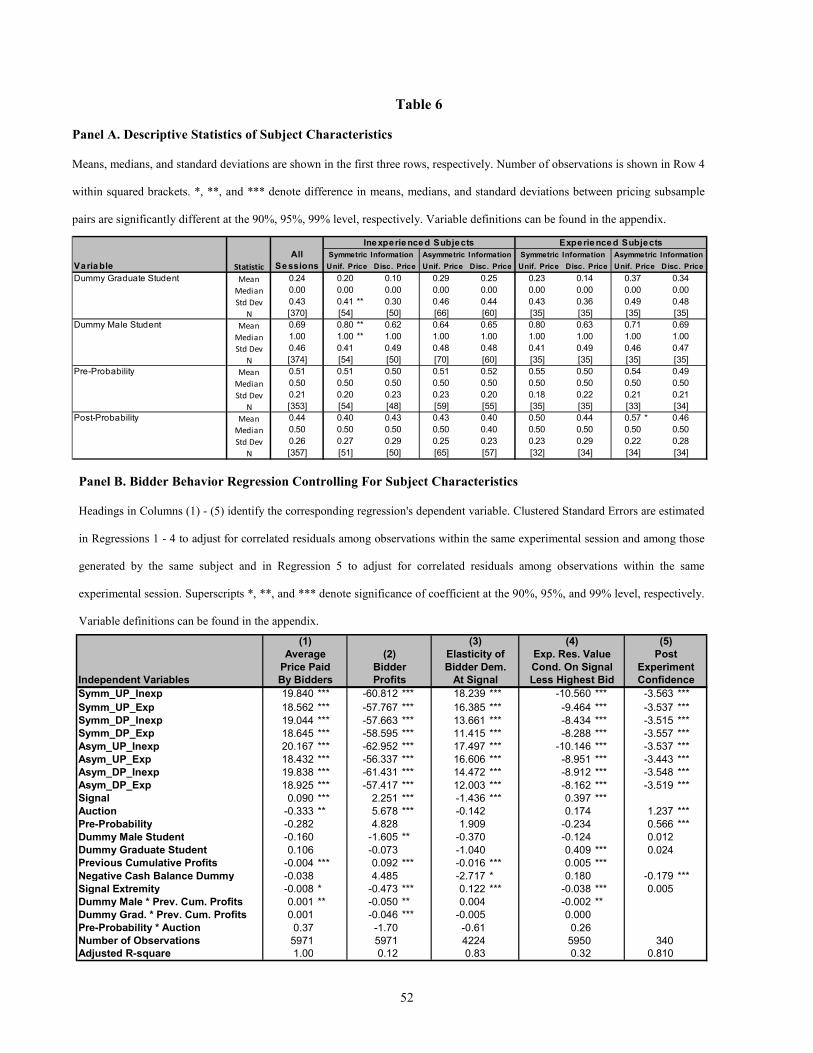
52
Table 6
All
Varia ble Statistic Se ssions
Dummy Graduate Student Mean 0.24 0.20 0.10 0.29 0.25 0.23 0.14 0.37 0.34
Median 0.00 0.00 0.00 0.00 0.00 0.00 0.00 0.00 0.00
Std Dev 0.43 0.41 ** 0.30 0.46 0.44 0.43 0.36 0.49 0.48
N [370] [54] [50] [66] [60] [35] [35] [35] [35]
Dummy Male Student Mean 0.69 0.80 ** 0.62 0.64 0.65 0.80 0.63 0.71 0.69
Median 1.00 1.00 ** 1.00 1.00 1.00 1.00 1.00 1.00 1.00
Std Dev 0.46 0.41 0.49 0.48 0.48 0.41 0.49 0.46 0.47
N [374] [54] [50] [70] [60] [35] [35] [35] [35]
Pre-Probability Mean 0.51 0.51 0.50 0.51 0.52 0.55 0.50 0.54 0.49
Median 0.50 0.50 0.50 0.50 0.50 0.50 0.50 0.50 0.50
Std Dev 0.21 0.20 0.23 0.23 0.20 0.18 0.22 0.21 0.21
N [353] [54] [48] [59] [55] [35] [35] [33] [34]
Post-Probability Mean 0.44 0.40 0.43 0.43 0.40 0.50 0.44 0.57 * 0.46
Median 0.50 0.50 0.50 0.50 0.40 0.50 0.50 0.50 0.50
Std Dev 0.26 0.27 0.29 0.25 0.23 0.23 0.29 0.22 0.28
N [357] [51] [50] [65] [57] [32] [34] [34] [34]
Disc. PriceDisc. Price Unif. Price Disc. Price Unif. PriceUnif. Price Disc. Price Unif. Price
Symmetric Information Asymmetric Information
Ine xperie nce d Subjects Experie nce d Subjects
Symmetric Information Asymmetric Information
definitions can be found in the appendix.
Panel B. Bidder Behavior Regression Controlling For Subject Characteristics
Headings in Columns (1) - (5) identify the corresponding regression's dependent variable. Clustered Standard Errors are estimated
in Regressions 1 - 4 to adjust for correlated residuals among observations within the same experimental session and among those
generated by the same subject and in Regression 5 to adjust for correlated residuals among observations within the same
experimental session. Superscripts *, **, and *** denote significance of coefficient at the 90%, 95%, and 99% level, respectively.
Variable definitions can be found in the appendix.
Panel A. Descriptive Statistics of Subject Characteristics
Means, medians, and standard deviations are shown in the first three rows, respectively. Number of observations is shown in Row 4
within squared brackets. *, **, and *** denote difference in means, medians, and standard deviations between pricing subsample
pairs are significantly different at the 90%, 95%, 99% level, respectively. Variable definitions can be found in the appendix.
Independent Variables
Symm_UP_Inexp 19.840 *** -60.812 *** 18.239 *** -10.560 *** -3.563 ***
Symm_UP_Exp 18.562 *** -57.767 *** 16.385 *** -9.464 *** -3.537 ***
Symm_DP_Inexp 19.044 *** -57.663 *** 13.661 *** -8.434 *** -3.515 ***
Symm_DP_Exp 18.645 *** -58.595 *** 11.415 *** -8.288 *** -3.557 ***
Asym_UP_Inexp 20.167 *** -62.952 *** 17.497 *** -10.146 *** -3.537 ***
Asym_UP_Exp 18.432 *** -56.337 *** 16.606 *** -8.951 *** -3.443 ***
Asym_DP_Inexp 19.838 *** -61.431 *** 14.472 *** -8.912 *** -3.548 ***
Asym_DP_Exp 18.925 *** -57.417 *** 12.003 *** -8.162 *** -3.519 ***
Signal 0.090 *** 2.251 *** -1.436 *** 0.397 ***
Auction -0.333 ** 5.678 *** -0.142 0.174 1.237 ***
Pre-Probability -0.282 4.828 1.909 -0.234 0.566 ***
Dummy Male Student -0.160 -1.605 ** -0.370 -0.124 0.012
Dummy Graduate Student 0.106 -0.073 -1.040 0.409 *** 0.024
Previous Cumulative Profits -0.004 *** 0.092 *** -0.016 *** 0.005 ***
Negative Cash Balance Dummy -0.038 4.485 -2.717 * 0.180 -0.179 ***
Signal Extremity -0.008 * -0.473 *** 0.122 *** -0.038 *** 0.005
Dummy Male * Prev. Cum. Profits 0.001 ** -0.050 ** 0.004 -0.002 **
Dummy Grad. * Prev. Cum. Profits 0.001 -0.046 *** -0.005 0.000
Pre-Probability * Auction 0.37 -1.70 -0.61 0.26
Number of Observations 5971 5971 4224 5950 340
Adjusted R-square 1.00 0.12 0.83 0.32 0.810
By Bidders Profits At Signal
(3)
Price Paid Bidder Bidder Dem.
Average (2) Elasticity of
(1)
Post
Experiment
Confidence
(4)
Exp. Res. Value
Cond. On Signal
Less Highest Bid
(5)