Dividends - IiAS: India's leading corporate governance and ... Special Report Dividends - BSE500 -...
18
Institutional EYE Special report | 2014 Dividends iias.in 1 Dividends: Companies that can pay more This is the second in a series of two special reports on dividends. Related Reports Dividends: Is there room for a larger payout? Write to us [email protected] Subscribe to IiAS Research The market as a whole has the ability to pay higher dividends. IiAS’ study of the S&P BSE 500 conservatively identifies 77 companies that can pay more. The incremental dividend from these companies alone could aggregate almost ₹360 bn. Going forward, while finalizing its voting recommendations, IiAS will highlight companies that can - and should, pay-out more. In our earlier report ‘Dividends: Is there room for a larger payout?’ we discussed the general patterns and trends of dividend payout of S&P BSE500 companies between 2007-08 and 2011-12. In this report, we have identified companies in the S&P BSE500 index (- excluding banks and NBFCs) based on 2012-13 financials that we believe can and should pay higher dividends. Most companies tend to keep cash on their balance sheets given the complexity and uncertainty of fundraising. On the other hand, higher dividend payouts increase shareholder interest in the stock – and to that extent make fund raising easier. Dividend payments demonstrate a company’s confidence to continually generate earnings in future and show that its earnings are real. In our earlier report, we highlighted that dividend as being one of the factors that has a bearing on company valuations i.e. higher the payout ratio, higher is the valuation. Indian companies tend to be controlled about dividend payments, and hold the purse strings tightly. The excess cash is usually invested in bank deposits and debt mutual funds. As these cash holdings increase in a company’s books, its return ratios generally deteriorate. Additionally, there is enough anecdotal evidence that this excess cash leads to sub-optimal capital allocation decisions. The market as a whole has the ability to step up dividends. In this report we have conservatively identified 77 out of the S&P BSE 500 companies that can pay higher dividend (see chart 1). While some of these companies already pay healthy dividends (- an average of 27.2% of their profits for 2012-13), they have headroom to pay still more. Our methodology is discussed later in Annex A. Some of the key takeaways from this report are: Incremental dividend payout from the 77 companies identified could aggregate to almost ₹360 bn., after taxes, almost twice the amount these companies actually paid out in FY13 (- or ₹194 bn). Three companies can pay over ₹ 100 per share to shareholders without any stress. These are M R F, Oracle Financial Services Software and Shree Cements. Three companies can pay between ₹50.1 and ₹100 as dividends incrementally. These are Bosch, Eicher Motors and Maruti Suzuki. Note: In preparing this report IiAS has relied on latest available year-end data provided by CMIE. Unless specified, all numbers refer to aggregate data of 77 companies. Standalone company data has been used for analysis. Dividend payments are after taxes. FY14 Interim dividends are not considered.
Transcript of Dividends - IiAS: India's leading corporate governance and ... Special Report Dividends - BSE500 -...

Institutional EYE Special report | 2014
Dividends iias.in 1
Dividends: Companies that can pay more
This is the second in a series of two special reports on dividends.
Related Reports Dividends: Is there room for a larger payout?
Write to us [email protected]
Subscribe to IiAS Research
The market as a whole has the ability to pay higher dividends. IiAS’ study of the S&P BSE 500 conservatively identifies 77 companies that can pay more. The incremental dividend from these companies alone could aggregate almost ₹360 bn.
Going forward, while finalizing its voting recommendations, IiAS will highlight companies that can - and should, pay-out more. In our earlier report ‘Dividends: Is there room for a larger payout?’ we discussed the general patterns and trends of dividend payout of S&P BSE500 companies between 2007-08 and 2011-12. In this report, we have identified companies in the S&P BSE500 index (- excluding banks and NBFCs) based on 2012-13 financials that we believe can and should pay higher dividends. Most companies tend to keep cash on their balance sheets given the complexity and uncertainty of fundraising. On the other hand, higher dividend payouts increase shareholder interest in the stock – and to that extent make fund raising easier. Dividend payments demonstrate a company’s confidence to continually generate earnings in future and show that its earnings are real. In our earlier report, we highlighted that dividend as being one of the factors that has a bearing on company valuations i.e. higher the payout ratio, higher is the valuation. Indian companies tend to be controlled about dividend payments, and hold the purse strings tightly. The excess cash is usually invested in bank deposits and debt mutual funds. As these cash holdings increase in a company’s books, its return ratios generally deteriorate. Additionally, there is enough anecdotal evidence that this excess cash leads to sub-optimal capital allocation decisions. The market as a whole has the ability to step up dividends. In this report we have conservatively identified 77 out of the S&P BSE 500 companies that can pay higher dividend (see chart 1). While some of these companies already pay healthy dividends (- an average of 27.2% of their profits for 2012-13), they have headroom to pay still more. Our methodology is discussed later in Annex A.
Some of the key takeaways from this report are:
Incremental dividend payout from the 77 companies identified could aggregate to almost ₹360 bn., after taxes, almost twice the amount these companies actually paid out in FY13 (- or ₹194 bn).
Three companies can pay over ₹ 100 per share to shareholders without any stress. These are M R F, Oracle Financial Services Software and Shree Cements.
Three companies can pay between ₹50.1 and ₹100 as dividends incrementally. These are Bosch, Eicher Motors and Maruti Suzuki.
Note: In preparing this report IiAS has relied on latest available year-end data provided by CMIE. Unless specified, all numbers refer to aggregate data of 77 companies. Standalone company data has been used for analysis. Dividend payments are after taxes. FY14 Interim dividends are not considered.

Institutional EYE Special report | 2014
Dividends iias.in 2
Companies such as Whirlpool India, Jubilant Foodworks, Gujarat Pipavav, Oracle Financial Services Software, and Just Dial Ltd paid no dividends in 2013, despite being profitable.
We believe that as the foreign parents take money by way of royalty, they are less sensitive to the amount of dividend declared by the Indian business. For example Maruti Suzuki’s dividend payout at 12% was low in comparison to the S&P BSE Sensex’s median payout at 27%. In absolute amounts it paid ₹2,828 mn as dividends, of which 56% went to its foreign promoter, Suzuki Motor Corporation. In contrast the company paid ₹24,538 mn - which halved its profits after tax - as royalties to Suzuki. This is discussed in Annex 3.
While the regulations in India do not mandate companies to declare a dividend policy, in Brazil (- where governance laws are far less progressive than those in India) regulations require that the bye-laws of a company mention minimum percentage of dividends from its net income that would be distributed to shareholders on an annual basis (- read more) This report, like the previous one, argues that companies follow a transparent mechanism for declaring dividends and retaining earnings accrued in a given financial year - whether the earnings are being retained for future capital expenditures, working capital or for retiring debt. Such details and expected timelines for cash utilization should be enclosed in the company’s annual filings. IiAS recommends that all companies articulate a dividend policy as well as a ‘retention approval’ as part of their charter documents. Under this companies should disclose how much cash they intend to retain and the rationale for doing so and pay-out the balance to shareholders as dividends: this cash belongs to all shareholders and is not for company managements to keep.
Source: CMIE, IiAS Research. Dividends are after distribution tax.
Chart 1: Bucketing on incremental DPS – 77 companies
(in ₹)
Nu
mb
er
of
com
pa
nie
s
> 100 50.1-100 15.1 - 50 1 - 15
Incremental Dividend per share (₹)
3 3
14
57
0
10
20
30
40
50
60

Institutional EYE Special report | 2014
Dividends iias.in 3
Incremental Payouts, after taxes – 77 Companies (All figures in ₹)
A I A Engineering 4.0 Infotech Enterprises 4.5 Monsanto India 22.0 Maruti Suzuki 8.0 Oracle Finan. Serv. -
Ajanta Pharma 4.2 Ipca Laboratories 4.0 H C L Technologies 12.0 Eicher Motors 30.0 Shree Cement 20.0
Amara Raja Batteries 2.5 J B Chemicals & Pharma 3.0 A C C 30.0 Bosch 60.0 M R F 30.0
Asian Paints 4.6 Jubilant Foodworks - V A Tech Wabag 7.0
Astral Poly Technik 0.5 Just Dial - Wabco India 5.0
Bajaj Auto 45.0 K P I T Technologies 0.9 P C Jeweller 1.0
Bajaj Holdings & Invst 25.0 Kirloskar Oil Engines 5.0 Abbott India 17.0
Balmer Lawrie & Co 17.6 M O I L 5.5 F A G Bearings India 5.0
Bata India 6.0 Mahindra & Mahindra 13.0 Nestle India 48.5
Bharti Infratel 5.3 Mphasis 17.0 Mindtree 11.9
Biocon 7.5 Nesco 3.5 Kaveri Seed Co. 15.9
Clariant Chemicals (India) 27.5 Neyveli Lignite Corpn. 2.8 Infosys 42.0
Colgate-Palmolive (India) 28.0 P T C India 1.6 Glaxosmithkline Consumer 45.0
D B Corp 5.5 Petronet L N G 2.5 Reliance Industries 8.1
Divi'S Laboratories 15.0 Phoenix Mills 2.2
Eclerx Services 25.1 Pidilite Industries 2.6
Emami 5.3 S J V N 1.0
Engineers India 6.0 S K F India 7.5
Entertainment Network 1.0 S R F 10.0
Eros International Media 1.5 Sanofi India 33.0
F D C 2.3 Symphony 6.5
Finolex Industries 5.5 Thermax 7.0
Glenmark Pharmaceuticals 2.0 Titan Company 2.1
Gujarat Gas Co. 7.0 Ultratech Cement 9.0
Gujarat Pipavav Port - Unichem Laboratories 4.5
Gujarat State Petronet 1.0 Whirlpool Of India -
Hindustan Zinc 3.1 Wipro 7.0
Indraprastha Gas 5.5 Zydus Wellness 6.0
Info Edge (India) 1.0
> ₹100
DPS (₹) 2012 -13 ₹ 1 - 15
> ₹15
to ₹50
> ₹50 to
₹100

Institutional EYE Special report | 2014
Dividends iias.in 4
IiAS View
Companies should dividend-out their excess earnings on a yearly basis,
post their forecasted capital expenditure, incremental working capital
requirements and debt repayments.
Accumulating excess cash and non-core investments on companies’ books
typically lead to lower return ratios.
Companies with high cash balances tend to have lower balance sheet
discipline.
While the new Companies Act is progressive in comparison to the
prevailing regulations in most countries, it must encourage companies to
declare a dividend policy. Companies should spell out the minimum
dividend they will pay-out as a percentage of its earnings.
The converse of the dividend policy is the ‘retention approval.’ We
strongly believe that companies should obtain shareholder approval to
retain cash specifying the rationale for doing so, and pay-out the balance
to shareholders as dividends: this cash belongs to all shareholders and is
not for company managements to keep.
IiAS will review cash and non-core investments on the on the company’s books and highlight cases where companies can pay higher dividends.

Institutional EYE Special report | 2014
Dividends iias.in 5
Annexure A
Methodology:
We have used the following approach to identify companies in the S&P BSE500 index that can pay higher dividends based on FY13 data.
1. From the S&P BSE500 index we filtered out banks and NBFCs. This reduced the companies from 500 to 422.
2. We have considered only those companies that have profitability of ₹500 mn or above. Further we have considered only those companies that have a positive net cash flow from operations for FY13. This reduces the companies from 422 to 279.
3. Further, we have considered only those companies that have positive operational cash flows even after providing for 75% of their three year average capex. We have deducted the 2012-13 equity and preference dividends paid from this. This reduces the number of companies to 189.
4. High financial leverage impacts a company’s earnings and cash flows and consequently its ability to pay out dividends. Given this, we have excluded companies that have debt/ equity greater than 1X and debt/ EBITDA of more than 2X. This reduces the list to 132 companies.
5. In order to meet unforeseen liabilities, companies invest their surplus cash into bank deposits, bank certificates, mutual funds, in equity or debt instruments of non- group companies. We have clubbed these non-core investments and cash and bank balances as cash and cash equivalents1.
From this we have deducted contingent liabilities2. Companies with positive cash and cash equivalents after deducting for contingent liabilities, reduces the number of companies to 88.
6. We have considered the lower of 3 and 5 above. This helps us arrive at the excess cash available for dividend payments. This amount also indicates the dividends that companies can pay incrementally.
7. Finally we have considered each company’s performance in the quarters post their respective financial year ending. We have eliminated companies in which profitability has fallen by 50% or more in these quarters in comparison to the corresponding quarters in the 2012. This reduces the list to 86.
8. Also we have not considered companies that can pay ₹1 per share or less as dividends. This reduces the list to 81 companies.
9. From this list of 81 companies, we have excluded (i) Financial Technologies given the recent financial crisis in the company (ii) Ambuja Cements, given the proposed outflow of ₹35 bn from its balance sheet post restructuring (- money that should have rightfully been distributed to all shareholders and not just Holcim, its parent) (iii) Wyeth, as it declared a dividend of ₹145 per share after its merger with Pfizer (iv) Coal India, as it recently paid an interim dividend of ₹29 per share.
This gives the final list of 77 companies.
1Cash and cash equivalents include investment in equity and preference shares, and debt instruments of non-group companies. It includes investments in bonds of government and local bodies, mutual funds, and cash and bank balances. These include both current and non-current investments.
2Contingent liabilities include disputed taxes, disputed claims etc., guarantees and counter guarantees and bonds issued in favour of government authorities. It includes liabilities on account of non-fulfilment of export obligation, forward foreign exchange contract, arrears of preference dividend, unprovided employee due, un-called and partly paidup shares & debentures, and other miscellaneous contingent liabilities.
All except
NBFC, Banking
Filters – BSE500
Companies
CFO > 0 PAT >
500
Capex
422 Companies
189 companies
Gear
ratios
Cont.
Liab
Cash &
equiv.
88 companies
Excess
cash
Qual.
Factors
77 companies

Institutional EYE Special report | 2014
Dividends iias.in 6
Annexure B Regulations on dividends: Both the Companies Act 2013 and the Companies Act 1956 provide for safeguarding shareholders’ interests. Companies have, in the past, declared dividends despite having reported losses. This can be detrimental to the long term interest of the company and its shareholders. To avoid such practises, the new Act states that in case a company wishes to declare an interim dividend in which it has made a loss up to the end of the quarter immediately preceding the date of declaration of interim dividend, the interim dividend declared shall not be higher than average rate of dividends declared during the immediately preceding three financial years. In addition to the above, certain restrictions on dividend payments in the new Act are similar to those provided in the Companies Act, 1956. Section 205 of the Companies Act, 1956 states that dividend payments shall be made from:
Profits of the company for that year arrived at after providing for depreciation
Profits of the company for any previous financial year(s) after providing for depreciation
Or out of the money provided by the Central or State Government for the payment of dividend in addition guarantees provided by that government.
In case the company has incurred losses in the previous financial year(s), and proposes to pay dividend in the profit making year then it has to set off against its profit the lower of (i) the amount of loss incurred for the year(s) (ii) the amount provided for depreciation for the year(s).
However, the Act has stopped short from mandating companies to declare a certain percentage of dividends out of its profits in a given financial year. For example, in markets like Brazil, the law requires that the bye-laws of a company mention minimum percentage of dividends from its net income that would be distributed to shareholders on an annual basis. Given this, however, the law provides flexibility to companies in case they are unable to pay dividends in a certain year i.e. companies can request shareholders’ approval if the payment of dividend may affect the financial position of a company. In such cases, the board informs the shareholders of its intent to either completely retain its net income or distribute a lower percentage of profits as dividends.

Institutional EYE Special report | 2014
Dividends iias.in 7
Annexure C Royalty and dividends
Royalty is typically paid to the legal owner of a brand, technology or franchise.
Remitting royalties and related payments takes away a large pie. This leads to a
smaller corpus available for paying to dividends. While providing technology
and know-how maybe critical to company’s operations, its bearing on the
bottom-line cannot be altogether ignored by foreign promoters.
IiAS has repeatedly pointed out that in India the increase in the percentage of
royalty paid has little or no relation to increase in sales or profits:
Whirlpool skipped dividends since FY09, it paid ₹1.6 bn as royalty and
technical know- how fee to Whirlpool Corporation Inc., USA, during the five
year period.
Maruti Suzuki’s dividend payout at 12% was low in comparison to the S&P
BSE Sensex’s median payout at 27%. In absolute amounts it paid ₹2,828 mn
as dividends, of which 56% went to its foreign promoter, Suzuki Motor
Corporation.
In contrast the company paid ₹24,538 mn - which halved its profits after tax
- as royalties to Suzuki.
We believe that as the foreign parents take money by way of royalty, they are
less sensitive to the amount of dividend declared by the Indian business.
Table 1: Royalty and dividends ( in ₹ Mn)
Company Name PAT Royalty
paid* Dividend
paid Royalty % PAT
Dividend % PAT
Maruti Suzuki 23,921 24,538 2,828 103% 12%
Kaveri Seed Company 1,299 782 255 60% 20%
FAG Bearing 1,591 506 96 32% 6%
Whirlpool 1,277 355 0 28% 0%
Bosch 9,583 3,513 2,190 37% 23%
SKF India 1,901 496 459 26% 24%
GSK Consumer 4,368 1,094 2,199 25% 50%
ACC 10,612 998 6,546 9% 62% Source: IiAS Research, Company Filings *Includes royalty, technology/know-how fees, management services/ professional/ Consultancy fees, trade mark fees and such fees capitalized.

Institutional EYE Special report | 2014
Dividends iias.in 8
Annexure D
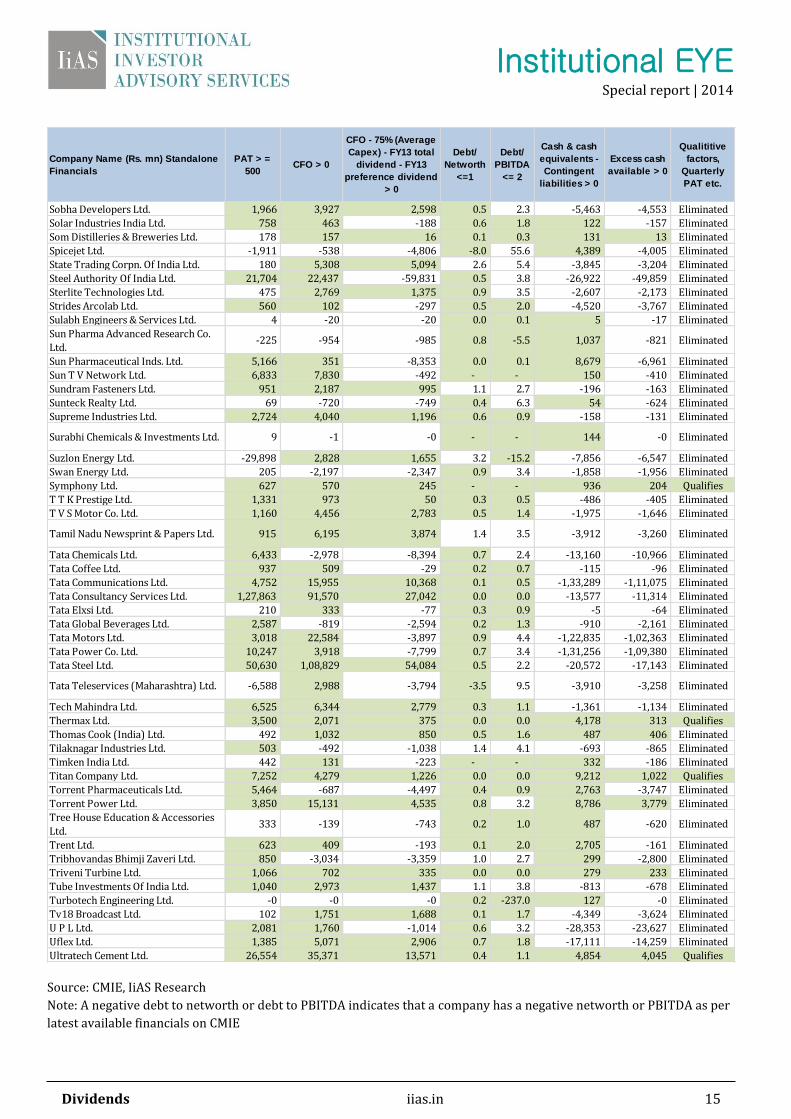
Complete List of BSE 500 companies excluding NBFCs and Banks. The green blocks indicate companies satisfy
that particular filter.
Source: CMIE, IiAS Research
Note: A negative debt to networth or debt to PBITDA indicates that a company has a negative networth or PBITDA as per
latest available financials on CMIE
Company Name (Rs. mn) Standalone
Financials
PAT > =
500CFO > 0
CFO - 75% (Average
Capex) - FY13 total
dividend - FY13
preference dividend
> 0
Debt/
Networth
<=1
Debt/
PBITDA
<= 2
Cash & cash
equivalents -
Contingent
liabilities > 0
Excess cash
available > 0
Qualititive
factors,
Quarterly
PAT etc.
3M India Ltd. 523 638 -196 0.3 1.3 376 -164 Eliminated
A B B India Ltd. 1,374 -502 -3,219 0.1 0.7 -5,190 -4,325 Eliminated
A B G Shipyard Ltd. 1,071 -734 -3,415 2.6 5.5 -13,321 -11,101 Eliminated
A C C Ltd. 10,612 14,917 3,894 0.0 0.1 13,973 3,245 Qualifies
A I A Engineering Ltd. 1,691 1,646 624 0.1 0.5 2,746 520 Qualifies
Aban Offshore Ltd. -126 3,339 2,051 1.0 3.5 -25,134 -20,945 Eliminated
Abbott India Ltd. 1,447 1,014 611 - - 3,106 509 Qualifies
Accelya Kale Solutions Ltd. 712 965 -343 0.0 0.0 550 -286 Eliminated
Adani Enterprises Ltd. 5,198 -1,801 -5,729 0.5 4.2 -11,454 -9,545 Eliminated
Adani Ports & Special Economic Zone 17,542 13,698 3,062 1.3 3.1 -39,599 -32,999 Eliminated
Adani Power Ltd. -19,520 19,699 -7,414 6.3 18.8 -24,623 -20,519 Eliminated
Aditya Birla Nuvo Ltd. 4,231 19 -3,247 0.6 3.5 -21,808 -18,173 Eliminated
Advanta Ltd. 29 524 514 1.6 10.4 -824 -687 Eliminated
Agro Tech Foods Ltd. 416 177 -74 - - -397 -331 Eliminated
Ajanta Pharma Ltd. 1,011 2,058 1,417 0.3 0.6 284 237 Qualifies
Akzo Nobel India Ltd. 2,188 1,928 -3,058 - - 8,874 -2,548 Eliminated
Alembic Pharmaceuticals Ltd. 1,574 2,743 1,669 0.4 0.7 -128 -107 Eliminated
Alok Industries Ltd. 9,202 -3,519 -15,267 3.2 2.6 -17,863 -14,886 Eliminated
Alstom India Ltd. 1,837 264 -1,117 0.0 0.0 762 -931 Eliminated
Alstom T & D India Ltd. 841 4,028 2,731 0.5 1.1 -599 -499 Eliminated
Amara Raja Batteries Ltd. 2,867 3,302 2,064 0.1 0.2 3,744 1,720 Qualifies
Ambuja Cements Ltd. 12,971 18,286 6,477 0.0 0.0 23,754 5,397 Eliminated
Amtek Auto Ltd. 4,507 7,171 -2,370 1.4 5.9 -6,681 -5,567 Eliminated
Amtek India Ltd. 1,563 2,322 -3,088 1.4 5.0 5,648 -2,573 Eliminated
Anant Raj Ltd. 1,010 -1,095 -1,628 0.4 5.8 1,636 -1,356 Eliminated
Anukaran Commercial Enterprises - -28 -28 - - 37 -23 Eliminated
Apollo Hospitals Enterprise Ltd. 3,091 3,371 -413 0.4 1.6 5,144 -345 Eliminated
Apollo Tyres Ltd. 3,125 7,700 2,955 0.9 2.2 -628 -523 Eliminated
Arvind Ltd. 2,612 3,987 2,680 1.0 2.7 -3,056 -2,547 Eliminated
Asahi India Glass Ltd. -918 2,700 1,692 14.8 8.0 45 38 Eliminated
Ashok Leyland Ltd. 4,337 6,851 772 1.4 3.4 611 509 Eliminated
Asian Paints Ltd. 10,500 10,811 2,000 0.0 0.0 7,284 1,667 Qualifies
Astral Poly Technik Ltd. 595 688 232 0.4 0.8 114 95 Qualifies
Astrazeneca Pharma India Ltd. -895 -76 -300 0.0 -0.0 -94 -250 Eliminated
Atul Ltd. 1,355 1,671 879 0.5 1.3 -1,116 -930 Eliminated
Aurobindo Pharma Ltd. 4,960 6,249 3,044 0.9 2.6 878 732 Eliminated
B A S F India Ltd. 1,141 2,304 524 0.3 1.3 -351 -292 Eliminated
B E M L Ltd. -799 -1,385 -2,743 0.6 6.4 -479 -2,286 Eliminated
B F Utilities Ltd. 49 138 137 1.3 5.0 -269 -224 Eliminated
B G R Energy Systems Ltd. 1,637 718 -151 1.8 4.3 6,568 -126 Eliminated
B S Ltd. 564 613 176 1.0 2.1 701 146 Eliminated
Bajaj Auto Ltd. 30,436 19,231 1,337 0.0 0.0 35,490 1,114 Qualifies
Bajaj Corp Ltd. 1,674 1,234 29 - - 2,919 24 Eliminated
Bajaj Electricals Ltd. 512 1,285 734 0.2 0.9 -633 -527 Eliminated
Bajaj Hindusthan Ltd. -2,346 -12,663 -13,751 1.4 8.3 -26,058 -21,715 Eliminated
Bajaj Holdings & Invst. Ltd. 6,633 5,063 1,411 - - 32,381 1,176 Qualifies
Balkrishna Industries Ltd. 3,558 5,501 702 1.5 3.0 -17,784 -14,820 Eliminated
Ballarpur Industries Ltd. 332 1,597 -56 0.5 5.2 -7 -46 Eliminated

Institutional EYE Special report | 2014
Dividends iias.in 9
Source: CMIE, IiAS Research
Note: A negative debt to networth or debt to PBITDA indicates that a company has a negative networth or PBITDA as per
latest available financials on CMIE
Company Name (Rs. mn) Standalone
Financials
PAT > =
500CFO > 0
CFO - 75% (Average
Capex) - FY13 total
dividend - FY13
preference dividend
> 0
Debt/
Networth
<=1
Debt/
PBITDA
<= 2
Cash & cash
equivalents -
Contingent
liabilities > 0
Excess cash
available > 0
Qualititive
factors,
Quarterly
PAT etc.
Balmer Lawrie & Co. Ltd. 1,628 1,187 285 - - 1,669 238 Qualifies
Balrampur Chini Mills Ltd. 1,620 5,554 4,768 1.3 3.8 2,210 1,842 Eliminated
Bata India Ltd. 1,716 1,846 851 - - 1,678 709 Qualifies
Bayer Cropscience Ltd. 11,617 -1,294 -203 - - 7,939 -169 Eliminated
Berger Paints India Ltd. 2,098 1,766 8 0.3 0.8 -755 -629 Eliminated
Bharat Electronics Ltd. 8,898 -16,618 -20,079 0.0 0.0 51,800 -16,733 Eliminated
Bharat Forge Ltd. 3,056 4,232 1,150 0.8 2.2 4,801 958 Eliminated
Bharat Heavy Electricals Ltd. 66,147 18,648 -6,784 0.0 0.1 43,535 -5,654 Eliminated
Bharat Petroleum Corpn. Ltd. 26,429 54,218 24,194 1.4 2.7 -1,624 -1,353 Eliminated
Bharti Airtel Ltd. 50,963 1,38,839 58,042 0.3 0.9 -5,98,761 -4,98,968 Eliminated
Bharti Infratel Ltd. 10,098 21,721 3,252 - - 34,915 2,710 Qualifies
Bhushan Steel Ltd. 9,089 -2,156 -39,182 3.2 8.5 -2,206 -32,652 Eliminated
Biocon Ltd. 2,757 3,318 382 0.1 0.3 5,033 319 Qualifies
Birla Corporation Ltd. 2,698 1,884 -1,507 0.5 2.3 12,679 -1,256 Eliminated
Blue Dart Express Ltd. 1,887 1,814 -485 - - 2,366 -404 Eliminated
Blue Star Ltd. 517 385 -244 0.8 2.5 -2,201 -1,834 Eliminated
Bombay Burmah Trdg. Corpn. 189 -263 -6 0.6 3.5 163 -5 Eliminated
Bombay Dyeing & Mfg. Co. Ltd. 757 3,225 2,794 2.7 6.7 -1,914 -1,595 Eliminated
Bombay Rayon Fashions Ltd. 1,888 5,101 -141 1.3 4.7 521 -118 Eliminated
Bosch Ltd. 9,583 9,335 3,217 0.0 0.1 29,638 2,681 Qualifies
Britannia Industries Ltd. 2,339 2,778 532 0.4 0.6 -989 -824 Eliminated
Byke Hospitality Ltd. 78 150 -12 0.3 1.1 25 -10 Eliminated
C E S C Ltd. 6,185 15,927 9,126 0.7 2.1 8,850 7,375 Eliminated
C M C Ltd. 1,984 243 -1,131 - - -118 -942 Eliminated
C Mahendra Exports Ltd. 312 204 161 1.8 6.8 -744 -620 Eliminated
Cadila Healthcare Ltd. 4,986 4,232 -384 0.6 2.3 -10,215 -8,513 Eliminated
Cairn India Ltd. 1,47,468 1,34,442 97,488 0.0 0.0 93,470 77,892 Eliminated
Carborundum Universal Ltd. 745 1,179 487 0.2 0.8 -2,737 -2,281 Eliminated
Ceat Ltd. 1,064 5,606 3,693 1.4 2.3 -609 -507 Eliminated
Century Textiles & Inds. Ltd. -345 4,856 -2,978 2.7 7.4 -13,045 -10,871 Eliminated
Chambal Fertilisers & Chemicals 3,056 -12,529 -13,945 2.6 5.3 200 -11,620 Eliminated
Chennai Petroleum Corpn. Ltd. -17,668 -13,543 -17,609 2.9 -11.6 -2,385 -14,674 Eliminated
Cipla Ltd. 15,071 13,553 6,690 0.1 0.4 -32,712 -27,260 Eliminated
Clariant Chemicals (India) Ltd. 1,013 766 312 - - 1,741 260 Qualifies
Claris Lifesciences Ltd. 744 2,478 547 0.6 2.2 -705 -587 Eliminated
Coal India Ltd. 97,943 1,05,430 16,679 0.1 0.1 1,65,079 13,899 Eliminated
Colgate-Palmolive (India) Ltd. 4,968 5,531 369 - - 4,284 308 Qualifies
Container Corpn. Of India Ltd. 9,400 9,196 3,716 0.0 0.0 -2,31,924 -1,93,270 Eliminated
Coromandel International Ltd. 4,440 9,984 7,317 1.0 2.2 -1,627 -1,356 Eliminated
Cox & Kings Ltd. 534 132 -496 0.5 3.0 -26,700 -22,250 Eliminated
Cressanda Solutions Ltd. 4 -16 -16 - - 2 -13 Eliminated
Crompton Greaves Ltd. 4,458 1,687 -252 0.0 0.0 -4,897 -4,080 Eliminated
Cummins India Ltd. 7,641 5,286 -396 - - 7,210 -330 Eliminated
D B Corp Ltd. 2,306 2,305 329 0.1 0.4 1,740 274 Qualifies
D B Realty Ltd. 3 -690 -753 0.1 8.0 -20,832 -17,360 Eliminated
D C M Shriram Ltd. 1,905 2,719 2,114 1.1 2.9 1,064 886 Eliminated
D L F Ltd. 5,016 -1,291 -8,702 1.1 5.4 -92,419 -77,016 Eliminated
Dabur India Ltd. 5,910 6,630 2,850 0.2 0.3 -5,772 -4,810 Eliminated
Deepak Fertilisers & Petrochemicals
Corpn. Ltd. 1,469 2,231 359 0.9 2.7 2,677 299 Eliminated
Delta Corp Ltd. 216 562 518 0.0 0.0 -2,280 -1,900 Eliminated

Institutional EYE Special report | 2014
Dividends iias.in 10
Source: CMIE, IiAS Research
Note: A negative debt to networth or debt to PBITDA indicates that a company has a negative networth or PBITDA as per
latest available financials on CMIE
Company Name (Rs. mn) Standalone
Financials
PAT > =
500CFO > 0
CFO - 75% (Average
Capex) - FY13 total
dividend - FY13
preference dividend
> 0
Debt/
Networth
<=1
Debt/
PBITDA
<= 2
Cash & cash
equivalents -
Contingent
liabilities > 0
Excess cash
available > 0
Qualititive
factors,
Quarterly
PAT etc.
Den Networks Ltd. 450 197 -946 0.9 4.4 3,208 -789 Eliminated
Dish T V India Ltd. -658 6,140 245 -10.5 2.4 3,350 204 Eliminated
Dishman Pharmaceuticals &
Chemicals Ltd. 632 602 -216 0.7 2.7 -4,055 -3,379 Eliminated
Divi'S Laboratories Ltd. 6,114 4,828 519 0.0 0.0 2,962 433 Qualifies
Dr. Reddy'S Laboratories Ltd. 12,655 2,888 -4,778 0.3 0.9 -5,852 -4,877 Eliminated
E I D-Parry (India) Ltd. 3,317 -918 -2,532 1.4 2.8 -463 -2,110 Eliminated
E I H Ltd. 510 1,244 -31 0.2 1.8 -2,216 -1,847 Eliminated
Eclerx Services Ltd. 1,559 1,188 153 - - 2,024 128 Qualifies
Eicher Motors Ltd. 2,786 3,667 2,009 0.0 0.1 7,855 1,674 Qualifies
Elder Pharmaceuticals Ltd. 937 -279 -1,061 1.5 4.0 -1,153 -961 Eliminated
Electrosteel Steels Ltd. -2,800 647 -10,138 4.1 -109.2 393 -8,448 Eliminated
Elgi Equipments Ltd. 713 20 -498 0.0 0.2 143 -415 Eliminated
Emami Ltd. 3,238 3,074 1,125 0.1 0.2 3,663 938 Qualifies
Engineers India Ltd. 6,286 3,441 729 - - 22,338 608 Qualifies
Entertainment Network (India) 677 862 788 - - 3,290 657 Qualifies
Era Infra Engg. Ltd. 1,683 2,210 15 2.4 5.0 -15,995 -13,329 Eliminated
Eros International Media Ltd. 1,171 4,072 193 0.5 0.6 1,586 161 Qualifies
Escorts Ltd. 696 554 -166 0.4 2.4 -25 -139 Eliminated
Ess Dee Aluminium Ltd. 764 1,094 134 0.5 1.9 -224 -187 Eliminated
Essar Oil Ltd. -11,804 -7,912 -31,353 36.8 6.1 13,424 -26,127 Eliminated
Essar Ports Ltd. -384 1,933 1,352 0.2 12.6 -15,403 -12,836 Eliminated
Exide Industries Ltd. 5,228 3,597 -1,273 - - 1,689 -1,061 Eliminated
F A G Bearings India Ltd. 1,592 1,344 479 - - 1,257 399 Qualifies
F D C Ltd. 1,583 1,431 780 0.0 0.0 4,459 650 Qualifies
Financial Technologies (India) 3,229 3,220 2,179 0.2 1.3 8,793 1,816 Eliminated
Finolex Cables Ltd. 1,453 1,572 1,046 0.2 0.7 -741 -618 Eliminated
Finolex Industries Ltd. 1,361 2,678 1,348 0.4 0.8 874 728 Qualifies
Firstsource Solutions Ltd. 1,360 3,300 3,107 0.1 0.5 -14,430 -12,025 Eliminated
Fortis Healthcare Ltd. 173 15 -386 0.3 5.3 -27,108 -22,590 Eliminated
Future Lifestyle Fashions Ltd. -3 -6 -6 - - 2 -5 Eliminated
Future Retail Ltd. 2,733 -49 -3,447 1.1 3.3 -2,454 -2,872 Eliminated
G A I L (India) Ltd. 40,222 50,334 -5,734 0.4 1.2 -86,696 -72,247 Eliminated
G M R Infrastructure Ltd. 535 -1,145 -1,818 0.6 9.0 -1,57,622 -1,31,352 Eliminated
G V K Power & Infrastructure -240 296 293 0.2 10.1 -72,860 -60,717 Eliminated
Gateway Distriparks Ltd. 576 656 -181 0.0 0.2 -2,883 -2,402 Eliminated
Geometric Ltd. 344 174 44 - - -1,804 -1,503 Eliminated
Gillette India Ltd. 872 221 -660 0.0 0.0 -1,181 -984 Eliminated
Gitanjali Gems Ltd. 2,652 10,158 9,882 1.1 5.2 -26,042 -21,702 Eliminated
Glaxosmithkline Consumer Healthcare 4,368 5,305 2,391 - - 11,796 1,992 Qualifies
Glaxosmithkline Pharmaceuticals 5,773 2,354 -2,767 0.0 0.0 18,723 -2,306 Eliminated
Glenmark Pharmaceuticals Ltd. 3,861 2,849 1,523 0.2 1.3 1,169 974 Qualifies
Global Infratech & Finance Ltd. 11 -239 -239 0.3 5.4 8 -199 Eliminated
Godfrey Phillips India Ltd. 1,695 1,744 -179 0.3 0.8 2,674 -150 Eliminated
Godrej Consumer Products Ltd. 5,109 5,538 665 0.1 0.4 -23,556 -19,630 Eliminated
Godrej Industries Ltd. 967 70 -2,079 0.6 4.6 4,368 -1,733 Eliminated
Godrej Properties Ltd. 1,227 1,165 704 0.6 3.2 -3,162 -2,635 Eliminated
Goenka Diamond & Jewels Ltd. 212 -200 -260 0.5 4.3 183 -216 Eliminated
Graphite India Ltd. 1,631 -7 -1,481 0.4 1.9 1,634 -1,234 Eliminated
Grasim Industries Ltd. 12,260 8,366 -2,197 0.1 0.7 19,298 -1,831 Eliminated
Great Eastern Shipping Co. Ltd. 1,463 4,917 2,983 0.7 4.9 30,585 2,485 Eliminated

Institutional EYE Special report | 2014
Dividends iias.in 11
Source: CMIE, IiAS Research
Note: A negative debt to networth or debt to PBITDA indicates that a company has a negative networth or PBITDA as per
latest available financials on CMIE
Company Name (Rs. mn) Standalone
Financials
PAT > =
500CFO > 0
CFO - 75% (Average
Capex) - FY13 total
dividend - FY13
preference dividend
> 0
Debt/
Networth
<=1
Debt/
PBITDA
<= 2
Cash & cash
equivalents -
Contingent
liabilities > 0
Excess cash
available > 0
Qualititive
factors,
Quarterly
PAT etc.
Greaves Cotton Ltd. 1,380 1,046 290 0.0 0.0 743 242 Eliminated
Greenply Industries Ltd. 1,142 2,147 1,432 1.3 2.3 -2,197 -1,830 Eliminated
Grindwell Norton Ltd. 977 947 5 - - -104 -87 Eliminated
Gujarat Alkalies & Chemicals Ltd. 2,354 4,234 2,335 0.1 0.5 -574 -478 Eliminated
Gujarat Fluorochemicals Ltd. 3,983 3,671 -1,567 0.3 1.0 2,203 -1,306 Eliminated
Gujarat Gas Co. Ltd. 2,867 3,278 1,225 - - 3,607 1,021 Qualifies
Gujarat Mineral Devp. Corpn. Ltd. 6,008 2,200 -792 - - -1,834 -1,528 Eliminated
Gujarat N R E Coke Ltd. 310 -1,492 -2,204 1.2 5.8 -31,677 -26,398 Eliminated
Gujarat Narmada Valley Fertilizers &
Chemicals Ltd. 2,731 -1,689 -7,960 1.2 5.0 2,979 -6,633 Eliminated
Gujarat Pipavav Port Ltd. 740 2,621 1,939 0.3 1.6 672 560 Qualifies
Gujarat State Fertilizers & Chemicals 5,181 -8,933 -13,088 0.4 1.5 2,979 -10,907 Eliminated
Gujarat State Petronet Ltd. 5,381 6,927 3,344 0.5 1.4 5,769 2,787 Qualifies
Gulf Oil Corpn. Ltd. 530 409 172 0.7 2.1 121 101 Eliminated
H C L Infosystems Ltd. -813 2,325 1,790 0.6 4.6 4,572 1,492 Eliminated
H C L Technologies Ltd. 36,112 38,817 24,472 0.1 0.1 14,473 12,061 Qualifies
H M T Ltd. -1,454 -184 -191 -15.7 -25.6 -111 -159 Eliminated
H T Media Ltd. 242 1,668 1,182 0.3 2.9 8,020 985 Eliminated
Hathway Cable & Datacom Ltd. 32 358 -1,299 0.9 3.2 -1,046 -1,083 Eliminated
Hatsun Agro Products Ltd. 447 1,402 649 3.1 2.7 310 258 Eliminated
Havells India Ltd. 3,714 3,645 1,553 0.1 0.2 -2,014 -1,678 Eliminated
Hawkins Cookers Ltd. 341 230 -108 0.4 0.4 478 -90 Eliminated
Hero Motocorp Ltd. 21,182 17,447 -233 0.2 0.3 37,034 -194 Eliminated
Hexaware Technologies Ltd. 2,856 1,720 -303 - - 3,605 -252 Eliminated
Himachal Futuristic Communications 548 843 690 0.5 2.1 3,730 575 Eliminated
Hindalco Industries Ltd. 16,992 -3,523 -52,683 0.7 7.3 61,238 -43,903 Eliminated
Hinduja Global Solutions Ltd. 540 978 216 0.2 1.1 -1,749 -1,457 Eliminated
Hindustan Construction Co. Ltd. -1,376 3,406 2,332 4.0 8.9 -21,488 -17,907 Eliminated
Hindustan Copper Ltd. 3,556 2,000 -392 - - 460 -327 Eliminated
Hindustan Petroleum Corpn. Ltd. 9,047 11,496 -22,565 2.5 5.2 2,765 -18,804 Eliminated
Hindustan Unilever Ltd. 37,967 29,541 -17,053 - - 31,111 -14,211 Eliminated
Hindustan Zinc Ltd. 68,995 47,517 20,080 0.0 0.0 1,94,322 16,733 Qualifies
Honeywell Automation India Ltd. 852 -173 -377 - - 607 -314 Eliminated
Housing Development &
Infrastructure Ltd. 1,454 5,190 5,105 0.3 2.7 -13,408 -11,174 Eliminated
I I F L Holdings Ltd. 958 490 -500 - - -54,964 -45,803 Eliminated
I L & F S Transportation Networks 2,712 -450 -1,411 1.8 4.4 -13,561 -11,301 Eliminated
I R B Infrastructure Developers 1,873 4,669 3,340 1.1 3.9 -62,092 -51,744 Eliminated
I T C Ltd. 74,184 61,398 -1,336 0.0 0.0 91,900 -1,113 Eliminated
I V R C L Ltd. -1,017 3,616 3,183 1.3 7.7 -11,942 -9,951 Eliminated
Idea Cellular Ltd. 8,183 57,083 16,964 0.9 2.4 -60,373 -50,311 Eliminated
India Cements Ltd. 1,636 6,665 2,975 0.8 3.6 -10,884 -9,070 Eliminated
Indiabulls Power Ltd. -263 4,125 -5,357 0.6 -1,115.3 1,854 -4,465 Eliminated
Indiabulls Real Estate Ltd. 2,686 1,863 983 0.2 2.2 -8,912 -7,427 Eliminated
Indian Hotels Co. Ltd. -2,766 3,320 1,297 0.8 5.3 -9,490 -7,909 Eliminated
Indian Infotech & Software Ltd. 0 -4 -4 0.0 0.9 1,624 -3 Eliminated
Indian Oil Corpn. Ltd. 50,052 1,15,845 2,913 1.3 4.1 33,417 2,428 Eliminated
Indraprastha Gas Ltd. 3,541 6,433 1,160 0.3 0.6 1,923 967 Qualifies
Info Edge (India) Ltd. 1,023 985 621 0.0 0.0 4,394 517 Qualifies
Infosys Ltd. 91,160 65,040 26,428 - - 1,66,600 22,023 Qualifies
Infotech Enterprises Ltd. 1,843 1,371 255 - - 4,225 213 Qualifies
Ingersoll-Rand (India) Ltd. 779 474 9 - - 4,307 7 Eliminated

Institutional EYE Special report | 2014
Dividends iias.in 12
Source: CMIE, IiAS Research
Note: A negative debt to networth or debt to PBITDA indicates that a company has a negative networth or PBITDA as per
latest available financials on CMIE
Company Name (Rs. mn) Standalone
Financials
PAT > =
500CFO > 0
CFO - 75% (Average
Capex) - FY13 total
dividend - FY13
preference dividend
> 0
Debt/
Networth
<=1
Debt/
PBITDA
<= 2
Cash & cash
equivalents -
Contingent
liabilities > 0
Excess cash
available > 0
Qualititive
factors,
Quarterly
PAT etc.
Inox Leisure Ltd. 185 713 360 0.6 2.7 -1,534 -1,278 Eliminated
International Paper A P P M Ltd. -237 1,741 1,279 1.0 3.5 -907 -756 Eliminated
Ipca Laboratories Ltd. 3,314 3,869 1,420 0.4 1.0 466 388 Qualifies
J B Chemicals & Pharmaceuticals 849 809 137 0.0 0.3 5,443 114 Qualifies
J B F Industries Ltd. 515 3,589 1,925 1.7 3.3 -2,428 -2,023 Eliminated
J K Cement Ltd. 2,336 4,196 1,649 0.9 2.1 -330 -275 Eliminated
J K Lakshmi Cement Ltd. 1,757 3,323 -483 1.1 2.9 3,689 -402 Eliminated
J S W Energy Ltd. 9,930 9,740 -1,061 0.8 2.2 -9,538 -7,948 Eliminated
J S W Holdings Ltd. 217 -264 -264 - - 699 -220 Eliminated
J S W Steel Ltd. 18,012 39,247 3,240 0.9 2.7 -40,685 -33,904 Eliminated
Jagran Prakashan Ltd. 2,205 1,899 169 0.5 1.4 1,604 140 Eliminated
Jai Corp Ltd. 749 -97 -238 0.0 0.1 9,407 -199 Eliminated
Jain Irrigation Systems Ltd. 301 3,728 878 1.2 4.0 -4,452 -3,710 Eliminated
Jaiprakash Associates Ltd. 5,013 35,145 -2,313 1.9 6.7 -18,278 -15,232 Eliminated
Jaiprakash Power Ventures Ltd. 3,292 24,153 -15,182 2.8 10.0 -2,993 -12,652 Eliminated
Jaypee Infratech Ltd. 6,945 9,285 -1,835 1.3 5.4 2,543 -1,529 Eliminated
Jet Airways (India) Ltd. -4,855 18,390 23,214 -11.6 5.9 -18,395 -15,330 Eliminated
Jindal Saw Ltd. 1,934 3,126 -1,590 0.9 5.7 -9,318 -7,765 Eliminated
Jindal Stainless Ltd. -8,208 1,048 -5,145 7.5 16.4 -12,098 -10,082 Eliminated
Jindal Steel & Power Ltd. 15,926 10,215 -25,169 1.7 4.0 -92,603 -77,169 Eliminated
Jubilant Foodworks Ltd. 1,351 2,098 1,152 0.0 0.0 1,207 960 Qualifies
Jubilant Life Sciences Ltd. -433 8,258 4,540 1.5 5.3 -5,800 -4,833 Eliminated
Just Dial Ltd. 685 1,023 831 - - 5,082 693 Qualifies
Jyothy Laboratories Ltd. 440 44 -542 0.8 3.5 -697 -581 Eliminated
K E C International Ltd. 46 -1,508 -2,161 1.1 2.7 -7,698 -6,415 Eliminated
K P I T Technologies Ltd. 1,031 1,164 696 0.3 1.2 1,610 580 Qualifies
K S K Energy Ventures Ltd. 133 664 679 0.4 7.1 -25,577 -21,314 Eliminated
Kajaria Ceramics Ltd. 1,006 1,153 311 0.6 1.0 -354 -295 Eliminated
Kalpataru Power Transmission 1,377 1,833 779 0.3 1.5 -313 -261 Eliminated
Kansai Nerolac Paints Ltd. 2,922 2,140 -125 0.1 0.1 1,117 -104 Eliminated
Kappac Pharma Ltd. -1 85 85 - - 196 71 Eliminated
Kaveri Seed Co. Ltd. 1,299 1,011 603 0.0 0.0 1,493 502 Qualifies
Kesoram Industries Ltd. -3,292 4,480 1,160 8.3 10.1 -3,050 -2,542 Eliminated
Kingfisher Airlines Ltd. -43,011 -14,288 -14,991 -0.8 -4.4 -21,803 -18,169 Eliminated
Kirloskar Brothers Ltd. 585 1,709 1,195 0.3 1.8 -3,850 -3,208 Eliminated
Kirloskar Oil Engines Ltd. 1,988 2,061 422 - - 2,662 352 Qualifies
Kolte Patil Developers Ltd. 657 159 -151 0.2 1.6 -1,007 -840 Eliminated
Lakshmi Machine Works Ltd. 1,175 894 -151 - - 7,780 -126 Eliminated
Lanco Infratech Ltd. 133 2,098 -303 1.3 6.2 -1,86,962 -1,55,802 Eliminated
Larsen & Toubro Ltd. 49,107 20,653 -2,383 0.3 1.0 -54,114 -45,095 Eliminated
Linde India Ltd. 895 942 -1,949 0.8 3.8 164 -1,624 Eliminated
Lovable Lingerie Ltd. 189 125 4 0.1 0.4 825 4 Eliminated
Luminaire Technologies Ltd. -2 -2 -2 0.0 -12.8 1 -2 Eliminated
Lupin Ltd. 12,604 9,850 4,883 0.1 0.4 -2,883 -2,403 Eliminated
M M T C Ltd. -706 5,404 5,280 1.1 12.2 -10,782 -8,985 Eliminated
M O I L Ltd. 4,317 3,434 2,015 - - 22,666 1,679 Qualifies
M R F Ltd. 8,022 14,223 8,821 0.4 0.9 10,300 7,351 Qualifies
Mahanagar Telephone Nigam Ltd. -53,211 -3,742 -10,082 -4.3 -4.6 -22,836 -19,030 Eliminated
Maharashtra Seamless Ltd. 1,533 2,793 1,520 0.0 0.3 6,184 1,267 Eliminated
Mahindra & Mahindra Ltd. 33,528 40,446 21,903 0.2 0.7 5,192 4,327 Qualifies

Institutional EYE Special report | 2014
Dividends iias.in 13
Source: CMIE, IiAS Research
Note: A negative debt to networth or debt to PBITDA indicates that a company has a negative networth or PBITDA as per
latest available financials on CMIE
Company Name (Rs. mn) Standalone
Financials
PAT > =
500CFO > 0
CFO - 75% (Average
Capex) - FY13 total
dividend - FY13
preference dividend
> 0
Debt/
Networth
<=1
Debt/
PBITDA
<= 2
Cash & cash
equivalents -
Contingent
liabilities > 0
Excess cash
available > 0
Qualititive
factors,
Quarterly
PAT etc.
Mahindra C I E Automotive Ltd. 409 861 730 0.0 0.5 -119 -99 Eliminated
Mahindra Holidays & Resorts 1,070 2,078 936 0.0 0.0 -8,094 -6,745 Eliminated
Mahindra Lifespace Developers 975 -1,535 -1,781 0.3 2.4 1,717 -1,484 Eliminated
Mandhana Industries Ltd. 653 -165 -974 1.8 3.9 159 -812 Eliminated
Mangalore Refinery & Petrochemicals -7,569 9,806 -15,675 1.2 7.5 7,781 -13,062 Eliminated
Marico Ltd. 4,291 4,444 3,387 0.4 1.2 -3,947 -3,289 Eliminated
Maruti Suzuki India Ltd. 23,921 43,491 18,637 0.1 0.3 39,505 15,530 Qualifies
Max India Ltd. 5,615 -2,440 -6,408 0.1 0.2 -6,130 -5,340 Eliminated
Mcleod Russel India Ltd. 2,257 1,343 -125 0.2 0.6 676 -104 Eliminated
Mindtree Ltd. 3,389 2,663 1,499 0.0 0.1 4,348 1,249 Qualifies
Monnet Ispat & Energy Ltd. 2,503 3,166 -6,706 2.3 10.7 3,684 -5,589 Eliminated
Monsanto India Ltd. 673 838 322 - - 1,817 268 Qualifies
Motherson Sumi Systems Ltd. 4,696 5,856 1,930 0.6 1.1 -12,024 -10,020 Eliminated
Mphasis Ltd. 5,395 7,631 2,894 - - 17,065 2,412 Qualifies
Multi Commodity Exchange Of India
Ltd. 2,986 423 -1,240 - - 12,801 -1,034 Eliminated
N C C Ltd. 627 3,722 2,732 0.9 3.5 -21,902 -18,252 Eliminated
N H P C Ltd. 23,482 17,722 -11,590 0.7 3.8 67,301 -9,658 Eliminated
N I I T Technologies Ltd. 1,679 1,234 187 0.0 0.0 -833 -694 Eliminated
N M D C Ltd. 63,424 27,337 -15,112 - - 2,00,525 -12,594 Eliminated
N T P C Ltd. 1,26,194 1,41,742 -8,719 0.7 2.6 1,15,035 -7,266 Eliminated
Natco Pharma Ltd. 781 700 -264 0.6 2.0 84 -220 Eliminated
National Aluminium Co. Ltd. 5,928 8,762 -593 - - 32,066 -494 Eliminated
Nava Bharat Ventures Ltd. 2,383 1,559 455 0.1 0.4 -3,112 -2,593 Eliminated
Navneet Education Ltd. 1,111 125 -674 0.4 0.9 23 -562 Eliminated
Nesco Ltd. 817 552 217 - - 2,554 181 Qualifies
Nestle India Ltd. 10,679 16,207 3,334 0.6 0.6 6,018 2,778 Qualifies
Network18 Media & Invst. Ltd. -299 -686 -491 0.1 2.0 777 -409 Eliminated
Neyveli Lignite Corpn. Ltd. 14,598 12,199 2,775 0.3 1.2 9,854 2,312 Qualifies
Nitin Fire Protection Inds. Ltd. 175 333 222 1.5 4.6 405 185 Eliminated
Novartis India Ltd. 1,197 23 -378 0.0 0.0 -359 -315 Eliminated
Oberoi Realty Ltd. 3,275 -562 -2,238 - - 8,182 -1,865 Eliminated
Oil & Natural Gas Corpn. Ltd. 2,09,257 3,06,857 14,115 - - -2,01,826 -1,68,188 Eliminated
Oil India Ltd. 35,893 8,314 -20,170 0.1 0.2 1,25,338 -16,809 Eliminated
Omaxe Ltd. 859 4,049 3,824 0.8 3.4 -490 -408 Eliminated
Opto Circuits (India) Ltd. 2,410 -930 -1,079 0.6 2.9 -5,830 -4,858 Eliminated
Oracle Financial Services Software 10,293 11,775 11,323 - - 50,240 9,436 Qualifies
Orchid Chemicals & Pharmaceuticals
Ltd. -5,302 1,749 -2,559 7.0 12.3 -452 -2,132 Eliminated
Orient Cement Ltd. 1,617 2,630 2,134 0.2 0.5 -219 -182 Eliminated
Out Of City Travel Solutions Ltd. -1 -87 -89 - - 100 -74 Eliminated
P C Jeweller Ltd. 2,907 5,196 4,769 0.2 0.5 7,208 3,974 Qualifies
P I Industries Ltd. 963 1,026 -18 0.4 1.1 -2,733 -2,278 Eliminated
P T C India Ltd. 1,287 4,519 3,955 - - 4,434 3,296 Qualifies
P V R Ltd. 549 1,120 330 0.6 3.0 -211 -176 Eliminated
Page Industries Ltd. 1,125 871 -24 0.5 0.5 -97 -81 Eliminated
Parsvnath Developers Ltd. 737 2,894 2,396 0.6 3.9 -3,440 -2,867 Eliminated
Peninsula Land Ltd. 1,970 4,592 4,017 0.6 2.7 3,860 3,217 Eliminated
Persistent Systems Ltd. 1,818 1,883 782 0.0 0.0 -739 -616 Eliminated
Petronet L N G Ltd. 11,493 18,234 9,322 0.7 1.5 13,184 7,769 Qualifies
Pfizer Ltd. 5,032 -86 -185 - - 10,212 -154 Eliminated
Phoenix Mills Ltd. 1,339 1,588 383 0.2 1.1 1,049 319 Qualifies
Pidilite Industries Ltd. 4,608 5,127 2,590 0.0 0.1 2,300 1,917 Qualifies

Institutional EYE Special report | 2014
Dividends iias.in 14
Source: CMIE, IiAS Research
Note: A negative debt to networth or debt to PBITDA indicates that a company has a negative networth or PBITDA as per
latest available financials on CMIE
Company Name (Rs. mn) Standalone
Financials
PAT > =
500CFO > 0
CFO - 75% (Average
Capex) - FY13 total
dividend - FY13
preference dividend
> 0
Debt/
Networth
<=1
Debt/
PBITDA
<= 2
Cash & cash
equivalents -
Contingent
liabilities > 0
Excess cash
available > 0
Qualititive
factors,
Quarterly
PAT etc.
Pipavav Defence & Offshore Engg. Co 287 6,103 -570 2.3 7.8 2,887 -475 Eliminated
Piramal Enterprises Ltd. -2,316 -11,162 22,217 0.4 27.0 31,987 18,514 Eliminated
Polaris Financial Technology Ltd. 1,671 1,127 -339 0.1 0.4 2,419 -283 Eliminated
Power Grid Corpn. Of India Ltd. 42,345 1,08,285 -36,375 2.6 5.9 -8,468 -30,313 Eliminated
Praj Industries Ltd. 662 203 -413 0.0 0.0 1,821 -345 Eliminated
Prestige Estates Projects Ltd. 2,761 76 -876 0.6 3.0 -14,755 -12,296 Eliminated
Prime Focus Ltd. -592 635 291 1.0 5.3 -3,043 -2,535 Eliminated
Prism Cement Ltd. -595 2,359 118 1.5 5.6 -2,755 -2,296 Eliminated
Procter & Gamble Hygiene & Health
Care Ltd. 2,032 924 -392 0.0 0.0 718 -326 Eliminated
Punj Lloyd Ltd. 196 -1,623 -3,665 1.3 5.4 -44,170 -36,808 Eliminated
Puravankara Projects Ltd. 1,123 1,808 1,086 1.0 4.0 -626 -522 Eliminated
Radico Khaitan Ltd. 773 499 -138 1.1 3.4 -1,806 -1,505 Eliminated
Rain Industries Ltd. 564 556 339 1.0 4.0 -4,403 -3,669 Eliminated
Rainbow Papers Ltd. 354 787 -968 2.0 7.6 182 -806 Eliminated
Rajesh Exports Ltd. 4,526 28,486 28,177 1.1 3.4 97,123 23,481 Eliminated
Rallis India Ltd. 1,194 1,461 449 0.1 0.4 -505 -421 Eliminated
Ramco Cements Ltd. 4,037 6,681 1,693 1.1 2.5 -5,825 -4,854 Eliminated
Ranbaxy Laboratories Ltd. -1,623 6,413 4,359 2.5 7.7 23,131 3,633 Eliminated
Rashtriya Chemicals & Fertilizers 2,809 -5,877 -8,411 0.7 2.4 -1,638 -7,009 Eliminated
Rasoya Proteins Ltd. 207 -342 -695 0.8 4.3 125 -579 Eliminated
Raymond Ltd. -478 1,371 533 1.3 5.3 3,068 445 Eliminated
Redington (India) Ltd. 1,714 1,498 1,206 0.6 1.6 -5,343 -4,452 Eliminated
Rei Agro Ltd. 2,110 5,448 131 2.1 5.6 -10,605 -8,838 Eliminated
Reliance Communications Ltd. 6,240 27,070 -2,325 1.0 7.4 -62,750 -52,292 Eliminated
Reliance Industrial Infrastructure Ltd. 244 137 -140 - - 334 -117 Eliminated
Reliance Industries Ltd. 2,10,030 2,54,490 1,91,745 0.4 1.9 4,12,060 1,59,788 Qualifies
Reliance Infrastructure Ltd. 19,995 25,715 14,472 0.6 3.2 19,629 12,060 Eliminated
Reliance Mediaworks Ltd. -7,036 -56 -70 -10.0 -67.7 -4,130 -3,441 Eliminated
Reliance Power Ltd. 5,139 -371 86 0.1 3.2 -16,922 -14,101 Eliminated
Risa International Ltd. 0 -6 -6 0.0 3.6 4 -5 Eliminated
Rolta India Ltd. -7,374 16,294 6,251 1.6 2.3 408 340 Eliminated
Ruchi Soya Inds. Ltd. 2,363 500 -2,248 2.4 4.6 21,784 -1,874 Eliminated
S J V N Ltd. 10,523 15,531 5,623 0.3 1.2 20,147 4,686 Qualifies
S K F India Ltd. 1,901 1,990 895 - - 2,520 745 Qualifies
S R F Ltd. 2,585 3,658 409 0.5 1.6 385 321 Qualifies
S R K Industries Ltd. 19 26 -75 0.0 0.2 15 -63 Eliminated
Sadbhav Engineering Ltd. 741 689 75 0.9 3.4 -11,107 -9,256 Eliminated
Sanofi India Ltd. 1,767 2,864 153 - - 3,124 127 Qualifies
Schneider Electric Infrastructure -285 361 240 1.0 3.0 -263 -219 Eliminated
Sesa Sterlite Ltd. 1,208 -1,283 -5,487 0.3 6.2 -44,825 -37,354 Eliminated
Shasun Pharmaceuticals Ltd. 263 3 -686 1.4 5.1 -240 -572 Eliminated
Shipping Corpn. Of India Ltd. -1,143 8,087 -11,329 1.2 8.1 7,752 -9,441 Eliminated
Shoppers Stop Ltd. 392 1,124 247 0.5 2.0 -1,215 -1,013 Eliminated
Shree Cement Ltd. 10,040 12,597 5,498 0.3 0.7 25,160 4,581 Qualifies
Shree Renuka Sugars Ltd. 518 22,824 18,746 1.5 4.2 -14,571 -12,143 Eliminated
Shrenuj & Co. Ltd. 305 -1,683 -1,816 2.7 9.0 -13,636 -11,363 Eliminated
Siemens Ltd. 1,940 1,018 -3,191 0.0 0.0 3,772 -2,659 Eliminated
Sintex Industries Ltd. 2,692 5,988 3,148 1.0 4.2 2,762 2,302 Eliminated
Siti Cable Network Ltd. -618 418 -256 -13.9 11.8 1,661 -214 Eliminated
Institutional EYE Special report | 2014
Dividends iias.in 15
Source: CMIE, IiAS Research
Note: A negative debt to networth or debt to PBITDA indicates that a company has a negative networth or PBITDA as per
latest available financials on CMIE
Company Name (Rs. mn) Standalone
Financials
PAT > =
500CFO > 0
CFO - 75% (Average
Capex) - FY13 total
dividend - FY13
preference dividend
> 0
Debt/
Networth
<=1
Debt/
PBITDA
<= 2
Cash & cash
equivalents -
Contingent
liabilities > 0
Excess cash
available > 0
Qualititive
factors,
Quarterly
PAT etc.
Sobha Developers Ltd. 1,966 3,927 2,598 0.5 2.3 -5,463 -4,553 Eliminated
Solar Industries India Ltd. 758 463 -188 0.6 1.8 122 -157 Eliminated
Som Distilleries & Breweries Ltd. 178 157 16 0.1 0.3 131 13 Eliminated
Spicejet Ltd. -1,911 -538 -4,806 -8.0 55.6 4,389 -4,005 Eliminated
State Trading Corpn. Of India Ltd. 180 5,308 5,094 2.6 5.4 -3,845 -3,204 Eliminated
Steel Authority Of India Ltd. 21,704 22,437 -59,831 0.5 3.8 -26,922 -49,859 Eliminated
Sterlite Technologies Ltd. 475 2,769 1,375 0.9 3.5 -2,607 -2,173 Eliminated
Strides Arcolab Ltd. 560 102 -297 0.5 2.0 -4,520 -3,767 Eliminated
Sulabh Engineers & Services Ltd. 4 -20 -20 0.0 0.1 5 -17 Eliminated
Sun Pharma Advanced Research Co.
Ltd. -225 -954 -985 0.8 -5.5 1,037 -821 Eliminated
Sun Pharmaceutical Inds. Ltd. 5,166 351 -8,353 0.0 0.1 8,679 -6,961 Eliminated
Sun T V Network Ltd. 6,833 7,830 -492 - - 150 -410 Eliminated
Sundram Fasteners Ltd. 951 2,187 995 1.1 2.7 -196 -163 Eliminated
Sunteck Realty Ltd. 69 -720 -749 0.4 6.3 54 -624 Eliminated
Supreme Industries Ltd. 2,724 4,040 1,196 0.6 0.9 -158 -131 Eliminated
Surabhi Chemicals & Investments Ltd. 9 -1 -0 - - 144 -0 Eliminated
Suzlon Energy Ltd. -29,898 2,828 1,655 3.2 -15.2 -7,856 -6,547 Eliminated
Swan Energy Ltd. 205 -2,197 -2,347 0.9 3.4 -1,858 -1,956 Eliminated
Symphony Ltd. 627 570 245 - - 936 204 Qualifies
T T K Prestige Ltd. 1,331 973 50 0.3 0.5 -486 -405 Eliminated
T V S Motor Co. Ltd. 1,160 4,456 2,783 0.5 1.4 -1,975 -1,646 Eliminated
Tamil Nadu Newsprint & Papers Ltd. 915 6,195 3,874 1.4 3.5 -3,912 -3,260 Eliminated
Tata Chemicals Ltd. 6,433 -2,978 -8,394 0.7 2.4 -13,160 -10,966 Eliminated
Tata Coffee Ltd. 937 509 -29 0.2 0.7 -115 -96 Eliminated
Tata Communications Ltd. 4,752 15,955 10,368 0.1 0.5 -1,33,289 -1,11,075 Eliminated
Tata Consultancy Services Ltd. 1,27,863 91,570 27,042 0.0 0.0 -13,577 -11,314 Eliminated
Tata Elxsi Ltd. 210 333 -77 0.3 0.9 -5 -64 Eliminated
Tata Global Beverages Ltd. 2,587 -819 -2,594 0.2 1.3 -910 -2,161 Eliminated
Tata Motors Ltd. 3,018 22,584 -3,897 0.9 4.4 -1,22,835 -1,02,363 Eliminated
Tata Power Co. Ltd. 10,247 3,918 -7,799 0.7 3.4 -1,31,256 -1,09,380 Eliminated
Tata Steel Ltd. 50,630 1,08,829 54,084 0.5 2.2 -20,572 -17,143 Eliminated
Tata Teleservices (Maharashtra) Ltd. -6,588 2,988 -3,794 -3.5 9.5 -3,910 -3,258 Eliminated
Tech Mahindra Ltd. 6,525 6,344 2,779 0.3 1.1 -1,361 -1,134 Eliminated
Thermax Ltd. 3,500 2,071 375 0.0 0.0 4,178 313 Qualifies
Thomas Cook (India) Ltd. 492 1,032 850 0.5 1.6 487 406 Eliminated
Tilaknagar Industries Ltd. 503 -492 -1,038 1.4 4.1 -693 -865 Eliminated
Timken India Ltd. 442 131 -223 - - 332 -186 Eliminated
Titan Company Ltd. 7,252 4,279 1,226 0.0 0.0 9,212 1,022 Qualifies
Torrent Pharmaceuticals Ltd. 5,464 -687 -4,497 0.4 0.9 2,763 -3,747 Eliminated
Torrent Power Ltd. 3,850 15,131 4,535 0.8 3.2 8,786 3,779 Eliminated
Tree House Education & Accessories
Ltd. 333 -139 -743 0.2 1.0 487 -620 Eliminated
Trent Ltd. 623 409 -193 0.1 2.0 2,705 -161 Eliminated
Tribhovandas Bhimji Zaveri Ltd. 850 -3,034 -3,359 1.0 2.7 299 -2,800 Eliminated
Triveni Turbine Ltd. 1,066 702 335 0.0 0.0 279 233 Eliminated
Tube Investments Of India Ltd. 1,040 2,973 1,437 1.1 3.8 -813 -678 Eliminated
Turbotech Engineering Ltd. -0 -0 -0 0.2 -237.0 127 -0 Eliminated
Tv18 Broadcast Ltd. 102 1,751 1,688 0.1 1.7 -4,349 -3,624 Eliminated
U P L Ltd. 2,081 1,760 -1,014 0.6 3.2 -28,353 -23,627 Eliminated
Uflex Ltd. 1,385 5,071 2,906 0.7 1.8 -17,111 -14,259 Eliminated
Ultratech Cement Ltd. 26,554 35,371 13,571 0.4 1.1 4,854 4,045 Qualifies

Institutional EYE Special report | 2014
Dividends iias.in 16
Source: CMIE, IiAS Research
Note: A negative debt to networth or debt to PBITDA indicates that a company has a negative networth or PBITDA as per
latest available financials on CMIE
Company Name (Rs. mn) Standalone
Financials
PAT > =
500CFO > 0
CFO - 75% (Average
Capex) - FY13 total
dividend - FY13
preference dividend
> 0
Debt/
Networth
<=1
Debt/
PBITDA
<= 2
Cash & cash
equivalents -
Contingent
liabilities > 0
Excess cash
available > 0
Qualititive
factors,
Quarterly
PAT etc.
Unichem Laboratories Ltd. 1,296 1,759 572 0.0 0.1 298 248 Qualifies
Unitech Ltd. 1,520 5,627 5,742 0.5 7.9 -94,480 -78,733 Eliminated
United Breweries Ltd. 1,722 1,522 -2,295 0.9 2.4 -625 -1,913 Eliminated
United Spirits Ltd. 3,208 10,628 8,669 0.7 3.4 -45,699 -38,082 Eliminated
Usha Martin Ltd. 71 3,865 -1,579 1.9 5.0 -1,158 -1,316 Eliminated
Ushdev International Ltd. 796 4,116 3,902 2.1 4.6 -7,687 -6,406 Eliminated
Uttam Galva Steels Ltd. 616 8,643 5,175 1.9 3.8 814 678 Eliminated
V A Tech Wabag Ltd. 901 1,094 724 0.1 0.3 556 463 Qualifies
V I P Industries Ltd. 315 736 441 0.2 0.6 -118 -99 Eliminated
V S T Industries Ltd. 1,263 1,184 -214 - - 2,115 -178 Eliminated
Vaibhav Global Ltd. 264 483 452 0.3 0.6 -1,440 -1,200 Eliminated
Vakrangee Ltd. 1,093 784 -545 1.0 1.4 357 -454 Eliminated
Vardhman Textiles Ltd. 3,237 2,647 -675 1.3 3.2 3,907 -562 Eliminated
V-Guard Industries Ltd. 629 88 -193 0.6 1.4 14 -161 Eliminated
Videocon Industries Ltd. -716 -6,825 -14,215 2.3 6.5 1,881 -11,846 Eliminated
Voltas Ltd. 1,801 655 124 0.1 0.6 -12,051 -10,042 Eliminated
Wabco India Ltd. 1,308 902 406 - - 1,094 339 Qualifies
Whirlpool Of India Ltd. 1,278 1,440 754 - - 791 628 Qualifies
Wipro Ltd. 56,502 61,191 34,332 0.3 0.7 1,33,929 28,610 Qualifies
Wockhardt Ltd. 6,227 14,289 13,747 0.2 0.2 -9,487 -7,906 Eliminated
Wyeth Ltd. 1,301 923 462 0.0 0.0 3,471 385 Eliminated
Zee Entertainment Enterprises 6,407 6,704 3,901 0.0 0.0 -9,825 -8,188 Eliminated
Zee Learn Ltd. -212 -398 -522 1.4 -38.2 -1,157 -965 Eliminated
Zydus Wellness Ltd. 971 735 422 - - 1,449 352 Qualifies

Institutional EYE Special report | 2014
Dividends iias.in 17
Disclaimer
This document has been prepared by Institutional Investor Advisory Services India Limited (IiAS). The information contained herein is
from publicly available data or other sources believed to be reliable, but we do not represent that it is accurate or complete and it
should not be relied on as such. IiAS shall not be in any way responsible for any loss or damage that may arise to any person from any
inadvertent error in the information contained in this report. This document is provided for assistance only and is not intended to be
and must not alone be taken as the basis for any investment decision. The discussions or views expressed may not be suitable for all
investors. This information is strictly confidential and is being furnished to you solely for your information. This information should
not be reproduced or redistributed or passed on directly or indirectly in any form to any other person or published, copied, in whole or
in part, for any purpose. This report is not directed or intended for distribution to, or use by, any person or entity who is a citizen or
resident of or located in any locality, state, country or other jurisdiction, where such distribution, publication, availability or use would
be contrary to law, regulation or which would subject IiAS to any registration or licensing requirements within such jurisdiction. The
distribution of this document in certain jurisdictions may be restricted by law, and persons in whose possession this document comes,
should inform themselves about and observe, any such restrictions. The information given in this document is as of the date of this
report and there can be no assurance that future results or events will be consistent with this information. This information is subject
to change without any prior notice. IiAS reserves the right to make modifications and alterations to this statement as may be required
from time to time. However, IiAS is under no obligation to update or keep the information current. Nevertheless, would be happy to
provide any information in response to specific client queries. Neither IiAS nor any of its affiliates, group companies, directors,
employees, agents or representatives shall be liable for any damages whether direct, indirect, special or consequential including lost
revenue or lost profits that may arise from or in connection with the use of the information. The disclosures of interest statements
incorporated in this document are provided solely to enhance the transparency and should not be treated as endorsement of the views
expressed in the report. The analyst for this report certifies that all of the views expressed in this report accurately reflect his or her
personal views about the subject company or companies and its or their securities, and no part of his or her compensation was, is or
will be, directly or indirectly related to specific recommendations or views expressed in this report. The information provided in these
reports remains, unless otherwise stated, the copyright of IiAS. All layout, design, original artwork, concepts and other Intellectual
Properties, remains the property and copyright of IiAS and may not be used in any form or for any purpose whatsoever by any party
without the express written permission of the copyright holders.
Institutional EYE Special report | 2014
Dividends iias.in 18
About IiAS
Institutional Investor Advisory Services India Limited (IiAS) is a proxy advisory
firm, dedicated to providing participants in the Indian market with independent
opinion, research and data on corporate governance issues as well as voting
recommendations on shareholder resolutions for over 300 companies.
In addition to voting advisory, IiAS assists investors with proxy voting, provides
AGM/EGM ‘end-of-day’ minutes and acts as a record keeping agent by
maintaining the history of votes cast in shareholder meetings.
IIAS provides bespoke research, valuation advisory services and assists
institutions in their engagement with company managements and their boards.
To know more about IIAS visit www.iias.in
Office
Institutional Investor Advisory Services 15th Floor, West Wing, P J Tower, Dalal Street, Fort, Mumbai - 400 001 India.
Contact
T: +91 22 2272 1570-3
F: +91 22 22721574