
Dividend Policy in Switzerland - UZH - Doctoral Program in ... · Dividend Policy in Switzerland...
37
Dividend Policy in Switzerland Bogdan Stacescu October 30, 2004 Abstract The paper examines dividend policy for a sample of Swiss companies. Several factors that determine cross-sectional variations in dividend policy - such as profitability, growth opportunities and riskiness - are identified. The partial adjustment model based on the idea of stable target payout ratios is found to perform reasonably well. While dividend changes seem to be more closely associated with past and current rather than future net income growth, they could signal a persistent shift in the level of earnings. There also seems to be a significant relationship between losses and dividend cuts. 1 Introduction The very reason for the existence of dividend payments is a matter for debate. While there are many important explanations for the firms’ and investors’ behaviour in this area, none of them is generally accepted. The ”dividend irrelevance” proposition still looms large and empirical findings do not provide overwhelming support to one particular explanation. It seems that more research is needed to check the validity of theoretical models and to find additional regularities concerning dividends. The paper examines some of the characteristics of dividend policy using Swiss data. The aim is to single out several regularities concerning dividend payments, to compare results with those from previous research, and to test some of the predictions of theoretical litera- ture. The next section of the paper summarizes some of the alternative theories concerning div- idends. Section 3 presents several empirical results from previous studies. Section 4 briefly presents the data, and section 5 identifies some of the sources of cross-sectional variation in dividend policy. Companies that do not pay dividends are usually either younger, smaller, riskier, high-growth companies or older, more established companies facing persistent diffi- culties. Lower dividend payments are associated with higher market-to-book ratios, higher share price volatility and higher leverage. There is also some evidence that institutional investors prefer dividend-paying companies. Section 6 examines the relationship between dividends and earnings over time. In his classic study, Lintner (1956) suggests that managers set target payout ratios and gradually adjust dividends in order to reach the target. When applied to a sample of Swiss companies, the partial adjustment model performs reasonably well in most cases. A large body of literature suggests that dividends are used to signal future profitabil- ity. Empirical evidence on this issue is however rather mixed. Section 6.2. presents some evidence based on the Swiss sample. As in previous studies using US data, it seems that dividend changes are associated with past and current changes in earnings growth rather 1
Transcript of Dividend Policy in Switzerland - UZH - Doctoral Program in ... · Dividend Policy in Switzerland...

Dividend Policy in Switzerland
Bogdan Stacescu
October 30, 2004
Abstract
The paper examines dividend policy for a sample of Swiss companies. Several factors
that determine cross-sectional variations in dividend policy - such as profitability, growth
opportunities and riskiness - are identified. The partial adjustment model based on the idea
of stable target payout ratios is found to perform reasonably well. While dividend changes
seem to be more closely associated with past and current rather than future net income
growth, they could signal a persistent shift in the level of earnings. There also seems to be
a significant relationship between losses and dividend cuts.
1 Introduction
The very reason for the existence of dividend payments is a matter for debate. While
there are many important explanations for the firms’ and investors’ behaviour in this area,
none of them is generally accepted. The ”dividend irrelevance” proposition still looms large
and empirical findings do not provide overwhelming support to one particular explanation.
It seems that more research is needed to check the validity of theoretical models and to find
additional regularities concerning dividends.
The paper examines some of the characteristics of dividend policy using Swiss data. The
aim is to single out several regularities concerning dividend payments, to compare results
with those from previous research, and to test some of the predictions of theoretical litera-
ture.
The next section of the paper summarizes some of the alternative theories concerning div-
idends. Section 3 presents several empirical results from previous studies. Section 4 briefly
presents the data, and section 5 identifies some of the sources of cross-sectional variation in
dividend policy. Companies that do not pay dividends are usually either younger, smaller,
riskier, high-growth companies or older, more established companies facing persistent diffi-
culties. Lower dividend payments are associated with higher market-to-book ratios, higher
share price volatility and higher leverage. There is also some evidence that institutional
investors prefer dividend-paying companies.
Section 6 examines the relationship between dividends and earnings over time. In his
classic study, Lintner (1956) suggests that managers set target payout ratios and gradually
adjust dividends in order to reach the target. When applied to a sample of Swiss companies,
the partial adjustment model performs reasonably well in most cases.
A large body of literature suggests that dividends are used to signal future profitabil-
ity. Empirical evidence on this issue is however rather mixed. Section 6.2. presents some
evidence based on the Swiss sample. As in previous studies using US data, it seems that
dividend changes are associated with past and current changes in earnings growth rather
1

than with future ones. However, a more in-depth look at the data suggests that changes
in dividends signal a persistent change in the average level of earnings (as shown in Table
16). Thus the good news associated with dividend increases may be that - at least over the
medium term - earnings have shifted to a higher level.
Section 6.3. presents evidence that losses are to a significant extent a necessary condition
for dividend cuts. Section 7 concludes.
2 Motivation and Related Literature
Dividend policy has long been a subject of research and debate. There are many theoret-
ical and empirical results describing the decisions companies make in this area. At the same
time, however, there is no generally accepted model describing payout policy. Moreover,
empirical findings are often contradictory or difficult to interpret in light of the theory.
In their seminal paper, Miller and Modigliani (1961) showed that under certain assump-
tions dividends are irrelevant; all that matters is the firm’s investment opportunities. Miller
and Modigliani considered the case of perfect capital markets (no transaction costs or tax
differentials, no pricing power for any of the participants, no information asymmetries or
costs), rational behaviour (more wealth being preferred to less, indifference between cash
payments and share value increases) and perfect certainty (future investments and profits
are given).
In the environment described above, Miller and Modigliani show that dividend policy
does not affect the value of the firm. This is true whether one considers the value of the
firm to be given by the discounted cash flow method, by the stream of future dividends
or earnings or as a sum of current earnings and future investment opportunities. Given
perfect capital markets, the firm will always be able to compensate the cash outflow by at-
tracting new money (via new shares or debt) if this is required by its investment programme.
In ”real life”, however, people seem to care about dividends. Lintner’s (1956) classical
study on dividend policy suggests that ”dividends represent the primary and active deci-
sion variable in most situations”. The interviews and research conducted on 28 companies
suggested that firms set their current dividends based on their previous history. The main
decision concerned the possible change in the payment rate and this decision was based
on (expected future) earnings. Dividend policy seemed characterized by ”inertia and con-
servatism”; managers seemed to think that investors reward stability and avoided making
unsustainable changes in payout ratios. Lintner suggests a model of partial adjustment to
a given payout rate.
In a recent study, Brav, Graham, Harvey and Michaely (2004) find that ”maintaining
the dividend level is a priority on par with investment decisions” and that less than half of
the executives they interviewed agree that ”the availability of good investment opportuni-
ties is an important or very important factor affecting dividend decisions”. Although to a
somehow lesser degree, Lintner’s findings seem valid almost half a century later.
Researchers have tried to explain the importance of dividends by looking for ”imperfec-
tions” that can undermine the irrelevance proposition. Modigliani and Miller themselves
suggested that taxes can be a factor: dividends are taxed in a different way from capital
gains. Information asymmetries between the management of a company and its (prospec-
tive) shareholders can lead to dividends being used as costly signals. Agency problems
2

between shareholders and management or shareholders and debtholders in a world of imper-
fect contracting - mean that dividends can be used as a way to control the behaviour of the
other party. Incomplete markets could reduce the investors’ ability to substitute between
cash and capital gains depending on their liquidity needs.
Static models based on taxes suggest that there could be ’tax clienteles’ attempting to
reduce their tax outlays. Individuals in high tax brackets should choose low-dividend paying
companies, while corporations should choose high-dividend paying shares. In equilibrium, as
Miller and Modigliani (1961) there will be no effect on share prices. There is however little
evidence that the tax clientele effect is very important (Allen and Michaely 2002). Crockett
and Friend (1988) note that there were no significant effects on dividends generated by
the gradual decrease in income tax rates over the 1940-1985 period. They also point out
that retained earnings are not significantly correlated with capital gains; over the 1970s ”a
substantial volume of retained earnings was associated with substantial capital losses”.
Dynamic tax models imply that high marginal tax rate investors could also reduce their
tax liabilities by selling their shares before the shares go ex-dividend and buying them again
afterwards. Investors with a low dividend tax rate will be willing to do the opposite. Thus
the tax effect will be seen in volume rather than price; however, given transaction costs,
taxes will also influence prices. Empirical evidence seems to give more support to dynamic
than to static strategies (Allen and Michaely 2002). A survey of financial executives by Brav,
Graham, Harvey and Michaely (2004) finds that from the management’s point of view tax
concerns are of secondary importance when deciding dividend policy.
Modigliani and Miller (1961) assume that information is the same and free for all partic-
ipants. In practice, however, this assumption is not likely to hold and information asymme-
tries can have important consequences. An important class of models is based on the idea
that dividends can be used as signals of firm quality.
Bhattacharya (1979) builds a two-period model with two types of firms. Investments
are made during the first period; their expected profitability is known to management, but
not to outside investors. In order to signal the quality of their investment, the managers
of ’good’ firms (managers are assumed to act in the interest of initial shareholders) will
commit to paying high dividends in the second period. Since attracting outside financing
(during the second period) is expensive due to transaction costs, the ’low quality’ firms will
be unable to imitate the ’high quality’ ones.
Miller and Rock (1985) also build a signalling model - the cost of the signal in their
version being forced reductions in investment. The model of John and Williams (1985) uses
taxes as the main cost of dividends; thus, unlike the previous two models, it can be used
to distinguish between dividends and share repurchases, which enjoy a more favourable
tax treatment. High dividends are a signal of undervalued shares (high firm quality) -
shareholders will have to pay taxes on them, but they retain a proportionately higher share
in the firm, which is valuable to them. The opposite is true if the firm is overvalued.
John and Williams also show that their model implies that dividends are smoothed with
respect to share prices rather than net cash inflows as in previous models. They suggest
that ”firms with more risky returns on assets pay lower dividends, other things equal”.
Kumar (1988) builds a model that explains dividend smoothing - one of the most salient
features of dividend policy. Dividends once again signal a firm’s quality (productivity), but,
since they are overinvested in the firm, managers will try to underinvest by underreporting
a firm’s productivity. While there is no fully revealing equilibrium, Kumar shows that firms
will tend to cluster around optimal dividend levels.
The signalling models provide an explanation for the positive stock price reaction to
3

the announcement of dividend increases or initiations. At least some empirical evidence,
however, seems to suggest that the increase in dividend payments is not followed by an in-
crease in firms’ earnings (Benartzi, Michaely, Thaler 1997). Indeed, it has been shown that
earnings growth is higher in after dividend cuts. Thus the increase in earnings precedes the
dividend increase rather than follow it. While they agree that dividends are used to convey
information to the market, managers seem not to think within the ’costly signalling’ frame-
work used in academic models (Brav et al. 2004). Grullon, Michaely and Swaminathan
(2002) suggest that rather than an increase in profitability dividend increases could reflect
a decrease in risk - the ’maturity hypothesis’.
Agency theory suggests that dividends can be used as a means to control a firm’s man-
agement. Distributing dividends reduces the free cash flow problem and increases the man-
agement’s equity stake. The question remains why the shareholders would not use debt
or share repurchases instead. LaPorta, Lopez-de-Silanes and Shleifer (2000) find that in
countries with better shareholder rights firms pay proportionally more dividends. Therefore
”there is no evidence that in countries with low investor protection, management will vol-
untarily commit itself to pay out higher dividends and to be monitored more frequently by
the market” (Allen and Michaely 2002).
Fudenberg and Tirole (1995) build a model that shows that, when managers are risk-
averse and more recent information has a higher weight in assessing their performance, there
will be both dividend and earnings smoothing.
Another agency problem is that between shareholders and debtholders. The risk that
shareholders will expropriate debtholders by paying themselves excessive dividends has led
to the often encountered covenants restricting dividend policy in bond contracts. Empirical
studies also suggest that firms hold more cash than the minimum stipulated in bond con-
tracts in order to consolidate their reputation as good quality borrowers. (Kalay 1982). The
reputation effect is also supported by the fact that firms in financial distress are reluctant
to cut dividends (DeAngelo and DeAngelo 1990).
To sum up, there are several credible explanations for the existence of dividends, although
none of them is generally accepted or above criticism. The Miller and Modigliani proposition
of dividend irrelevance is still widely mentioned, as is the idea of a ”dividend puzzle”.
3 Previous Empirical Findings
There are many empirical studies that try to assess the validity of the various theories
concerning dividend policy. Their findings, whether they are focused on signalling, taxes or
agency explanations, are often contradictory.
Denis, Denis, and Sarin (1994) examine the predictions of the signalling, overinvestment
(free cash flow) and dividend clientele hypotheses. Using large (more that 10%) changes in
dividends per share for US firms over the 1962-1988 period, they find stronger support for the
signalling and dividend clientele hypotheses than for the overinvestment theory. The proxies
used for the first two are significant in a regression explaining the excess returns of dividend
announcements, while the proxies based on Tobin’s q are insignificant. Denis et al. also find
that firms increase capital expenditures following dividend increases and decrease them after
dividend decreases; this also contradicts the overinvestment/free cash flow explanation. The
results in Yoon and Starks (1995) also support the signalling hypothesis.
4

Johnson (1995) examines the use of debt and dividends as predicted by the signalling or
free cash flow theories. He finds that share price reactions to straight debt issues announce-
ments is significantly different from zero (at a 10% level) for low-dividend-paying companies,
but insignificantly different from zero for companies that pay high dividends. For the sub-
group of low growth - low dividends firms, the reaction is significant at a 1% level. The
evidence thus suggests that dividends and debt are substitutes, whether for signalling or
management control purposes.
Michaely, Thaler and Womack (1995) examine market reactions to dividend initiations
and omissions. As in earlier papers, they find that the magnitude of short-term reactions to
omissions is much higher than the reaction to dividend initiations. This could be because
the change in the dividend yield is much higher for omissions than for initiations. More
importantly, they find that prices tend to drift in the same direction over the following
year. For a smaller sample, they compare this drift with the drift generated by earnings
surprises and find that the former is distinct from and stronger than the latter. They also
examine turnover around the dividend announcement day and find weak evidence in favour
of clientele effects.
DeAngelo, DeAngelo and Skinner (1992) examine the connection between losses and
dividend cuts and omissions. They find that ”an annual loss is essentially a necessary
condition for dividend reductions in firms with established earnings and dividend records”.
Benartzi, Michaely and Thaler (1997) examine earnings growth around dividend changes
and find that the earnings growth rates do not increase for companies that have increased
dividends, while they do increase for companies that have decreased them. They argue
that dividend changes are more related to past and current earnings growth than to future
earnings growth. Based on their empirical results, Grullon, Michaely and Swaminathan
(2002) argue that dividend increases signal a decrease in risk rather than an increase in
profitability.
Bernheim and Wantz (1995) explore the influence of taxes on the effect of dividend
change announcements. They define the ”bang-for-the-buck” as ”the share price response
per dollar of dividends”. Dividend signalling models imply that the ”bang-for-the-buck”
should increase when the relative taxation of dividends increase, while free cash flow models
generally suggest that there should be a decrease in the announcement effect. The authors
find that US data over the 1962-1988 period supports the signalling hypothesis.
Hubbard and Michaely (1997) analyse the ’Citizens Utilities Case’. Until 1990, Citizens
Utilities Company had two classes of stock: one of them paid stock dividends and the other
an equivalent amount of cash dividends. Despite the unfavourable tax treatment of cash
dividends, the second type of shares traditionally sold at a premium, and this premium
seems even larger in the 1980s than in the 1960s. The tax reform in 1986 led to a movement
in the ’right’ direction, but this effect was only temporary. The authors look for evidence of
clientele effects and differences in liquidity, but find that they cannot account for the strange
behaviour of relative prices.
In conclusion, empirical results do not always agree and there is still no overwhelming
support for just one of the competing explanations for dividends. It is possible that theories
based on signalling, tax differentials or agency problems all have a real basis - they are not,
after all, mutually exclusive. It may also be that there are additional valid explanations.
5
4 Data
The paper uses data on listed Swiss companies over the 1974-2004 period. There are
175 non-financial, non-utility companies in the overall sample. The sources for the data
are Datastream and annual reports (for information on the main shareholders). Because of
limited data availability, smaller samples are used in some of the following sections.
Unlike American companies, that pay dividends on a quarterly basis, Swiss companies
usually pay dividends only once a year. (Ex-dividend days are usually in May or June).
Thus the analysis in this paper uses yearly observations. This has the obvious disadvantage
of reducing the number of data points. On the other hand, studies such as Lintner (1956)
and DeAngelo, DeAngelo and Skinner (1992) argue that the main horizon for dividend policy
is the whole year even in the American case.
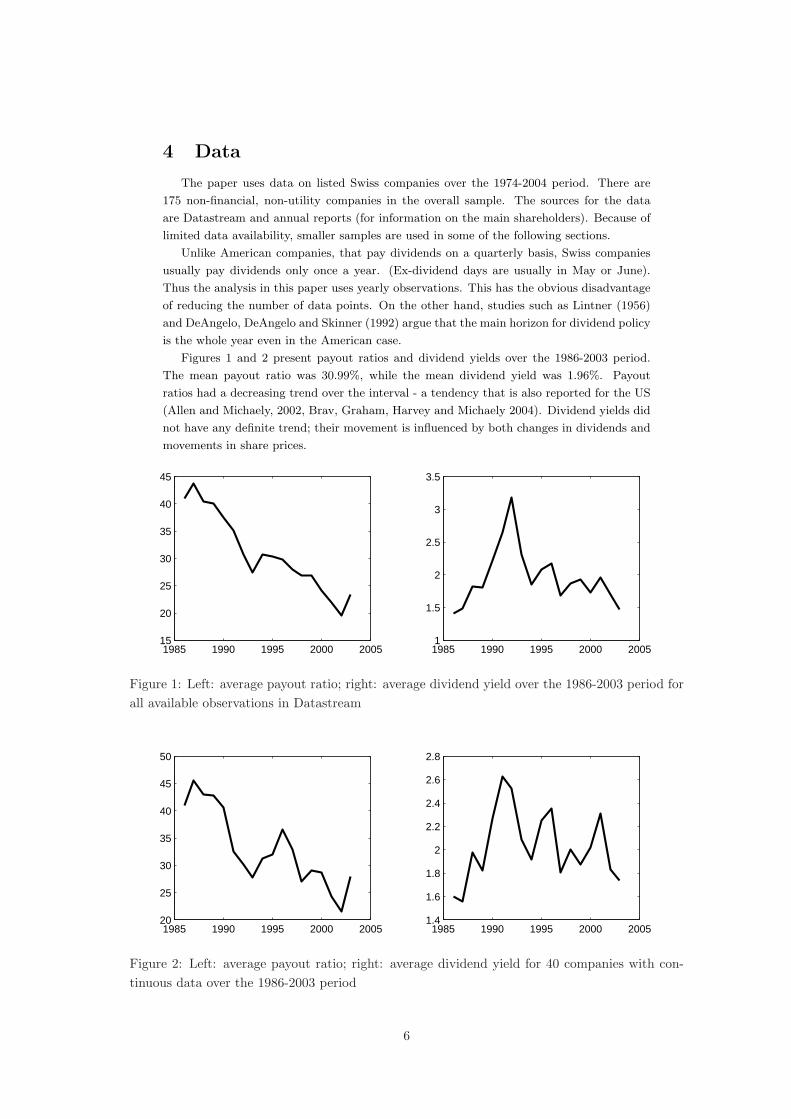
Figures 1 and 2 present payout ratios and dividend yields over the 1986-2003 period.
The mean payout ratio was 30.99%, while the mean dividend yield was 1.96%. Payout
ratios had a decreasing trend over the interval - a tendency that is also reported for the US
(Allen and Michaely, 2002, Brav, Graham, Harvey and Michaely 2004). Dividend yields did
not have any definite trend; their movement is influenced by both changes in dividends and
movements in share prices.
1985 1990 1995 2000 200515
20
25
30
35
40
45
1985 1990 1995 2000 20051
1.5
2
2.5
3
3.5
Figure 1: Left: average payout ratio; right: average dividend yield over the 1986-2003 period forall available observations in Datastream
1985 1990 1995 2000 200520
25
30
35
40
45
50
1985 1990 1995 2000 20051.4
1.6
1.8
2
2.2
2.4
2.6
2.8
Figure 2: Left: average payout ratio; right: average dividend yield for 40 companies with con-tinuous data over the 1986-2003 period
6

Table 1: Comparison between dividend-paying and non-paying companies, 2000-2003
Variable Mean Mean p-valuespaying group non-paying group
Mean market-to-book ratio, 2000-2003 2.226 3.401 0.052Mean return on assets, 2000-2003 5.093 -4.566 0.000Mean return on equity, 2000-2003 10.893 -21.359 0.000Mean capital gearing, 2000-2003 37.770 37.120 0.881Mean price volatility, 2000-2003 24.740 38.250 0.000Beta coefficient 0.86 1.33 0.009Mean total assets, 2000-2003 (CHF, thousands) 4,643,377 1,484,523 0.108Mean sales, 2000-2003 (CHF, thousands) 3,017,036 467,396 0.184Mean foreign-owned share of capital, 2001-2003 8.08 15.42 0.081Share of capital owned by large shareholders, 2003 46.03 41.78 0.412Share of voting rights for large shareholders, 2003 42.19 40.34 0.780
5 Cross-Sectional Comparisons of Dividend Pay-
ments
5.1. Who pays dividends?
There are several features that distinguish firms that pay dividends from firms that do
not.
The analysis in this subsection focuses on the 2000-2003 period and distinguishes between
companies that had at least one dividend payment over the four years and companies that
had none. Table 1 summarizes some of the main features of the two groups.
Not surprisingly, companies that paid dividends over the 2000-2003 period had signif-
icantly higher profitability than companies that did not. It is interesting to note that
non-paying companies made losses on average, while companies that paid dividends had
positive mean returns on assets and equity.
Non-paying firms had a higher market-to-book ratio. Indeed, agency theory suggests
that companies with better growth opportunities (proxied by the market-to-book ratio) are
less likely to have free cash flow problems. Therefore dividends as an instrument to discipline
management are less useful to these companies. Denis, Denis and Sarin (1994) note that
dividend yield and Tobin’s q are negatively related; this relationship seems to hold for the
Swiss sample. The fact that leverage is virtually identical for the two groups of companies
may mean that dividends and debt are used in different ways to control management, as
suggested by Johnson (1995).
Companies that did not pay dividends over the four years also had higher price volatility
(where price volatility is computed as the band within which the share price moved around
the mean price during the year) and higher betas. They also tended to have lower total assets
and lower sales (although the difference is not significant for the latter). Together with the
higher market-to-book ratio, these differences give support to the ”maturity hypothesis” of
Grullon, Michaely and Swaminathan (2002): companies that are younger and riskier tend
7

to pay lower dividends.
Ownership concentration does not seem to affect the option to pay dividends. This
conclusion holds whether one considers the share of voting rights or the share of the equity
owned by large shareholders (shareholders that have more than 5% of a company’s voting
rights and that are obliged to make their ownership public under Swiss regulations). Two
other aspects concerning ownership seem to be more closely related with the decision to
pay dividends. Institutional investors (investment companies and pension funds) only held
significant participations in dividend-paying companies. This finding is similar to results
from previous papers, such as Grinstein and Michaely (2003). Dividend-paying companies
also had a lower foreign-owned share of capital.
There were no significant differences between various industries regarding the decision
to pay dividends.
To sum up, companies that do not pay dividends seem to be either old, established com-
panies going through protracted difficulties, or - more often - younger, smaller and riskier
companies.
5.2. Sources of Cross-Section Variation
This section focusses on the relationship between payout ratios and dividend yields and
the variables described above over the 2000-2003 period. It also presents results for the
subsample of companies that had at least one dividend payment in one of the four years.
As it will be shown below, the relationship between dividend payments and the variables
described above is not always monotonic.
Table 2 shows that, taking the whole set of firms, more profitable companies have higher
dividend yields and payout ratios. Taking just the group of companies with positive dividend
payments over the 2000-2003 period, however, the relationship is only significant for the
payout ratio and returns on assets. The other correlations are insignificant and even have
”wrong” signs.
The fact that companies with higher price volatility and higher market-to-book ratios
have lower dividend yields and payout ratios supports the ”maturity hypothesis” of Grullon,
Michaely and Swaminathan (1994). ”Younger” (smaller, riskier, growing) companies pay
less dividends than ”older” ones. One could note, however, that there the correlations with
firm size are not significant in this sample. Thus, while starting to pay dividends could be
a sign of firm ”maturity”, increasing dividend payments could be a sign that the company
is moving from a ”riskier” to a quieter period in its life. As Grullon et al. point out, the
positive reaction on dividend increase announcements could be generated by the fact that
investors take them as a sign of risk reduction rather than profitability increase. This result
is related to Lintner’s (1956) finding that managers are reluctant to increase dividends if
they are not sure that future earnings will be stable enough to prevent dividend decreases.
Capital gearing is negatively correlated with the payout ratio and the dividend yield, with
the former relationship being usually positive. This may be because of debt covenants or
because leveraged firms try to increase their retained earnings and reduce their dependence
on external financing. It could also be that debt and dividends are alternative means to
reduce agency problems. The relationship is not very strong, however, and using the ratio
between total debt and the market value instead of capital gearing leads to an insignificant
correlation.
Dividend policy shows no very strong influence from ownership structure. There is a
positive correlation between ownership concentration (indicated by the total voting rights
8

Table 2: Dividend yield and firm characteristics
Variables Correlation Correlation Correlation - ”paying” Correlation - ”paying”(averages (2003) subsample (averages subsample
2000-2003) 2000-2003) (2003)Market-to-book ratio -0.309*** -0.053 -0.308* -0.128Returns on assets 0.214*** 0.264*** -0.048 0.199Returns on equity 0.129 0.216*** -0.121 -0.051Sales -0.048 -0.054 -0.114 -0.040Total assets -0.064 -0.062 -0.153 -0.044Capital gearing -0.059* -0.010 -0.038 -0.060Price volatility -0.532*** -0.481*** -0.464*** -0.414***Voting rights oflarge shareholders 0.179* 0.192** 0.187** 0.073Capital share oflarge shareholders 0.122 0.153* 0.153 0.024Share of capital owned byfamilies and employees -0.015 -0.024 -0.096 -0.093Foreign-owned shareof capital -0.04 0.068 0.084 -0.038Share of capital owned byinstitutions 0.162* 0.029 0.187** 0.056Payout ratio 0.633*** 0.537*** 0.418*** 0.367***
* Significant at a 10% confidence level.
**Significant at a 5% confidence level.
***Significant at a 1% confidence level.
9

Table 3: Payout ratio and firm characteristics
Variables Correlation Correlation Correlation - ”paying” Correlation - ”paying”(averages (2003) subsample (averages subsample (2003)
2000-2003) 2000-2003)Market-to-book ratio -0.188** -0.001 -0.114 -0.028Returns on assets 0.337*** 0.419*** 0.266** 0.205**Returns on equity 0.199** 0.332*** 0.006 -0.063Sales 0.063 0.050 0.028 0.068Total assets 0.067 0.066 0.033 0.076Capital gearing -0.132 -0.176** -0.196*** -0.238***Price volatility -0.497*** -0.375*** -0.407*** -0.287***Voting rights oflarge shareholders -0.004 -0.0297 0.030 -0.016Capital share oflarge shareholders -0.032 -0.011 -0.015 -0.068Share of capital ownedby families and employees -0.096 -0.074 -0.121 -0.164Foreign-owned shareof capital 0.046 0.014 0.194** 0.107Share of capital ownedby institutions -0.036 -0.094 -0.032 0.019
* Significant at a 10% confidence level.
**Significant at a 5% confidence level.
***Significant at a 1% confidence level.
10
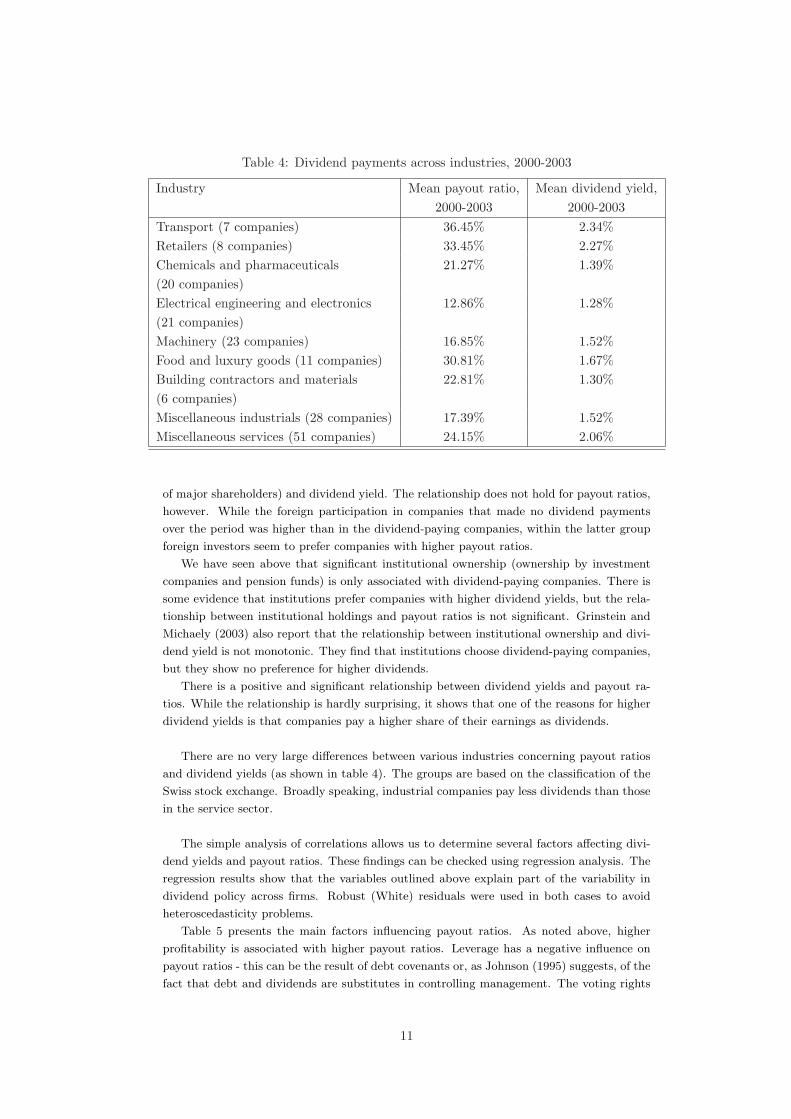
Table 4: Dividend payments across industries, 2000-2003
Industry Mean payout ratio, Mean dividend yield,2000-2003 2000-2003
Transport (7 companies) 36.45% 2.34%Retailers (8 companies) 33.45% 2.27%Chemicals and pharmaceuticals 21.27% 1.39%(20 companies)Electrical engineering and electronics 12.86% 1.28%(21 companies)Machinery (23 companies) 16.85% 1.52%Food and luxury goods (11 companies) 30.81% 1.67%Building contractors and materials 22.81% 1.30%(6 companies)Miscellaneous industrials (28 companies) 17.39% 1.52%Miscellaneous services (51 companies) 24.15% 2.06%
of major shareholders) and dividend yield. The relationship does not hold for payout ratios,
however. While the foreign participation in companies that made no dividend payments
over the period was higher than in the dividend-paying companies, within the latter group
foreign investors seem to prefer companies with higher payout ratios.
We have seen above that significant institutional ownership (ownership by investment
companies and pension funds) is only associated with dividend-paying companies. There is
some evidence that institutions prefer companies with higher dividend yields, but the rela-
tionship between institutional holdings and payout ratios is not significant. Grinstein and
Michaely (2003) also report that the relationship between institutional ownership and divi-
dend yield is not monotonic. They find that institutions choose dividend-paying companies,
but they show no preference for higher dividends.
There is a positive and significant relationship between dividend yields and payout ra-
tios. While the relationship is hardly surprising, it shows that one of the reasons for higher
dividend yields is that companies pay a higher share of their earnings as dividends.
There are no very large differences between various industries concerning payout ratios
and dividend yields (as shown in table 4). The groups are based on the classification of the
Swiss stock exchange. Broadly speaking, industrial companies pay less dividends than those
in the service sector.
The simple analysis of correlations allows us to determine several factors affecting divi-
dend yields and payout ratios. These findings can be checked using regression analysis. The
regression results show that the variables outlined above explain part of the variability in
dividend policy across firms. Robust (White) residuals were used in both cases to avoid
heteroscedasticity problems.
Table 5 presents the main factors influencing payout ratios. As noted above, higher
profitability is associated with higher payout ratios. Leverage has a negative influence on
payout ratios - this can be the result of debt covenants or, as Johnson (1995) suggests, of the
fact that debt and dividends are substitutes in controlling management. The voting rights
11
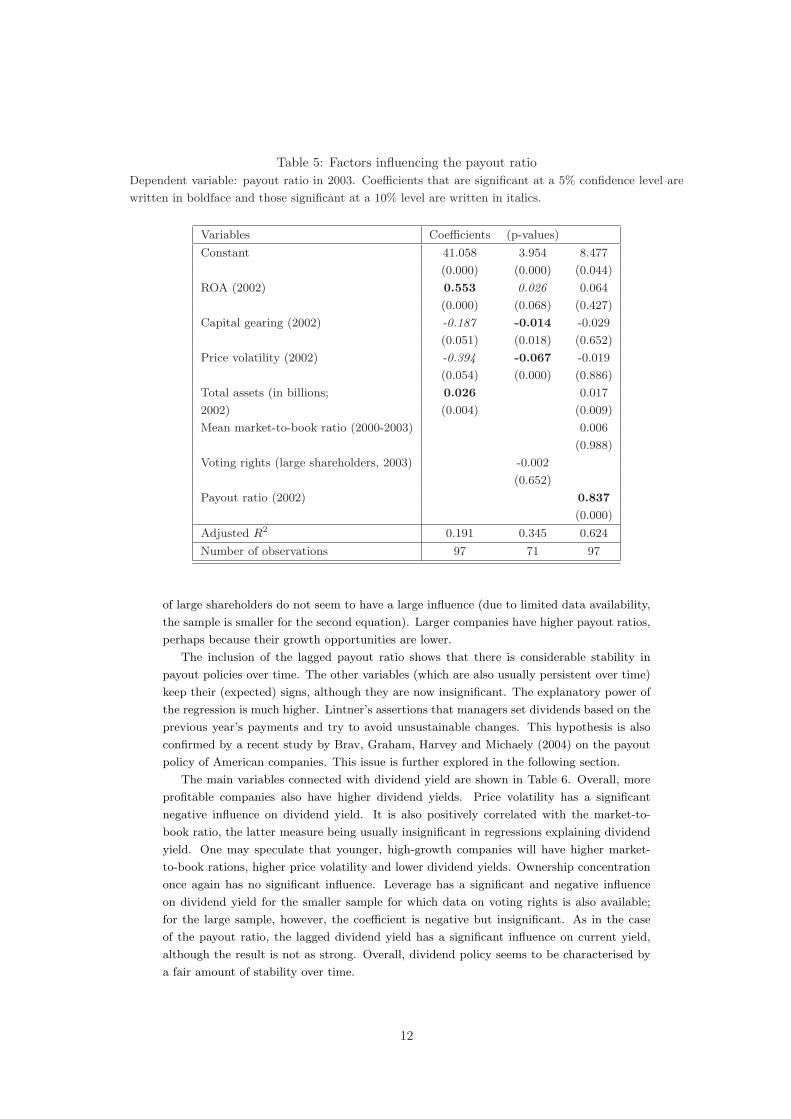
Table 5: Factors influencing the payout ratioDependent variable: payout ratio in 2003. Coefficients that are significant at a 5% confidence level are
written in boldface and those significant at a 10% level are written in italics.
Variables Coefficients (p-values)
Constant 41.058 3.954 8.477
(0.000) (0.000) (0.044)
ROA (2002) 0.553 0.026 0.064
(0.000) (0.068) (0.427)
Capital gearing (2002) -0.187 -0.014 -0.029
(0.051) (0.018) (0.652)
Price volatility (2002) -0.394 -0.067 -0.019
(0.054) (0.000) (0.886)
Total assets (in billions; 0.026 0.017
2002) (0.004) (0.009)
Mean market-to-book ratio (2000-2003) 0.006
(0.988)
Voting rights (large shareholders, 2003) -0.002
(0.652)
Payout ratio (2002) 0.837
(0.000)
Adjusted R2 0.191 0.345 0.624
Number of observations 97 71 97
of large shareholders do not seem to have a large influence (due to limited data availability,
the sample is smaller for the second equation). Larger companies have higher payout ratios,
perhaps because their growth opportunities are lower.
The inclusion of the lagged payout ratio shows that there is considerable stability in
payout policies over time. The other variables (which are also usually persistent over time)
keep their (expected) signs, although they are now insignificant. The explanatory power of
the regression is much higher. Lintner’s assertions that managers set dividends based on the
previous year’s payments and try to avoid unsustainable changes. This hypothesis is also
confirmed by a recent study by Brav, Graham, Harvey and Michaely (2004) on the payout
policy of American companies. This issue is further explored in the following section.
The main variables connected with dividend yield are shown in Table 6. Overall, more
profitable companies also have higher dividend yields. Price volatility has a significant
negative influence on dividend yield. It is also positively correlated with the market-to-
book ratio, the latter measure being usually insignificant in regressions explaining dividend
yield. One may speculate that younger, high-growth companies will have higher market-
to-book rations, higher price volatility and lower dividend yields. Ownership concentration
once again has no significant influence. Leverage has a significant and negative influence
on dividend yield for the smaller sample for which data on voting rights is also available;
for the large sample, however, the coefficient is negative but insignificant. As in the case
of the payout ratio, the lagged dividend yield has a significant influence on current yield,
although the result is not as strong. Overall, dividend policy seems to be characterised by
a fair amount of stability over time.
12

Table 6: Factors influencing dividend yieldDependent variable: Dividend yield in 2003. Coefficients that are significant at a 5% confidence level
are written in boldface and those significant at a 10% level are written in italics.
Variables Coefficients (p-values)
Constant 3.954 3.925 0.604 3.567
(0.000) (0.031) (0.000) (0.000)
ROA (2002) 0.026 0.030 0.027 0.031
(0.081) (0.046) (0.099) (0.048)
Capital gearing (2002) -0.014 -0.016 -0.016
(0.004) (0.019) (0.022)
Price volatility (2002) -0.067 -0.059 -0.052
(0.000) (0.000) (0.003)
Voting rights (large shareholders, 2003) -0.0023 -0.003 -0.002
(0.696) (0.423) (0.736)
Dividend yield (2002) 0.602 0.107
(0.002) (0.301)
Mean market-to-book ratio (2000-2003) -0.037 -0.069
(0.353) (0.199)
Adjusted R2 0.345 0.347 0.332 0.354
Number of observations 71 71 107 71
6 The Dynamic Aspect: Dividends and Earnings
6.1. The Lintner Model and Payout Targets
As we have seen in the previous section, dividend policy seems to be stable over time.
Lintner (1956) suggests that managers set targets concerning payout ratios and they adjust
dividend payments in order to gradually reach that target. Under this hypothsis, the target
ratio is given by
D∗t = γEt,
and the adjustment equation is
Dt −Dt−1 = α + δ(D∗t −Dt−1) + εt,
where Dt are dividends paid in year t, Et are earnings for the same year, and D∗t is the
desired level of dividends in year t.
Combining the two equations the model proposed by Lintner can be written as:
∆Dt = α + β1Dt−1 + β2Et + ut
The change in dividends is thus modelled as a function of lagged dividends and current
earnings. The equation is a partial adjustment model, which can be consistently estimated
by ordinary least squares. The target payout ratio is estimated as −β̂2/β̂1, while the speed
of adjustment is given by −β̂1.
Estimating the Lintner model requires data over a longer period of time, and as a result
the sample is reduced to 60 companies for the 1987-2003 period (16 years). The results of
13
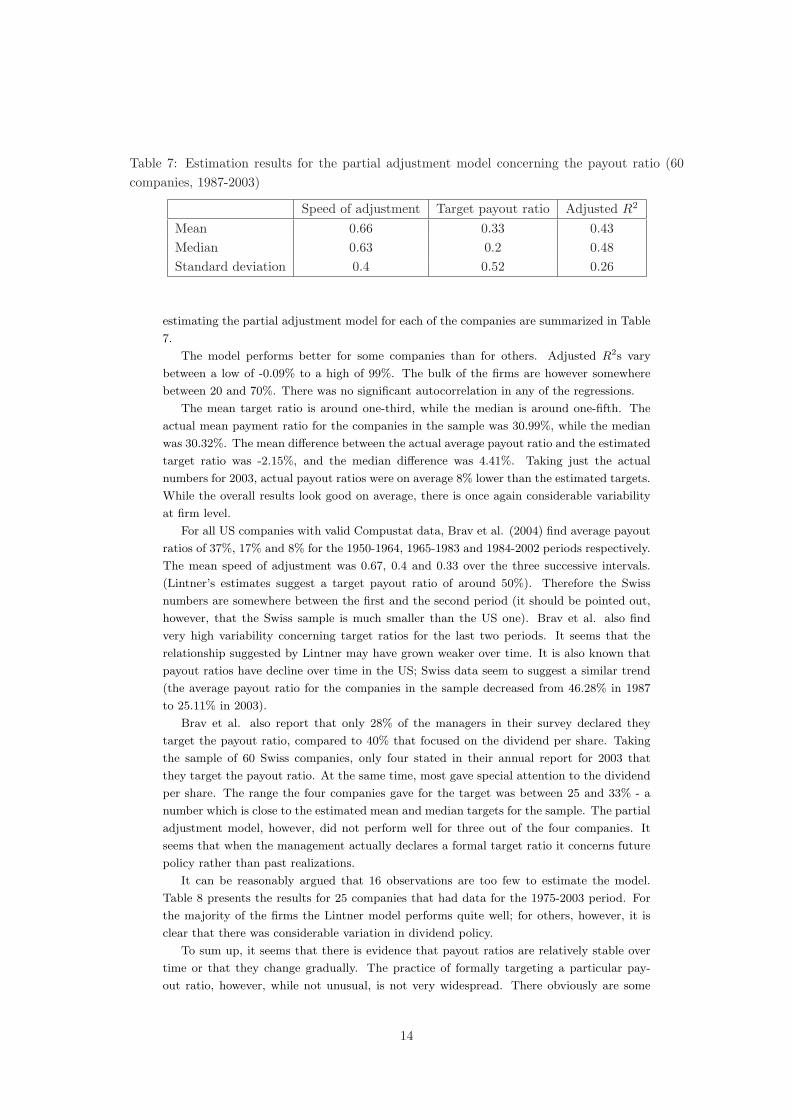
Table 7: Estimation results for the partial adjustment model concerning the payout ratio (60companies, 1987-2003)
Speed of adjustment Target payout ratio Adjusted R2
Mean 0.66 0.33 0.43Median 0.63 0.2 0.48Standard deviation 0.4 0.52 0.26
estimating the partial adjustment model for each of the companies are summarized in Table
7.
The model performs better for some companies than for others. Adjusted R2s vary
between a low of -0.09% to a high of 99%. The bulk of the firms are however somewhere
between 20 and 70%. There was no significant autocorrelation in any of the regressions.
The mean target ratio is around one-third, while the median is around one-fifth. The
actual mean payment ratio for the companies in the sample was 30.99%, while the median
was 30.32%. The mean difference between the actual average payout ratio and the estimated
target ratio was -2.15%, and the median difference was 4.41%. Taking just the actual
numbers for 2003, actual payout ratios were on average 8% lower than the estimated targets.
While the overall results look good on average, there is once again considerable variability
at firm level.
For all US companies with valid Compustat data, Brav et al. (2004) find average payout
ratios of 37%, 17% and 8% for the 1950-1964, 1965-1983 and 1984-2002 periods respectively.
The mean speed of adjustment was 0.67, 0.4 and 0.33 over the three successive intervals.
(Lintner’s estimates suggest a target payout ratio of around 50%). Therefore the Swiss
numbers are somewhere between the first and the second period (it should be pointed out,
however, that the Swiss sample is much smaller than the US one). Brav et al. also find
very high variability concerning target ratios for the last two periods. It seems that the
relationship suggested by Lintner may have grown weaker over time. It is also known that
payout ratios have decline over time in the US; Swiss data seem to suggest a similar trend
(the average payout ratio for the companies in the sample decreased from 46.28% in 1987
to 25.11% in 2003).
Brav et al. also report that only 28% of the managers in their survey declared they
target the payout ratio, compared to 40% that focused on the dividend per share. Taking
the sample of 60 Swiss companies, only four stated in their annual report for 2003 that
they target the payout ratio. At the same time, most gave special attention to the dividend
per share. The range the four companies gave for the target was between 25 and 33% - a
number which is close to the estimated mean and median targets for the sample. The partial
adjustment model, however, did not perform well for three out of the four companies. It
seems that when the management actually declares a formal target ratio it concerns future
policy rather than past realizations.
It can be reasonably argued that 16 observations are too few to estimate the model.
Table 8 presents the results for 25 companies that had data for the 1975-2003 period. For
the majority of the firms the Lintner model performs quite well; for others, however, it is
clear that there was considerable variation in dividend policy.
To sum up, it seems that there is evidence that payout ratios are relatively stable over
time or that they change gradually. The practice of formally targeting a particular pay-
out ratio, however, while not unusual, is not very widespread. There obviously are some
14

Table 8: Estimation results for the partial adjustment model concerning the payout ratio (25companies, 1975-2003)
Speed of adjustment Target payout ratio Adjusted R2
Mean 0.49 0.29 0.47Median 0.54 0.27 0.45Standard deviation 0.35 0.29 0.21
caveats to consider when one applies the Lintner model to company data. Using annual
data, one needs a long period to estimate the target - and it is quite likely that even if the
payout ratio is indeed targeted, the benchmark itself will have bee adjusted over time (as
a result of business cycles or institutional trends or major unexpected events in the life of
the company). Still, as previous empirical studies have noted, the partial adjustment model
performs reasonably well for a large number of companies.
6.2. Dividends and Past, Current and Future Earnings
Many models suggest that dividends are costly signals of future profitability. This can
explain both why dividends are paid in spite of the tax advantage for capital gains and
why announcements of dividend increases are usually accompanied by positive share price
reactions.
Empirical evidence on the validity of the signalling hypothesis is not completely conclu-
sive. The positive (negative) share price reaction to the announcement of dividend increases
(decreases) is widely documented; however, the precise reasons for this reaction are still a
matter for debate. Yoon and Starks (1995) find that dividend change announcements are
associated with revisions in analysts’ forecasts of current income. Bernheim and Wantz
(1995) find that increases in dividend taxation lead to increases in the share price response
for an increase in dividends (which they call the ”bang-for-the buck”) - therefore an in-
crease in the cost of the signal increases its effectiveness. Kao and Wu (1994) examine the
relationship between unexpected dividend and earnings changes and argue that ”dividends
reflect past, current and future earnings information”. Penman (1983) finds that ”both
dividend announcements and managements’ earnings forecasts possess information about
managements’ expectations”. However, he also notes that firms usually do not fully adjust
their dividends to reflect future expected earnings increases; changes in dividends have less
explanatory power than earnings forecasts. Amihud and Murgia (1997) find that share price
reactions to dividend change announcements are similar in Germany and the US, although
in the former dividends were not tax disadvantaged at the time. Benartzi, Michaely and
Thaler (1997) and Grullon, Michaely and Benartzi (2003) strongly dispute the idea that
dividend changes forecast future changes in earnings.
In order to examine the relationship between dividends and earnings I use data on 73
companies over the 1982-2004 period. The resulting sample has 741 firm-years for which
data on (split-adjusted) dividends per share is available for five previous and at least three
future years. In 48 of these years companies reduced dividends by more than 10% and in 8
of them by less than 10%. In 202 cases there was no change in dividends per share, while in
96 of them dividends were increased by less than 10% and in 242 by more than 10%. In 35
15

of the firm-years there was an initial dividend omission, while in 78 firms continued not to
pay dividends after an initial omission. In 32 years companies resumed dividend payments
(all companies enter the sample beginning with a dividend payment).
The central year in each group is denoted year 0. The previous five years are years -4
to -1, and the following three years are 1 to 3. Dividends are assigned to year t if they are
declared in that particular year (and paid from the net income of year t− 1). The earnings
figures are those reported for the year. Market values for year t are those at the end of the
year.
This section examines the connection between changes in (split-adjusted) dividends per
share and changes in (split-adjusted) earnings per share. The change in dividends in com-
puted as
∆D0/1 =D0 −D−1
D−1,
where D0 are dividends announced in year 0 and D−1 are dividends announced in year -1.
The ”past” growth in earnings is expressed as
Ratio−2/−1 =E−1
E−2,
where E−2 are earnings per share for year -2 and E−1 are earnings per share for year -1.
Therefore it is the change in earnings between the year to which dividend announced in year
0 ”belong” and the previous year. A higher value of the ratio means that earnings were
lower in the year -2 compared to the year -1 - or that dividends are paid from earnings that
were higher than in the previous year. ”Current” earnings growth is computed as
Ratio−1/0 =E−1
E0,
therefore a value below 1 means that earnings in the year dividends were announced were
higher than in the previous year.
”Future” earnings changes are given by
Ratio1/0 =E1
E0.
Years 0 when the number of shares for a company changed by more than 20% have been
excluded from the sample. While some of these years represent mere share splits, others
can reflect mergers, capital reductions and other major events in the life of the company.
Changing the sample to include these observations does not significantly alter results.
This approach has the advantage that dividend omissions and resumed payments can be
treated to some extent in the same framework as as dividend cuts and increases. The main
disadvantage is that years with losses cannot be included in the sample. The connection
between losses and dividend changes is examined in the following subsection.
Observations are grouped according to the sign and size of the change in dividends be-
tween year -1 and year 0. Years with initial dividend omissions, with no dividend payments
following a previous year when there were also no dividends, with resumed dividend pay-
ments and with dividend decreases each form a group. Dividend increases - a more numerous
category - are analysed both by each quintile according to the size of the increase and as a
group. Earnings ratios for each subsample are then compared to a benchmark group that
had no dividend changes in year 0. Both mean and median tests are used in order to get a
clearer picture and minimise the effect of outliers. Earnings ratios are also compared to one
- the null hypothesis being in this case that earnings were flat between the two years.
Table 9 presents results for earnings growth between years -2 and -1. Companies that
omitted dividends in year 0 were the only ones that experienced significant past earnings
16

decreases. Companies that increased dividends had a higher earnings increase than those
that made no changes - median tests suggest that the difference is significant, but mean
tests are not as decisive, perhaps as a result of outliers. Companies that started paying
dividends again in year 0 had the highest earnings increase over the previous period. (The
mean and median earnings ratio were higher for companies that started paying dividends
again compared to companies that merely increased them, and the difference is significant
for the medians). The means and medians for the different quintiles of dividend increases
suggest a higher increase in dividends is related to a higher increase in earnings, although
the relationship is far from strong. For dividend decreases, the situation is not very clear,
with the median tests suggesting earnings stayed flat and the mean test suggesting a slight,
but significant increase. Overall one can say that companies that increased dividends or
resumed payments in year 0 had experienced large past earnings increases, while companies
that omitted them experienced significant decreases. In these respects there seems to be a
strong link between past earnings growth and dividends.
Table 10 examines the relationship between dividend changes declared in year 0 and
earnings changes between year -1 and year 0 (the connection between dividend changes
and current earnings). Except for mean of the first quintile of dividend increases and re-
sumed payments, results are significant or close to significance. Companies that decide to
omit dividends in year 0 experience much lower earnings for that year (a higher number
means a larger decrease in earnings from year -1 to year 0). Earnings are also decreasing,
although not by the same proportion, for companies that cut dividends. Significance tests
suggest that this time there is a large difference between the ”decrease” and the ”no change”
group. Companies that increase dividends have significantly higher earnings in year 0. For
companies that resume dividend payments, one might expect significant earnings increases,
but this is not the case. It seems that when companies decide to restart paying dividends
earnings have already increased over the previous years. Companies that continue not to
pay dividends actually experience the highest earnings increase. Indeed, several empirical
studies (including Benartzi, Michaely and Thaler (1997) and Grullon, Michaely and Thaler
(2003)) suggest that there are high earnings growth rates after a dividend omission as the
company recovers following the crisis.
The picture becomes less clear-cut as soon as we move on to changes in earnings for the
following year. Table 11 presents the results for future earnings changes. While companies
that resumed payments continue to experience earnings increases, this growth is not signif-
icantly different from that of companies that did not change their dividends. For dividend
increasers as a group there is some weak evidence for faster growth, while earnings for div-
idend decreasers remain largely flat. The results for dividend omissions do not allow any
definite conclusion.
Benartzi, Michaely and Thaler (1997) also examine the relationship between past, current
and future earnings growth and dividend changes and conclude that, while the connection
with contemporaneous earnings is strong, dividend changes have little to say about future
earnings changes. Indeed, they emphasize that the only strong connection appears to be
that between dividend cuts and higher earnings growth. As an additional result, they find
that earnings are less likely to fall during the first year after a dividend increase (results are
less significant for the second year).
For comparison, results based on the measures in Benartzi et al. are presented in the
appendix (tables 19 to 22). The indicator is the ratio between net earnings before extraordi-
nary items and preference dividends and the market value of the company at the end of year
-1. Given that US firms pay dividends on a quarterly basis, Benartzi et al. compute annual
dividends as four times the last quarterly dividend in each year. The Swiss sample uses the
17
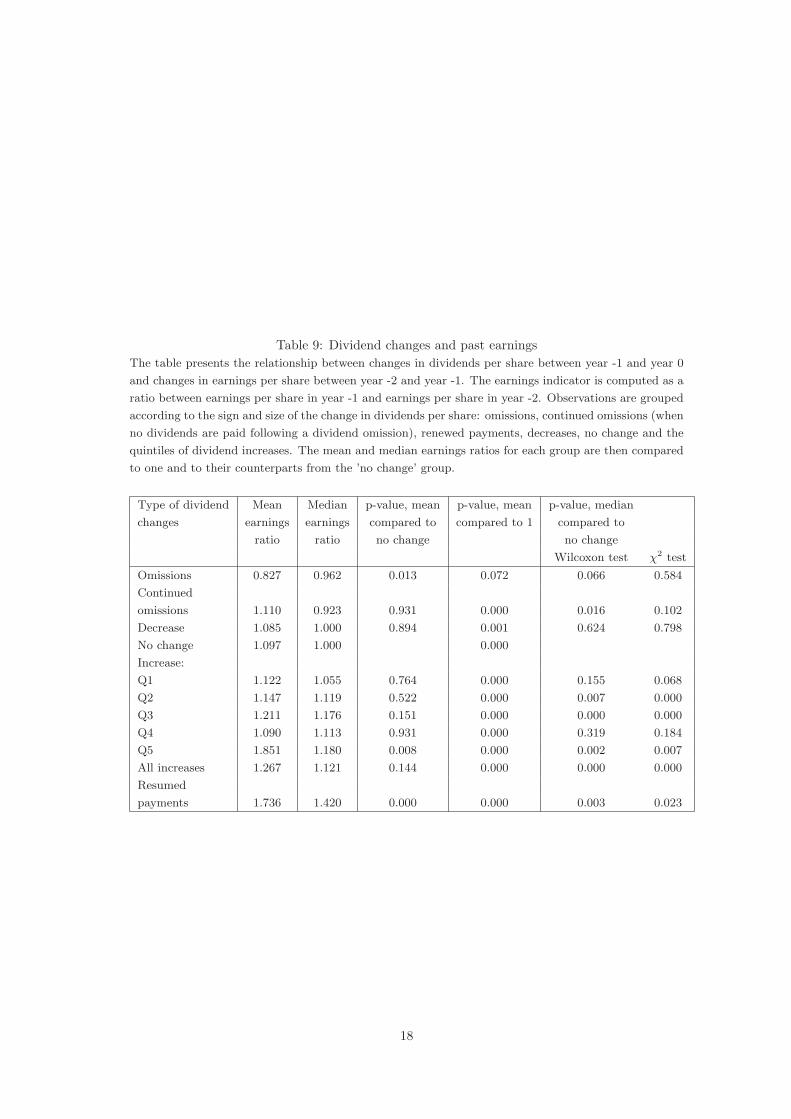
Table 9: Dividend changes and past earningsThe table presents the relationship between changes in dividends per share between year -1 and year 0
and changes in earnings per share between year -2 and year -1. The earnings indicator is computed as a
ratio between earnings per share in year -1 and earnings per share in year -2. Observations are grouped
according to the sign and size of the change in dividends per share: omissions, continued omissions (when
no dividends are paid following a dividend omission), renewed payments, decreases, no change and the
quintiles of dividend increases. The mean and median earnings ratios for each group are then compared
to one and to their counterparts from the ’no change’ group.
Type of dividend Mean Median p-value, mean p-value, mean p-value, median
changes earnings earnings compared to compared to 1 compared to
ratio ratio no change no change
Wilcoxon test χ2 test
Omissions 0.827 0.962 0.013 0.072 0.066 0.584
Continued
omissions 1.110 0.923 0.931 0.000 0.016 0.102
Decrease 1.085 1.000 0.894 0.001 0.624 0.798
No change 1.097 1.000 0.000
Increase:
Q1 1.122 1.055 0.764 0.000 0.155 0.068
Q2 1.147 1.119 0.522 0.000 0.007 0.000
Q3 1.211 1.176 0.151 0.000 0.000 0.000
Q4 1.090 1.113 0.931 0.000 0.319 0.184
Q5 1.851 1.180 0.008 0.000 0.002 0.007
All increases 1.267 1.121 0.144 0.000 0.000 0.000
Resumed
payments 1.736 1.420 0.000 0.000 0.003 0.023
18

Table 10: Dividend changes and current earningsThe table presents the relationship between changes in dividends per share between year -1 and year
0 and changes in earnings per share over the same period. The earnings indicator is computed as a
ratio between earnings per share in year -1 and earnings per share in year 0. Observations are grouped
according to the sign and size of the change in dividends per share: omissions, continued omissions (when
no dividends are paid following a dividend omission), renewed payments, decreases, no change and the
quintiles of dividend increases. The mean and median earnings ratios for each group are then compared
to one and to their counterparts from the ’no change’ group.
Type of dividend Mean Median p-value, mean p-value, mean p-value, median
changes earnings earnings compared to compared to 1 compared to
ratio ratio no change no change
Wilcoxon test χ2 test
Omissions 2.786 1.369 0.000 0.000 0.066 0.015
Continued
omissions 0.765 0.689 0.003 0.099 0.000 0.020
Decrease 1.699 1.202 0.000 0.001 0.005 0.000
No change 0.987 1.000 0.248
Increase:
Q1 1.000 0.970 0.760 0.000 0.939 0.262
Q2 0.903 0.901 0.029 0.000 0.005 0.000
Q3 0.920 0.901 0.137 0.000 0.000 0.000
Q4 0.851 0.850 0.001 0.000 0.000 0.000
Q5 0.920 0.807 0.195 0.000 0.000 0.000
All increases 0.920 0.867 0.024 0.000 0.000 0.000
Resumed
payments 1.453 0.886 0.025 0.000 0.313 0.827
19

Table 11: Dividend changes and future earningsThe table presents the relationship between changes in dividends per share between year -1 and year 0
and changes in earnings per share over the following period. The earnings indicator is computed as a
ratio between earnings per share in year 1 and earnings per share in year 0. Observations are grouped
according to the sign and size of the change in dividends per share: omissions, continued omissions (when
no dividends are paid following a dividend omission), renewed payments, decreases, no change and the
quintiles of dividend increases. The mean and median earnings ratios for each group are then compared
to one and to their counterparts from the ’no change’ group.
Type of dividend Mean Median p-value, mean p-value, mean p-value, median
changes earnings earnings compared to compared to 1 compared to
ratio ratio no change no change
Wilcoxon test χ2 test
Omissions 1.255 0.940 0.615 0.072 0.084 0.047
Continued
omissions 1.350 1.936 0.065 0.000 0.322 0.881
Decrease 1.059 1.000 0.440 0.103 0.092 0.106
No change 1.2547 1.021 0.000
Increase:
Q1 1.141 1.1219 0.642 0.000 0.068 0.067
Q2 1.0589 1.100 0.422 0.000 0.553 0.020
Q3 1.093 1.055 0.513 0.000 0.713 0.651
Q4 1.057 1.106 0.433 0.000 0.698 0.337
Q5 1.080 1.0814 0.480 0.000 0.588 0.211
All increases 1.074 1.087 0.085 0.000 0.499 0.061
Resumed
payments 1.114 1.168 0.693 0.000 0.453 0.537
20

simple annual dividend. As a result, the relationship between earnings and ”past” dividends
for the Swiss sample is close to that shown for year 0 in the Benartzi et al. paper. In the
Swiss case, the change in dividends is that between dividends announced at the beginning
of year -1 and those announced at the beginning of year 0, while the change in earnings
is between years -2 and -1. For the US case, the change in dividends is between dividends
announced at the end of year -1 and dividends announced at the end of year 0, while the
change in earnings is between year -1 and year 0.
The relationship between ”past” earnings growth and dividend changes is similar to that
in the paper based on US data, albeit slightly weaker. The relationship between dividend
changes and earnings growth rates over the following two years are insignificant in both
cases.
Mean earnings over a longer period an also be used to get a broader picture. Table
12 in the appendix presents the situation for mean past earnings over the previous five
years compared to earnings in year 0, while table 13 presents the corresponding situation
for earnings over the following three years. Companies that increase dividends have had
significant earnings growth compared to past values, while companies that omitted them
experienced significant decreases. Earnings are flat for dividend decreasers. As for future
earnings, the mean tests suggest that earnings increase for all groups, but none of them have
changes that are significantly different from the ”no change” group. It is just the median
tests that suggest that earnings growth was lower for the companies that omitted dividends.
One can also examine the connection between dividends and earnings growth using
regression analysis. Table 14 presents results using the variables in Benartzi et al. (1997).
Earnings changes for current and future periods are regressed on the size of the dividend
change. Just like in the study using US data, there is a weakly significant connection only
for the first year.
Table 15 presents the results using the ratios of earnings per share. For current changes
coefficients are significant, but the explanatory power is very low. For future changes coef-
ficients are insignificant and the signs are wrong. For past changes, the signs are right, but
the coefficients are insignificant and the explanatory power of the equation is very low.
Therefore, if categorical analysis shows weak results for the connection between dividend
changes and current and future earnings growth, the situation is even worse for regression
analysis. One of the reason may be that, as Lintner suggested, managers do not fully adjust
dividends to changes in earnings. Since the variability of earnings is obviously higher than
that of dividends, this will result in a low explanatory power for dividend changes. One
could also note that the significant relationships are the ”past” one using income before
extraordinary income and the ”current” one using the final net income. The reason for this
difference might be the earnings smoothing across periods, as suggested for instance by the
model of Fudenberg and Tirole (1995).
So far it seems that dividend changes ”signal” past or current rather than future earnings
growth rates. Thus the role of dividends as signals for future profitability seems open to
doubt. An alternative hypothesis is that dividend changes signal permanent (or persistent)
shifts in earnings. Lintner (1956) suggests that managers are reluctant to increase dividends
if the earnings increase is temporary. The model of Fudenberg and Tirole (1995) suggests
that managers smooth earnings and dividends in order to avoid negative reports that can
jeopardise their position. Therefore managers will only cut dividends if the company’s
position is really bad. Benartzi et al. (1997) actually find that dividend-increasing companies
are less likely to experience dividend decreases over the next two years than companies that
made no changes in their payout.
21

Table 12: Dividend changes and mean past earningsThe table presents the relationship between changes in dividends per share between year 0 and year 1
and changes in earnings per share over the previous years. The earnings indicator is computed as a ratio
between the mean earnings per share over years -4 to -1 and earnings per share in year 0. Observations
are grouped according to the sign and size of the change in dividends per share: omissions, continued
omissions (when no dividends are paid following a dividend omission), renewed payments, decreases, no
change and the quintiles of dividend increases. The mean and median earnings ratios for each group are
then compared to one and to their counterparts from the ’no change’ group.
Type of dividend Mean Median p-value, mean p-value, mean p-value, median
changes earnings earnings compared to compared to 1 compared to
ratio ratio no change no change
Wilcoxon test χ2 test
Omissions 3.101 1.102 0.000 0.000 0.138 0.493
Continued
omissions 2.365 0.826 0.000 0.000 0.951 0.478
Decrease 1.157 1.003 0.451 0.000 0.573 0.444
No change 0.964 0.916 0.101
Increase
Q1 0.854 0.855 0.124 0.000 0.165 0.134
Q2 0.742 0.754 0.002 0.000 0.000 0.000
Q3 0.747 0.698 0.004 0.000 0.000 0.000
Q4 0.736 0.712 0.002 0.000 0.000 0.000
Q5 0.736 0.657 0.004 0.000 0.000 0.000
All increases 0.771 0.743 0.000 0.000 0.000 0.000
Resumed
payments 1.172 0.565 0.306 0.080 0.130 0.008
22
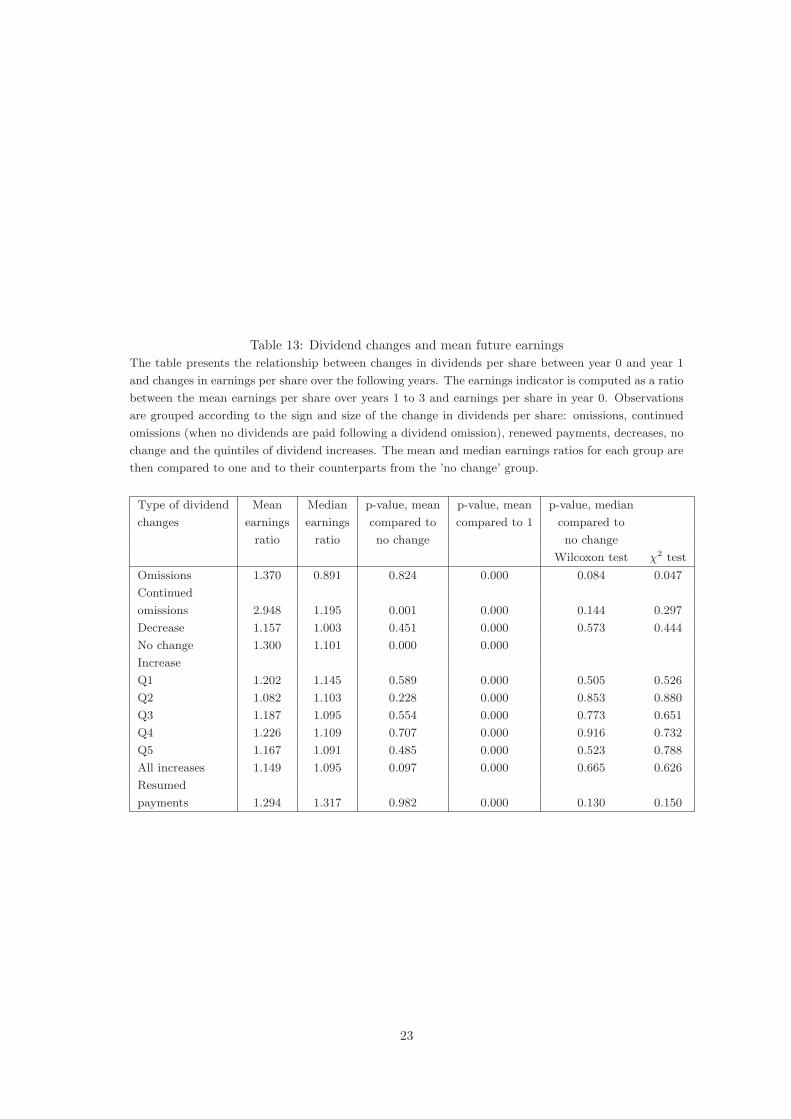
Table 13: Dividend changes and mean future earningsThe table presents the relationship between changes in dividends per share between year 0 and year 1
and changes in earnings per share over the following years. The earnings indicator is computed as a ratio
between the mean earnings per share over years 1 to 3 and earnings per share in year 0. Observations
are grouped according to the sign and size of the change in dividends per share: omissions, continued
omissions (when no dividends are paid following a dividend omission), renewed payments, decreases, no
change and the quintiles of dividend increases. The mean and median earnings ratios for each group are
then compared to one and to their counterparts from the ’no change’ group.
Type of dividend Mean Median p-value, mean p-value, mean p-value, median
changes earnings earnings compared to compared to 1 compared to
ratio ratio no change no change
Wilcoxon test χ2 test
Omissions 1.370 0.891 0.824 0.000 0.084 0.047
Continued
omissions 2.948 1.195 0.001 0.000 0.144 0.297
Decrease 1.157 1.003 0.451 0.000 0.573 0.444
No change 1.300 1.101 0.000 0.000
Increase
Q1 1.202 1.145 0.589 0.000 0.505 0.526
Q2 1.082 1.103 0.228 0.000 0.853 0.880
Q3 1.187 1.095 0.554 0.000 0.773 0.651
Q4 1.226 1.109 0.707 0.000 0.916 0.732
Q5 1.167 1.091 0.485 0.000 0.523 0.788
All increases 1.149 1.095 0.097 0.000 0.665 0.626
Resumed
payments 1.294 1.317 0.982 0.000 0.130 0.150
23

Table 14: Dividend changes and earnings growthThe dependent variable is the change in earnings normalised by the market value of the company
at the end of year -1. The difference is between years -1 and -2 for past growth, years 0 and -1
for current growth and years 1 and 0 for future growth. The change in dividends is computed as
(DPS0−DPS−1)/DPS−1, where DPSt are (split-adjusted) dividends per share. I is a dummy variable
that takes the value 1 for dividend decreases. The numbers in brackets are the p-values. As in Benartzi
et al. (1997), observations with studentized residuals above 2 have been eliminated from the sample.
Variables Past growth Current growth Future growth
Intercept -0.026 0.029 0.018
(0.000) (0.005) (0.094)
Dividend change 0.006 0.008 -0.005
(0.015) (0.148) (0.229)
I∗ div. change 33.856 0.048 -0.006
(0.271) (0.140) (0.856)
D2 0.030 -0.023 -0.016
(0.000) (0.051) (0.265)
D3 0.037 -0.022 -0.025
(0.000) (0.053) (0.078)
D4 0.046 -0.032 -0.012
(0.000) (0.006) (0.409)
D5 0.083 -0.035 -0.021
(0.000) (0.018) (0.149)
Adjusted R2 0.197 0.026 -0.001
Table 15: Dividend changes and changes in earnings per share
Variables Past change Current change Future changeIntercept 1.085 1.083 1.031 0.989 1.137 1.144
(0.000) (0.000) (0.000) (0.000) (0.000) (0.000)Dividend change 0.010 0.011 -0.068 -0.033 -0.026 -0.032
(0.443) (0.393) (0.019) (0.061) (0.278) (0.217)I∗ Div. change -0.035 -1.048 0.178
(0.724) (0.015) (0.509)Adjusted R2 -0.001 -0.002 0.007 0.049 -0.001 -0.003
24

Table 16: Dividend changes and mean past and future earningsThe table presents the relationship between changes in dividends per share between year 0 and year 1
and changes in earnings per share over the surrounding years. The earnings indicator is computed as a
ratio between the mean earnings per share over years 1 to 3 and earnings per share in years -5 to -1.
Observations are grouped according to the sign and size of the change in dividends per share: omissions,
continued omissions (when no dividends are paid following a dividend omission), renewed payments,
decreases, no change and the quintiles of dividend increases. The mean and median earnings ratios for
each group are then compared to one and to their counterparts from the ’no change’ group.
Type of dividend Mean Median p-value, mean p-value, mean p-value, median
changes earnings earnings compared to compared to 1 compared to
ratio ratio no change no change
Wilcoxon test χ2 test
Omissions 1.040 0.678 0.107 0.338 0.016 0.280
Continued
omissions 3.552 1.386 0.001 0.000 0.206 0.094
Decrease 1.013 0.992 0.009 0.631 0.006 0.172
No change 0.964 1.180 0.000
Increase:
Q1 1.483 1.291 0.682 0.000 0.165 0.072
Q2 1.587 0.754 0.288 0.000 0.000 0.000
Q3 1.609 1.516 0.206 0.000 0.001 0.000
Q4 1.743 1.506 0.058 0.000 0.008 0.005
Q5 1.897 1.613 0.006 0.000 0.002 0.008
All increases 1.636 1.435 0.020 0.000 0.000 0.000
Resumed
payments 2.727 2.192 0.000 0.080 0.007 0.061
p-value, mean p-value, median
Wilcoxon test χ2 test
Increases vs. decreases 0.000 0.000 0.000
Resumed payments vs. increases 0.000 0.097 0.157
Table 16 presents the results for the comparison between average earnings for the previous
five years (years -4 to -1) and the following three years (years 1 to 3). The picture seems
quite clear and it lends support Lintner’s claims. Dividend increases are associated with
higher average earnings over the following years. The mean values actually increase from one
quintile to the next, suggesting a correspondence between the size of the dividend increase
and the size of the increase in future earnings. Companies that resume dividend payments
are likely to experience even higher future earnings when compared to the previous years.
The median tests also suggest that dividend decreases and omissions are associated with a
shift to lower earnings levels.
To sum up, it seems that there is some evidence suggesting that the good news dividends
signal is connected with the shift to a higher level of earnings rather than with an increase
in the earnings’ growth rate. The higher growth seems to have taken place in years -1 and 0,
and perhaps the good news brought by the The correlations between dividend changes and
the ratio in mean earnings levels (which exclude dividend omissions and renewed payments)
are significant at 5% (the Pearson correlation) and 1% (the Spearman rank correlation)
25

Table 17: Dividend payments over successive years
First year Next year PercentageDividend omissions: 35 No payment:25 71%
Resumed payments: 10 29%No payments No payment: 57 73%following omissions:78 Resumed payments: 21 27%Resumed payments: 32 No change: 11 34.4%
Dividend increases: 18 56.3%Dividend omissions: 3 9.3%
Dividend decreases: 56 Dividend decreases: 9 16.1%No change: 17 30.4%Dividend increases: 24 42.9%Dividend omissions: 6 10.6%
No change: 202 Dividend cuts:13 6.4%No change: 88 43.6%Dividend increases: 83 41.1%Omissions: 18 8.9%
Dividend increases: 383 Dividend cuts: 37 10.9%No change: 76 22.5%Dividend increases: 208 61.6%Dividend omissions: 17 5%
significance levels.
The appendix presents some robustness tests for the result. Taking just three previous
years instead of five does not significantly alter results (Table 23). Using the difference be-
tween mean net earnings before extraordinary items over the same two periods (normalized
by the market value at the end of year -1) also supports the idea of a sustainable shift in
earnings (Table 24).
A casual look at the data shows that there is some evidence that dividend move slowly
over time, as a result of smoothing or gradual adjustment to ”sustainable” levels. Table
17 presents the observations for year 1 and the dividend changes over the following year.
Dividend increases are most likely to be followed by other increases, and the same is true
for years when dividend payments are resumed. It can be seen from the table that dividend
omissions are likely to extend over several years - this happens in spite of significant im-
provements in earnings, as shown in Table 16.
This subsection has confirmed that there is little connection between dividend changes
and future earnings growth rates. Past earnings growth seems to determine dividend changes
and not the other way round. It seems more likely that dividend changes signal that earn-
ings will move to a new level at least over the medium term. While the higher growth
seems to have taken place before or around the dividend increase, dividends could signal
that earnings will stay at a higher level over the next period. This finding is in agreement
with the intuition in Lintner (1956) and Grullon, Michaely and Swaminathan (2002). To
some extent, it also supports the basic idea of signalling models.
26

6.3. Dividends and losses
The previous section dealt with the relationship between earnings and dividends in years
with positive earnings. This section looks at dividend payments around loss years. Earnings
are measured by ”net income available to common shares” from Datastream.
DeAngelo, DeAngelo and Skinner (1992) find that ”an annual loss is essentially a nec-
essary condition for dividend reductions” for firms with an established history as dividend
payers. They find that dividend cuts and omissions are extremely rare for companies with
positive earnings, while half of loss-making companies cut dividends and 15% of them omit
payments. This can be considered a proof that companies are reluctant to cut dividends,
as suggested for instance by the model of Fudenberg and Tirole. DeAngelo and DeAngelo
(1990) find that companies in financial distress seem reluctant to cut dividends, the most
likely explanation being agency problems between shareholders and debtholders.
Tables 25 and 26 in the appendix present the link between losses and dividend changes
in the case of Swiss companies. The tables include information for all the firm-years with
valid data on dividends and earnings over the 1974-2003 period.
Empirical studies have shown that dividend cuts and omissions are much fewer than
dividend increases. This can be taken as a sign of the managers’ reluctance to cut dividends:
dividends are only increased gradually in order to avoid unfavourable revisions, while cuts
are usually abrupt. This asymmetry is confirmed by the large sample presented here as well
as the smaller one in the previous section.
As suggested by previous research, loss years are much more likely to be associated with
dividend cuts and omissions. Some empirical studies have also suggested that dividends pre-
fer dividend cuts to dividend omissions, since the latter have a more negative interpretation.
DeAngelo et al. (1992) have 108 dividend cuts and 26 omissions out of 2531 firm-years. For
the Swiss sample, the proportion between cuts and omissions is more balanced. As seen in
the previous section, companies tend not to pay dividends for several years after a dividend
omission. The data also show that this happens even if the following years have positive
earnings (the result is also confirmed by the analysis in the previous section).
DeAngelo et al. also show that losses help explain dividend reductions over and above
current profitability or the change in earnings from the previous period. Table 18 presents
the results for the Swiss sample. Observations included in the sample follow at least three
years of positive dividend payments. Earnings are normalized by book value (as in DeAngelo
et al.) and by total assets. The results are quite similar to those in the paper based on
US data. The loss dummy brings additional information even when current and previous
earnings are taken into consideration. One may think that in loss years the additional
negative effect of bad news concerning dividends is smaller.
27

Table 18: Logit regressions for dividend reductionsThe table presents several factors affecting the decision to reduce dividends. The dependent variable is
a binary variable equal to 1 for years with losses and 0 otherwise. NI is net income, BV is the book
value, and TA is total assets.
Variables Coefficients (p-values)
Intercept -1.937 -1.665 -1.433 -1.109
(0.000) (0.000) (0.000) (0.000)
Loss dummy 1.570 1.098
(0.000) (0.045)
NI/BV -0.069 -0.101
(0.173) (0.099)
∆NI/BV 0.0472 0.064
(0.218) (0.197)
NI/TA -13.095 -17.619
(0.003) (0.000)
∆NI/TA 10.014 9.825
(0.006) (0.007)
Pseudo-R2 0.07 0.02 0.10 0.08
P-value, likelihood
ratio test 0.0001 0.043 2.7 ∗ 10−6 3.9 ∗ 10−6
7 Conclusions
The paper has examined several features of dividend policy for a sample of Swiss compa-
nies. Cross-sectional comparisons show negative relationships between dividend payments
and market-to-book ratios, price volatility and leverage, as well as positive relationships
with profitability and (to a lesser extent) firm size and institutional holdings. Ownership
concentration does not seem to have significant effects.
The partial adjustment model based on Lintner’s (1956) idea of dividend payout targets
seems to perform reasonably well for a large number of companies. The model seems to
have practical relevance, in spite of the fact that very few companies actually declare they
are targeting the payout ratio.
Signalling models suggest that dividend changes predict future profitability. The analysis
of the data indicates however that when dividends increase earnings have already increased.
There are no obvious signs of faster growth after positive changes in dividends. Nonetheless,
there is evidence that when dividends increase (decrease) future average earnings will be at
a higher (lower) level compared to the past. Thus the change in dividends may signal a
persistent shift in earnings.
At the same time, there are signs pointing to dividend smoothing and to a significant
relationship between dividend cuts and losses. Overall, the evidence supports Lintner’s
claim that managers increase dividends only when they think the increase in earnings is sus-
tainable. Fudenberg and Tirole (1995) show that risk-averse managers will tend to smooth
dividends and earnings if more recent information counts more in measuring their perfor-
mance. This means that management will be reluctant to increase dividends unless prospects
are reasonably good and will try to avoid reducing dividends unless the situation is indeed
critical or other important information (such as losses) has already reached shareholders.
28

Thus dividend changes become informative about firm performance, although not in the way
proposed by traditional signalling models. It may also be that there is a connection between
managers’ tenure and dividend policy, as suggested by Fudenberg and Tirole. These are
interesting questions that can be explored in further research.
29

References
[1] Franklin Allen, Roni Michaely - Payout Policy, April 2002, at
http://ssrn.com/abstract=309589
[2] Ramasastry Ambarish, Kose John, Joseph Williams - Efficient Signalling with Divi-
dends and Investments, Journal of Finance, 42, 1987, 321-343
[3] Yakov Amihud, Maurizio Murgia - Dividends, Taxes, and Signalling: Evidence from
Germany, Journal of Finance, 52, 1997, 397-408
[4] Shlomo Benartzi, Roni Michaely, Richard Thaler - Do Changes in Dividends Signal the
Future or the Past?, Journal of Finance, 52, 1997, 1007-1034
[5] B. Douglas Bernheim - Tax Policy and the Dividend Puzzle, RAND Journal of Eco-
nomics, 22, 1991, 455-476
[6] B. Douglas Bernheim, Adam Wantz - A Tax-Based Test of the Dividend Signaling
Hypothesis, American Economic Review, 85, 1995, 532-551
[7] B. Douglas Bernheim, Lee S. Redding - Optimal Money Burning: Theory and Applica-
tion to Corporate Dividends, Journal of Economics & Management Strategy, 10, 2001,
463-507
[8] Sudipto Bhattacharya - Imperfect Information, Dividend Policy, and ”The Bird in the
Hand” Fallacy, Bell Journal of Economics, 10, 1979, 259-270
[9] Sudipto Bhattacharya - Nondissipative Signaling Structures and Dividend Policy, Quar-
terly Journal of Economics, 95, 1980, 1-24
[10] Alon Brav, John R. Graham, Campbell R. Harvey, Roni Michaely - Payout Policy in
the 21st century, June 2004 (NBER Working Paper No. 9657)
[11] Robert M. Conroy, Kenneth M. Eades, Robert S. Harris - A Test of the Relative Pricing
Effects of Dividends and Earnings: Evidence from Simultaneous Announcements in
Japan, Journal of Finance, 55, 2000, 1199-1227
[12] Jean Crockett, Irwin Friend - Dvidend Policy in Perspective: Can Theory Explain
Behavior?, Review of Economics and Statistics, 70, 1988, 603-613
[13] Harry DeAngelo, Linda DeAngelo - Dividend Policy and Financial Distress: An Em-
pirical Investigation of Troubled NYSE Firms, Journal of Finance, 45, 1990, 1415-1431
[14] Harry DeAngelo, Linda DeAngelo, Douglas J. Skinner - Dividends and Losses, Journal
of Finance, 47, 1992, 1837-1863
[15] David J. Denis, Diane K. Denis, Atulya Sarin - The Information Content of Dividend
Changes: Cash Flow Signaling, Overinvestment, and Dividend Clienteles, Journal of
Financial and Quantitative Analysis, 29, 1994, 567-587
[16] Philip H. Dybvig, Jaime F. Zender - Capital Structure and Dividend Irrelevance with
Asymmetric Information, Review of Financial Studies, 4, 1991, 201-219
[17] Drew Fudenberg, Jean Tirole - A Theory of Income and Dividend Smoothing Based on
Incumbency Rents, Journal of Political Economy, 103, 1995, 75-93
30

[18] William K. H. Fung, Michael F. Theobald - Dividends and Debt under Alternative Tax
Systems, Journal of Financial and Quantitative Analysis, 19, 1984, 59-72
[19] C. Ghosh, J. R. Woolridge - Stock-Market Reaction to Growth-Induced Dividend Cuts:
Are Investors Myopic?, Managerial and Decision Economics, 10, 1989, 25-35
[20] Yaniv Grinstein, Roni Michaely - Institutional Holdings and Payout Policy, September
2003, (forthcoming, Journal of Finance)
[21] Gustavo Grullon, Roni Michaely, Bhaskaran Swaminathan - Are Dividend Changes a
Sign of Firm Maturity?, Journal of Business, 75, 2002, 387-424
[22] Gustavo Grullon, Roni Michaely, Shlomo Benartzi, Richard H. Thaler - Dividend
Changes Do Not Signal Changes in Future Profitability, October 2003, (forthcoming,
Journal of Business)
[23] Jumming Hsu, Xu-Ming Wang, Chunchi Wu - The Role of Earnings Information in
Corporate Dividend Decisions, Management Science, 44, 1998, S173 - S191
[24] Jeff Hubbard, Roni Michaely - Do Investors Ignore Dividend Taxation? A Reexamina-
tion of the Citizens Utilities Case, Journal of Financial and Quantitative Analysis, 32,
1997, 117-135
[25] Kose John, Joseph Williams - Dividends, Dilution, and Taxes: A Signalling Equilib-
rium, Journal of Finance, 40, 1985, 1053-1070
[26] Shane A. Johnson - Dividend Payout and the Valuation Effects of Bond Announce-
ments, Journal of Financial and Quantitative Analysis, 30, 1995, 407-423
[27] Avner Kalay - Signaling, Information Content, and the Reluctance to Cut Dividends,
Journal of Financial and Quantitative Analysis, 15, 1980, 855-869
[28] Chihwa Kao, Chunchi Wu - Rational Expectations, Information Signalling and Div-
idend Adjustment to Permanent Earnings, Review of Economics and Statistics, 76,
1994, 490-502
[29] Praveen Kumar - Shareholder-Manager Conflict and the Information Content of Divi-
dends, Review of Financial Studies, 1, 1988, 111-136
[30] Owen Lamont - Earnings and Expected Returns, Journal of Finance, 53, 1998, 1563-
1587
[31] Rafael La Porta, Florencio Lopez-de-Silanes, Andrei Shleifer - Agency Problems and
Dividend Policies around the World, Journal of Finance, 55, 2000, 1-33
[32] John Lintner - Distribution of Incomes of Corporations Among Dividends, Retained
Earnings, and Taxes, American Economic Review, 46, 1956, 97-113
[33] John Lintner - Optimal Dividends and Corporate Growth Under Uncertainty, Quarterly
Journal of Economics, 78, 1964, 49-95
[34] Terry A. Marsh, Robert C. Merton - Dividend Behavior for the Aggregate Stock Market,
Journal of Business, 60, 1987, 1-40
[35] Roni Michaely - Ex-Dividend Day Stock Price Behavior: The Case of the 1986 Tax
Reform Act, Journal of Finance, 46, 1991, 845-859
31

[36] Roni Michaely, Richard H. Thaler, Kent L. Womack - Price Reactions to Dividend
Initiations and Omissions: Overreaction or Drift?, Journal of Finance, 50, 1995, 573-
608
[37] Paul Milgrom, John Roberts - Price and Advertising Signals of Product Quality, Journal
of Political Economy, 94, 1986, 796-821
[38] Merton H. Miller, Franco Modigliani - Dividend Policy, Growth, and the Valuation of
Shares, Journal of Business, 34, 1961, 411-413
[39] Merton H. Miller, Kevin Rock - Dividend Policy Under Asymmetric Information, Jour-
nal of Finance, 40, 1985, 1031-1051
[40] Stephen H. Penman - The Predictive Content of Earnings Forecasts and Dividends,
Journal of Finance, 38, 1983, 1181-1199
[41] Huntley Schaller - Asymmetric Information, Liquidity Constraints, and Canadian In-
vestment, Canadian Journal of Economics, 26, 1993, 552-574
[42] Alessandro Sembenelli - Signalling, Financial Hierarchy and Agency Theory as Expla-
nations for Dividend Behaviour: Evidence from Italian Firm Data, Managerial and
Decision Economics, 14, 1993, 37-45
[43] Brett Trueman, Sheridan Titman - An Explanation for Accounting Income Smoothing,
Journal of Accounting Research, 26, 1988, 127-139
[44] Richard H. Thaler, H. M. Shefrin - An Economic Theory of Self-Control, Journal of
Political Economy, 89, 1981, 392-406
[45] Pyung Sig Yoon, Laura T. Starks - Signaling, Investment Opportunities, and Dividend
Announcements, Review of Financial Studies, 8, 1995, 995-1018
32

8 Appendix
Table 19: A. Dividend changes and past earningsThe table presents the relationship between dividend changes and current earnings growth. Earnings
growth is computed as NE−1 −NE−2/MV−1, where NEt represents net income in year t and MVt the
market value at the end of year t.
Type of dividend Mean Median p-value, mean p-value, median
changes earnings earnings compared to compared to
ratio ratio no change no change
Wilcoxon test χ2 test
Omissions -39.90 -9.48 0.00 0.00 0.07
Continued omissions 12.98 23.60 0.10 0.01 0.03
Decrease -3.26 -1.16 0.24 0.01 0.05
No change -0.54 0.01
Increase
Q1 1.29 0.79 0.40 0.00 0.00
Q2 1.44 1.29 0.33 0.00 0.00
Q3 2.19 1.87 0.19 0.00 0.00
Q4 3.90 2.12 0.01 0.00 0.00
Q5 7.60 3.29 0.01 0.00 0.00
All increases 3.63 1.81 0.00 0.00 0.00
Resumed payments 16.18 31.63 0.59 0.00 0.00
Table 20: B. Dividend changes and past earnings growthThe table presents the relationship between dividend changes and current earnings growth. Earnings
growth is computed as NE−1 −NE−2/MV−2, where NEt represents net income in year t and MVt the
market value at the end of year t.
Type of dividend Mean Median p-value, mean p-value, median
changes earnings earnings compared to compared to
ratio ratio no change no change
Wilcoxon test χ2 test
Omissions -17.44 -8.50 0.00 0.00 0.07
Continued omissions 31.62 29.79 0.02 0.01 0.03
Decrease -2.30 -1.41 0.38 0.01 0.05
No change -0.31 0.01
Increase
Q1 1.33 0.90 0.73 0.00 0.00
Q2 1.73 1.39 0.63 0.00 0.00
Q3 3.10 2.61 0.33 0.00 0.00
Q4 8.04 3.67 0.00 0.00 0.00
Q5 10.64 3.91 0.00 0.00 0.00
All increases 4.96 2.28 0.01 0.00 0.00
Resumed payments 7.23 4.69 0.14 0.00 0.00
33
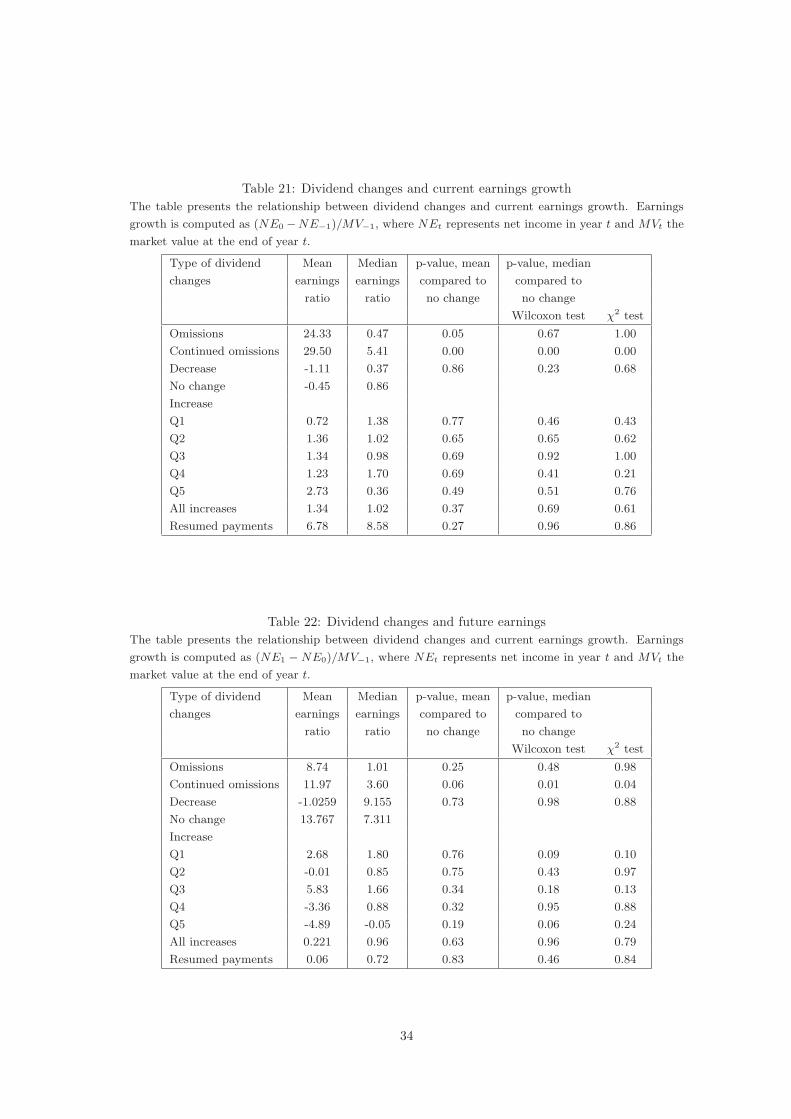
Table 21: Dividend changes and current earnings growthThe table presents the relationship between dividend changes and current earnings growth. Earnings
growth is computed as (NE0 −NE−1)/MV−1, where NEt represents net income in year t and MVt the
market value at the end of year t.
Type of dividend Mean Median p-value, mean p-value, median
changes earnings earnings compared to compared to
ratio ratio no change no change
Wilcoxon test χ2 test
Omissions 24.33 0.47 0.05 0.67 1.00
Continued omissions 29.50 5.41 0.00 0.00 0.00
Decrease -1.11 0.37 0.86 0.23 0.68
No change -0.45 0.86
Increase
Q1 0.72 1.38 0.77 0.46 0.43
Q2 1.36 1.02 0.65 0.65 0.62
Q3 1.34 0.98 0.69 0.92 1.00
Q4 1.23 1.70 0.69 0.41 0.21
Q5 2.73 0.36 0.49 0.51 0.76
All increases 1.34 1.02 0.37 0.69 0.61
Resumed payments 6.78 8.58 0.27 0.96 0.86
Table 22: Dividend changes and future earningsThe table presents the relationship between dividend changes and current earnings growth. Earnings
growth is computed as (NE1 −NE0)/MV−1, where NEt represents net income in year t and MVt the
market value at the end of year t.
Type of dividend Mean Median p-value, mean p-value, median
changes earnings earnings compared to compared to
ratio ratio no change no change
Wilcoxon test χ2 test
Omissions 8.74 1.01 0.25 0.48 0.98
Continued omissions 11.97 3.60 0.06 0.01 0.04
Decrease -1.0259 9.155 0.73 0.98 0.88
No change 13.767 7.311
Increase
Q1 2.68 1.80 0.76 0.09 0.10
Q2 -0.01 0.85 0.75 0.43 0.97
Q3 5.83 1.66 0.34 0.18 0.13
Q4 -3.36 0.88 0.32 0.95 0.88
Q5 -4.89 -0.05 0.19 0.06 0.24
All increases 0.221 0.96 0.63 0.96 0.79
Resumed payments 0.06 0.72 0.83 0.46 0.84
34

Table 23: Dividend changes and mean past and future earningsThe table presents the relationship between changes in dividends per share between year 0 and year 1
and changes in earnings per share over the surrounding years. The earnings indicator is computed as a
ratio between the mean earnings per share over years 1 to 3 and earnings per share in years -3 to -1.
Observations are grouped according to the sign and size of the change in dividends per share: omissions,
continued omissions (when no dividends are paid following a dividend omission), renewed payments,
decreases, no change and the quintiles of dividend increases. The mean and median earnings ratios for
each group are then compared to one and to their counterparts from the ’no change’ group.
Type of dividend Mean Median p-value, mean p-value, mean p-value, median
changes earnings earnings compared to compared to 1 compared to
ratio ratio no change no change
Wilcoxon test χ2 test
Omissions 4.807 1.699 0.000 0.000 0.015 0.479
Continued
omissions 2.509 1.782 0.000 0.000 0.018 0.151
Decrease 0.929 0.877 0.014 0.000 0.005 0.139
No change 1.347 1.115 0.000
All increases 1.498 1.331 0.107 0.000 0.000 0.000
Resumed
payments 0.925 0.602 0.072 0.099 0.001 0.012
p-value, mean p-value, median
Wilcoxon χ2
Increases vs. decreases 0.000 0.000 0.000
Resumed payments vs. increases 0.000 0.122 0.310
35

Table 24: Dividend changes and mean past and future earningsThe table presents the relationship between changes in dividends per share between year 0 and year 1
and changes in earnings over the surrounding years. The earnings indicator is computed as (NE1 −NE0)/MV−1, where NE1 is the mean earnings before extraordinary items over years 1 to 3 and NE0
is its counterpart for years -5 to -1, and MV−1 is the market value at the end of year -1. Observations
are grouped according to the sign and size of the change in dividends per share: omissions, continued
omissions (when no dividends are paid following a dividend omission), renewed payments, decreases, no
change and the quintiles of dividend increases.
Type of dividend Mean Median p-value, mean p-value, mean p-value, median
changes earnings earnings compared to compared to 0 compared to
ratio ratio no change no change
Wilcoxon test χ2 test
Omissions 6.486 0.038 0.185 0.043 0.044 0.003
Continued
omissions 44.582 2.405 0.000 0.000 0.333 0.390
Decrease 1.742 0.218 0.126 0.016 0.061 0.045
No change 3.049 3.421 0.000
All increases 7.158 4.464 0.064 0.000 0.040 0.440
Resumed
payments 14.107 32.297 0.008 0.000 0.262 0.672
p-value, mean p-value, median
Wilcoxon χ2
Increases vs. decreases 0.015 0.001 0.057
Resumed payments vs. increases 0.151 0.858 0.421
Table 25: The relationship between changes in (split-adjusted) dividends per share and losses inthe year they are declared
Number of Loss years Non-loss years % of loss years % of non-loss yearsInitial dividend omissions 49 49 18.85% 3.02%No dividends following omissions 68 135 26.15% 8.32%Dividend cuts 23 116 8.85% 7.15%Dividend initiations 2 47 0.77% 2.9%Dividend increases 20 420 7.69% 25.89%No change 98 855 37.69% 52.71%Total 260 1622 100% 100%
36

Table 26: The relationship between changes in (split-adjusted) dividends per share and losses inthe year before they are declared
Number of Loss years Non-loss years % of loss years % of non-loss yearsInitial dividend omissions 50 52 18.87% 3.04%No dividends following omissions 104 132 39.25% 7.71%Dividend cuts 13 117 4.90% 6.83%Dividend initiations 0 54 0% 3.15%Dividend increases 12 454 4.46% 26.5%No change 86 904 32.45% 52.77%Total 265 1713 100% 100%
37