DIVERSIFICATION STRATEGIES AND FINANCIAL …
20
International Journal of Management and Commerce Innovations ISSN 2348-7585 (Online) Vol. 9, Issue 1, pp: (466-485), Month: April 2021 - September 2021, Available at: www.researchpublish.com Page | 466 Research Publish Journals DIVERSIFICATION STRATEGIES AND FINANCIAL PERFORMANCE IN MOBILE TELECOMMUNICATION INDUSTRY, KENYA: A CASE OF SAFARICOM PUBLIC LIMITED COMPANY OSCAR KEYA AGESA A RESEARCH PROJECT SUBMITTED TO THE SCHOOL OF BUSINESS IN PARTIAL FULFILLMENT OF THE REQUIREMENTS FOR THE AWARD OF DEGREE OF MASTER OF BUSINESS ADMINISTRATION (STRATEGIC MANAGEMENT OPTION) OF KENYATTA UNIVERSITY Abstract: Over the past two decades firms have had a turbulent business environment owing to several factors that directly affect how they conduct their normal business. As such they have had to adopt different strategies to ensure that they survive in the long run. The specific objectives were to examine the effect of horizontal, concentric and conglomerate diversification strategies on financial performance in the mobile telecommunication industry. This research could be of importance to the management of the telecommunication companies, to future scholars and as reference material for further studies in this area. The study used four main theories namely, Resource based view theory, Ansoff theory, transaction cost theory and the agency theory. The research used descriptive design. In order to determine the sample population, proportionate stratified sampling method was employed. The total target population was 490 and a sample of 30% was drawn with the sample size being 147. Analysis for collected data was then done using descriptive statistics and presented using charts, graphs and tables. The relationship between the study variables was analyzed using simple regression analysis and correlation analysis. Validity was determined by use of well-structured questionnaires1with both open1and close ended questions. Reliability on the other hand was guaranteed by subjecting the questionnaire to a pretest in a pilot study. Data was collected using questionnaires and through a data sheet for secondary data. Collected information was analysed using inferential and descriptive data with the aid of1SPSS. Results were computed using standard deviation, means, percentages, tables and frequencies. The study revealed a significant strong positive correlation between concentric diversification and financial performance of the firm (r=0.665, p=0.00). Further, significant strong positive1correlation between financial performances of the firm and conglomerate diversification (r=0.732; p= 0.00) was established by the study. The study also found a significant positive1correlation between financial performance of the firm and internal diversification (r= 0.727, p= 0.000). Additionally, the study established a significant strong positive correlation between financial performances of the firm and horizontal diversification (r= 0.704; p= 0.000). Based on the aggregated means for each variable and the inferential statistics, conglomerate diversification was the most significant diversification strategy employed by Safaricom Public limited company. Thereby depicting Safaricom Public limited company as an innovative firm that keeps on adding new products and services to its existing products and services. Research recommends that Mobile Telecommunication companies’ managers must invest in diversification strategies to increase their income sources. This will ensure that the firm has a stable income in the event that one or two of its revenue streams are affected. Keywords: mobile telecommunication industry, telecommunication companies, Safaricom Public limited company.
Transcript of DIVERSIFICATION STRATEGIES AND FINANCIAL …

International Journal of Management and Commerce Innovations ISSN 2348-7585 (Online) Vol. 9, Issue 1, pp: (466-485), Month: April 2021 - September 2021, Available at: www.researchpublish.com
Page | 466 Research Publish Journals
DIVERSIFICATION STRATEGIES AND
FINANCIAL PERFORMANCE IN MOBILE
TELECOMMUNICATION INDUSTRY,
KENYA: A CASE OF SAFARICOM PUBLIC
LIMITED COMPANY
OSCAR KEYA AGESA
A RESEARCH PROJECT SUBMITTED TO THE SCHOOL OF BUSINESS IN PARTIAL FULFILLMENT OF THE
REQUIREMENTS FOR THE AWARD OF DEGREE OF MASTER OF BUSINESS ADMINISTRATION
(STRATEGIC MANAGEMENT OPTION) OF KENYATTA UNIVERSITY
Abstract: Over the past two decades firms have had a turbulent business environment owing to several factors that
directly affect how they conduct their normal business. As such they have had to adopt different strategies to
ensure that they survive in the long run. The specific objectives were to examine the effect of horizontal, concentric
and conglomerate diversification strategies on financial performance in the mobile telecommunication industry.
This research could be of importance to the management of the telecommunication companies, to future scholars
and as reference material for further studies in this area. The study used four main theories namely, Resource
based view theory, Ansoff theory, transaction cost theory and the agency theory. The research used descriptive
design. In order to determine the sample population, proportionate stratified sampling method was employed. The
total target population was 490 and a sample of 30% was drawn with the sample size being 147. Analysis for
collected data was then done using descriptive statistics and presented using charts, graphs and tables. The
relationship between the study variables was analyzed using simple regression analysis and correlation analysis.
Validity was determined by use of well-structured questionnaires1with both open1and close ended questions.
Reliability on the other hand was guaranteed by subjecting the questionnaire to a pretest in a pilot study. Data was
collected using questionnaires and through a data sheet for secondary data. Collected information was analysed
using inferential and descriptive data with the aid of1SPSS. Results were computed using standard deviation,
means, percentages, tables and frequencies. The study revealed a significant strong positive correlation between
concentric diversification and financial performance of the firm (r=0.665, p=0.00). Further, significant strong
positive1correlation between financial performances of the firm and conglomerate diversification (r=0.732; p=
0.00) was established by the study. The study also found a significant positive1correlation between financial
performance of the firm and internal diversification (r= 0.727, p= 0.000). Additionally, the study established a
significant strong positive correlation between financial performances of the firm and horizontal diversification (r=
0.704; p= 0.000). Based on the aggregated means for each variable and the inferential statistics, conglomerate
diversification was the most significant diversification strategy employed by Safaricom Public limited company.
Thereby depicting Safaricom Public limited company as an innovative firm that keeps on adding new products
and services to its existing products and services. Research recommends that Mobile Telecommunication
companies’ managers must invest in diversification strategies to increase their income sources. This will ensure
that the firm has a stable income in the event that one or two of its revenue streams are affected.
Keywords: mobile telecommunication industry, telecommunication companies, Safaricom Public limited company.

International Journal of Management and Commerce Innovations ISSN 2348-7585 (Online) Vol. 9, Issue 1, pp: (466-485), Month: April 2021 - September 2021, Available at: www.researchpublish.com
Page | 467 Research Publish Journals
Abbreviations and Acronyms:
ARPU Average Revenue per User
CAK Communication Authority of Kenya
GSM Global System for Mobile Communication
RBV Resource Based View
ISSN International Standard Serial Number
MVNO Mobile Virtual Operating Networks
PLC Public Limited Company
1. INTRODUCTION
1.1 Background to the Study
The present economy and its globalization have rapidly influenced business competitiveness and survival ratings within
the telecommunications industry. The telecommunications industry needs to develop future strategic moves and change to
a more adaptive business framework, and strategic plans are one of those methods used in managing such environmental
changes (Baum & Wally, 2003). Competitive strategies include all corporate acts to maintain competitiveness and
develop a wider customer base (Thompson & Strickland, 2010). According to Porter (2000) there are several ways to
develop competitive strategy: strategy of low-cost management, strategy of differentiation and focusing on a certain
market. Lester (2009) added that; the competitive strategy influences the firms‟ goals and profitability.
Diversification is outlined as a firms‟ entry into new lines of business (Homburg, Krohmer & Workman, 2015), involving
both operations and markets (Ibrahim & Kaka, 2007). The relevance of diversification is realized in how it elevates the
opportunities for business and increases its sources of profitability. Palepu (2012) reinforces the importance of
diversification strategies to the overall strategy of a firm. Given its considerable interest to academicians and managers,
changing markets makes diversification important for growing firms to stay relevant (Teo, 2001). The connectedness of
diversification to corporate financial performance is a highly researched topic in strategic management. There however
seems to be insufficient knowledge that may be unreliable, with a variance of results that brings about contradictory
interpretations (Mohindru & Chander, 2007).
1.1.1 Financial Performance
Neely, Gregory and Platts (2015) defines financial performance as the resulting outcome of efficiency and effectiveness a
firm has put in its resource utilization. As a result, according to Lebas (2016), performance evaluation is the
transformation of the dynamic reality of performance into ordered symbols that can be connected and relayed under
similar conditions. Performance assessment is a vital part of business development. This concept is like that of Bititci,
Carrie, and McDevitt (2017), who described performance management as a mechanism aimed at aligning organizational
goals, priorities, and functions. The company's success is reflected in the financial statement, according to Herly and
Sisnuhadi (2019). A high-performing business would affirm management's commitment to quality transparency in this
regard.
Financial performance includes the following tenets of measurement; revenue, profits, market position, cash flow, and
earnings per share, returns on investment. It is said that an organization‟s capabilities promote positive returns. A good
example is the performance management capability to influence financial performance by enabling the review of actions
and taking corrective measures by leaders in a timely fashion. For purpose of this study, performance of Safaricom will be
measured in financial terms that includes return on1assets, market share, return1on1investment and operating cash flow.
1.1.2 Diversification Strategy
Diversification is a scheme to extend a firms‟ operations beyond its existing scope. The main aim for diversification for
most firms may be to extend its resources (economies of scope), to develop its markets and increase its customer base by
diversifying products and services. The result is diversifying its risks and losses by cross-subsidizing surpluses earned
from the different ends of its varied business (Luo & Liu, 2009). Diversification can be implemented through corporate
development beyond present product or service offerings into newer markets within the company value network
(concentric strategy). It can also be carried out through developing a conglomerate strategy by creating products/services
further from its current value network (Johnson, Scholes, & Whittington, 2009). Related diversification results in the
realizations of scope of economies and economies of integration and the collaborative economies are the sole benefits.
This is achieved through common channels of distribution, advertising, and communication. Porter (1980) distinguishes
the horizontal strategy of shared activities as most viable since it adds more value to the value chain as a result of
established tangible interrelationships. Unrelated1diversification1on the1other hand1is often considered as a way of
achieving financial synergy and the financial gains of an internal capital market.

International Journal of Management and Commerce Innovations ISSN 2348-7585 (Online) Vol. 9, Issue 1, pp: (466-485), Month: April 2021 - September 2021, Available at: www.researchpublish.com
Page | 468 Research Publish Journals
Concentric diversification alternatively, involves dealing with extra business that benefits from the basic operations of the
firm. A firm is said to have adopted concentric diversification when it has developed new products and services within its
line of business in the recent past – mostly a year. These could be clustered under four classes namely, business results,
business yields, qualitative indicators and capacity. Profit is the result indicator and as production increases this implies
the business is growing (Olomi, 2004). The capacity indicators including capital investment, business assets, workforce
and production capacity indicate the business potential to yield output and this outcome.
The indicator of conglomerate/unrelated diversification strategy is new lines of business created by the company for
instance a banking organization deciding to venture into telecommunication industry. In order for unrelated diversification
to be of benefit to the shareholders, there is need for a diversified business portfolio to support the set goals (Burns, 2013).
1.1.3 Telecommunication Industry in Kenya
For many years, the telecommunication industry in Kenya has had very little or otherwise slow growth in terms of1the
number of companies. The1industry is made of 4 major players namely Safaricom, Airtel, Telkom and Finserve that
provide several communication services such as telephony, infrastructure support, mobile money services and internet.
According to CAK Annual Report (2013), the telecommunication industry accounted for more than 6% of the annual
Gross Domestic Product for the year. This industry enabled the rapid economic growth witnessed in the year.
Subscriptions for mobile telephony in the country has grown 100-fold since the year 2000 (O‟Dea 2021). This is
attributed to the fact that people own more than one SIM card in Kenya because of the competitive price offering by the
different players for the diverse services they offer. As at the end of the year 2019, active mobile money subscriptions
stood at 29.7 million which reprsents 64% of the population. Similarly, voice traffic for local operators increased by close
to a half billion minutes from 13.9 billion to 14.3 billion minutes in the same period under review. These statistics indicate
that mobile telephony in Kenya has become a necessity in the daily lives of the populace. As at January 2020, there were
22.86 million internet users in the country, this being an increase of 16% from the previous year. This figure represents
43% of the population who own mobile telephones in the country (Maina 2016).
1.1.4 Safaricom Public Limited Company
Safaricom services started in 1997 and it increased its operations in 2000. At this point, Kencell took second place with
Safaricom taking the lead on network operations after receipt of operating license. With an increase in subscriptions
between customers from 29.7-32.2 million within a span of 2 years, it was linked to the closing of unregistered SIM cards.
Mobile money transfer services also increased to 61.50 % in 2012/13 Fiscal Year from 49.38 % in 2011/12 fiscal year
because of cellular availability, more agents and value added on services. Growth of cell data also influenced internet
connectivity and growth of subscriptions was also recorded; with 12.43 million internet subscriptions, 19.65 million
projected users of internet accounting for 48.3% internet penetration against the previous year‟s 35.5%. An increase in
demand for Safaricom services and support made the call center receive more than a hundred thousand calls per day. This
demand necessitated the introduction of a self-service tool for customers. This is when the Safaricom App was rolled out
in the year 2017. Queries previously sought by customers on bill payment, data usage and person to person reversals
could now be accessed directly from the customers handset. Since its launch, the USSD solution has been used by 24
million people every day, with over 700,000 mobile users using the service on a regular basis (Safaricom Annual Report
2018).
Safaricom Public Limited company has deployed diversification strategies by expanding its product ranging and
venturing into markets that were considered no go zone for mobile companies. This has ensured that Safaricom continues
to report improved financial performance year-on-year, gain competitive edge and maintain a loyal customer base. Mpesa
on the other hand has become a global reference to mobile money transfer success story leading to many
telecommunication companiess worldwide trying to replicate the same in their markets. This is evident with the current
diversification into the Ethiopian market for mpesa being sought by Safaricom that will lead to more business thus more
profits.
1.2 Statement of the Problem
Companies on a global scale strive to report good profits every end of their financial year. This necessitates continual
development of the goods and services they offer while at the same time venturing into virgin markets. Company
executives thus have to develop unique diversification strategies in order to increase returns on investment. There is need
for a unique set of diversification strategies that Safaricom Public Limited Company needs to employ in order to remain

International Journal of Management and Commerce Innovations ISSN 2348-7585 (Online) Vol. 9, Issue 1, pp: (466-485), Month: April 2021 - September 2021, Available at: www.researchpublish.com
Page | 469 Research Publish Journals
as the top telecommunications service provider of choice in the region by market share (Waema 2008). The firm has
continued to report a steady decline in market share over the past five years. This has led to the firm employing various
strategies to allow it to continue reporting favorable results despite the falling market share. It is worth noting that in
previous years, FY 2010, Safaricom market share according to the KPMG was 78%. The report also indicates that in FY
2011, the market share fell to 72%. This highlights that Safaricom is ceding its market share to its competitors year in year
out. These shortfalls are despite the company‟s effort to remain attractive in the market. From 2012, Safaricom has
brought to the market various innovative products, notably Mshwari in 2012, Hakikisha service in 2015 and Mpesa
Global. This signals an urgent need to investigate the factors that are responsible for the company to lose its share in the
telecommunication market.
The connectedness of diversification to financial performance is highly researched yet, there is insufficient knowledge and
empirical studies are often contradictory. Karanja (2013) in his research for Kenol/Kobil, established that the firm had
applied different diversification strategies constantly to emerge as a leading oil company in the last decade. In the last one
year, there has been a remarkable shift in market share among the three main mobile telecommunication companies. This
study thus seeks to understand what strategies Safaricom has employed in order to stay at the top. Despite the huge costs
incurred by these companies in a bid to diversify, there has not been a clear link between these costs of diversification and
returns. Researcher examines the beginning of diversification and its influences on finances (Elango, Ma & Pope, 2008).
Given that various efforts to establish the results of performance diversification are indecisive resulting from conflicting
indication developing from such research, a lot of the researches done until now have relied on the involvements of
industrialized economies companies. Based on the above studies and the varying results, we thus seek to fill the gap on
the actual relation between performance and diversification. This research will thus help to measure the impact of
diversification on the financial performance with reference to Safaricom Public Limited Company.
1.3 Objectives of the Study
1.3.1 General Objective
The general study objective was to1establish the effect of diversification strategies on financial performance of the
Kenyan mobile telecommunication sector.
1.3.2 Specific Objectives
This study was guided by the following1objectives:-
i. To establish the effect of horizontal diversification strategies on financial performance of the firm.
ii. To establish the effect of internal diversification strategies on financial performance of the firm.
iii. To determine the effect concentric diversification strategies on financial performance of the firm.
iv. To establish the influence of conglomerate diversification strategies on financial performance of the firm.
1.4 Research Questions
This study was guided by the following research1questions:
i. What is the effect of horizontal diversification strategies on financial performance of the firm?
ii. What is the effect of internal diversification strategies on financial performance of the firm?
iii. What is the effect the influence of concentric diversification strategies on financial performance of the firm?
iv. What is the effect of conglomerate diversification strategies on financial performance of the firm?
1.5 Significance of the Study
This research could be of importance to the management of the companies. The study's findings would be crucial in
demonstrating the connection between diversification strategies and the company's financial success. This could be
relevant in making of policies by managers in the industry that will steer individual companies to enhanced performances.
Secondly, the study will point out gaps in knowledge that future scholars should aim at filling. Further, the study forms an
important reference material for scholars pursuing studies related to performance and diversification tactics by
organizations.

International Journal of Management and Commerce Innovations ISSN 2348-7585 (Online) Vol. 9, Issue 1, pp: (466-485), Month: April 2021 - September 2021, Available at: www.researchpublish.com
Page | 470 Research Publish Journals
1.6 Scope of the study
The study focused on determining the effect of diversification strategies on financial results in the mobile
telecommunications market, using Safaricom Public Limited Company as an example. In particular, the study sought
to1establish the impact of horizontal diversification strategies, internal diversification strategies, concentric diversification
strategies and conglomerate diversification strategies on financial1performance of the firm. The research targeted a
population of 490 respondents and selected a sample size of 147 being 30% of the entire population. The research was
done in the Safaricom‟s head office in Nairobi. The study was done over duration of six months since the development of
the proposal to the demonstration of results.
2. LITERATURE REVIEW
2.1 Introduction
The research of diversification has interested scholars being a frequently researched area of business. Study also has
scrutinized the diversification antecedents and how it influences monetary performance. Strategic management study has
lacked to find reliable and clear association patterns of performance and diversification most of which are indecisive. For
example, while Lei and Schmit (2009) determined that insurers that are more spread have better performance financially,
Chakrabarti et al. (2007), resolved that divergence is related to inferior performance for independent firms and affiliated
firms. Given the challenge of inconclusive and conflicting evidence between various researches on the topic, most of the
investigations also focus in the experience of industrialized companies. In his book “Curvilinear in the Diversification-
Efficiency Linkage: An Analysis of Over Three Decades of Research,” Palich Cardinal and Miller (2000) has clearly
given an elaborate association between organizations financial performance and diversification. This Chapter is organized
in three main parts; the theoretical1review, empirical1review and conceptual1framework.
2.2 Theoretical Literature Review
2.2.1. Resource Based View Theory
Resource1based view was1developed by1Penrose in 1959 as argued by Kor and Mahoney (2014) stating that
diversification of a company is based upon exploiting its resources which it has accumulated over the past. Barney (1991)
examines the attributes that the isolated resources of a firm must possess so as to have a long-term
competitive1advantage. The RBV assumes firm‟s resources to be heterogeneous and scarce. This theory states that the
development of an enterprise is reliant upon its opportunities and earning power. Penrose's theory introduced RBV. This
theory holds the assumption that a firm must obtain and control non-substitutable, rare, and valuable assets and resources.
The firm needs to have a range of products that are non-substitutable in the market for it to gain competitive advantage.
The major critique of this theory is its assumption that the strategies firms pursue and the resources they control are all
identical, and the strategies a company employs are reactive as opposed to proactive in nature.
2.2.2 Ansoff Theory
This theory was pioneered by Igor Ansoff in 1965 by creating a tool that has helped firms come up with their market and
product growth strategies. He developed a growth matrix that postulates that a company can diversify horizontally by
market penetration, industry expansion, or diversification are both examples of new product development. This theory
informed horizontal diversification strategies of Safaricom that are spearheaded by market segmentation, development of
new trade channels and new departments or divisions that focus on particular product development and go to market
activities. An organization realizes market penetration through scaling of its sale volumes in existing markets. According
to Palich and Miller (2015), Market development focuses of introducing existing products to new markets, while product
development, coming up with a new product for existing clients.
2.2.3. Transaction Cost Theory
According to Ronald Coase (1937), the objective of an organization is to use factors of production at a lower cost than
competition. The transaction cost theory in this study will help us understand conglomerate diversification strategy. This
theory majors on two assumptions. One is that individuals in a firm pursue their own interests regardless of the cost effect
to a firm that is they are always opportunistic in nature. The other assumption is that information on the past, present and
future states is unknown. These assumptions stipulate why companies incur more costs for market based transactions and
why they need to be more cost effective as compared to the market. A company chooses the form that minimizes both
production and transaction costs. This theory is relevant in the study for breaking down cash flow as variable in internal
diversification for the firm. A critique of this theory is that it is not clear what factors affect the level of transactions in a
particular firm.

International Journal of Management and Commerce Innovations ISSN 2348-7585 (Online) Vol. 9, Issue 1, pp: (466-485), Month: April 2021 - September 2021, Available at: www.researchpublish.com
Page | 471 Research Publish Journals
2.2.4. Agency Theory
The proponent of agency1theory was Smith in 1937. This theory forecasts that if non-owners manage a firm, it is possible
for them not to work for the benefit of the owners. Agency theory (Jensen & Meckling, 1976) shows separating both
owner and manager of an establishment causes an emergence due to lack of common interest. These are known as agency
costs, they include monitoring expenses and opportunity cost resulting from the management hierarchy that affects the
speed of decision-making.g In assessing corporate assets, on the other hand, as indices of management effort ability, the
firm's owners are concerned1with the expected sum of returns, the riskiness of returns,1and the in formativeness of
returns. The department controversy is brought to light as a result of this. Perrow (1986) critiqued the agency theory as
having focused on the representative problem side and suggested that the challenge may also emanate from the principal
side, who may exploit the agents.
2.3 Empirical Literature Review
Many empirical1studies support the theoretical literature and show that diversification raises growth and productivity.
Choi & Russel, 2004, on „why businesses diversify or fail to diversify.' find that the profitability growth rate was higher in
diversified companies in their study „Economic gains1around Mergers and1acquisitions in the building industry of the
United1States of1America.' Alternatively, Ofori & Chan (2000) realized that companies perform well by staying attentive
despite uncertainties and dangers brought about by inherent variations. According to Huang & Chen (2008), who
conducted research on commercial banks in Taiwan from 1992 to 2004, banks with high interest income and low
noninterest income work more cost efficiently. Diversified businesses became less cost-effective. They also point out that
the share of non-interest revenue in Taiwan's operational incomes is increasing. There are numerous associations that
were studied on with variation. One of the studies exposed is the link between informativeness and diversification.
Diversified companies have risen in value in relation to single-segment businesses, and the value of diversification has
grown beyond the recession.
2.3.1 Horizontal Diversification and financial performance
An indicator of this form of horizontal diversification is improvement of functions within the same stage of
manufacturing. An example is Safaricom marketing and sale of its products online in addition to use of the existing retail
and distribution network. In his research on the effect of diversification on financial efficiency, Maina (2016) discovered
that the Assets Return of highly diversified firms is lower than that of less or moderately diversified companies. In his
research on diversification strategies of firms, established that undiversified firms are associated with underperformance,
while moderate diversification is associated with over performance. Horizontal1and vertical1diversifications1were not
found to be strongly associated with financial efficiency, according to the findings. Horizontal diversification has no
major impact on the financial results of combined institutions, according to the findings of the report. In order to fill the
expertise vacuum, the conclusions of the report call for a re-evaluation of the literature on diversification.
2.3.2 Internal Diversification and financial performance
Kim, Hwang, & Burgers(1993) investigated the diversification and success of Nigerian manufacturing companies. The
aim of the analysis was to determine the importance of product diversification strategy as strategy catalyst. The findings
suggest that as manufacturing companies grow in scale, they diversify their product lines. Irrespective of its supposed
gains, the challenges of diversification appear most in companies operating within developing economies. In their study
of organizational diversification, Sahni and Juhari (2019) looked at general market conditions, industry environments, and
firm characteristics. Internal capacity expansion appears to be the most used expansion technique, according to the results
of this report. Skilled and experienced skilled personnel, professionally skilled operatives, access to and maintenance of
highly skilled subcontractors, as well as expert labor considerations, was all treated in the majority of the businesses
analyzed. Furthermore, the competency of their professional personnel was described as a strength by almost all of the
surveyed companies. Surprisingly, these companies' key shortcomings were listed as marketing and information
technology. In the present, a hopeful note can be seen in the fact that these companies have improved their capital
management, among other items. However, the greatest challenge revealed by the major obstacles was that there were so
many operations external to the core business.
2.3.3 Concentric Diversification and Financial Performance
Rotich, Okaka and Away (2011) on their study on commercial banks of Kenya discovered a linear association between
financial performance and diversification. In their study of 44 Kenyan banks from 2005-2009 settles that a better

International Journal of Management and Commerce Innovations ISSN 2348-7585 (Online) Vol. 9, Issue 1, pp: (466-485), Month: April 2021 - September 2021, Available at: www.researchpublish.com
Page | 472 Research Publish Journals
performance was led by financial diversification. Bigger banks got a greater capability to enlarge. Marangu, Oyagi and
Gongera (2014) in her study on investigation of concentric strategy of diversification on competitiveness of the firm,
found a comprehensive optimistic linear association between firm competitiveness and concentric diversification.
Diversification needs strong consideration whenever a firm wants to engage in closely related businesses as it opens
avenues for cost reduction. According to Ghoroghchi (2015), concentric diversification can be both beneficial and
detrimental for a firm depending on how it is executed. He concludes that a firm may pursue concentric diversification
that would in turn cannibalize its existing products thus killing the alternative line of business.
2.3.4 Conglomerate Diversification and financial performance
Delios, Andrew, Xu, Dean, Beamish and Paul. (2008) tested around 800 Chinese companies. The findings concluded that
focused companies outdid conglomerates in every ownership identity category. In a similar research by Gonenc and
Aybar (2006) insufficient evidence was established on the optimistic association between performance and group
diversification in Turkish industries thereby implying that the presentation of strategies of diversification depends on
performance of the target industry. According to Kotler and Armstrong (2010) profitability improvement is not
guaranteed by diversification However, it is an important part of maximizing long-term success while minimizing risk.
Maina (2016) investigated commodity diversification techniques examined as a determinant of real estate companies'
perceived financial performance. According to the results, any concentric1and1conglomerate diversifications1were found
to be closely correlated with financial production. The investigation discovered that the company lacked effective risk
management procedures. As a result, the study suggests that real estate firms develop policies such as per unit cost
distribution guidance for diversified products and risk control plans to help with improved risk management in the
diversification process.
2.4 Conceptual Framework
Conceptual frameworks are applied in study to outline the likely course of action or explain further the idea (Mugenda
&1Mugenda, 2003). The conceptual framework below presents the impact of diversification1strategies on monetary
performance at the sector of telecommunication. An overall illustrational plan is exposed below demonstrating that
financial performance variable is dependent and the1independent variables are the diversification strategies while the
policy of the government has a moderating effect on the diversification strategies and financial performance.
Independent Variables Dependent Variable
Diversification Strategies
Figure 2.1: Conceptual Framework
Source: Researcher, 2019
Horizontal Diversification
-Customer Segmentation
-New Trade Channels
-New Divisions/Departments
Internal Diversification
-Product ranging
-New Markets conquered
-New Services
Concentric Diversification
- Cash flows
- New product Introduced
- Innovations done
-
Conglomerate Diversification
- Portfolio
- Acquisitions
- Partnerships
Financial Performance
Return on
Investment
Return on Assets
Market share
Operating Cash
flow

International Journal of Management and Commerce Innovations ISSN 2348-7585 (Online) Vol. 9, Issue 1, pp: (466-485), Month: April 2021 - September 2021, Available at: www.researchpublish.com
Page | 473 Research Publish Journals
3. RESEARCH METHODOLOGY
3.1 Introduction
This segment offers the methodology1employed in presenting and analyzing information collected from the research. It
consists of; research design, target population, sampling and sample1size, data gathering measures and techniques of data
analysis.
3.2 Research Design
The research assumed a descriptive1research design to reach the objectives of the study. This is due its flexibility and
adaptability to possible field challenges during data collection and interpretation (Kombo & Tromp, 2006). According to
Kothari (2014) descriptive studies are faulted due to their observable nature, most are not repeatable. In most cases,
descriptive studies have some level of bias since they lack statistical tests and therefore cannot verify research problem
statistically. Further, they are not able to identify the cause behind described phenomenon. However, despite the
shortcomings, Descriptive survey study designs, are used in preliminary and exploratory study to enable1researchers to
collect data, compile it, present it, and interpret it for the purpose of clarity. Mugenda and Mugenda (2008) highlighted
that, descriptive research reports the facts on the ground to help in describing the current status of a phenomenon being
investigated. In that regard, Mugenda and Mugenda (2008) notes that this design is helpful in the description, explanation
and exploration of the current status between a set of variables.
3.3 Target Population
Frederic (2010) defines target population as “a universal collection of all representatives of an actual or hypothetical set of
persons, activities, or objects to which an investigator wants to generalize1the result.” Because of the limited number of
the population targeted in the research, the study used a census survey of all the six divisions of the company.
Senior1managers and managers concerned1with making outsourcing decisions were sampled for purposes of collecting
primary data. These were represented by 490 employees
3.4 Sampling design
Conferring to Denning (2001) sampling course is where a sample is analyzed so as to establish something on the whole
population. Proportionate stratified sampling was employed to choose respondents out of a target population. The
respondents were stratified into six divisions namely; customer operations, finance, strategy and innovation, information
technology, human resources and corporate affairs. The samples are proportionate to the size of population being studied.
The sampling defines “a list of all1population units from1which the sample was selected” (Cooper & Schindler, 2008).
According to Kothari (2004) 30% of population is a good enough sample.
Table 3.1: Sample Size
Function Target Population Rate Sample size
Customer Operations 204 0.3 61
Finance 50 0.3 15
Strategy & Innovation 36 0.3 11
Information Technology 38 0.3 11
Human Resources 72 0.3 22
Corporate Affairs 90 0.3 27
Total 490 0.3 147
Source: Safaricom Human Resource Record, 2019
3.5 Data Collection Instrument
Both secondary and primary statistics was involved. Primary information was gathered using questionnaires. Structured
queries were used so as to save money and time while unstructured questions were applied to encourage more elaborate
responses. Secondary statistics was gathered Safaricom‟s financial statements to measure the indicators of performance
like market share, financial liquidity, return on equity and return on investment. The study collected data over a period of
five (5) years.
3.6 Validity and Reliability
Validity and reliability of results of data analysed by the researcher must be guaranteed for the results to be reusable.

International Journal of Management and Commerce Innovations ISSN 2348-7585 (Online) Vol. 9, Issue 1, pp: (466-485), Month: April 2021 - September 2021, Available at: www.researchpublish.com
Page | 474 Research Publish Journals
3.6.1 Validity
Validity denotes the extent to which the results gotten from data analysis represent spectacle under study (Kothari, 2004).
This study used sectioned and well-structured questionnaires using both open-ended and closed queries to accommodate a
variety of answers. This helped the researcher in achieving content validity and promotes collection of both quantitative
and qualitative information.
3.6.2 Reliability
Reliability is the degree of study tools to produce reliable result or statistics after repetitive trials (Mugenda & Mugenda,
2008) thus minimizing error or bias (Kothari, 2004). To achieve this, the questionnaire was designed systematically.
Comprehensive queries were employed to enable respondents to respond without much reference. In order to ensure
dependability, questionnaire was subjected to a pre-test in a pilot study where a few questionnaires were administered by
hand delivery to the respondents. Reliability of the results was measured using the Cronbach‟s alpha.
3.7 Data collection procedure
Because of the working hours of the employees, the questionnaires were distributed to the various interviewees and
collected later. In case of no response, respondents were contacted via phone calls and the anonymity of respondents
guaranteed with accompanying assurance letters attached to all provided questionnaires. A data sheet was used to collect
secondary data on financial performance from published information on Safaricom Public limited company financial
performance.
3.8 Data Analysis and presentation
Descriptive statistics was employed to scrutinize data with the feedback from questionnaires being recorded, coded,
exported and analyzed using SPSS. The statistical tool SPSS (Statistical Package for Social Science) was employed to
scrutinize and present the specific issues through coding and generalizing all responses. Descriptive statistics were
calculated, and data relationships analyzed according to the study objectives. This was facilitated by correlation analysis.
Results were presented using standard deviation, means, percentages, frequencies and tables.
The regression equation is:
Y=ao+ a1X1+a2X2+a3X3 +a4X4 + €
Where:
Y= Financial Performance
ao = Constant
X1 = Concentric Diversification
X2 = Conglomerate Diversification
X3= Internal Diversification
X4 = Horizontal Diversification
€ = Error term
3.9 Ethical Considerations
The researcher made sure collected data is handled confidentially. The respondents may or may not choose to identify
themselves and prior to collecting information, the researcher explained his intentions. Participation was therefore being
through voluntary and informed consent.
4. DATA ANALYSIS, RESULTS AND INTERPRETATION
The section gives the analysis of the results and interpretation. The section is offered in accordance to the study
objectives. In the data analysis, descriptive analysis and inferential analysis were employed.
4.1 Response Rate
The research pursued to evaluate the respondent‟s response rate, out of the 147 questionnaires issued, 135 were completed
and collected and gave a response rate of 91.8 % which was adequate for the analysis of data as Mugenda and Mugenda
(2008) acknowledges any rate of response that is higher than 70% is excellent.

International Journal of Management and Commerce Innovations ISSN 2348-7585 (Online) Vol. 9, Issue 1, pp: (466-485), Month: April 2021 - September 2021, Available at: www.researchpublish.com
Page | 475 Research Publish Journals
4.2 Reliability Results
The research wanted to measure the dependability of the results which was tried using the Cronbach‟s alpha. A pilot
research was carried out to ascertain the research instruments reliability and validity showed that conglomerate
diversification strategy had the maximum reliability of 0.806, trailed by internal diversification with a reliability of
0.7361, concentric diversification had a reliability of 0.742 and horizontal diversification with a reliability of 0.724. From
the findings, the Cronbach‟s alpha of all the variables was above the 0.7, average of 0.758, threshold thus implying that
the tool was valid and reliable.
4.3 Validity Results
Gill and Johnson (2008) point out that validity is how much the sample is a representation of the phenomenon it is desired
to represent. Content soundness was used to test the questionnaire‟s validity so as to correct any inconsistencies that might
have arisen in the actual study. There were few inconsistencies obtained after the pilot study was done and where they
arose, they were corrected by checking the content of the results which improved the questionnaire validity.
Outcomes given on customer segmentation shows that most of the propositions (72.6%) targeted different classes of
customers while only few (27.4%) which targeted all customers generally. This implies most of the firm had developed
different products to suit different classes of customers. The researcher also wanted to find whether the company had
ventured or expanded its trade channels in the past one year.
4.4 Diversification Strategies and Financial Performance
The subsequent section presents statistical finding on diversification strategies assumed by mobile telecom firms and its
impact on the financial performance.
4.4.1 Conglomerate Diversification
The research wanted the participants to show the degree to which conglomerate Diversification strategy affected the
financial performance
Table 3.2: Effect of conglomerate diversification strategy on performance
Statement N Min Max Mean Std. Dev
The company‟s goods and services that
environmental uncertainty have threatened or in
waning stage of life have managed to reduce their
risk through diversifying to different sectors from
the current main sector.
135 3.00 5.00 4.22 0.53
By expanding our activities and product line to
diverse areas where the doubt is decreased and,
success is higher, the firm has confirmed its
survival making its flow of cash more
dependable.
135 4.00 5.00 4.19 0.40
The unrelated strategic business units being
considered as a profit center help the top
managers to monitor each strategic unit more
efficient through information access and as a
consequence help in dropping the total costs.
135 3.00 5.00 4.10 0.52
Aggregated Mean 4.17 0.48
Source: Research data, (2020)
Assessment on the association between conglomerate diversification strategy and company‟s performance revealed that
change in unit conglomerate strategy of diversification other factors held constant would cause positive change in
financial performance by a 0.795 factor, descriptive findings also disclose that through conglomerate diversification
firm‟s services and products being susceptible to the uncertainty of the environment. It is agreeable that expansion of
activities and product lines to diverse areas has led to firm‟s survival making cash flow more dependable (mean of 4.19).
The expansion to diverse areas caused little variation in cash flow (standard deviation of 0.40). The profitable unrelated
strategic business units make managers to monitor efficiently because of accessibility to information and the consequence

International Journal of Management and Commerce Innovations ISSN 2348-7585 (Online) Vol. 9, Issue 1, pp: (466-485), Month: April 2021 - September 2021, Available at: www.researchpublish.com
Page | 476 Research Publish Journals
is a drop in total cost (mean of 4.10) which is agreed by management. However, the drop in total cost didn‟t vary
significantly (standard deviation of 0.52). The aggregated mean for statements assessing on the effect of conglomerate
diversification strategy on financial performance recorded a mean of 4.17 and a standard deviation of 0.48. The aggregate
mean value of 4.17 indicates that conglomerate diversification strategy affects financial performance. Further to a low
mean of std deviation (0.48) confirms the harmony with participants views. These results are in line with others by Kotler
and Armstrong (2010) who indicated that conglomerate diversification is a significant aspect of achieving long-term
performance while reducing risk. The study results also in line with others by Maina (2016) that indicated that
conglomerate diversifications are significantly correlated with financial performance.
4.4.2 Internal Diversification
The research required the participants to show the level to which internal diversification strategy impacted the
performance of the firm.
Table 3.3: Effect of internal diversification strategy on performance
N Min Max Mean
Std.
Dev
Executives requiring monetary resource by the firm or any calculated unit of
business is able to transmit it by choosing from any strategic units of business
whose data is made available without any cost of transaction.
135 4.00 5.00 4.33 0.47
Some actions such as public relations, the company's case security, investment
decisions, legal services, internal audit could be done at firm‟s level centrally for
all planned units of business despite being spread and such moves becomes a cost
savings measures.
135 2.00 33.00 4.03 2.60
Since managers got hard to attain skills, endorses the impression that companies‟
executives engaged in dissimilar diversification would be effective in brand
investments.
135 2.00 5.00 4.17 0.43
The firm spreads due to effect of co-insurance with a positive effect on the debt of
the firm due to reduced volatility of the profits and revenues of the firm. 135 3.00 5.00 3.81 0.62
Diversification helps the managers on how to make monetary values in diverse
produce markets and lines due to their sufficient environmental information. 135 4.00 5.00 4.24 0.43
Aggregated Mean 4.12 0.91
Source: Research data, (2020)
From the research findings, most respondents approved that executives requiring monetary resource by the firm or any
calculated unit of business is able to transmit it by choosing from any strategic units of business whose data is made
available without any cost of transaction. It is agreeable that expansion of the product ranging capacity and growth into
new services has led to growth of the firm (Mean of 4.33). At the same time this has caused little variation in increase of
new markets conquered (Standard Deviation of 0.47). These conclusions agree with those of Kim (1993) when firms
embrace internal diversification strategy, it is more likely to secure better distribution channels, accelerate contact to new
market areas or product, gain immediate market segment / increased marketplace power and ultimately gain savings of
scale. The aggregated mean for statements on the effect of internal diversification strategy on financial performance was
4.12 and standard deviation of 0.91. The aggregate mean value of 4.19 translates to „agree‟ which implies that internal
diversification strategy greatly affects financial performance. The product and services expansion causes little variation in
the new market conquered (std deviation 0.91). These are in line with Luo (2009) who associates internal diversification
strategy with lessened competition acquiring of immaterial assets and ability to overcome blockades making it easy to
enter into new markets. The findings have however found gap – the number of new products/services introduced by the
firm is not proportionate to the number of new markets conquered as result.
4.4.3 Concentric Diversification
The research required the participants to show the level to which concentric diversification strategy impacted the
performance of the firm.
International Journal of Management and Commerce Innovations ISSN 2348-7585 (Online) Vol. 9, Issue 1, pp: (466-485), Month: April 2021 - September 2021, Available at: www.researchpublish.com
Page | 477 Research Publish Journals
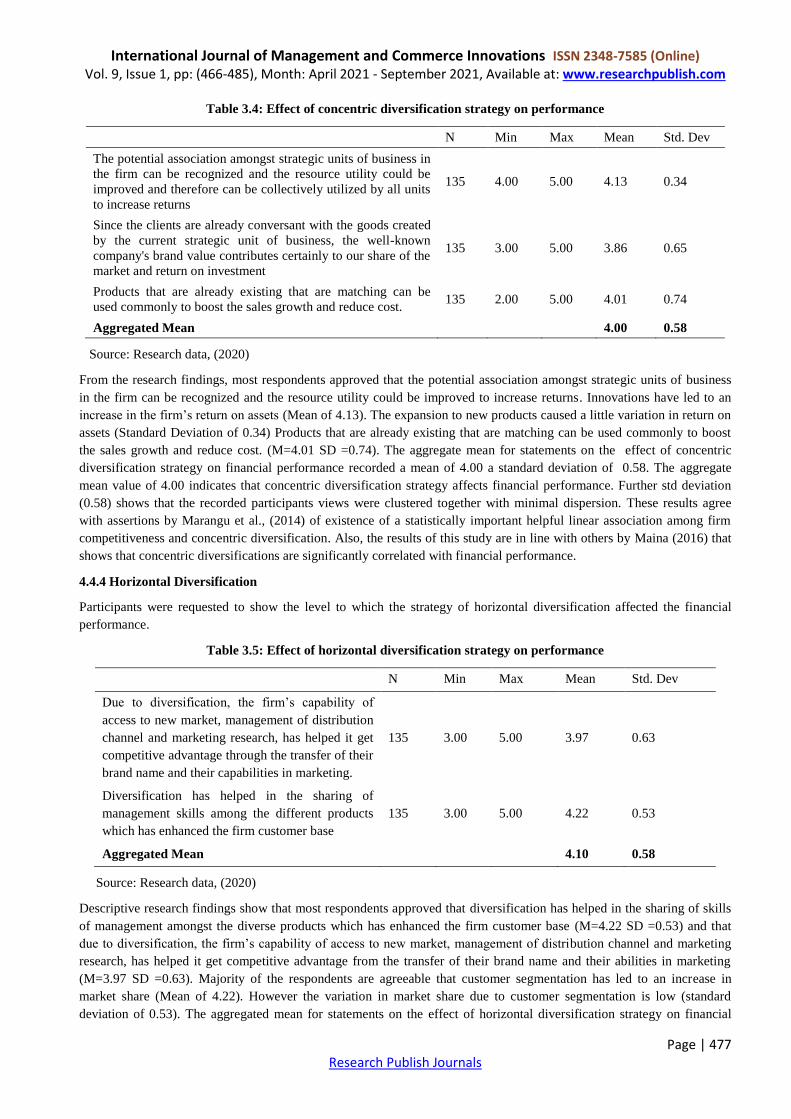
Table 3.4: Effect of concentric diversification strategy on performance
N Min Max Mean Std. Dev
The potential association amongst strategic units of business in
the firm can be recognized and the resource utility could be
improved and therefore can be collectively utilized by all units
to increase returns
135 4.00 5.00 4.13 0.34
Since the clients are already conversant with the goods created
by the current strategic unit of business, the well-known
company's brand value contributes certainly to our share of the
market and return on investment
135 3.00 5.00 3.86 0.65
Products that are already existing that are matching can be
used commonly to boost the sales growth and reduce cost. 135 2.00 5.00 4.01 0.74
Aggregated Mean 4.00 0.58
Source: Research data, (2020)
From the research findings, most respondents approved that the potential association amongst strategic units of business
in the firm can be recognized and the resource utility could be improved to increase returns. Innovations have led to an
increase in the firm‟s return on assets (Mean of 4.13). The expansion to new products caused a little variation in return on
assets (Standard Deviation of 0.34) Products that are already existing that are matching can be used commonly to boost
the sales growth and reduce cost. (M=4.01 SD =0.74). The aggregate mean for statements on the effect of concentric
diversification strategy on financial performance recorded a mean of 4.00 a standard deviation of 0.58. The aggregate
mean value of 4.00 indicates that concentric diversification strategy affects financial performance. Further std deviation
(0.58) shows that the recorded participants views were clustered together with minimal dispersion. These results agree
with assertions by Marangu et al., (2014) of existence of a statistically important helpful linear association among firm
competitiveness and concentric diversification. Also, the results of this study are in line with others by Maina (2016) that
shows that concentric diversifications are significantly correlated with financial performance.
4.4.4 Horizontal Diversification
Participants were requested to show the level to which the strategy of horizontal diversification affected the financial
performance.
Table 3.5: Effect of horizontal diversification strategy on performance
N Min Max Mean Std. Dev
Due to diversification, the firm‟s capability of
access to new market, management of distribution
channel and marketing research, has helped it get
competitive advantage through the transfer of their
brand name and their capabilities in marketing.
135 3.00 5.00 3.97 0.63
Diversification has helped in the sharing of
management skills among the different products
which has enhanced the firm customer base
135 3.00 5.00 4.22 0.53
Aggregated Mean 4.10 0.58
Source: Research data, (2020)
Descriptive research findings show that most respondents approved that diversification has helped in the sharing of skills
of management amongst the diverse products which has enhanced the firm customer base (M=4.22 SD =0.53) and that
due to diversification, the firm‟s capability of access to new market, management of distribution channel and marketing
research, has helped it get competitive advantage from the transfer of their brand name and their abilities in marketing
(M=3.97 SD =0.63). Majority of the respondents are agreeable that customer segmentation has led to an increase in
market share (Mean of 4.22). However the variation in market share due to customer segmentation is low (standard
deviation of 0.53). The aggregated mean for statements on the effect of horizontal diversification strategy on financial

International Journal of Management and Commerce Innovations ISSN 2348-7585 (Online) Vol. 9, Issue 1, pp: (466-485), Month: April 2021 - September 2021, Available at: www.researchpublish.com
Page | 478 Research Publish Journals
performance was 4.10 with standard deviation of 0.58. The aggregate mean value of 4.10 indicates that horizontal
diversification strategy affects financial performance. Further the standard deviation (0.58) confirms the views from the
respondents had minimal dispersion. These results contradict the results by Lins and Servaes (2002) that firms that are
diversified are not as much of profitable as their single sector counterparts. The findings of this study showed that
horizontal diversification strategies enable businesses to take advantage of internal economies of scale, such as bulk-
buying, technological economies, and financial economies, resulting in cost savings from market rationalization. These
findings support the study findings by Hermalin and Kutz (2004) that there exists a helpful correlation between in
formativeness and diversification hence reduction of risk. From the results presented above, conglomerate diversification
had aggregated mean score of 4.17, internal diversification had aggregated mean score of 4.12, concentric diversification
had aggregated mean score of 4.00 and horizontal diversification had aggregated mean score of 4.10. Based on the
aggregated means for each variable, conglomerate diversification was the most significant diversification strategy by
Safaricom Public limited company.
4.5 Performance
To measure the performance of Safaricom Public limited company, this study used return on investment, return on assets,
market share and cash flow. The associated data is presented in the subsequent subsections.
4.5.1 Return on Investment (ROI)
Return on investment is calculated by dividing net profit by total investment. The value of ROI was presented as a
percentage.
Return on investment for the FY 2015 to FY2019 for Safaricom Plc. is presented on Table 3.6.
Table 3.6: Return on Investment for FY 2015 - FY 2019
2015 2016 2017 2018 2019
Net Profit (Kshs.) (000) 31,871 38,104 48,444 53,814 61,966
Total Investment (Kshs.) (000) 104,277 116,739 108,113 123,064 144,842
ROI (%) 30.6 32.6 44.8 43.7 42.8
According to the Table 3.6, ROI for FY 2015 was 30.6% which then increased to 32.6% in FY 2016 and reached its
summit for the period in FY2017 at 44.8%. ROI for FY 2018 was 43.7% and 42.8% in FY 2019. According to the data,
Safaricom Plc has a good financial performance as indicated by the ROI for the 5 years period. A graphical representation
is presented on the Figure 4.1.
Figure 4.1: Return on Investment for FY 2015 - FY 2019
4.5.2 Return on Assets (ROA)
Return on assets is calculated by dividing net profit by total assets. The value of ROA was presented as a percentage.
30.6% 32.6%
44.8% 43.7% 42.8%
0
10
20
30
40
50
2015 2016 2017 2018 2019
RO
I (%
)
Financial Years

International Journal of Management and Commerce Innovations ISSN 2348-7585 (Online) Vol. 9, Issue 1, pp: (466-485), Month: April 2021 - September 2021, Available at: www.researchpublish.com
Page | 479 Research Publish Journals
Return on assets for the FY 2015 to FY 2019 for Safaricom Plc is presented on Table 3.7.
Table 3.7: Return on Assets for FY 2015 - FY 2019
2015 2016 2017 2018 2019
Net Profit (Kshs.) (000) 31,871 38,104 48,444 53,814 61,966
Total Assets (Kshs.) (000) 156,957 159,182 162,345 166,233 191,171
ROA(%) 20.3 23.9 29.8 32.4 32.4
From the Table 3.7, ROA for FY 2015 was 20.3% which then increased to 23.9% in FY 2016 and then rose to 29.8 in
FY2017. ROA for FY 2018 and FY 2019 was 32.4%. According to the data, Safaricom Plc ROA has been on the rise for
the 5 year period indicating a good financial performance for the 5 years period. A graphical representation is presented
on the Figure 4.2.
Figure 4.2: Return on Assets for FY 2015 - FY 2019
4.5.3 Market share
As a measure of performance at the Safaricom Plc, market share for the company was calculated to indicate the firms
place in the market. The market share is gives as a percentage of the firm‟s sales to the total industrial revenue. Table 3.8
below presents the data finding.
Table 3.8: Market share for FY 2015 to FY 2019
2015 2016 2017 2018 2019
Market share (%) 65.6 71.9 67.0 62.4 64.8
The results presented on the Table 3.8 indicate that the market share rose from FY 2015 at 65.6% to 71.9% in FY 2016
witnessing a 3.9% drop to 67.0% in FY 2017. In FY 2018, the Safaricom Plc.‟s market share stood at 62.4% and then rose
to 64.8% in FY 2019. From the findings, Safaricom Plc. commands a market share of more than 50% in an environment
with multiple players. This therefore indicates that the company is a market leader in telecommunication industry. The
graphical representation of the data is shown of Figure 4.3.
Figure 4.3: Market share for FY 2015 to FY 2019
4.5.4 Operating Cash Flow
The fourth measure of performance that this study employed was operating cash flow. This was computed by adding
depreciation and change in working capital to operating income and then subtracting taxes. Table 3.9 presents the data
findings.
20.3% 23.9% 29.8% 32.4% 32.4%
0.0
20.0
40.0
2015 2016 2017 2018 2019
RO
A(%
)
Financial Years
International Journal of Management and Commerce Innovations ISSN 2348-7585 (Online) Vol. 9, Issue 1, pp: (466-485), Month: April 2021 - September 2021, Available at: www.researchpublish.com
Page | 480 Research Publish Journals
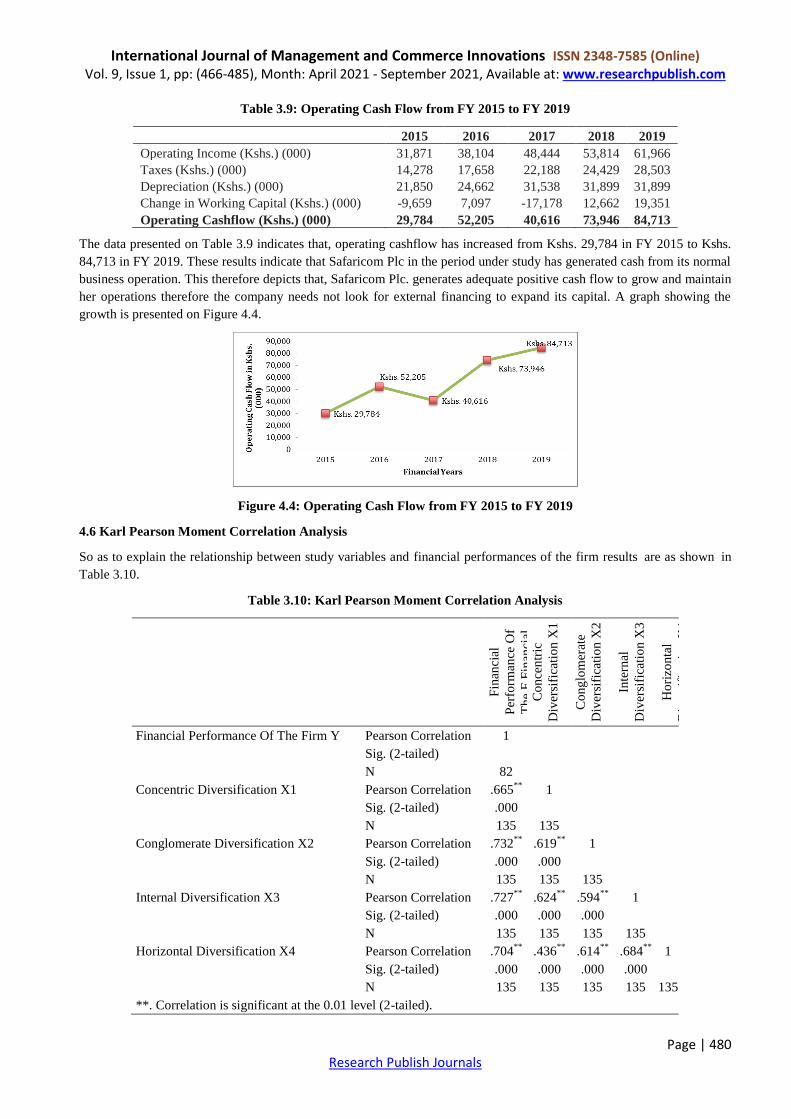
Table 3.9: Operating Cash Flow from FY 2015 to FY 2019
2015 2016 2017 2018 2019
Operating Income (Kshs.) (000) 31,871 38,104 48,444 53,814 61,966
Taxes (Kshs.) (000) 14,278 17,658 22,188 24,429 28,503
Depreciation (Kshs.) (000) 21,850 24,662 31,538 31,899 31,899
Change in Working Capital (Kshs.) (000) -9,659 7,097 -17,178 12,662 19,351
Operating Cashflow (Kshs.) (000) 29,784 52,205 40,616 73,946 84,713
The data presented on Table 3.9 indicates that, operating cashflow has increased from Kshs. 29,784 in FY 2015 to Kshs.
84,713 in FY 2019. These results indicate that Safaricom Plc in the period under study has generated cash from its normal
business operation. This therefore depicts that, Safaricom Plc. generates adequate positive cash flow to grow and maintain
her operations therefore the company needs not look for external financing to expand its capital. A graph showing the
growth is presented on Figure 4.4.
Figure 4.4: Operating Cash Flow from FY 2015 to FY 2019
4.6 Karl Pearson Moment Correlation Analysis
So as to explain the relationship between study variables and financial performances of the firm results1are as shown1in
Table 3.10.
Table 3.10: Karl Pearson Moment Correlation Analysis
Fin
anci
al
Per
form
ance
Of
Th
e F
Fin
anci
al
Per
form
ance
Of
Th
e F
irm
Y i
rm.
Y
Co
nce
ntr
ic
Div
ersi
fica
tio
n X
1
Co
ng
lom
erat
e
Div
ersi
fica
tio
n X
2
Inte
rnal
Div
ersi
fica
tio
n X
3
Ho
rizo
nta
l
Div
ersi
fica
tio
n X
4
Financial Performance Of The Firm Y Pearson Correlation 1
Sig. (2-tailed)
N 82
Concentric Diversification X1 Pearson Correlation .665**
1
Sig. (2-tailed) .000
N 135 135
Conglomerate Diversification X2 Pearson Correlation .732**
.619**
1
Sig. (2-tailed) .000 .000
N 135 135 135
Internal Diversification X3 Pearson Correlation .727**
.624**
.594**
1
Sig. (2-tailed) .000 .000 .000
N 135 135 135 135
Horizontal Diversification X4 Pearson Correlation .704**
.436**
.614**
.684**
1
Sig. (2-tailed) .000 .000 .000 .000
N 135 135 135 135 135
**. Correlation is significant at the 0.01 level (2-tailed).

International Journal of Management and Commerce Innovations ISSN 2348-7585 (Online) Vol. 9, Issue 1, pp: (466-485), Month: April 2021 - September 2021, Available at: www.researchpublish.com
Page | 481 Research Publish Journals
There was a strong association between concentric diversification and the firm's financial results, as seen in Table 3.10. A
correlation ratio of 0.665 reveals this. Since the p value was 0.00, which was less than 0.05, this fair relationship was
considered to be statistically significant. These results support the contention by Marangu et al., (2014) of existence of a
statistically important helpful linear association among firm competitiveness and concentric diversification.
The study also found a strong positive correlation between financial performance of the firm and conglomerate
diversification as shown by1correlation coefficient1of 0.732; the significant1value was 0.00 which was less1than 0.05.
These results support the research findings that conform with Bain (1956) that conglomerate diversification is directly
related to firm financial performance which is observed through increased profitability.
The study1found a positive1correlation between financial performance of the firm and internal diversification as shown
by correlation1coefficient of 0.727, the significant1value was 0.000 which is less than 0.05. These findings support the
conclusion by Kim (1993) when firms embrace internal diversification strategy, it is more likely to secure better
distribution channels, accelerate contact to new market areas or product gain immediate market segment / increased
marketplace power and ultimately gain saving of scale
The study also found a strong positive correlation between financial performances of the firm and horizontal
diversification as shown by1correlation coefficient1of 0.704; the significant1value was 0.00 which was less1than 0.05.
These results support the research findings by Argyres and McGaha (2002) who established that horizontal diversification
and lesser cost were related to profitability directly.
4.7 Regression Analysis
A multiple regression analysis was used in the study to determine the effect of predictor variables. For coding, entry and
calculation of the multiple regressions dimensions, this analysis used the statistical kit for social sciences (SPSS V 23.0).
Table 3.11: Summary of One-Way ANOVA results
Model Sum of Squares df Mean Square F Sig.
1 Regression 38.759 4 9.690 47.845 .000b
Residual 26.328 130 .203
Total 65.087 134
Source: Research data, (2020)
From the ANOVAs results the probability value of 0.000 was obtained which show that the model of regression was
significant in forecasting the association between firm's financial performance and the predictor variables as it was less
than α=0.05. Additionally, the research employed the coefficient table to choose the model of the study. The results are
given in Table 3.12.
Table 3.12: Coefficientsa
Model
Unstandardized Coefficients Standardized Coefficients
t Sig. B Std. Error Beta
1 (Constant) -1.549 .361 4.291 .000
Concentric Diversification .392 .098 .237 3.987 .000
Conglomerate Diversification .795 .112 .439 7.102 .000
Internal Diversification .501 .111 .291 4.530 .000
Horizontal Diversification .283 .101 .163 2.783 .006
Source: Research data, (2020)
As per the SPSS generated output as presented in table above, the equation (Y = β0 + β1X1 + β2X2 + β3X3 + β4X4+ ε)
becomes:
Y= - 1.549+ 0.392X1+ 0.795X2 + .501X3+ 0.283X4
From the above regression model, all other factors held constant, the firm's monetary performance would be 1.549. A unit
change in concentric diversification strategy other factors held constant could lead to positive variation in financial
performance of the firm by 0.392; a unit change in conglomerate diversification other factors held constant could change

International Journal of Management and Commerce Innovations ISSN 2348-7585 (Online) Vol. 9, Issue 1, pp: (466-485), Month: April 2021 - September 2021, Available at: www.researchpublish.com
Page | 482 Research Publish Journals
the by 0.795 factor, a unit change in internal diversification strategy other factors held constant would change the financial
performance of the firm by a 0.501 factor while a unit change in horizontal diversification other factors held constant
could change the financial performance of the firm by 0.283. This implied that concentric diversification, conglomerate
diversification, internal diversification and horizontal diversification promoted financial performance of the firm. The
findings conform to Bain (1956) that conglomerate diversification is directly related to firm financial performance which
is observed through increased profitability. The findings concur with Argyres and McGaha (2002) who established that
horizontal diversification and lesser cost were related to profitability directly. The investigation was performed at 5%
level of significance. The obtained likelihood value was compared to 0.05 as a criterion for determining if the forecaster
variables were significant in the model. The predictor variable was meaningful if the likelihood value was less than α;
otherwise, it was not. Since their likelihood values were less than 0.05, all of the predictor variables were important in the
model.
5. SUMMARY
5.1 Summary
Assessment on association between diversification strategies and the Kenyan mobile telecommunication industry
financial performance showed that most of the mobile telecommunication firms in Kenya developed a new product or
service in the last one year, most of the organizations got in a new business line in the last one year and that most of the
Kenyan mobile telecommunication firms did tremendous improvement on market operation lines as well as acquisition
and penetration of new markets.
5.1.1 Horizontal Diversification and Financial Performance
The study found a strong positive correlation between financial performances of the firm and horizontal diversification as
shown by1correlation coefficient of 0.704; the significant1value was 0.00 which was less1than 0.05. Outcomes of this
research exposed that horizontal diversification strategies enable many firms to exploit internal economies of scale
including bulk-buying, technical economies, financial economies; this led to saving cost from business rationalization.
Statistical findings also revealed that diversification has helped the firm‟s capability of promotion research, management
of distribution channel, and access to new market has given it viable advantage by transfer of their name and their
capabilities in marketing. This creates opportunities for a larger company to profit from scope economies, other
advantages noted include reduced rivalry by eliminating key competitors, increased market segment and long-run power
of pricing and that firms used horizontal diversification to raise penetration barriers into a market for future competitors,
resulting in higher monopoly earnings. These findings support the study findings by Hermalin and Kutz (2004) that there
is an optimistic relation amongst diversification and informativeness hence risk reduction. Horizontal diversification
therefore positively influenced financial performance of the firm.
5.1.2 Internal Diversification and Financial Performance
The study1found a positive1correlation between financial performance of the firm and internal diversification. Kim
(1993), when firms embrace internal diversification strategy, it is more likely to secure better distribution channels,
accelerate contact to new market areas or product gain immediate market segment / increased marketplace power and
ultimately gain saving of scale. The study established some activities like public relations, firm‟s case security, investment
decisions, internal audit and legal services could be centrally performed at firm level for every strategic business elements
despite being diversified and such measures act as a cost savings move and that the firm spreads due to effect of co-
insurance with an optimistic effect on the debt of the firm due to reduced volatility of the profits and revenues of the
company. These results agree with Luo, (2009) who associates internal diversification strategy with reduced competition,
acquiring of immaterial assets and ability to overcome blockades making it easy to enter into marked new markets. These
findings agree with findings by Kim (1993) when firms embrace internal diversification strategy, it is more likely to
secure better distribution channels, accelerate contact to new market areas or product gain immediate market segment /
increased marketplace power and ultimately gain saving of scale. Therefore the findings revealed that internal
diversification strategies had a significant direct effect on financial performance.
5.1.3 Concentric Diversification and Financial Performance
The study‟s third objective was to determine the effect of concentric diversification on financial performance. The study
found positive association between company‟s financial performance and concentric diversification; test regression results
show that unit change in concentric diversification strategy other factors held constant, could lead to positive variation in

International Journal of Management and Commerce Innovations ISSN 2348-7585 (Online) Vol. 9, Issue 1, pp: (466-485), Month: April 2021 - September 2021, Available at: www.researchpublish.com
Page | 483 Research Publish Journals
financial performance of the firm by 0.392. The findings revealed that potential association amongst strategic units of
business in the firm can be recognized and the resource utility could be improved and therefore can be collectively
utilized by all units to increase returns. Products that are already existing that are matching can be used commonly to
boost the sales growth and reduce cost. From the results of this study, concentric diversification strategies had a
significant effect on financial performance of the firm.
5.1.4 Conglomerate Diversification and Financial Performance
The study‟s fourth objective was to establish the influence of conglomerate strategies on financial performance.
Inferential statistics revealed a positive correlation between concentric diversification and financial performance of the
firm (Correlation factor = 0.665 significant value was 0.00) test regression results also show that a unit change in
conglomerate diversification other factors held constant could change by the 0.795 factor. The research found a positive
association between conglomerate strategy of diversification and financial performance of telecommunication companies.
Results of this research show that unrelated strategic business units being considered as a profit center help the top
managers to screen every strategic unit extra effectively by access of data and help in overall costs reduction. These
findings go hand in hand with Marangu (2014) established that conglomerate diversification strategy on firm‟s
competitiveness, found a comprehensive positive linear association between financial performance and concentric
diversification.
5.2 Conclusions
The study concludes that various mobile telecommunication companies had embraced conglomerate diversification which
helped to create an entity balance during hard times; conglomerate diversification assists telecom firms to use the possibly
underutilized resources maximumly, conglomerate diversification allowed the company to contact a new customers pool,
thus expanding its client base and that conglomerate diversification enables companies to overcome risks associated with
the vulnerable market.
The study concludes that mobile telecommunication companies embraced internal diversification. Through this initiative
financial interaction could be attained by merging a company with huge monetary resources but restricted opportunities to
grow with a firm with big market possibilities but frail monetary capitals.
The study concludes that telecommunication companies embraced concentric diversification strategy through
modification of the existing distribution channels to sell new goods; telecommunication companies often changed goods
lines to take in new things that seems to possess great market potential and selling new and dissimilar goods to new
marketplaces.
The study concludes that most of the mobile telecom companies were aggressively undertaking horizontal diversification
strategies. Horizontal diversification strategies enable a large number of businesses to benefit from internal economies of
scale, such as bulk purchasing, technological economies, and financial economies; this led to saving costs from the
business rationalization and that horizontal diversification had the potential to secure revenue synergies.
5.3 Recommendations
Base on the study findings, this research makes this recommendation.
Given that diversification strategies were found to improve firm‟s financial performance, Mobile telecommunication
should adopt diversification strategies adoption like the new business entry cost, the future changes in technology and
consumer preferences changes.
Mobile telecommunication industry must consider other issues in these aspects would have an effect in the
telecommunication industry which is dynamic.
The research recommends that mobile telecommunication companies‟ managers must invest in viability studies meant to
analyse factors influencing strategies of diversification. This will help mangers to articulate appropriate actions which will
make sure that diversification plans objectives are implemented successfully.
The research also endorses that mobile telecommunication firms must conduct steady evaluation and monitoring
envisioned to gauge the efficiency of the diversification strategies adopted. This is essential because Mobile
Telecommunication firms function in a business environment that is dynamic which is impacted by a variation of factors.
Mobile Telecommunication industry in Kenya needs to continually reinvigorate itself to remain relevant in the telecom
industry which over the years has proved to be dynamic, complex and turbulent.

International Journal of Management and Commerce Innovations ISSN 2348-7585 (Online) Vol. 9, Issue 1, pp: (466-485), Month: April 2021 - September 2021, Available at: www.researchpublish.com
Page | 484 Research Publish Journals
5.4 Suggestions for Further Studies
This research aims at establishing the association among financial performance and diversification strategies of the
Kenyan sector of mobile telecommunication. The study variable only accounted for 58.3% of the variations in firm's
financial performance; therefore other factors accounting for 41.7% need to be established and their effects assessed as
well. Further studies should be undertaken on measures that Telecommunication companies took to enhance
diversification effectiveness.
ACKNOWLEDGEMENT
I am deeply grateful to God Almighty for making things possible and giving me good health, sound mind and strength
throughout the period of study. First, I extend1my gratitude to my family, friends, supervisor and the1respondents that
contributed great input to make this study project successful. Special thanks and gratitude to Dr. Linda Kimencu, my
Supervisor, for her support, dedication, guidance and patience during the study. She is a great inspiration! I honestly feel
grateful to her. Furthermore, to my parents I am thankful, for predicting the imminent and forfeiting a lot to back me, the
equivalent spreads to my whole family, for consoling me up on every rough day of work.
REFERENCES
[1] Barney, J. (2002). Firm resources and sustained competitive advantage. Journal of management, 17(1), 99-120.
[2] Burns, P. (2013). Building Value through Acquisitions and Diversification, Corporate Entrepreneurship. London:
Macmillan International Higher Education.
[3] Bititci U.S., Carrie A.S. and McDevitt L. (2017) Performance Measurement: A Business Process View, IFIP WG 5.7
Workshop on Modelling Techniques, Business Processes and Benchmarking, Bordeaux, France, April 1996.
[4] Choi, J., & Russell, J. S. (2004). Economic gains around mergers and acquisitions in the construction industry of the
United States of America. Canadian Journal of Civil Engineering, 31(3), 513-525.
[5] Cooper, J., & Schindler, M. (2008). Perfect Sample Size in Research. New Jersey: Havard University Press.
[6] Elango, B., Ma, Y. L., & Pope, N. (2008). An investigation into the diversification–performance relationship in the
US property–liability insurance industry. Journal of Risk and Insurance, 75(3), 567-591.
[7] Ghoroghchi, E. H. (2015). A Model for Execution of Product Concentric Diversification Strategy: A Case Study of
Kadbanoo Company. European Online Journal of Natural and Social Sciences: Proceedings, 4(1 (s)), 949-959.
[8] Hermalin, B. E., & Katz, M. L. (2004). Corporate diversification and agency. Incentives, Organization, and Public
Economics: Papers in Honour of Sir James Mirrlees, 17-39.
[9] Ibrahim, Y. M., & Kaka, A. P. (2007). The impact of diversification on the performance of UK construction firms.
Journal of Financial Management of Property and Construction. 12(2), 73 - 86,
[10] Iqbal, A., Hameed, D., & Qadeer, M. (2012). Impact of diversification on firms‟ performance. American Journal of
Scientific Research, 80, 42-53.
[11] Karanja, G. R. (2013). Diversification Strategy adopted by Kenolkobil and its effect on performance (Unpublished
MBA Project), University of Nairobi.
[12] Kim, W. C., Hwang, P., & Burgers W. P. (1993). Multinationals' diversification and the risk-return
tradeoff. Strategic Management Journal, 14, 275–286.
[13] Kombo, D. K., & Tromp, D. L. (2006). Proposal and thesis writing: An introduction. Nairobi: Paulines Publications
Africa.
[14] Kothari, C. R. (2004). Research methodology: Methods and techniques. New Delhi: New Age International.
[15] Luo, Y., Liu, Y., & Xue, J. (2009). Relationship investment and channel performance: An analysis of mediating
forces. Journal of Management Studies, 46(7), 1113-1137.
[16] Maina, M. W. (2016). Product diversification strategies as a determinant of perceived firm performance among real
estate companies in Nairobi City County, Kenya (Unpublished Masters Thesis), Moi University, Eldoret, Kenya.

International Journal of Management and Commerce Innovations ISSN 2348-7585 (Online) Vol. 9, Issue 1, pp: (466-485), Month: April 2021 - September 2021, Available at: www.researchpublish.com
Page | 485 Research Publish Journals
[17] Mohindru, A., & Chander, S. (2010). Diversification Strategy and Corporate Performance in India: An Empirical
Investigation. Asia Pacific Business Review, 6(3), 124–137.
[18] Mugenda, A., & Mugenda, A. G.(2008). Social Science Research, Theory and Principles. Nairobi: Kijabe printers.
[19] Ndege, B. W., & Wanyoike, D (2017). Effects of concentric diversification strategies on growth of cosmetic firms in
Nakuru County, Kenya. International Journal of Economics, Commerce and Management, V(12), 916-955.
[20] Ofori, G. & Chan, S. L. (2000). Growth paths of construction enterprises in Singapore, 1980–1998. Engineering,
Construction and Architectural Management Journal, 7(3), 307–321.
[21] Palepu, K. G., & Healy, P. M. (2012). Business analysis & valuation: Using financial statements texts & cases.
Mason, OH: Thomson South-Western.
[22] Pearce, J.A. & Robinson, R.B. 2007. Formulation, Implementation and Control of Competitive Strategy, (9th
Ed.).
Boston, MA: McGraw-Hill Irwin.
[23] Penrose, R. (1959, January). The apparent shape of a relativistically moving sphere. In Mathematical Proceedings of
the Cambridge Philosophical Society (Vol. 55, No. 1, pp. 137-139). Cambridge University Press.
[24] Porter, M. E., (2000). Competitive strategy: techniques for analyzing industries and competitors. New York: The
Free Press
[25] Waema, T.M. (2008), The Development of National ICT Policy in Kenya; The Influence of Regional Institutions
and Key Stakeholders."