Divergent Monetary Policy –Implication for sub-Saharan ... · PDF fileImpact Divergent...
23
By Sarah O. Alade Deputy Governor, Economic Policy Central Bank of Nigeria Divergent Monetary Policy –Implication for sub-Saharan African Economies
Transcript of Divergent Monetary Policy –Implication for sub-Saharan ... · PDF fileImpact Divergent...
By Sarah O. Alade
Deputy Governor, Economic Policy Central Bank of Nigeria
Divergent Monetary Policy –Implication for sub-Saharan African Economies
Crisis background………
The recent financial crisis is one of the most significant macroeconomic crisis in recent times
Many countries suffered low investment rate, high unemployment rate and collapse of the financial market
Financial markets not only triggered the crisis, but played a role in transmission of shock to the real economy
Collapse on financial institutions, sharp decline on several assets, lack of credit, and loss of confidence in the financial system were all indicators of the grave situation
Crisis background………
The 2008 crisis caused huge recession and outpaced conventional monetary policy response
With the exceptional economic conditions, Central Banks took unconventional measures to promote investment and production in advanced economies
The massive expansionary monetary policy in industrialized countries had global effects and international spillovers that caused emerging markets economies to change their monetary and economic policy
Crisis background…..
The US and UK adopted some assets buying and bond purchasing measures to resuscitate their economies
This had implications for emerging market economies in the areas of capital inflows, bond yield, assets prices and exchange rate volatility.
The near zero interest rate in advanced economies gave rise to capital flows into emerging markets and SSA benefited from the inflows.
Divergent Monetary Policy: Impact on SSA Economies
While advanced economies experienced low growth, economies of emerging markets witnessed sustained growth as high interest rate attracted inflows from advanced economies
Quantitative Easing policies of the US FED and EU countries resulted in an unprecedented increase in monetary base, lower interest rates and flattened yield curve
With cheap and new capital flows into the SSA economies, many countries became highly exposed to external shocks.
Divergent Monetary Policy: Impact on SSA Economies
0
1
2
3
4
5
6
7
8
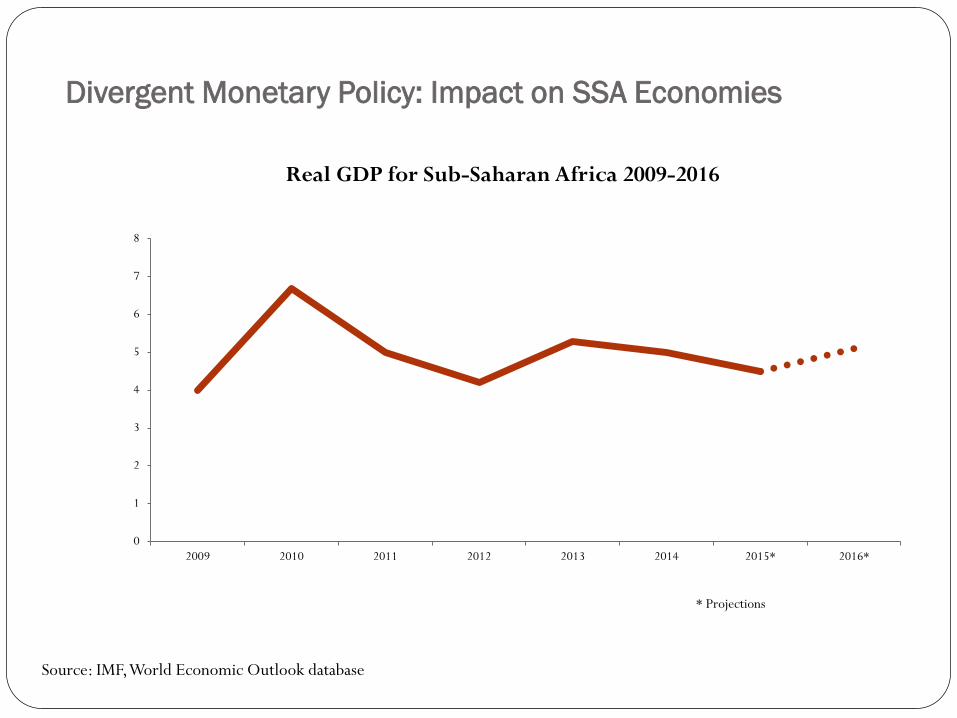
2009 2010 2011 2012 2013 2014 2015* 2016*
Real GDP for Sub-Saharan Africa 2009-2016
* Projections
Source: IMF, World Economic Outlook database
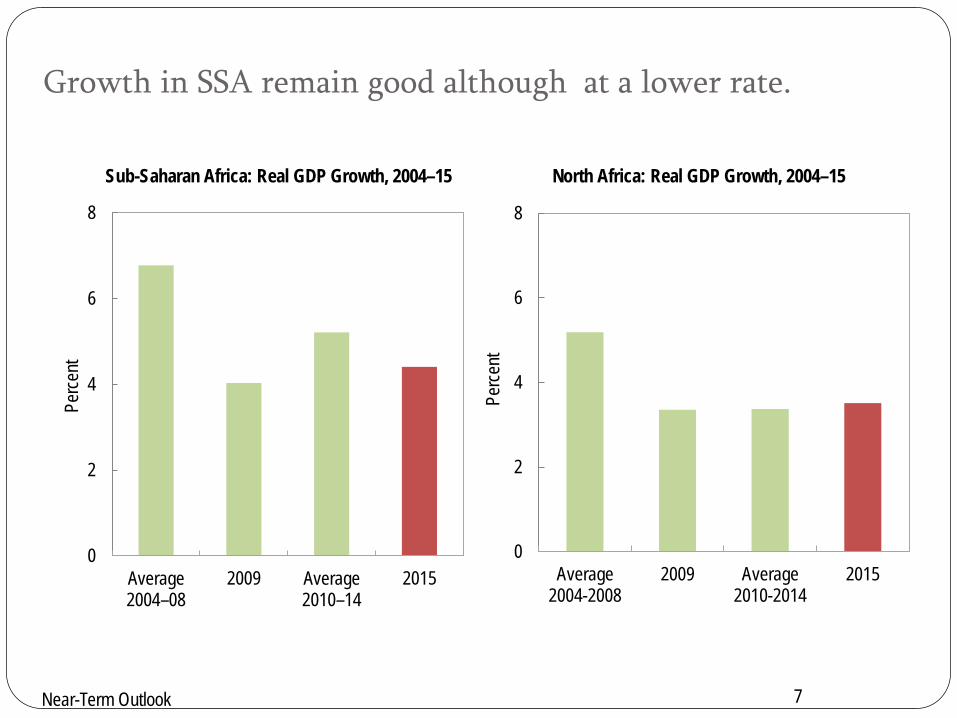
Sub-Saharan Africa: Real GDP Growth, 2004–15
0
2
4
6
8
Average 2004–08
2009 Average 2010–14
2015
Perce
nt Growth in SSA remain good although at a lower rate.
Near-Term Outlook 7
North Africa: Real GDP Growth, 2004–15
0
2
4
6
8
Average2004-2008
2009 Average2010-2014
2015
Perce
nt
Near-Term Outlook 8
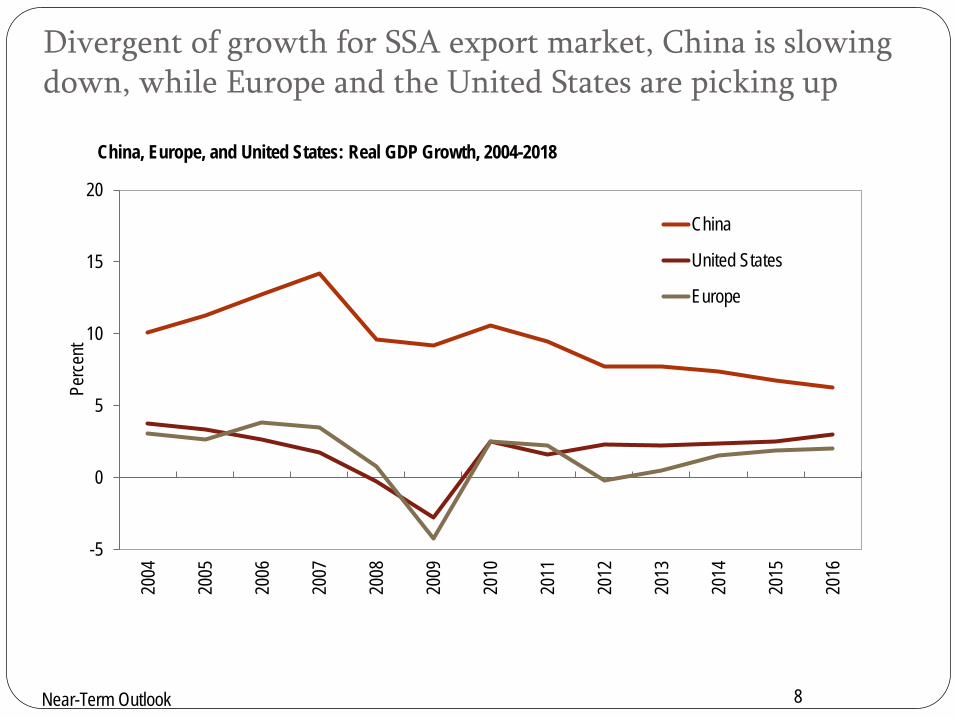
-5
0
5
10
15
20
2004
2005
2006
2007
2008
2009
2010
2011
2012
2013
2014
2015
2016
Perce
nt
China
United States
Europe
China, Europe, and United States: Real GDP Growth, 2004-2018
Divergent of growth for SSA export market, China is slowing down, while Europe and the United States are picking up
Divergent Monetary policy – Impact on SSA Economies
Quantitative Easing also promoted trading in the financial markets and some Sub-Saharan Africa countries raised huge amount of money from the international debt market taking advantage of the near zero interest rate.
However, the drop in commodity prices is putting many SSA economies in a challenging position
Most SSA African countries are commodity exporters and low commodity prices will effect the external position and financing in these countries
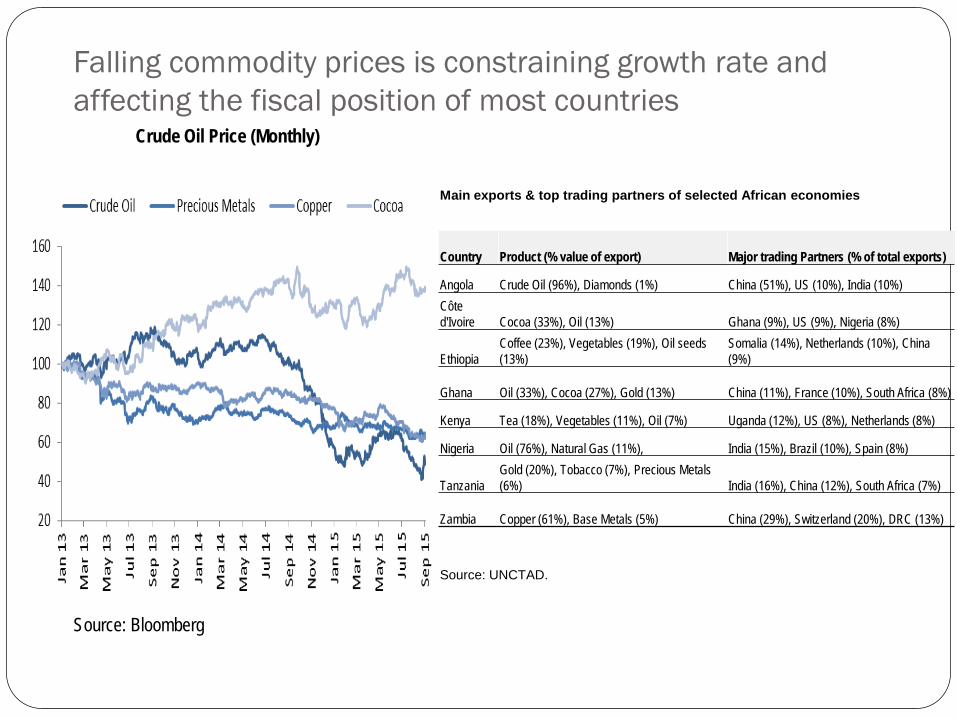
Falling commodity prices is constraining growth rate and affecting the fiscal position of most countries
Source: Bloomberg
Crude Oil Price (Monthly)
Main exports & top trading partners of selected African economies
Country Product (% value of export) Major trading Partners (% of total exports)
Angola Crude Oil (96%), Diamonds (1%) China (51%), US (10%), India (10%) Côte d'Ivoire Cocoa (33%), Oil (13%) Ghana (9%), US (9%), Nigeria (8%)
Ethiopia Coffee (23%), Vegetables (19%), Oil seeds (13%)
Somalia (14%), Netherlands (10%), China (9%)
Ghana Oil (33%), Cocoa (27%), Gold (13%) China (11%), France (10%), South Africa (8%)
Kenya Tea (18%), Vegetables (11%), Oil (7%) Uganda (12%), US (8%), Netherlands (8%)
Nigeria Oil (76%), Natural Gas (11%), India (15%), Brazil (10%), Spain (8%)
Tanzania Gold (20%), Tobacco (7%), Precious Metals (6%) India (16%), China (12%), South Africa (7%)
Zambia Copper (61%), Base Metals (5%) China (29%), Switzerland (20%), DRC (13%)
Source: UNCTAD.
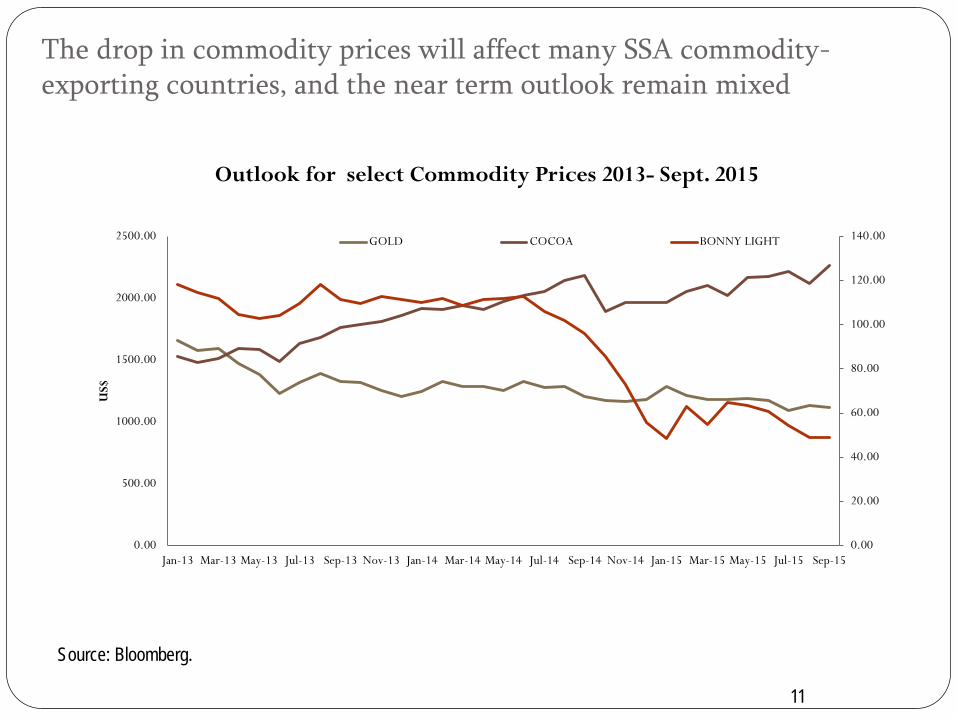
Source: Bloomberg.
The drop in commodity prices will affect many SSA commodity-exporting countries, and the near term outlook remain mixed
11
0.00
20.00
40.00
60.00
80.00
100.00
120.00
140.00
0.00
500.00
1000.00
1500.00
2000.00
2500.00
Jan-13 Mar-13 May-13 Jul-13 Sep-13 Nov-13 Jan-14 Mar-14 May-14 Jul-14 Sep-14 Nov-14 Jan-15 Mar-15 May-15 Jul-15 Sep-15
US$
Outlook for select Commodity Prices 2013- Sept. 2015
GOLD COCOA BONNY LIGHT
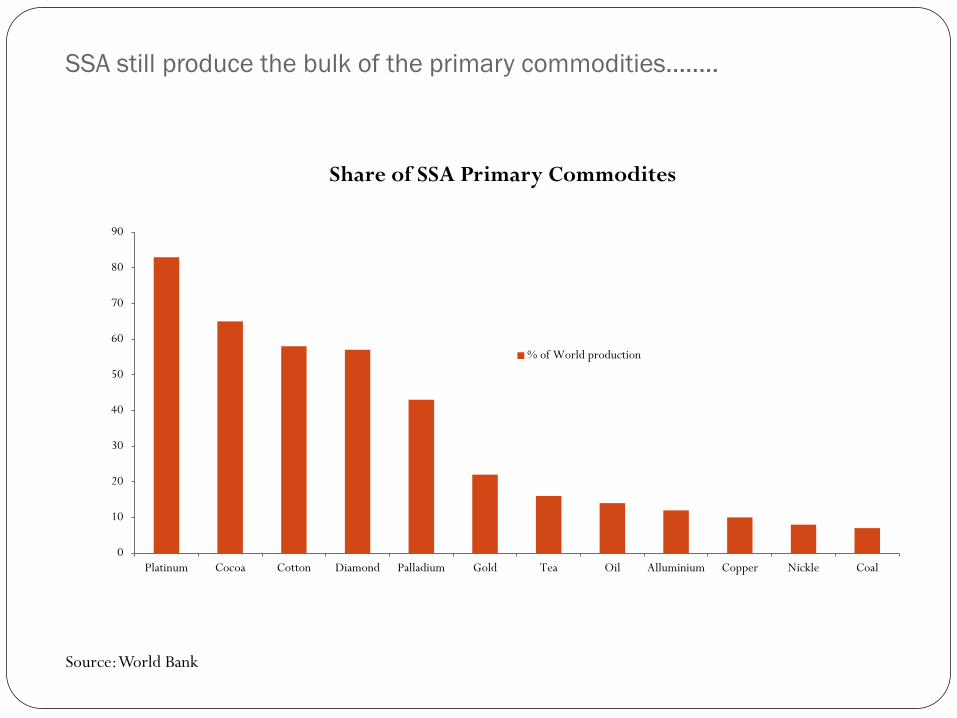
SSA still produce the bulk of the primary commodities……..
0
10
20
30
40
50
60
70
80
90
Platinum Cocoa Cotton Diamond Palladium Gold Tea Oil Alluminium Copper Nickle Coal
Share of SSA Primary Commodites
% of World production
Source: World Bank
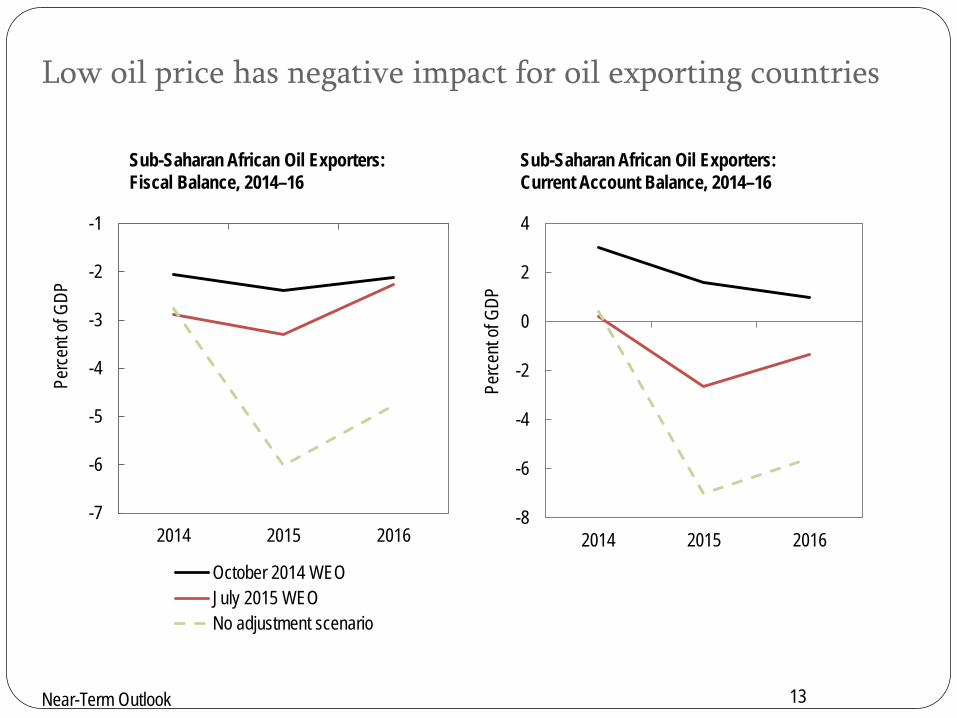
Sub-Saharan African Oil Exporters: Fiscal Balance, 2014–16
Sub-Saharan African Oil Exporters: Current Account Balance, 2014–16
Low oil price has negative impact for oil exporting countries
Near-Term Outlook
-7
-6
-5
-4
-3
-2
-1
2014 2015 2016
Perce
nt of
GDP
October 2014 WEOJuly 2015 WEONo adjustment scenario
-8
-6
-4
-2
0
2
4
2014 2015 2016
Perce
nt of
GDP
13
2008
2014 2015
2008
2014
2015
2008 2014
2015
2008 2014
2015
2008
2014 2015
-15
-10
-5
0
5
10
-6 -4 -2 0 2 4 6
Curre
nt ac
coun
t bala
nce (
perce
nt of
GDP)
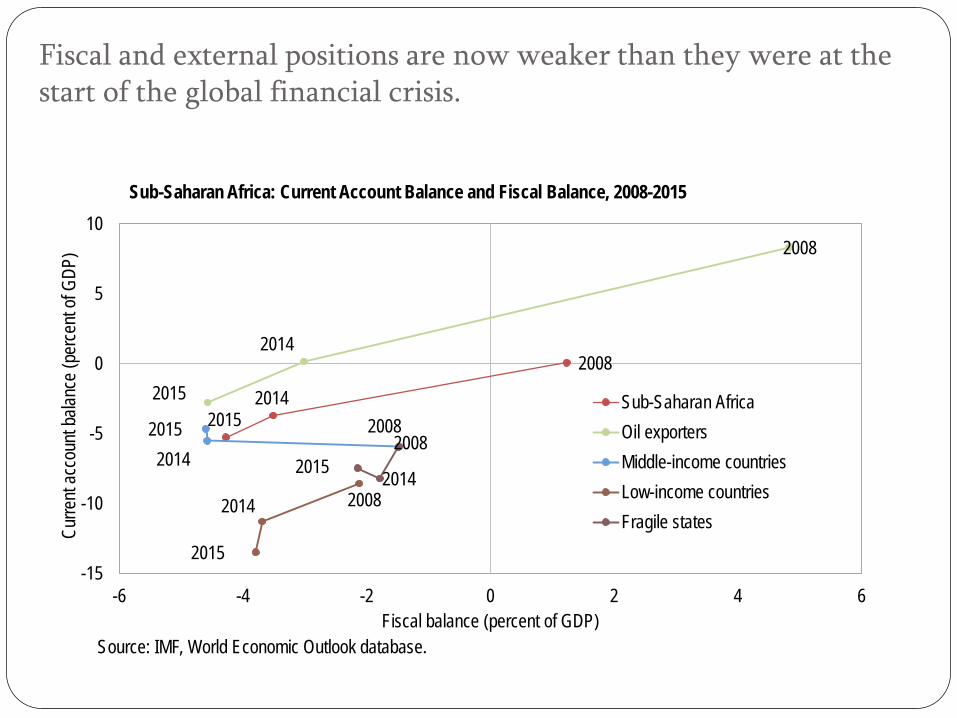
Fiscal balance (percent of GDP)
Sub-Saharan AfricaOil exportersMiddle-income countriesLow-income countriesFragile states
Source: IMF, World Economic Outlook database.
Sub-Saharan Africa: Current Account Balance and Fiscal Balance, 2008-2015
Fiscal and external positions are now weaker than they were at the start of the global financial crisis.
Near-Term Outlook
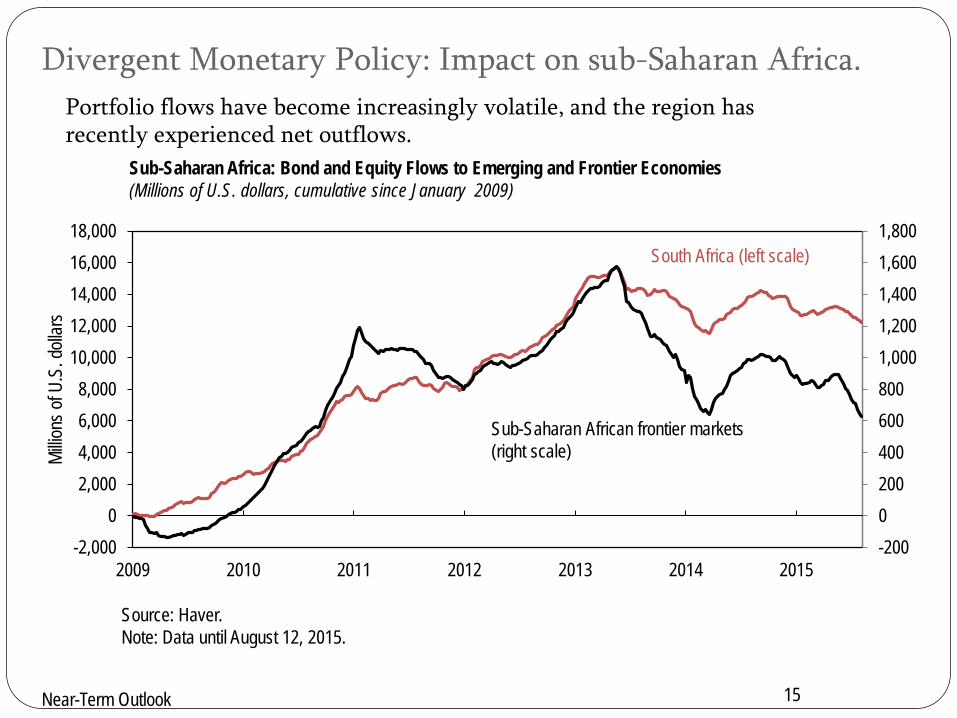
Divergent Monetary Policy: Impact on sub-Saharan Africa.
15
Sub-Saharan Africa: Bond and Equity Flows to Emerging and Frontier Economies (Millions of U.S. dollars, cumulative since January 2009)
-20002004006008001,0001,2001,4001,6001,800
2009 2010 2011 2012 2013 2014 2015-2,000
02,0004,0006,0008,000
10,00012,00014,00016,00018,000
Millio
ns of
U.S
. doll
ars
Sub-Saharan African frontier markets (right scale)
South Africa (left scale)
Source: Haver. Note: Data until August 12, 2015.
Portfolio flows have become increasingly volatile, and the region has recently experienced net outflows.
Near-Term Outlook
Divergent Monetary Policy: Impact on sub-Saharan African Economies
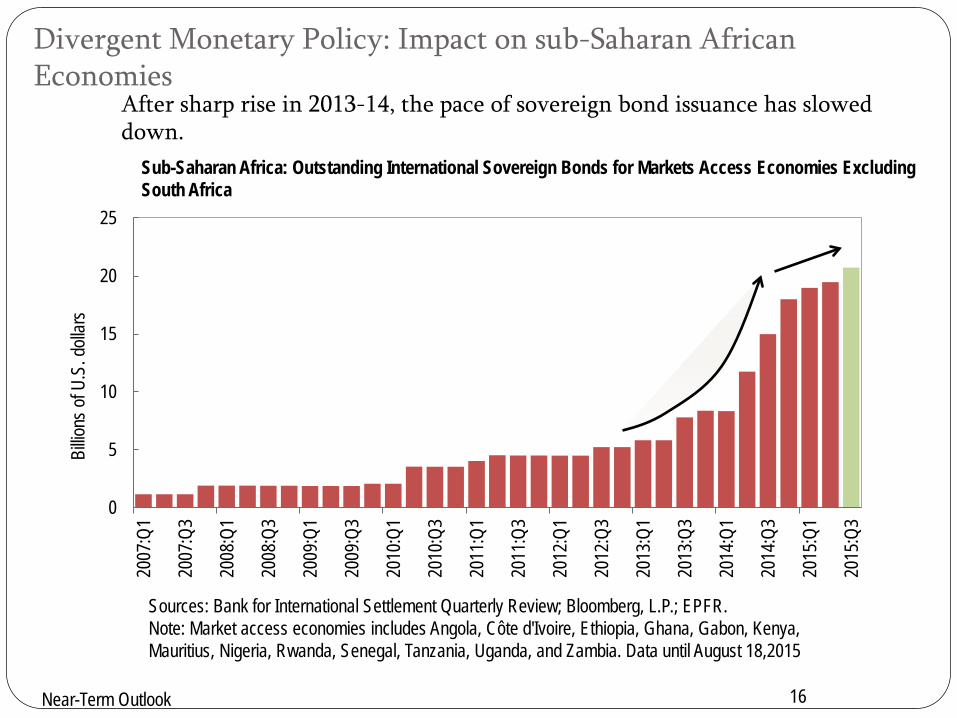
Sub-Saharan Africa: Outstanding International Sovereign Bonds for Markets Access Economies Excluding South Africa
Sources: Bank for International Settlement Quarterly Review; Bloomberg, L.P.; EPFR. Note: Market access economies includes Angola, Côte d'Ivoire, Ethiopia, Ghana, Gabon, Kenya, Mauritius, Nigeria, Rwanda, Senegal, Tanzania, Uganda, and Zambia. Data until August 18,2015
0
5
10
15
20
25
2007
:Q1
2007
:Q3
2008
:Q1
2008
:Q3
2009
:Q1
2009
:Q3
2010
:Q1
2010
:Q3
2011
:Q1
2011
:Q3
2012
:Q1
2012
:Q3
2013
:Q1
2013
:Q3
2014
:Q1
2014
:Q3
2015
:Q1
2015
:Q3
Billio
ns of
U.S
. doll
ars
16
After sharp rise in 2013-14, the pace of sovereign bond issuance has slowed down.
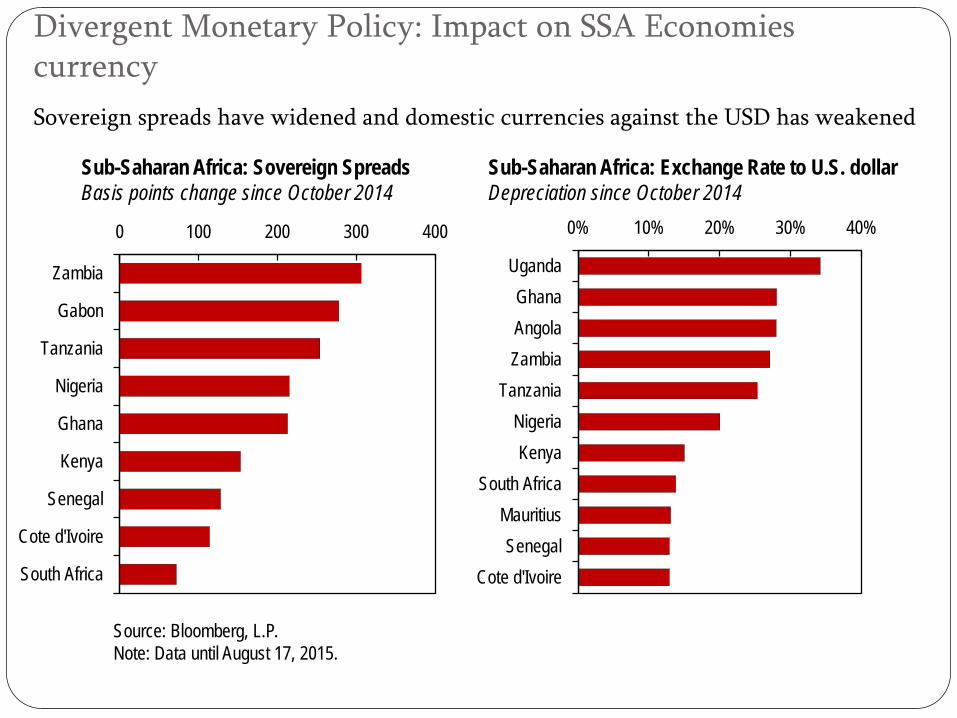
Sub-Saharan Africa: Sovereign Spreads Basis points change since October 2014
Sub-Saharan Africa: Exchange Rate to U.S. dollar Depreciation since October 2014
Divergent Monetary Policy: Impact on SSA Economies currency
Source: Bloomberg, L.P. Note: Data until August 17, 2015.
0 100 200 300 400
Zambia
Gabon
Tanzania
Nigeria
Ghana
Kenya
Senegal
Cote d'Ivoire
South Africa
0% 10% 20% 30% 40%
UgandaGhanaAngolaZambia
TanzaniaNigeriaKenya
South AfricaMauritiusSenegal
Cote d'Ivoire
Sovereign spreads have widened and domestic currencies against the USD has weakened
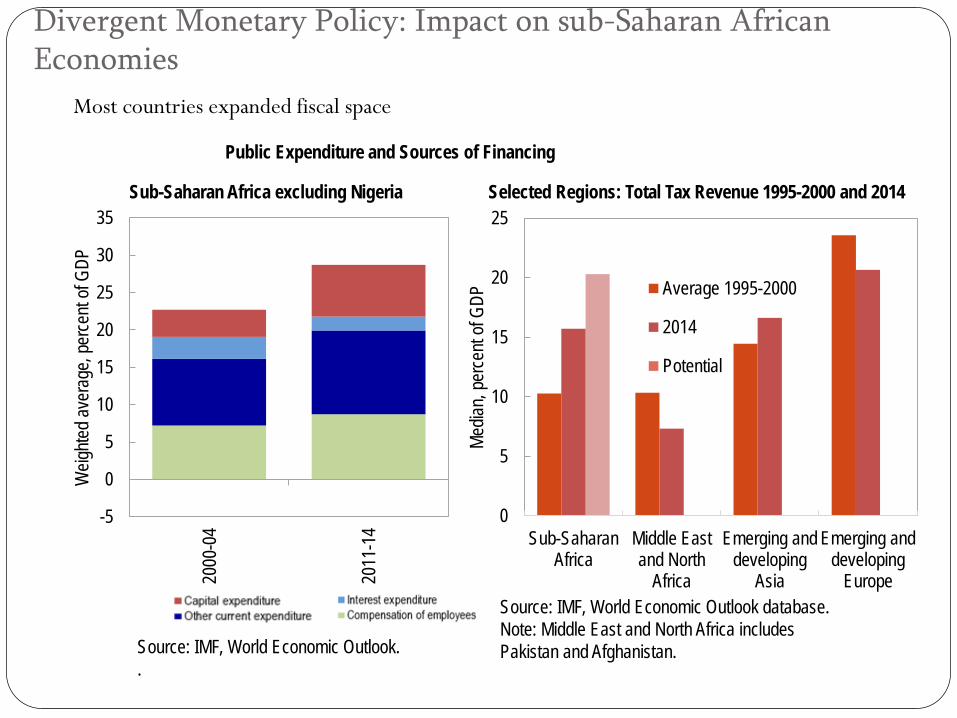
Sub-Saharan Africa excluding Nigeria
Source: IMF, World Economic Outlook. .
Public Expenditure and Sources of Financing
Divergent Monetary Policy: Impact on sub-Saharan African Economies
-5
0
5
10
15
20
25
30
3520
00-0
4
2011
-14
Weig
hted a
vera
ge, p
erce
nt of
GDP
Selected Regions: Total Tax Revenue 1995-2000 and 2014
0
5
10
15
20
25
Sub-SaharanAfrica
Middle Eastand North
Africa
Emerging anddeveloping
Asia
Emerging anddeveloping
Europe
Media
n, pe
rcent
of GD
P Average 1995-2000
2014
Potential
Source: IMF, World Economic Outlook database. Note: Middle East and North Africa includes Pakistan and Afghanistan.
Most countries expanded fiscal space
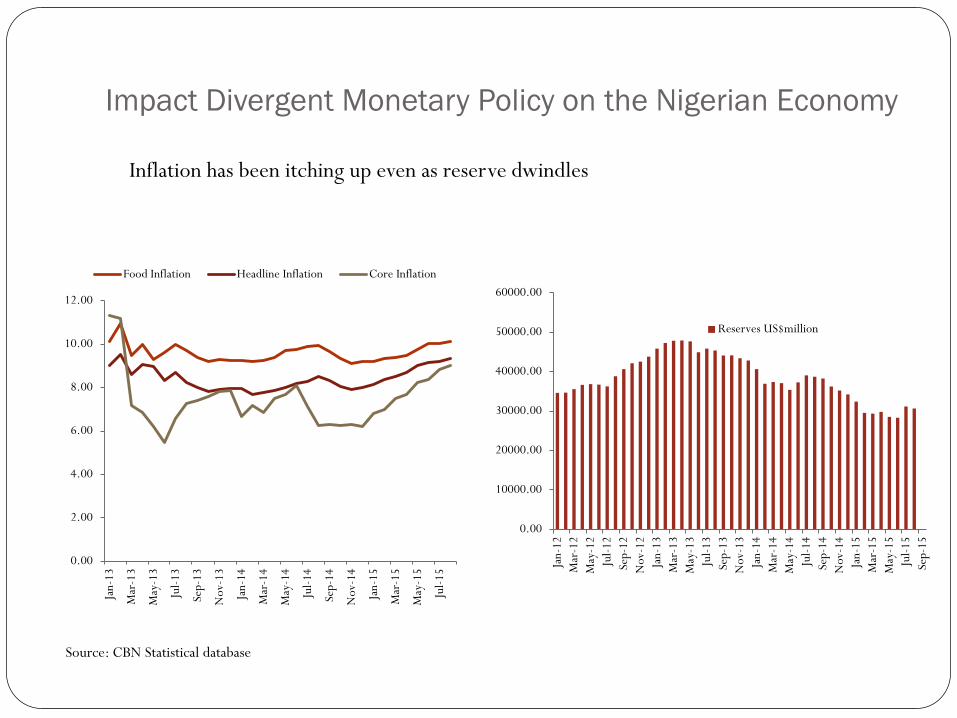
Impact Divergent Monetary Policy on the Nigerian Economy
Source: CBN Statistical database
Inflation has been itching up even as reserve dwindles
0.00
10000.00
20000.00
30000.00
40000.00
50000.00
60000.00
Jan-
12M
ar-1
2M
ay-1
2Ju
l-12
Sep-
12N
ov-1
2Ja
n-13
Mar
-13
May
-13
Jul-1
3Se
p-13
Nov
-13
Jan-
14M
ar-1
4M
ay-1
4Ju
l-14
Sep-
14N
ov-1
4Ja
n-15
Mar
-15
May
-15
Jul-1
5Se
p-15
Reserves US$million
0.00
2.00
4.00
6.00
8.00
10.00
12.00
Jan-
13
Mar
-13
May
-13
Jul-1
3
Sep-
13
Nov
-13
Jan-
14
Mar
-14
May
-14
Jul-1
4
Sep-
14
Nov
-14
Jan-
15
Mar
-15
May
-15
Jul-1
5
Food Inflation Headline Inflation Core Inflation
Divergent Monetary Policy: Near-term Outlook for sub-Saharan African Countries The recovery in advanced economies like US, UK and Euro zone areas
will be sustained
The European Central Bank has taken many steps to increase the degree of policy accommodation, including an expansion of its bond-buying program
The Bank of Japan has continued with very accommodative monetary policies, including a 0 % interest rate and purchases of Japanese government bonds and other assets.
The slow down in the Chinese economy despite liquidity injection will have a spillover effect on SSA economies especially in terms of commodity prices
Divergent Monetary Policy: Near Term Outlook for sub-Saharan Africa
The anticipated rate hike has been priced in, and would not have much of an economic impact on the region.
Risk to the regional outlook will be more effected by slow down in growth on China, increased production of shale oil in the USA, and geopolitical tension in the middle East (Iran deal, Libyan peace deal etc.)
Further decline in oil price could exacerbate upside risks to exchange rate on many countries and result in dislocations and inflationary pressures
Anticipated rate hike could foster another round of offshore positioning. Foreign investors may unwind fixed income and/or equity holding resulting in upward pressure on the domestic currency. This coupled with lower buffers from low commodity prices would put downward pressure on the domestic currency
Minimal impact of FED rate hike expected for the region in the short term
Divergent Monetary Policy: Near term Outlook for sub-Saharan Africa
Many SSA countries are better prepared now than at the start of the crisis due to hard lessons learned and some reforms implemented, although more needs to be done in some countries to strengthen institutional structures. Some of the reforms include
Fuel subsidy reform, Tax measures, including increasing tax rates, and Greater exchange rate flexibility, where feasible
Domestic fundamentals are more likely to be the most important determinants of how SSA economies financial conditions respond to FED normalization policy
Therefore, it is important that SSA economies continue to build strong system institution and strengthen financial system stability to be better prepared for the further FED actions.
Divergent Monetary Policy: Concluding Remarks
As global markets anticipate rate hike by the FED, it is important that its global implication is considered and forward guidance given.
Policy decisions should not be isolated, but most be consultative, gradual and predictable to avoid negative feedback effects for the US economy and the global economy.
Emerging market economies have sustained global growth during the crisis, and policies coordination is essential to avoid dislocation and strengthen financial system stability
Emerging markets should be prepared to manage capital flow volatility, build fiscal buffer and safeguard its financial system to weather the storm
Market during the taper tantrum of Spring 2013 underscores the importance of transparency and effective communication by the FED on the timing and magnitude of the normalization