DIuIN PAPe SeIe - IZA Institute of Labor Economicsftp.iza.org/dp10832.pdf · DIuIN PAPe SeIe IZA DP...
52
DISCUSSION PAPER SERIES IZA DP No. 10832 Gigi Foster Leslie S. Stratton What Women Want (Their Men to Do): Housework and Satisfaction in Australian Households JUNE 2017
Transcript of DIuIN PAPe SeIe - IZA Institute of Labor Economicsftp.iza.org/dp10832.pdf · DIuIN PAPe SeIe IZA DP...

Discussion PaPer series
IZA DP No. 10832
Gigi FosterLeslie S. Stratton
What Women Want (Their Men to Do): Housework and Satisfaction in Australian Households
juNe 2017

Any opinions expressed in this paper are those of the author(s) and not those of IZA. Research published in this series may include views on policy, but IZA takes no institutional policy positions. The IZA research network is committed to the IZA Guiding Principles of Research Integrity.The IZA Institute of Labor Economics is an independent economic research institute that conducts research in labor economics and offers evidence-based policy advice on labor market issues. Supported by the Deutsche Post Foundation, IZA runs the world’s largest network of economists, whose research aims to provide answers to the global labor market challenges of our time. Our key objective is to build bridges between academic research, policymakers and society.IZA Discussion Papers often represent preliminary work and are circulated to encourage discussion. Citation of such a paper should account for its provisional character. A revised version may be available directly from the author.
Schaumburg-Lippe-Straße 5–953113 Bonn, Germany
Phone: +49-228-3894-0Email: [email protected] www.iza.org
IZA – Institute of Labor Economics
Discussion PaPer series
IZA DP No. 10832
What Women Want (Their Men to Do): Housework and Satisfaction in Australian Households
juNe 2017
Gigi FosterUniversity of New South Wales
Leslie S. StrattonVirginia Commonwealth University and IZA

AbstrAct
juNe 2017IZA DP No. 10832
What Women Want (Their Men to Do): Housework and Satisfaction in Australian Households*
The time allocated to household chores is substantial, with the burden falling
disproportionately upon women. Further, social norms about how much work men and
women should contribute in the home are likely to influence couples’ housework allocation
decisions and evaluations of their lot. Using Australian data, we employ a two-stage
estimation procedure to examine how deviations from housework norms relate to couples’
satisfaction. In stage one, we model housework time to identify predicted (i.e., socially
expected) and residual components. In support of this bifurcation, the residual housework
time measures are strongly related to each partner’s perceived fairness of the division of
household tasks. In stage two, we predict satisfaction based on predicted and residual
housework time. We find that women’s satisfaction, but not men’s, is robustly affected by
their partners’ residual housework time. When he exceeds housework norms, she is happier
with housework allocations, but less happy in broader dimensions.
JEL Classification: D13, I31, Z13
Keywords: satisfaction, social norms, housework
Corresponding author:Leslie S. StrattonDepartment of EconomicsVirginia Commonwealth University301 W. Main StreetP.O. Box 844000Richmond, VA 23284-4000USA
E-mail: [email protected]
* This paper uses unit record data from the Household, Income and Labour Dynamics in Australia (HILDA) Survey. The HILDA Project was initiated and is funded by the Australian Government Department of Social Services (DSS) and is managed by the Melbourne Institute of Applied Economic and Social Research (Melbourne Institute). The findings and views reported in this paper, however, are those of the authors and should not be attributed to either DSS or the Melbourne Institute. We thank Deborah Cobb-Clark, Paul Frijters, Joyce Jacobsen, Charlene Kalenkoski, Terra McKinnish, Edward Millner, Paco Perales Perez, and seminar participants at Monash University, the University of New South Wales, Virginia Commonwealth University, Deakin University, and the 2016 ANU-hosted Labour Econometrics Workshop for helpful comments on earlier drafts of this paper. We are also greatly indebted to James Stratton for outstanding research assistance. All errors remain ours.

2
Introduction
“I generally find that comparison is the fast track to unhappiness.” – Jack Canfield
People cannot help but compare their behaviors to the prevailing norms in their society. The results
of social comparison have been conjectured to drive dimensions of psychological welfare, and
ultimately to motivate economic behaviors including investment, search, and resource allocation
(see Basit Zafar 2011 for a review). Social comparison effects have been seen in data from around
the world (America, Europe, and Asia) in an array of prior studies in economics and social psychology
(e.g., Leon Festinger 1954; Heather Smith, Thomas Pettigrew, Gina Pippin, and Silvana Bialosiewicz
2012; Gerben van Kleef, Florian Wanders, Eftychia Stamkou, and Astrid C. Homan 2015), and with
respect to outcomes ranging from pro-social behavior (Bruno Frey and Stephan Meier 2004) to
personal identity (Marilynn Brewer 1991) to satisfaction (Nynke Frieswijk, Bram P. Buunk, Nardi
Steverink and Joris P. J. Slaets 2004; Abraham Buunk, Hinke Groothof, and Frans Siero 2007).
The social norms that form the basis of behavioral comparisons may be drawn from society “as a
whole” (whether globally, as represented in the media, within a particular country or sub-group, or
otherwise), and/or from groups closer at hand and known personally, such as close family members.
In particular, behavioral norms are unavoidably established over time within households. One
behavioral dimension of a household’s circumstances that substantially impacts everyday life, and
where significant variation across households exists, is the intra-household distribution of time spent
on unpaid housework. Is this a dimension along which individuals might compare themselves, or
their family members, to social norms (whether sourced from the broader society or from the
household’s own history)? If so, might satisfaction or welfare effects arise from such comparisons?
We approach this question by examining the relationship between individuals’ satisfaction and the
time they and their partners spend doing housework. In particular, we bifurcate the actual time
spent on housework for male and female members of a household couple into predicted and
residual housework time. We then separately test the associations of the predicted and residual
portions of both his and her housework time with an array of measures of individual satisfaction.

3
The logic behind this approach is that the predicted portion of housework time should proxy for
social norms about how much housework time is appropriate for oneself and for one’s spouse, and
that individuals’ mental comparison of actual behavior to those norms may in turn drive satisfaction.
Our approach is motivated in part by existing evidence from the sociology literature (Janeen Baxter
2000; Mikael Nordenmark and Charlott Nyman 2003; Caroline Henchoz and Boris Wernli 2013;
Marisa Young, Jean Wallace, and Alicia Polochek 2015; Daniel Carlson, Sarah Hanson, and Andrea
Fitzroy 2016) relying on data from Australia, Canada, the US, Switzerland, and Sweden indicating
broadly that the more couples share domestic labor, the happier they are.1 While these results are
intriguing, the level of “sharing” against which partners’ judge each other’s allocation of time to
housework is not immediately obvious. We argue that using a bifurcation of actual housework time
into predictable (expected) and unpredictable portions enables us to isolate a proxy for the ambient
social expectation of the amount of housework that “should” be done by a particular person in a
particular setting – i.e., the benchmark level against which that person, and that person’s partner,
may compare their actual performance. Our modelling approach allows us to examine whether
changes in the unpredictable portion of actual housework time for men and women are in fact
associated with changes in their partners’ stated satisfaction, measured in a variety of ways.
Because women on average shoulder a disproportionate share of housework around the globe
(OECD 2011), housework itself is arguably a more salient force in women’s lives than in men’s –
driving more decisions on an everyday basis, taking up more conscious attention, and perhaps for
these reasons creating more stress (as found in Rachel Connelly and Jean Kimmel 2015 and implied
in Martha MacDonald, Shelley Phipps, and Lyn Lethbridge 2005). Consequently, one might expect
that if the type of social comparison effects sketched above are present, they may be more evident
1 For a review of the broader literature in sociology regarding household labour – its measurement, division
within the household, and associations with economic and psychological outcomes – see Beth Shelton and
Daphne John (1996).

4
for women than for men, whose stress levels appear to be more responsive than women’s to
aspects of the realm of paid work (Alison Booth and Jan Van Ours 2008). Specifically, relative to men,
women may be more keenly aware of, and hence their satisfaction may be more responsive to, their
spouses’ housework behavior – and even their own housework behavior.
However, a related literature suggests that men who perform traditionally female unpaid tasks can
suffer negative consequences in their relationships with the very females with whom they are
sharing the burden. In the most famous recent example from this literature, Sabino Kornrich, Julie
Brines, and Katrina Leupp (2012) find that both men and women in couples whose domestic chore
allocation runs more strongly along traditional gender lines report higher sexual frequency than
other couples. This implies that those with more egalitarian allocations have less sex. One
interpretation of this finding is that women’s satisfaction in at least some dimensions may decline
when the amount of housework performed by the man is unusually large in comparison to social
norms – norms which themselves reflect a strong degree of female-specificity in the performance of
housework.2
Method
To test these ideas empirically, we use longitudinal data on couple households in Australia from the
HILDA survey. We begin by presenting some basic descriptive information for our sample, including
reported housework time as well as an array of satisfaction measures. These statistics are reported
separately by gender and we highlight the noticeable gender differences. We also describe the
simple associations between housework time and the array of satisfaction measures, for men and
women separately.
2 If, as beautifully articulated by West and Zimmerman 1987 (p. 126), “…the ‘doing’ of gender is undertaken by women and men whose competence as members of society is hostage to its production,” then by implication men who “do” more female-ness (for example, by allocating more time to housework) risk being perceived as being less competent members of society – even, presumably, by their partners.

5
We proceed to examine separately by gender how the time couples allocate to housework relates to
satisfaction using a two-stage approach. In stage one, we model men’s and women’s housework
time separately, saving measures of both the predicted and unpredicted (residual) portions of his
and her housework time. In stage two, we use both of these components to model within-couple
changes in satisfaction of various types, both specifically in relation to housework and more
generally. We look primarily for evidence that a deviation from social norms by Partner A impacts
the satisfaction of Partner B, motivated by the notion that if Partner A increases his/her contribution
to housework time more than is the norm, Partner B may be more satisfied with the bargain she/he
is getting in the partnership. Own effects may also arise if housework is considered unpleasant.
We first look for evidence that the residual housework measures derived from our first-stage models
of housework time relate in the ways we would predict to the perceived fairness of housework
duties. We find that when asked whether they do their fair share of work around the house, people
of both genders who have higher first-stage residuals are more likely to report doing a greater share
of housework. These patterns give us confidence that the residual housework measure constructed
from our first stage is indicative of the deviation of an individual’s housework time allocation from
what would be considered socially appropriate (“fair”).
We then investigate how satisfaction with the way in which housework is allocated within the
partnership responds to these residuals. We find that a woman’s satisfaction with housework
allocation relates negatively to her own residual housework time, and positively to her spouse’s
residual housework time. Notably, men do not demonstrate the same sensitivity. We further show
that women’s satisfaction with their lives as a whole (and, in some specifications, with partner
relationship) is negatively – not positively – related to their partners’ residual housework time,
whereas no such effect is seen for men. Hence, housework time allocations do seem to matter more
for women’s satisfaction than for men’s and, depending on the satisfaction measure used, the
direction of the effect changes. All standard errors are bootstrapped, where the bootstrapping
procedure wraps around both steps in the analysis.

6
Data
We use household-level panel data taken from the 2001-2014 waves of the Household Income and
Labour Dynamics in Australia, or “HILDA”, survey (see Nicole Watson and Mark Wooden 2012 for
more details). Our sample is restricted to single-family, mixed-gender couple households (married or
cohabiting) of working age.3 Observations in which either partner fails to complete the self-
completed questionnaire on which housework time is reported, or fails to respond to a satisfaction
question,4 are excluded,5 as are couples with only one year of data who are more likely than other
couples to be in a very short-lived relationship, and who contribute no information in the context of
panel analysis. We perform all analyses separately by gender.
Time spent on housework is recorded as the response to the question, “How much time would you
spend on housework (preparing meals, washing dishes, cleaning house, washing clothes, ironing and
sewing) in a typical week?”6 These activities are routine tasks that every household has to complete
in some way, and for the vast majority of households the time spent on these activities constitutes
3 Persons younger than age 20, men older than age 64, women older than age 61, and 20-to-23-year-olds
enrolled full-time in higher education are excluded. The different age restrictions by gender approximately
reflect the different ages at which men and women are eligible to receive pensions in Australia.
4 Satisfaction with the division of housework is only asked beginning in 2005, and hence our sample size is
smaller when running the second-stage models that use this measure, but we do not globally restrict the
sample on that basis.
5 Observations missing data on our explanatory variables are also dropped. The variables most likely to be
missing data are non-labour income and gift income. Paid work time is missing for a small number of
observations and is also top-coded at 80 hours for men and 65 hours for women, approximately the top decile
in each case.
6 This question is answered to the nearest minute in all HILDA waves except the first; in 2001, it is answered to
the nearest hour. In our models, any difference in average measured quantity of housework caused by this
change in granularity across reporting years is captured by our year dummies.

7
more than 40 percent of total reported time spent on a broader class of unpaid labor that
additionally includes running errands and performing outdoor labor, such as yard work.7
Observations in which either partner fails to report housework time, or in which the couple jointly
reports either no time or more than 70 hours (approximately the 99th percentile), are dropped. In
about 85 percent of households in our sample, the woman contributes 50 percent or more of the
hours devoted to housework in total by the couple. Most people, regardless of gender, report
housework time in the range of one to twenty hours per week, with some degree of clustering at
round figures (e.g., five hours, ten hours). The incidence of individuals replying ‘no time’ is
sufficiently uncommon (less than 0.4 percent for women and less than 7 percent for men) to make
nonlinear estimation unnecessary.
Motivated by prior literature highlighting the role of spouses’ assessment of “fairness” with the
division of housework (e.g., Michelle Frisco and Kristi Williams 2003), we begin our second-stage
analysis with an examination of individuals’ responses to the question, “Do you think you do your
fair share around the house?”. Responses to this question range from “I do much more than my fair
share” (coded 1) to “I do much less than my fair share” (coded 5). We think of this measure as
capturing the individual’s appraisal of his or her housework performance relative to prevailing
norms, and use it to support a similar interpretation of our first-stage residuals. We refer to this as a
measure of “share fairness”, with lower numbers indicating that the individual is over-performing
relative to norms and larger numbers indicating underperformance relative to norms.
The HILDA survey includes several measures of satisfaction, one of which captures respondents’
sentiments regarding the allocation of housework. Satisfaction with “The way household tasks are
divided between you and your partner” was recorded on a scale of 0 to 10 in waves 2005 to 2014 of
the HILDA survey, with higher measures indicating greater satisfaction. We use this as our measure
7 At both the individual and household levels, hours spent on housework are positively associated with hours
spent on these other forms of unpaid labour.

8
of satisfaction with respect to housework. We also examine two broader measures of satisfaction
that are available in the HILDA: specifically, satisfaction with the relationship with one’s partner and
satisfaction with life overall. These other satisfaction measures are available in every wave of the
survey.
Table 1 presents some sample statistics both for the full sample and for the sub-sample in which our
housework satisfaction measure is available. Panel A of Table 1 shows that there are almost 32,000
observations on 5180 couples in the full sample, and more than 22,000 observations on 4240
couples in the sample for which satisfaction with the division of housework is reported. While there
are on average 6.2 observations per couple in the full sample, Panel A shows that the distribution of
couples’ longevity in both samples is skewed towards shorter durations.
< Table 1 here: Partial page >
Panel B of Table 1 shows within-couple means for housework time and paid work time, separately by
gender. On average in our full sample, men report spending over 10.5 hours per week (64 percent)
less time on housework than women, and about 16 hours per week (41 percent) more on paid work.
These numbers are extremely similar for the subsample of observations with non-missing data on
our housework satisfaction measure. As reported in another recent paper (Gigi Foster and Leslie
Stratton 2017), summary statistics calculated from the HILDA measures of time spent on housework
are quite similar to those calculated using data from the most recent Australian Time Use Survey,
run by the Australian Bureau of Statistics in 2006.
Table 2 shows the distribution of our measures of share fairness (in Panel A) and satisfaction (in
Panel B), separately for men and women. The answer scale for the three satisfaction measures runs
from 0 to 10, with 0 being “completely dissatisfied” and 10 being “completely satisfied”. As noted
previously, the answer scale for share fairness runs from 1, being “I do much more than my fair
share”, to 5, being “I do much less than my fair share”.
< Table 2 here: Partial page >

9
Fifty-nine percent of women, as compared with only 15 percent of men, report that they do “more
than [their] fair share” of housework, while only 36 percent of women but 57 percent of men report
that they do their fair share. The distribution of women’s satisfaction with the division of household
tasks contains more density at the lower end of the scale, from 0 up to and including the value of 7,
compared to the men’s distribution; only 51 percent of women, but 67 percent of men, report a high
satisfaction level (8, 9, or 10) with the division of household tasks. A similar pattern, though far less
pronounced, is also evident in the gender-specific distributions of reported satisfaction with the
relationship with one’s partner. Hence, the raw data indicate that women in general feel they do
more than their fair share of housework, are less satisfied with the division of household tasks, and
are slightly less satisfied with their relationships with their partners, than men. This pattern is
reversed, though only weakly, in the distributions of overall life satisfaction, with more women than
men reporting a 9 or 10 on this scale.8
Raw Correlations
How does housework time relate to share fairness and our three measures of satisfaction? Raw
correlations (available upon request) indicate that share fairness is positively related to partner’s
housework time. Own satisfaction with the division of household tasks is also positively related to
partner’s housework time, though only significantly so for women. Apart from this, the reported
time spent on housework by both oneself and one’s partner is negatively correlated with satisfaction
and share fairness, for both genders.
8 Christopher Ambrey, Jennifer Ulichny, and Christopher Fleming (2017) report evidence generated using the
same data set that the satisfaction of both Australian men and Australian women has fallen over time
(attributing this fall to a decline in social connectedness). We also find a decline over time for both genders in
our broader satisfaction measures.

10
First stage estimates: Housework time
To examine these associations more thoroughly, we present in Table 3 the results of the first stage
of our analysis, where we predict the time spent on housework by men and women separately. In all
models we control for a range of individual-level characteristics (ethnicity, education, age/cohort);
household structure variables (number and ages of household members); indicators for the
presence of disabled people in the home, for partners engaged full-time in education, urbanicity
(non-urban (base category), major city, and other urban), and type of housing (apartment (base
category), house, or townhouse); reported non-labor income (the sum of interest, dividend, and
royalty income) and gifts (the sum of inheritances, gifts and other irregular income) received by each
partner; and state-of-residence by urbanicity and year dummies. In the second variant of our first-
stage models for each gender, we add controls for the paid employment status, industry,
occupation, and employment hours of both partners, and in the third variant we exclude this
employment information but include couple- and gender-specific fixed effects, necessarily dropping
time-invariant household and individual-level observables. Finally, we estimate a first-stage model of
her share of housework (her time divided by the sum of his and her time) using all the covariates
from our baseline model.9 The results of these three alternative housework models are reported in
Appendix A.
< Table 3 here: Full page >
9 The share of household housework time supplied by women in two households may be the same (say 70
percent) when the hours spent are quite different (say 7 hours in a household reporting 10 hours of
housework, versus 21 hours in a household reporting 30 hours of housework). Spending 21 hours on
housework constitutes a much greater burden than spending 7 hours on housework, which may have
important implications for satisfaction. This is why in our baseline first-stage results we predict reported hours
spent, rather than share.

11
The estimated parameters from our baseline model of the time spent on housework are clearly
jointly significant (p-value of 0.0000 for both men and women), but the model explains a larger
fraction of the variation in women’s housework time (r-squared=0.18) as compared to men’s (r-
squared=0.04). His age is significantly positively associated with his and her housework time,
disabled men report spending almost an hour longer on housework, and men with more non-labor
income report spending less time on housework. His characteristics have little association otherwise
with housework time. Her characteristics, by contrast, are more strongly associated with housework
time. When she is more educated, he spends more time and she spends less time on housework.
Older women report more time on housework, while their partners report less. When women are
disabled, both they and their partners report more time on housework. When women report
receiving more non-labor income, their partners report spending less time on housework. Household
characteristics also have a significant association with housework time. Married men report
spending on average 30 minutes less per week while their partners report spending about 85
minutes more per week than those in cohabiting relationships. The presence of children of all ages
significantly increases the housework time of both men and women, though the magnitude of the
effect is six to ten times greater for women.
Second-stage estimation results
We now position the models of his and her housework time shown in Table 3 above as the first stage
in a two-stage procedure, where in the second stage we predict his and her assessment of
housework share fairness and then three dimensions of satisfaction, based on estimation results
from the first stage. Our key independent variables in the second-stage models, all of which include
gender- and couple-specific fixed effects in order to control for unobservable differences across
households in average share fairness responses or satisfaction levels, are the residuals and in some
cases also the predicted portions of his and her housework time, as constructed from the output of
the first-stage regressions shown in Table 3. The average of predicted housework time is, of course,
equal to the average of actual housework time (6.2 hours for him and 17.2 hours for her); the

12
standard deviations of predicted housework time are 1.1 hours for men and 5.0 hours for women.
Residual housework time necessarily has a mean of zero. Its standard deviation is 10.6 hours for
women and 5.8 hours for men. To ease interpretations, we normalize the fairness and satisfaction
measures, the residuals, and the predicted housework times to have standard deviations of one so
that coefficients can be interpreted as the impact that a one-standard-deviation increase has on
fairness/satisfaction responses, measured in standard deviations of within-person-couple
fairness/satisfaction responses.
Fairness
Table 4 shows the results of our second-stage models predicting each partner’s perception of the
fairness with which household tasks are allocated, using the baseline variant of our first-stage model
(results shown in Table 3) to generate the “predicted” and “residual” portions of housework time.
Three specifications are reported: all include the residual portion of own and partner’s housework
time, the second also includes each partner’s predicted housework time, and the third includes all
the covariates incorporated in the first-stage model of housework time. A positive estimated
coefficient for a regressor in these models indicates a positive conditional association of that
variable with the sense that one is doing less than one’s fair share of housework. All standard errors
are fully bootstrapped across the entire two-step estimation procedure.
< Table 4 here: Partial page >
The results from these models are remarkably robust in sign, significance, and magnitude across all
specifications in a manner that strongly supports our interpretation of the residuals as indicative of
departures from the social norm. Given that these second-stage regressions include fixed effects,
our estimates indicate that people of both genders whose residual housework time increases are
predicted to report feeling as though they are doing a greater share of housework. Similarly, both
men and women whose partners’ residuals increase are predicted to report feeling as though they
are doing a smaller share of housework. Men appear particularly sensitive to their own residual

13
housework time, as a one-standard-deviation increase in their residual (small as it is) leads to a 0.22
standard deviation decrease in their share fairness report. Men are not nearly as sensitive to their
partner’s residual housework time, as a one-standard-deviation increase in that residual leads to
only a 0.07 standard deviation change in their share fairness report. Women, by contrast, are about
equally sensitive to their own and their partner’s deviations from the norm, and their level of
sensitivity falls in the mid-range, with a one standard deviation change in either residual shifting
their share fairness report by between 0.12 and 0.14 standard deviations. Furthermore, men’s sense
of housework share fairness is not significantly related to the predictable part of either his or his
partner’s housework time, whereas women’s is. This indicates that women are more likely than men
to respond to the fairness question in an unconditional sense, rather than conditional on
characteristics included in the first stage (such as the presence of children) that relate to how much
housework is done by each person.
Results from the specifications including residual and predicted values from our alternative first-
stage housework models are reported in Appendix B. Residual housework time shows the same
relation to reports of housework share fairness observed in Table 4, though the magnitude of the
effect is about 30 percent smaller when controlling for person-couple-specific fixed effects. Perhaps
not surprisingly, the results from the first-stage specification predicting her share of the couple’s
housework time, rather than his or her hours of housework time, provides a better fit in the second-
stage model of share fairness. As expected, when her residual share increases, he perceives that he
is doing a lesser share of housework, while she perceives she is doing a greater share.
Satisfaction
Table 5 shows analogous results using each of our three measures of satisfaction, rather than share
fairness, as the dependent variable in the second stage. These results indicate no strong association
of own or partner’s residual housework time with men’s satisfaction with the division of housework
time, with their relationship with partner, or with life. Thus, while men appear to recognize

14
deviations from social norms with respect to housework when asked to assess the fairness of their
share of housework, these deviations do not appear to influence significantly their satisfaction -
even the dimension of satisfaction related to how housework is divided. For women, this is not the
case. Women’s residual housework time is significantly negatively associated, while their partner’s
residual housework time is significantly positively associated, with women’s satisfaction with the
division of housework. The magnitude of these effects is modest: a one-standard-deviation change
in either residual shifts satisfaction by between 0.04 and 0.07 of a standard deviation. These residual
housework measures are not significantly associated with women’s satisfaction with their
relationship with partner, but the residual portion of partner’s housework time is negatively and
significantly associated, and her residual portion is weakly positively associated, with her satisfaction
with life. Hence, when their men do more than is expected according to our first-stage housework
models, women are more satisfied with regard to the intra-household division of household tasks,
but they are less satisfied with their lives overall.
< Table 5 here: Full page >
Both men and women are also significantly less satisfied in all dimensions represented here when he
is predicted to spend more time on housework. Her predicted housework time also negatively
influences some dimensions of both partners’ satisfaction, though the effects are less robust and
weaker than for men. These results suggest that gendered housework norms (cf. Candace West and
Don Zimmerman 1987) are important, such that both men and women lose utility when men in
particular are expected by society to do more housework. However, the scattered negative effects
on his and her satisfaction of women’s predicted housework time suggests couples may be happier
when each partner is expected to do less housework. Such an effect could reflect a social norm
according to which spending more time on housework indicates lower social status, or it could
simply reflect the added stresses imposed by busy schedules.
15
Comparable results obtained using the estimates from our alternative first-stage housework models
are reported in Appendix C for the second-stage specification including both residual and predicted
values. For men the results are very similar: neither his nor her residual housework time has a
significant effect on any measure of satisfaction. Her residual share of couple housework time is
positively but weakly (in terms of magnitude and significance) related to his satisfaction with his
relationship with partner. These results are consistent with our findings above that men’s
satisfaction appears to be largely unresponsive to residual housework time measures.
Her results when adding controls for employment status in the models of housework time are also
broadly the same. She is less satisfied with the division of housework time when she does more
housework than expected and more satisfied when he does more than expected. However, she is
less satisfied with life overall when his residual housework time is larger. When housework time is
modelled with individual-couple-specific fixed effects, she is sensitive to his residual housework time
when evaluating her satisfaction with her partner relationship and with life overall, but not when
evaluating her satisfaction with the division of housework. When her residual share of the couple’s
housework is higher (and hence when his residual share is lower), she is less satisfied with the
division of housework time; she is also more satisfied with life overall. These results are in broad
accordance with our main findings and interpretations.
Sensitivity tests
We here document the numerous sensitivity tests we have run to assess the robustness of these
results. First, we estimated the two-stage procedure using only dual-earner couples – i.e., couples in
which each partner was always employed whenever observed in the sample. Second, we tested
whether positive and negative deviations from the norms estimated in the first stage had symmetric
effects on satisfaction. Third, we explored the possibility that social norms might be determined
differently for different populations, checking for differences by running separate first-stage

16
regressions by immigrant status, by education level, and by age cohort. Finally, we ran some tests for
the possibility that reverse causality is driving our very robust results.
Time spent on housework is, of course, jointly determined with time spent in paid employment. As
noted by the time availability theory posited in sociology research (e.g., R.O. Blood and D.M. Wolfe
1960), more time spent on paid employment likely means less time available for housework.
Available time is likely to be particularly constrained in dual-earner households. To see if our results
also hold when we only consider such households, we restricted the sample to the 2188 couples
(11,881 observations) who when observed were always both employed, and re-estimated both the
first and the second stage models (full results available upon request). The relation between residual
housework time and perceived share fairness for these dual-earner couples remains highly
statistically significant, though the magnitude of the effect of his residual in terms of standard
deviations from the mean is about 25 percent smaller from his perspective, and 40 percent smaller
from hers. As before, his satisfaction with the division of household time is not sensitive to any
residual, while compared to our full-sample results, hers is a bit more sensitive to her residual and
less sensitive to his. As regards satisfaction in other dimensions, the key difference for dual-earner
couples is that her satisfaction with life is not significantly related to either his or her residual
housework time. This result may arise because working women are less focused than non-working
women on home life when it comes to evaluating their overall life satisfaction.
To test whether the effects on fairness perceptions and satisfaction of deviations from the
housework norm are symmetric for positive and negative deviations, we estimated our second-stage
models including separate measures of positive and negative standardized residuals from the
baseline first-stage model of housework time. In the analysis of share fairness and of satisfaction
with the division of household tasks, we find that negative residuals have a much larger effect than
positive residuals. In predicting share fairness, negative residuals have over four times the effect of
positive residuals for him, and between two and six times the effect of positive residuals for her. In
predicting satisfaction with the division of housework time, no effect of either type of residual is

17
seen for men, but women’s satisfaction is affected between two and five times more strongly by
negative as compared to positive residual housework time. Thus, perceptions of housework share
fairness and (for women) satisfaction with the allocation of housework are much more sensitive to
deviations below than to deviations above the social norm – a result reminiscent of findings in the
behavioral economics literature that individuals are more sensitive to disadvantages than to
advantages (see Amos Tversky and Daniel Kahneman 1991). We also find that when he spends less
time on housework than is the social norm he is significantly more satisfied with his partner, but
otherwise deviations in either direction have no significant effect. She reports being somewhat more
satisfied with her partner when he does less housework than is the norm and less satisfied with life
when he does more housework than is the norm – results in line with our findings that in terms of
broader measures of satisfaction, she prefers her partner to do less housework.
To check for the possibility that the group whose social norm most informs a particular individual’s
expectations in regard to housework time allocation is that group most like him or herself, we re-ran
the analysis separately for couples with and without an immigrant background, for younger and
older (both born before 1965) cohorts, and for less and more educated couples (where a “less-
educated couple” is one in which the woman has no more than twelve years of education and the
man has no more than a vocational degree). Both the first- and second-stage models were estimated
sequentially on these subsamples. In all cases, F-tests on the housework time models reject pooling
– not a surprising result, given our sample size (results available upon request). However, as the
second-stage analysis incorporates fixed effects, it is only the within-couple deviations from the
residual and predicted values that influence our final results, and these differences are likely to be
less pronounced than differences in housework time across the couple types.
Table 6 presents the results for each of these subsamples of the second-stage model of the
perceived fairness of the housework allocation, using the specification that includes both residual
and predicted housework time. As compared to the full-sample results, there is little difference in
the estimated relation between residual housework and perceived share fairness in terms of either
18
statistical significance or magnitude. Younger men, and to a lesser extent more educated men,
appear to be more sensitive to her predicted housework time, being significantly more likely to
report doing less than their fair share when her predicted time is high. Older men are, on the
contrary, somewhat more likely to report doing more than their fair share when her predicted time
is high. Otherwise, as in the full-sample results, predicted housework time is not significantly related
to his sense of fairness. While overall women whose partners are predicted to spend more time on
housework are more likely to report doing less than their fair share around the house, it is women in
the older cohort who are particularly sensitive. This result suggests that expectations regarding what
is fair may be evolving over time/across generations, such that housework is becoming a less
gendered activity.
< Table 6 here: ~ Full page >
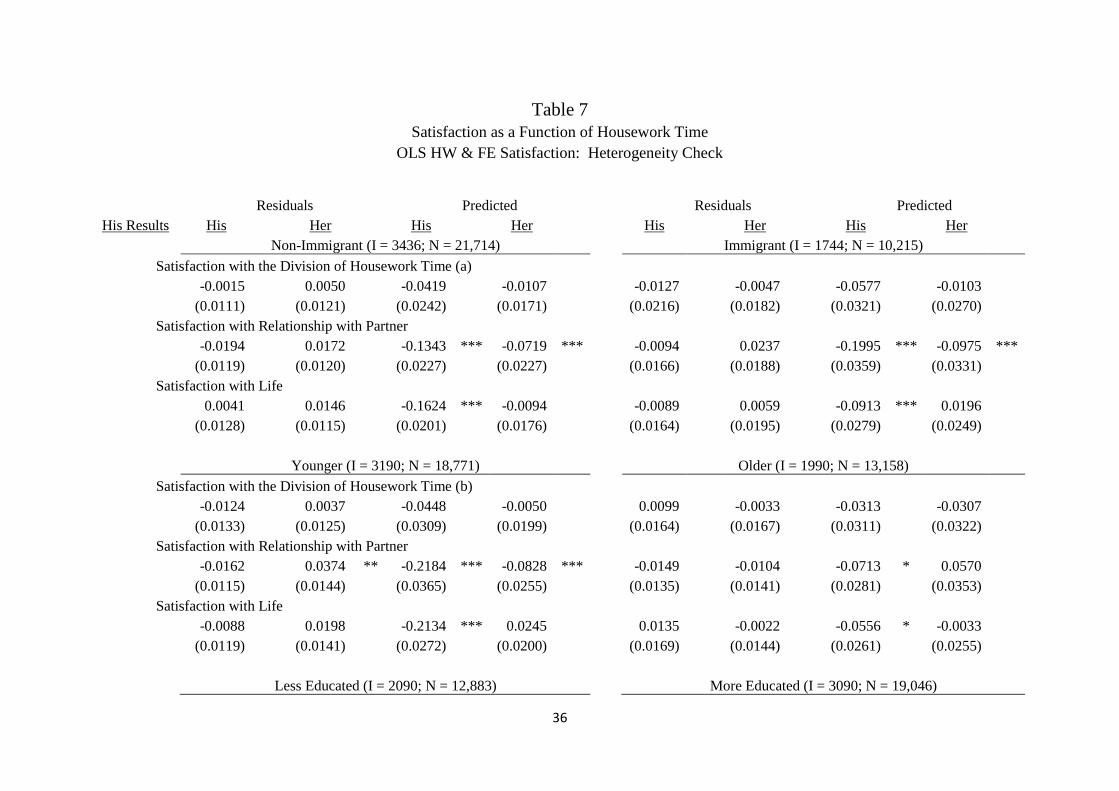
Table 7 presents second-stage results for the broader satisfaction measures using these different
subsamples of the population. These results are broadly consistent with the full-sample estimates. In
particular, men’s satisfaction with the division of housework time remains insensitive to both
residual and predicted housework measures, while women’s remains sensitive for all samples.
However, younger individuals appear to be more likely to report lower satisfaction with their
relationship than older individuals when either partner is predicted to spend more time on
housework, and lower satisfaction with life when the man is predicted to spend more time on
housework. These results may indicate that any signals of lesser social station embodied in higher
predicted housework time, particularly for men, are felt more keenly by younger people.
Meanwhile, her predicted housework time is positively associated with his satisfaction with the
relationship when he is less educated, but negatively associated with that same dimension of his
satisfaction when he is more educated. This contrasting pattern by education level also holds for
women’s own satisfaction with their relationship with their partner. These results are consistent
with an impact of education on norms related to housework that then drive couples’ relationship
satisfaction, with more-educated people preferring (in terms of relationship satisfaction) the woman

19
to be in a position in which less housework is expected, and less-educated people preferring the
opposite.10 Importantly for our story, however, the comparisons implicit in the estimated effects of
residual housework on broader measures of her satisfaction – whereby she is less satisfied with life
overall when he does more housework than expected, and more satisfied when she herself does
more housework than expected – hold across most sub-samples we analyze, though with varying
degrees of statistical significance.
< Table 7 here: Full page >
Finally, one might be concerned that women’s satisfaction with life is generally negatively associated
with their partner’s residual housework time because of reverse causality in the relationship
between the residual portion of men’s housework time and their partner’s broader satisfaction
measures. Thus, when women become less satisfied over time, perhaps their partners respond by
increasing their efforts in the household. It also may be that the additional stress (or whatever is
causing the lowered satisfaction) causes the women themselves to spend more time on housework.
To check for this possibility, we ask whether changes in women’s satisfaction from one year to the
next are predictive in a regression model of subsequent changes in the residual portion of
housework time. We model changes in both his and her residuals as a function of past changes in
both his and her satisfaction measures (see Appendix D). We run specifications including only the
difference between his and her satisfaction measures one year ago and that of two years ago, plus a
constant. The results are similar when we add to the regression year-over-year differences in the
additional covariates.
Results indicate that his residual housework time rises when in the past he felt his share had fallen,
and falls when in the past she felt her share had fallen. Her residual responds similarly though less
10 This story is consistent with the findings in Foster and Stratton (2017) that document different gendered
norms by education when it comes to housework responsibilities.

20
significantly. Hence, couples appear to compensate through time for perceived imbalances relative
to one another in housework share. These results further support our interpretation of these
residuals as indicative of deviations from social norms – to which individuals seem to have an
incentive to return. However, none of the measures of past changes in satisfaction are significantly
associated with changes in the residuals. Reverse causality, from satisfaction to housework, does not
appear to be a problem.
Discussion
We explore the way in which the time allocated to housework by oneself and one’s partner affect
own satisfaction in a number of dimensions. Our analysis of this question exploits panel data on
mixed-gender couples from the Australian HILDA survey. We apply a two-stage modelling approach
in which we view the portion of an individual’s housework time that is predictable in the first stage –
based on a model that includes a large set of individual and household-specific time-varying
observables as well as year/urbanicity and state effects – as a proxy for the amount of housework
time society expects the individual in question to perform. In stage two, we predict individual
satisfaction in a range of dimensions based on the residual and predicted portions of own and
partner’s housework time as estimated in stage one. Under the assumption that our model of
housework time captures social norms related to housework, predicted housework time generated
in our first-stage model can be interpreted as ‘expected’, while residual housework time reflects
deviations from the norm.
We first document a strong and intuitive relationship between the residual housework time of both
genders and the perceived fairness of the share of housework that each person reports. These
results lend credibility to our interpretation that the residual housework measures from the first
stage contain information about the degree to which individuals deviate from ambient expectations
about how much housework they should do. Our subsequent analysis of satisfaction with the
division of household tasks suggests that societal norms regarding housework time robustly

21
influence women’s satisfaction in this dimension. We find that her satisfaction with the division of
household tasks falls as either her predicted or her residual housework time rises, and rises as her
partner’s residual housework time rises. These effects are in line with our original hypothesis that
she would respond positively to extra help he offers around the house over and above what is
expected of him. However, this result does not carry over to her satisfaction with her relationship
with her partner: she is actually less satisfied with her life as a whole when her partner does more
housework than expected. Of potentially equal interest, women’s residual housework has no
significant effect on either housework-related or broader measures of men’s satisfaction, with this
striking difference in sensitivity by gender perhaps due to the stronger salience of housework in
women’s lives.
We experiment with different specifications for the first stage, and we also run the entire analysis
for separate subsamples of the data. Sensitivity testing indicates that our baseline results are robust,
with some nuances in evidence when we split our sample by education level, age cohort, and
whether both partners are employed. We also find some evidence of heightened responses of
satisfaction to negative housework residuals as compared to positive housework residuals. Overall,
our results are consistent with a gender difference in the mental saliency of housework that impacts
upon the sensitivity of individual satisfaction levels to one’s own, and one’s partner’s, allocation of
time to housework.
We are the first to use models of housework time to generate measures of social norms related to
housework that are then linked to satisfaction measures. We find strong evidence that social norms
about housework are associated with female satisfaction with intra-household housework
allocations, but that other measures of satisfaction do not respond positively (and sometimes
respond negatively) when men do more housework than is predicted by our first-stage models. Our
general conclusion is that in a more general sense, women want their men to conform somewhat to
social stereotypes in regard to time spent on housework, even if in a more immediate or narrow

22
sense they are more satisfied when their partners shoulder more of the housework burden than
society expects.
23
Bibliography
Ambrey, Christopher, Jennifer Ulichny, and Christopher Fleming. 2017. “The Social Connectedness
and Life Satisfaction Nexus: A Panel Data Analysis of Women in Australia.” Feminist Economics
23(2): 1-32.
Baxter, Janeen. 2000. “The Joys and Justice of Housework.” Sociology 34(4): 609-631.
Blood, R. O. and D. M. Wolfe. 1960. Husbands and wives. New York: Free Press.
Booth, Alison and Jan Van Ours. 2008. “Job Satisfaction and Family Happiness: The Part-Time Work
Puzzle.” The Economic Journal 118(526): F77–F99.
Brewer, Marilynn B. 1991. “The Social Self: On Being the Same and Different at the Same Time.”
Personality and Social Psychology Bulletin 17(5): 475-482.
Buunk, Abraham P., Hinke A. K. Groothof, and Frans W. Siero. 2007. “Social comparison and
satisfaction with one’s social life.” Journal of Social and Personal Relationships 24(2): 197-205.
Carlson, Daniel L., Sarah Hanson, and Andrea Fitzroy. 2016. “The Division of Child Care, Sexual
Intimacy, and Relationship Quality in Couples.” Gender and Society 30(3): 442–466, DOI
10.1177/0891243215626709
Connelly, Rachel and Jean Kimmel. 2015. "If You're Happy and You Know It: How Do Mothers and
Fathers in the U.S. Really Feel about Caring for Their Children?" Feminist Economics 21(1): 1-34.
Ferrer-i-Carbonell, Ada and Paul Frijters. 2004. “How important is methodology for the estimates of
the determinants of happiness?” The Economic Journal 114(497): 641-659.
Festinger, Leon. 1954. “A theory of social comparison processes.” Human Relations 7:117-40.
Foster, Gigi and Charlene Kalenkoski. 2013. “Tobit or OLS? An empirical evaluation under different
diary window lengths.” Applied Economics 45(20): 2994-3010.
Foster, Gigi and Leslie S. Stratton. 2017. “Do significant labor market events change who does the
chores? Paid work, housework, and power in mixed-gender Australian households.” LSS Working
Paper Series 2017-09.

24
Frey, Bruno S. and Stephan Meier. 2004. “Social comparisons and pro-social behaviour: Testing
“conditional cooperation” in a field experiment.” American Economic Review 94(5): 1717-1722.
Frieswijk, Nynke, Bram P. Buunk, Nardi Steverink, and Joris P. J. Slaets. 2004. “The effect of social
comparison information on the life satisfaction of frail older persons.” Psychology and Aging 19(1):
183-190.
Frisco, Michelle L. and Kristi Williams. 2003. “Perceived housework equity, marital happiness, and
divorce in dual-earner households.” Journal of Family Issues 24: 51-73.
Henchoz, Caroline and Boris Wernli. 2013. “Satisfaction with the Division of Household Tasks in
Switzerland: A Longitudinal Approach.” Population 68(4): 533-556.
Kornrich, Sabino, Julie Brines, and Katrina Leupp. 2012. “Egalitarianism, Housework, and Sexual
Frequency in Marriage.” American Sociological Review 78(1): 26-50.
MacDonald, Martha, Shelley Phipps, and Lyn Lethbridge. 2005. “Taking Its Toll: The Influence of Paid
and Unpaid Work on Women's Well-Being.” Feminist Economics 11(1): 63-94.
Nordenmark, Mikael and Charlott Nyman. 2003. “Fair or Unfair? Perceived Fairness of Household
Division of Labour and Gender Equality among Women and Men: The Swedish Case.“ European
Journal of Women's Studies 10(2): 181-209.
OECD. 2011. “Cooking and Caring, Building and Repairing: Unpaid Work around the World”, in
Society at a Glance 2011: OECD Social Indicators, OECD Publishing.
Oshio, Takashi, Kayo Nazaki, and Miki Kobayashi. 2013. “Division of Household Labor and Marital
Satisfaction in China, Japan, and Korea.” Journal of Family Economic Issues 34:211–223.
Shelton, Beth Anne and Daphne John. 1996. “The Division of Household Labor.” Annual Review of
Sociology 22: 299-322.
Smith, Heather J., Thomas F. Pettigrew, Gina M. Pippin, and Silvana Bialosiewicz. 2012. “Relative
deprivation: A theoretical and meta-analytic review.” Personality and Social Psychology Review
16(3): 203-232.

25
Tversky, Amos and Daniel Kahneman. 1991. “Loss aversion in riskless choice: A reference-
dependent model.” Quarterly Journal of Economics 106(4): 1039-1061.
Van Kleef, Gerben A., Florian Wanders, Eftychia Stamkou, and Astrid C. Homan. 2015. “The social
dynamics of breaking the rules: Antecedents and consequences of norm-violating behavior”.
Current Opinion in Psychology 6: 25-31.
Watson, Nicole and Mark Wooden. 2012. “The HILDA Survey: A case study in the design and
development of a successful household panel study.” Longitudinal and Life Course Studies 3(3): 369-
381.
West, Candace and Don H. Zimmerman. 1987. “Doing Gender.” Gender and Society 1(2): 125-151.
Young, Marisa, Jean E. Wallace, and Alicia J. Polochek. 2015. “Gender Differences in Perceived
Domestic Task Equity: A Study of Professionals.” Journal of Family Issues 36(13): 1751-1781.
Zafar, Basit. 2011. “An experimental investigation of why individuals conform.” European Economic
Review 55(6): 774-798.

26
Table 1
Sample Characteristics at the Couple Level
Panel A
Full
Sample
Sample reporting
Satisfaction with
Division of HW
Number of Couples 5,180 4,240 Number of Observations 31,929 22,322 % Couple Spells with 2 Observations 18.07 18.37 % Couple Spells with 3 Observations 13.98 15.17 % Couple Spells with 4 Observations 15.08 16.11 % Couple Spells with 5 Observations 7.76 9.29 % Couple Spells with 6 Observations 6.49 7.57 % Couple Spells with 7 Observations 6.06 7.92 % Couple Spells with 8 Observations 5.02 7.29 % Couple Spells with 9 Observations 4.31 8.66 % Couple Spells with 10 Observations 4.44 9.62 % Couple Spells with 11 Observations 4.65 0.00 % Couple Spells with 12 Observations 4.88 0.00 % Couple Spells with 13 Observations 4.96 0.00 % Couple Spells with 14 Observations 4.31 0.00
Panel B Mean
Std.
Dev. Mean
Std.
Dev.
His Average Housework Time 6.01 4.50 6.33 4.62
His Average Paid Labor Time 39.35 15.66 39.39 15.20
Her Average Housework Time 16.71 9.28 16.30 9.12
Her Average Paid Labor Time 23.20 15.72 23.75 15.59

27
Table 2
Panel A: Share Fairness Measures
By Gender
His
Perception
of Share
Fairness
Her
Perception
of Share
Fairness
I do much more than my fair share 4.78 29.20
I do a bit more than my fair share 10.05 29.69
I do my fair share 57.13 36.01
I do a bit less than my fair share 24.11 4.11
I do much less than my fair share 3.93 0.98
Number of Observations
31,929 31,929
Panel B: Satisfaction Measures
By Gender
Men Women
Satisfied
with the
division of
household
tasks
Satisfied
with
partner
relationship
Satisfied
with your
life overall
Satisfied
with the
division of
household
tasks
Satisfied
with
partner
relationship
Satisfied
with your
life overall
Completely Dissatisfied (0) 0.30 0.34 0.05 1.08 0.37 0.04
1 0.33 0.34 0.08 1.45 0.63 0.05
2 0.89 0.82 0.26 3.37 1.04 0.18
3 1.47 1.14 0.53 4.85 1.50 0.33
4 2.36 1.20 0.90 5.24 1.68 0.70
5 7.11 2.93 2.86 9.29 3.85 2.85
6 6.10 3.67 5.29 8.64 4.61 4.88
7 14.44 9.83 21.43 14.84 11.09 19.09
8 24.72 21.24 38.23 18.92 20.24 36.77
9 20.36 26.29 22.16 15.29 25.67 24.39
Completely Satisfied (10) 21.92 32.20 8.20 17.05 29.33 10.73
Number of Observations 22,322 31,929 31,929 22,322 31,929 31,929

28
Table 3
Baseline Estimates of the Time Spent on Housework
By Men By Women
His Characteristics:
Ethnicity: Base Case = non-aboriginal Australian
Aboriginal 1.0995 -1.7133
(0.6142) (1.2564)
English Speaking Immigrant 0.3170 -0.6860
(0.2072) (0.3925)
Other Immigrant 0.0513 0.9749
(0.2640) (0.5021)
Education: Base Case = 12 Years
Post-Bachelors -0.0684 0.6514
(0.2870) (0.5578)
BA/Honors -0.0398 -0.3955
(0.2721) (0.5018)
Diploma 0.1834 -0.3814
(0.2088) (0.3754)
Certificate III/IV -0.1222 -0.6819
(0.2319) (0.4428)
11 Years -0.0237 -1.0563 **
(0.2376) (0.4029)
10 Years -0.0962 -0.1550
(0.3328) (0.6088)
< 10 Years -0.3006 -0.4813
(0.2254) (0.3945)
Age 0.0825 *** 0.0814 *
(0.0206) (0.0362)
Birth Cohort: Base Case Born 1960-1970
Born before 1960 -0.5937 * -0.4466
(0.2958) (0.5330)
Born after 1970 -0.2291 0.6059
(0.2973) (0.5053)
Disabled 0.9265 *** -0.1530
(0.2025) (0.3351)
Enrolled Full-Time in School 0.1836 0.4737
(0.3633) (0.5468)
Non-labor Income -0.0325 ** 0.0327
(0.0124) (0.0240)
Gift Income -0.0019 * -0.0010

29
(0.0010) (0.0026) Her Characteristics:
Ethnicity: Base Case = non-aboriginal Australian
Aboriginal 0.9597 0.5147
(0.7112) (1.0660)
English Speaking Immigrant 0.3032 -0.6069
(0.2468) (0.3999)
Other Immigrant -0.0009 0.7629
(0.2591) (0.4877)
Education: Base Case = 12 Years
Post-Bachelors 1.2747 *** -2.3731 ***
(0.3681) (0.5968)
BA/Honors 0.8754 *** -1.6900 ***
(0.2938) (0.5020)
Diploma 0.3294 -1.0887 ***
(0.2209) (0.3866)
Certificate III/IV 0.1739 -0.7831
(0.2559) (0.4520)
11 Years -0.6299 *** 0.5179
(0.2195) (0.4171)
10 Years -0.4275 0.4453
(0.2920) (0.5375)
< 10 Years -0.7467 *** 1.2104 ***
(0.2252) (0.4094)
Age -0.0481 * 0.1466 ***
(0.0211) (0.0378)
Birth Cohort: Base Case Born 1960-1970
Born before 1960 0.1884 0.0843
(0.3051) (0.5397)
Born after 1970 0.0225 0.2865
(0.2979) (0.5059)
Disabled 0.8198 *** 1.6322 ***
(0.2079) (0.3318)
Enrolled Full-Time in School 0.4756 -1.2920 ***
(0.2849) (0.4241)
Non-labor Income -0.0500 *** 0.0481
(0.0148) (0.0342)
Gift Income 0.0007 0.0009
(0.0012) (0.0028) Household Characteristics:
Married -0.5404 *** 1.4340 ***
(0.1550) (0.2607)

30
# of Children Age 0-4 0.4879 *** 5.2701 ***
(0.0870) (0.1705)
# of Children Age 5-9 0.4987 *** 3.2957 ***
(0.0913) (0.1696)
# of Children Age 10-14 0.3684 *** 2.3228 ***
(0.0885) (0.1662)
# of Other Dependents 0.0332 1.3099 ***
(0.1032) (0.1888)
# of Other Adults 0.0145 0.8970 ***
(0.1221) (0.2503)
Have a Disabled Child 0.2810 0.0547
(0.2444) (0.4405)
Have another Disabled Resident 0.2977 0.2698
(0.2587) (0.4874)
Urbanicity: Base Case Rural
Lives in a Major City 0.7298 * -1.2493 *
(0.3302) (0.6226)
Lives in another Urban Area 1.3785 *** 0.0947
(0.4012) (0.7149)
Housing: Base Case Apartment
Live in a House -0.1432 1.0042 ***
(0.1888) (0.3194)
Live in a Townhouse 0.0644 0.0356
(0.2305) (0.3925)
Moved in last year 0.0651 -0.4171 *
(0.1084) (0.1878)
Number of Observations 31,929 31,929 R-Squared 0.0375 0.1788 F-Statistic 6.07 35.09 P-Value 0.0000 0.0000
All specifications also include year and state dummies, as well as state/urbanicity interactions.
Standard errors in parentheses, adjusted for 5180 couple clusters.
Asterisks indicate significance using a 2-tailed test against a null of zero: *** 0.5%, ** 1%, * 5%.

31
Table 4
Housework Share Fairness
OLS HW & FE Share Fairness
Residuals Predicted His Results His Her His Her Covariates
Do you do your fair share around the house?
-0.2174 *** 0.0699 *** No
(0.0119) (0.0091)
-0.2164 *** 0.0704 *** 0.0176 0.0220 No
(0.0118) (0.0091) (0.0150) (0.0147)
-0.2179 *** 0.0695 *** Yes
(0.0060) (0.0046)
Her Results
Do you do your fair share around the house?
0.1225 *** -0.1327 *** No
(0.0109) (0.0098)
0.1212 *** -0.1381 *** 0.0479 *** -0.2562 *** No
(0.0108) (0.0097) (0.0160) (0.0141)
0.1192 *** -0.1371 *** Yes
(0.0108) (0.0097)
The covariates include year and state dummies, all the covariates reported in Table 1, and
state/urbanicity interactions.
Standard errors in parentheses.
Asterisks indicate significance using a 2-tailed test against a null of zero: *** 0.5%, ** 1%, * 5%.

32
Table 5
Satisfaction as a Function of Housework Time
OLS HW & FE Satisfaction
Residuals Predicted His Results His Her His Her Covariates
Satisfaction with the Division of Housework Time (a)
-0.0038 0.0016 No
(0.0107) (0.0100)
-0.0055 0.0015 -0.0431 * -0.0056 No
(0.0108) (0.0100) (0.0193) (0.0145)
-0.0027 0.0020 Yes
(0.0108) (0.0100)
Satisfaction with Relationship with Partner
-0.0082 0.0204 No
(0.0087) (0.0113)
-0.0163 0.0185 -0.1737 *** -0.0587 ** No
(0.0088) (0.0111) (0.0202) (0.0216)
-0.0084 0.0201 Yes
(0.0089) (0.0107)
Satisfaction with Life
0.0059 0.0119 No
(0.0099) (0.0098)
-0.0001 0.0115 -0.1464 *** 0.0056 No
(0.0098) (0.0097) (0.0157) (0.0159)
0.0012 0.0119 Yes
(0.0101) (0.0098)
Residuals Predicted Her
Results His Her His Her Covariates
Satisfaction with the Division of Housework Time (a)
0.0654 *** -0.0426 *** No
(0.0115) (0.0098)
0.0639 *** -0.0445 *** -0.0469 * -0.0873 *** No
(0.0113) (0.0098) (0.0196) (0.0173)
0.0646 *** -0.0452 *** Yes
(0.0115) (0.0099)
Satisfaction with Relationship with Partner
0.0024 -0.0045 No
(0.0093) (0.0093)
-0.0072 -0.0068 -0.2072 *** -0.0751 *** No

33
(0.0092) (0.0093) (0.0237) (0.0229)
0.0013 -0.0048 Yes
(0.0090) (0.0089)
Satisfaction with Life
-0.0223 * 0.0200 * No
(0.0099) (0.0095)
-0.0288 *** 0.0192 * -0.1515 *** -0.0128 No
(0.0098) (0.0094) (0.0187) (0.0130)
-0.0276 ** 0.0172 Yes
(0.0099) (0.0094)
(a) These results are based on a smaller sample of 4240 couples and 22,322 observations. All
other estimates are based on the sample of 31,929 observations and 5180 couples used to
model housework time.
The covariates include year and state dummies, all the covariates reported in Table 1, and
state/urbanicity interactions.
Standard errors in parentheses.
Asterisks indicate significance using a 2-tailed test against a null of zero: *** 0.5%, ** 1%, * 5%.

34
Table 6
Fairness of Housework
OLS HW & FE Satisfaction: Heterogeneity Check
His Results: Do you do your fair share around the house?
Residuals Predicted Residuals Predicted
His Her His Her His Her His Her
Non-Immigrant (I = 3436; N = 21,714) Immigrant (I = 1744; N = 10,215)
-0.2132 *** 0.0736 *** 0.0011 0.0242 -0.2196 *** 0.0646 *** 0.0196 0.0296
(0.0139) (0.0117) (0.0199) (0.0164) (0.0214) (0.0161) (0.0310) (0.0271)
Younger (I = 3190; N = 18,771) Older (I = 1990; N = 13,158)
-0.2098 *** 0.0729 *** -0.0116 0.0714 *** -0.2251 *** 0.0600 *** 0.0328 -0.0697 *
(0.0155) (0.0112) (0.0226) (0.0174) (0.0165) (0.0148) (0.0266) (0.0282)
Less Educated (I = 2090; N = 12,883) More Educated (I = 3090; N = 19,046)
-0.2010 *** 0.0772 *** -0.0185 0.0083 -0.2249 *** 0.0643 *** 0.0057 0.0394 *
(0.0179) (0.0157) (0.0187) (0.0250) (0.0132) (0.0102) (0.0205) (0.0176)
Her Results: Do you do your fair share around the house?
Residuals Predicted Residuals Predicted
His Her His Her His Her His Her
Non-Immigrant (I = 3436; N = 21,714) Immigrant (I = 1744; N = 10,215)
0.1264 *** -0.1366 *** 0.0363 * -0.2633 *** 0.1104 *** -0.1407 *** 0.0587 * -0.2272 ***
(0.0128) (0.0120) (0.0178) (0.0175) (0.0161) (0.0159) (0.0283) (0.0291)
Younger (I = 3190; N = 18,771) Older (I = 1990; N = 13,158)
0.1314 *** -0.1459 *** -0.0246 -0.2412 *** 0.1011 *** -0.1225 *** 0.1665 *** -0.2324 ***
(0.0137) (0.0109) (0.0247) (0.0199) (0.0171) (0.0158) (0.0293) (0.0270)
Less Educated (I = 2090; N = 12,883) More Educated (I = 3090; N = 19,046)
0.1292 *** -0.1439 *** 0.0312 -0.2438 *** 0.1146 *** -0.1329 *** 0.0548 ** -0.2524 ***
(0.0171) (0.0173) (0.0206) (0.0221) (0.0141) (0.0112) (0.0198) (0.0184)

35
I = the number of couples. N = the number of observations.
The covariates include year and state dummies, state/urbanicity interactions, and all the covariates reported in Table 1.
Standard errors in parentheses.
Asterisks indicate significance using a 2-tailed test: *** 0.5%, ** 1%, * 5%.
36
Table 7
Satisfaction as a Function of Housework Time
OLS HW & FE Satisfaction: Heterogeneity Check
Residuals Predicted Residuals Predicted
His Results His Her His Her His Her His Her
Non-Immigrant (I = 3436; N = 21,714) Immigrant (I = 1744; N = 10,215)
Satisfaction with the Division of Housework Time (a)
-0.0015 0.0050 -0.0419 -0.0107 -0.0127 -0.0047 -0.0577 -0.0103
(0.0111) (0.0121) (0.0242) (0.0171) (0.0216) (0.0182) (0.0321) (0.0270)
Satisfaction with Relationship with Partner
-0.0194 0.0172 -0.1343 *** -0.0719 *** -0.0094 0.0237 -0.1995 *** -0.0975 ***
(0.0119) (0.0120) (0.0227) (0.0227) (0.0166) (0.0188) (0.0359) (0.0331)
Satisfaction with Life
0.0041 0.0146 -0.1624 *** -0.0094 -0.0089 0.0059 -0.0913 *** 0.0196
(0.0128) (0.0115) (0.0201) (0.0176) (0.0164) (0.0195) (0.0279) (0.0249)
Younger (I = 3190; N = 18,771) Older (I = 1990; N = 13,158)
Satisfaction with the Division of Housework Time (b)
-0.0124 0.0037 -0.0448 -0.0050 0.0099 -0.0033 -0.0313 -0.0307
(0.0133) (0.0125) (0.0309) (0.0199) (0.0164) (0.0167) (0.0311) (0.0322)
Satisfaction with Relationship with Partner
-0.0162 0.0374 ** -0.2184 *** -0.0828 *** -0.0149 -0.0104 -0.0713 * 0.0570
(0.0115) (0.0144) (0.0365) (0.0255) (0.0135) (0.0141) (0.0281) (0.0353)
Satisfaction with Life
-0.0088 0.0198 -0.2134 *** 0.0245 0.0135 -0.0022 -0.0556 * -0.0033
(0.0119) (0.0141) (0.0272) (0.0200) (0.0169) (0.0144) (0.0261) (0.0255)
Less Educated (I = 2090; N = 12,883) More Educated (I = 3090; N = 19,046)

37
Satisfaction with the Division of Housework Time (c)
-0.0055 -0.0032 -0.0475 0.0521 -0.0045 0.0042 -0.0419 -0.0333
(0.0165) (0.0156) (0.0278) (0.0266) (0.0136) (0.0120) (0.0226) (0.0201)
Satisfaction with Relationship with Partner
0.0002 0.0261 -0.1313 *** 0.0711 ** -0.0265 * 0.0135 -0.1724 *** -0.1409 ***
(0.0159) (0.0155) (0.0286) (0.0273) (0.0117) (0.0128) (0.0257) (0.0233)
Satisfaction with Life
-0.0051 0.0120 -0.1301 *** 0.0327 0.0032 0.0101 -0.1176 *** -0.0244
(0.0146) (0.0150) (0.0241) (0.0253) (0.0144) (0.0121) (0.0214) (0.0188)
Residuals Predicted Residuals Predicted
Her Results His Her His Her His Her His Her
Non-Immigrant (I = 3436; N = 21,714) Immigrant (I = 1744; N = 10,215)
Satisfaction with the Division of Housework Time (a)
0.0564 *** -0.0423 *** -0.0526 * -0.0973 *** 0.0796 *** -0.0485 *** -0.0318 -0.0673 *
(0.0138) (0.0125) (0.0213) (0.0211) (0.0223) (0.0172) (0.0422) (0.0341)
Satisfaction with Relationship with Partner
-0.0016 -0.0035 -0.1773 *** -0.1047 *** -0.0185 -0.0122 -0.2126 *** -0.0625
(0.0109) (0.0110) (0.0257) (0.0239) (0.0165) (0.0172) (0.0378) (0.0352)
Satisfaction with Life
-0.0300 * 0.0221 -0.1414 *** -0.0404 * -0.0276 0.0134 -0.1244 *** 0.0209
(0.0125) (0.0121) (0.0232) (0.0171) (0.0165) (0.0184) (0.0295) (0.0259)
Younger (I = 3190; N = 18,771) Older (I = 1990; N = 13,158)
Satisfaction with the Division of Housework Time (b)
0.0637 *** -0.0497 *** -0.0642 * -0.0911 *** 0.0628 *** -0.0330 * -0.0012 -0.0655
(0.0148) (0.0127) (0.0295) (0.0210) (0.0189) (0.0166) (0.0351) (0.0388)
Satisfaction with Relationship with Partner

38
-0.0119 -0.0029 -0.2430 *** -0.1277 *** 0.0019 -0.0090 -0.0665 * 0.1271 ***
(0.0115) (0.0128) (0.0397) (0.0248) (0.0151) (0.0154) (0.0310) (0.0344)
Satisfaction with Life
-0.0317 * 0.0245 -0.1808 *** -0.0199 -0.0246 0.0115 -0.1006 *** -0.0035
(0.0126) (0.0131) (0.0305) (0.0184) (0.0155) (0.0140) (0.0261) (0.0291)
Less Educated (I = 2090; N = 12,883) More Educated (I = 3090; N = 19,046)
Satisfaction with the Division of Housework Time (c)
0.0817 *** -0.0313 -0.0713 * -0.0308 0.0511 *** -0.0537 *** -0.0185 -0.1141 ***
(0.0187) (0.0171) (0.0322) (0.0296) (0.0136) (0.0134) (0.0245) (0.0225)
Satisfaction with Relationship with Partner
0.0117 0.0046 -0.1314 *** 0.0548 -0.0203 -0.0152 -0.2067 *** -0.1575 ***
(0.0159) (0.0144) (0.0291) (0.0297) (0.0117) (0.0126) (0.0275) (0.0235)
Satisfaction with Life
-0.0224 0.0297 * -0.1459 *** 0.0212 -0.0342 ** 0.0072 -0.1251 *** -0.0353 *
(0.0153) (0.0145) (0.0256) (0.0260) (0.0122) (0.0137) (0.0247) (0.0165)
I = the number of couples. N = the number of observations.
(a) For the Non-Immigrant sample, I = 2866 and N = 15,385. For the Immigrant sample, I = 1374 and N = 6,937.
(b) For the Younger sample, I = 2826 and N = 14,437. For the Older sample, I = 1414 and N = 7,885.
(c) For the Less Educated sample, I = 1587 and N = 8,354. For the More Educated sample, I = 2653 and N = 13,968.
The covariates include year and state dummies, state/urbanicity interactions, and all the covariates reported in Table 1.
Standard errors in parentheses.
Asterisks indicate significance using a 2-tailed test against a null of zero: *** 0.5%, ** 1%, * 5%.

39
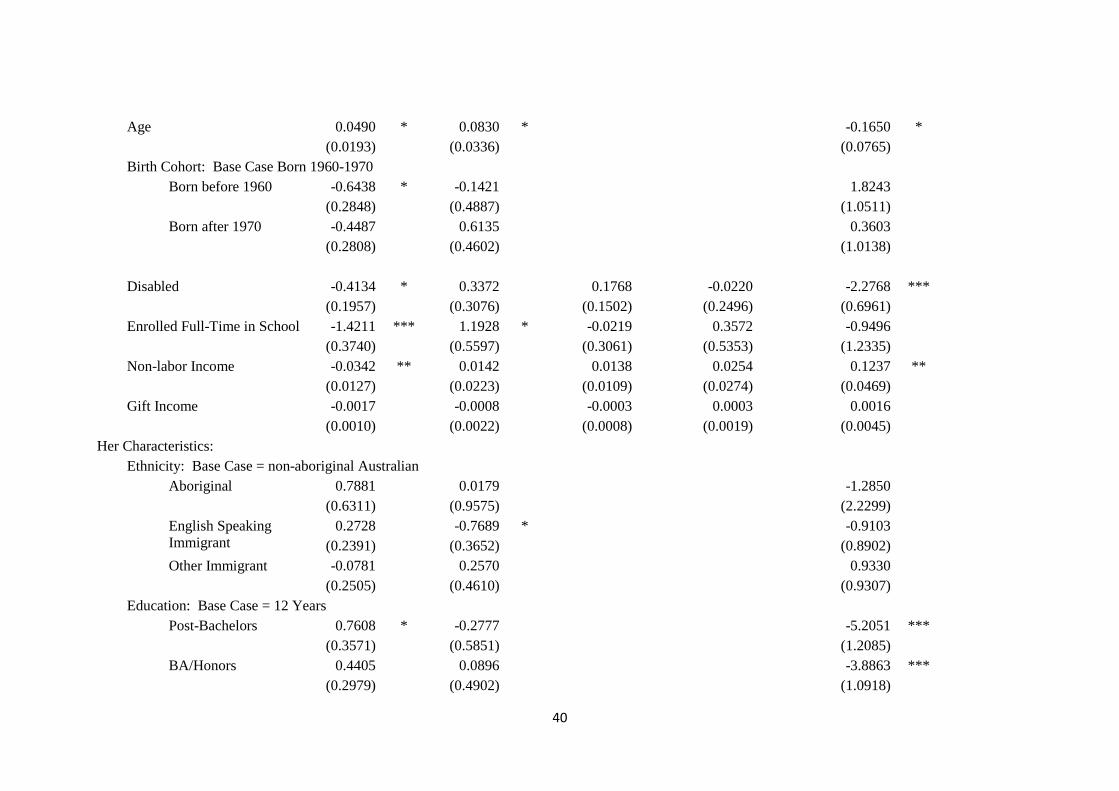
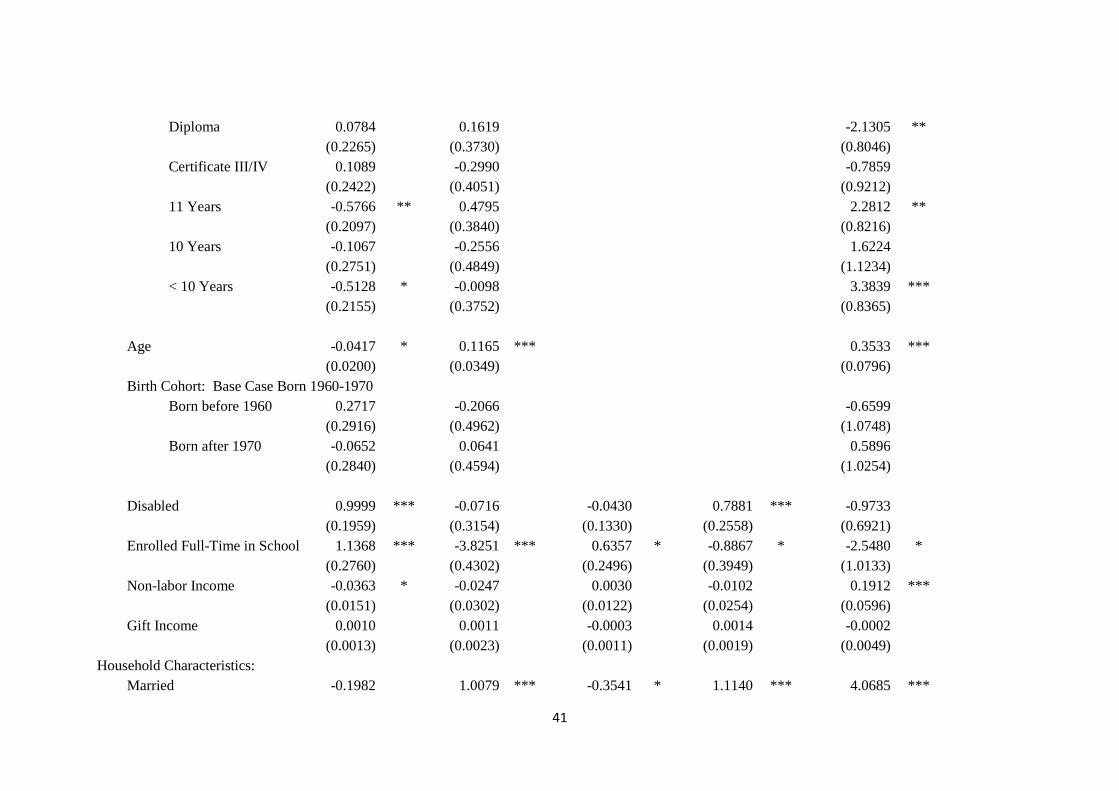
Appendix A
Alternative First Stage Models
OLS with Employment measures FE Estimates OLS Model of
Her Housework
Share By Men
By Women
By Men
By Women
His Characteristics:
Ethnicity: Base Case = non-aboriginal Australian
Aboriginal 0.7758 -1.1534 -5.7480 *
(0.5697) (1.1188) (2.3422)
English Speaking
Immigrant
0.2574 -0.3962 -2.4263 ***
(0.1964) (0.3610) (0.8146)
Other Immigrant -0.0973 0.9667 * 1.5620
(0.2504) (0.4745) (0.9376)
Education: Base Case = 12 Years
Post-Bachelors 0.1828 0.1625 0.0138
(0.2865) (0.5460) (1.0430)
BA/Honors 0.0617 -0.5658 -0.7320
(0.2843) (0.4793) (1.0233)
Diploma 0.1768 -0.4232 -1.1854
(0.2148) (0.3731) (0.7564)
Certificate III/IV -0.3166 -0.4867 -0.7749
(0.2228) (0.4207) (0.8862)
11 Years -0.3228 -0.5027 -1.2096
(0.2330) (0.3743) (0.8260)
10 Years -0.2009 0.0473 0.5528
(0.3251) (0.5462) (1.2263)
< 10 Years -0.6363 *** -0.2878 0.8775
(0.2141) (0.3751) (0.8195)
40
Age 0.0490 * 0.0830 * -0.1650 *
(0.0193) (0.0336) (0.0765)
Birth Cohort: Base Case Born 1960-1970
Born before 1960 -0.6438 * -0.1421 1.8243
(0.2848) (0.4887) (1.0511)
Born after 1970 -0.4487 0.6135 0.3603
(0.2808) (0.4602) (1.0138)
Disabled -0.4134 * 0.3372 0.1768 -0.0220 -2.2768 ***
(0.1957) (0.3076) (0.1502) (0.2496) (0.6961)
Enrolled Full-Time in School
-1.4211 *** 1.1928 * -0.0219 0.3572 -0.9496
(0.3740) (0.5597) (0.3061) (0.5353) (1.2335)
Non-labor Income -0.0342 ** 0.0142 0.0138 0.0254 0.1237 **
(0.0127) (0.0223) (0.0109) (0.0274) (0.0469)
Gift Income -0.0017 -0.0008 -0.0003 0.0003 0.0016
(0.0010) (0.0022) (0.0008) (0.0019) (0.0045) Her Characteristics:
Ethnicity: Base Case = non-aboriginal Australian
Aboriginal 0.7881 0.0179 -1.2850
(0.6311) (0.9575) (2.2299)
English Speaking
Immigrant
0.2728 -0.7689 * -0.9103
(0.2391) (0.3652) (0.8902)
Other Immigrant -0.0781 0.2570 0.9330
(0.2505) (0.4610) (0.9307)
Education: Base Case = 12 Years
Post-Bachelors 0.7608 * -0.2777 -5.2051 ***
(0.3571) (0.5851) (1.2085)
BA/Honors 0.4405 0.0896 -3.8863 ***
(0.2979) (0.4902) (1.0918)
41
Diploma 0.0784 0.1619 -2.1305 **
(0.2265) (0.3730) (0.8046)
Certificate III/IV 0.1089 -0.2990 -0.7859
(0.2422) (0.4051) (0.9212)
11 Years -0.5766 ** 0.4795 2.2812 **
(0.2097) (0.3840) (0.8216)
10 Years -0.1067 -0.2556 1.6224
(0.2751) (0.4849) (1.1234)
< 10 Years -0.5128 * -0.0098 3.3839 ***
(0.2155) (0.3752) (0.8365)
Age -0.0417 * 0.1165 *** 0.3533 ***
(0.0200) (0.0349) (0.0796)
Birth Cohort: Base Case Born 1960-1970
Born before 1960 0.2717 -0.2066 -0.6599
(0.2916) (0.4962) (1.0748)
Born after 1970 -0.0652 0.0641 0.5896
(0.2840) (0.4594) (1.0254)
Disabled 0.9999 *** -0.0716 -0.0430 0.7881 *** -0.9733
(0.1959) (0.3154) (0.1330) (0.2558) (0.6921)
Enrolled Full-Time in School
1.1368 *** -3.8251 *** 0.6357 * -0.8867 * -2.5480 *
(0.2760) (0.4302) (0.2496) (0.3949) (1.0133)
Non-labor Income -0.0363 * -0.0247 0.0030 -0.0102 0.1912 ***
(0.0151) (0.0302) (0.0122) (0.0254) (0.0596)
Gift Income 0.0010 0.0011 -0.0003 0.0014 -0.0002
(0.0013) (0.0023) (0.0011) (0.0019) (0.0049) Household Characteristics:
Married -0.1982 1.0079 *** -0.3541 * 1.1140 *** 4.0685 ***

42
(0.1469) (0.2417) (0.1630) (0.2772) (0.5749)
# of Children Age 0-4 1.0429 *** 3.1376 *** 0.3219 *** 5.0233 *** 4.9702 ***
(0.0902) (0.1715) (0.0765) (0.1737) (0.2976)
# of Children Age 5-9 0.7351 *** 2.4899 *** 0.3229 *** 3.0615 *** 2.4622 ***
(0.0869) (0.1568) (0.0885) (0.1677) (0.2986)
# of Children Age 10-14 0.5427 *** 1.8685 *** 0.2210 ** 2.2530 *** 1.6397 ***
(0.0833) (0.1539) (0.0817) (0.1627) (0.3046)
# of Other Dependents 0.2014 * 1.2462 *** 0.1320 1.2486 *** 1.8352 ***
(0.0968) (0.1741) (0.0862) (0.1645) (0.3642)
# of Other Adults 0.0608 0.9329 *** -0.0379 0.7302 *** 0.4237
(0.1149) (0.2309) (0.0935) (0.1896) (0.4595)
Have a Disabled Child 0.3120 -0.0734 -0.1128 -0.1002 -0.3388
(0.2212) (0.4067) (0.1659) (0.3510) (0.7665)
Have another Disabled
Resident
0.2438 -0.0218 0.0698 0.5814 0.0064
(0.2418) (0.4710) (0.1908) (0.3530) (0.9538)
Urbanicity: Base Case Rural
Lives in a Major City 0.4724 -0.6736 -0.0139 -1.6627 -4.3368 ***
(0.3118) (0.5672) (0.4594) (0.9653) (1.2412)
Lives in another Urban
Area
0.9293 * 0.7474 0.4954 0.8676 -3.6496 **
(0.3664) (0.6465) (0.4202) (0.9150) (1.4021)
Housing: Base Case Apartment
Lives in a House 0.0586 0.9424 *** 0.0863 0.0529 3.0750 ***
(0.1823) (0.2892) (0.1774) (0.3058) (0.7520)
Lives in a Townhouse 0.0654 0.2723 0.0386 -0.4404 0.9570
(0.2279) (0.3681) (0.2330) (0.3481) (0.9309)
Moved in last year 0.0103 -0.5616 *** -0.0217 -0.0821 -1.1422 ***
(0.1053) (0.1776) (0.0839) (0.1531) (0.3934) Characteristics of His Employment
His Hours Paid Work -0.0613 *** 0.0684 ***
(0.0051) (0.0101)

43
He is not employed 1.5221 *** 0.0447
(0.4135) (0.7506)
He works part-time 0.3452 0.5436
(0.2653) (0.4402)
His Occupation (base case: Professional)
Managers -0.1969 0.0723
(0.1590) (0.2902)
Technical -0.2292 0.1743
(0.1960) (0.3393)
Personal Service 0.3878 -0.0167
(0.3032) (0.4890)
Clerical 0.1706 -0.5645
(0.2239) (0.3640)
Sales 0.1487 0.3172
(0.2618) (0.5074)
Operators -0.0448 -0.2219
(0.2514) (0.4280)
Laborers -0.0141 -0.4655
(0.2413) (0.4464)
His Industry (base case: Unknown)
Agric., Forestry, & Fishing -0.2682 0.7290
(0.3989) (0.7047)
Mining & Construction -0.2203 0.5408
(0.2626) (0.5464)
Nondurable Manufacturing -0.1804 1.2006
(0.3040) (0.6622)
Durable Manufacturing -0.0342 0.0779
(0.2693) (0.5583)
Trade -0.1281 -0.1134
(0.2655) (0.5477)

44
Transport, Tele. & Utilities -0.0542 0.3873
(0.2887) (0.5625)
Finance, Insu., Real Estate -0.0819 0.4143
(0.3287) (0.6419)
Business Services -0.2097 0.4450
(0.2670) (0.5403)
Public Admin (inc. defense) 0.1534 0.7382
(0.3093) (0.5949)
Education -0.4105 0.1755
(0.3344) (0.6608)
Health 0.0420 0.0750
(0.3826) (0.6808)
Service (inc. restaurants &
hotels)
0.5577 -0.0981
(0.3410) (0.6318)
Characteristics of Her Employment
Her Hours Paid Work 0.0636 *** -0.1500 ***
(0.0075) (0.0117)
She is not employed 0.4228 3.2280 ***
(0.4194) (0.7061)
She works part-time 0.1046 1.0032 ***
(0.1908) (0.3087)
Her Occupation (base case: Professional)
Managers -0.2214 0.0737
(0.2071) (0.3083)
Technical & Operators 0.3253 0.7061
(0.2653) (0.4896)
Personal Service -0.0268 0.7644 *
(0.2217) (0.3760)

45
Clerical -0.0781 0.0186
(0.1859) (0.3086)
Sales -0.0960 -0.1877
(0.2523) (0.4450)
Laborers 0.1380 1.3347 **
(0.3446) (0.5116)
Her Industry (base case: Unknown)
Agric., Forestry, & Fishing -0.2417 3.2622 ***
(0.5629) (0.8862)
Mining & Construction -0.1195 1.7049 *
(0.4002) (0.8193)
Nondurable Manufacturing 0.0146 0.1271
(0.4426) (0.6781)
Durable Manufacturing 0.0154 1.5601 *
(0.4897) (0.7863)
Trade 0.1341 1.3223 *
(0.2999) (0.5378)
Transport, Tele. & Utilities 0.2769 0.6970
(0.3836) (0.6488)
Finance, Insu., Real Estate 0.5521 -0.5958
(0.3634) (0.6008)
Business Services 0.3142 0.8512
(0.3032) (0.5174)
Public Admin (inc. defense) 0.5162 0.3434
(0.3553) (0.5909)
Education 0.1365 0.2146
(0.3105) (0.5469)
Health 0.3974 0.0757
(0.2799) (0.5038)

46
Service (inc. restaurants &
hotels)
0.2601 0.0098
(0.3135) (0.5560)
Number of Observations 31,929 31,929 31,929 31,929 31,929 R-Squared 0.1101 0.2594 0.0963 F-Statistic 12.29 38.01 3.94 22.03 16.91 P-Value 0.0000 0.0000 0.0000 0.0000 0.0000
All specifications also include year and state dummies, as well as state/urbanicity interactions.
Standard errors in parentheses, adjusted for 5180 couple clusters.
Asterisks indicate significance using a 2-tailed test against a null of zero: *** 0.5%, ** 1%, * 5%.
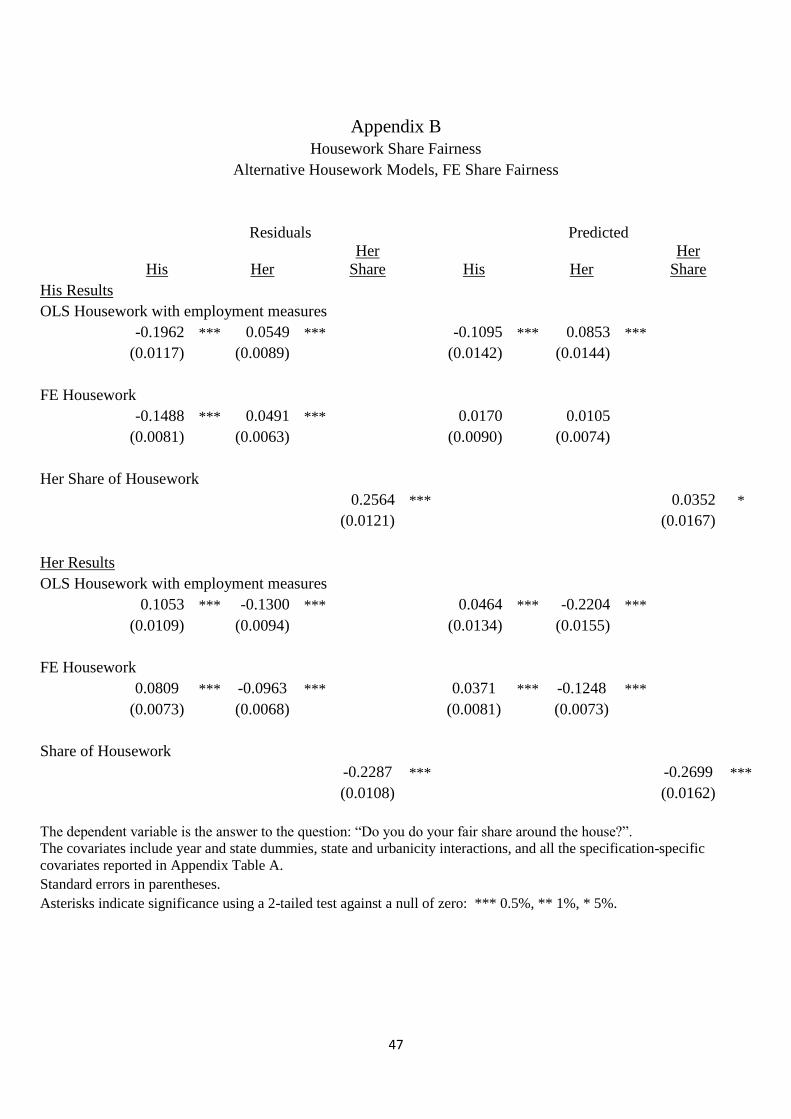
47
Appendix B
Housework Share Fairness
Alternative Housework Models, FE Share Fairness
Residuals Predicted
His Her
Her
Share His Her
Her
Share His Results
OLS Housework with employment measures
-0.1962 *** 0.0549 *** -0.1095 *** 0.0853 ***
(0.0117) (0.0089) (0.0142) (0.0144)
FE Housework
-0.1488 *** 0.0491 *** 0.0170 0.0105
(0.0081) (0.0063) (0.0090) (0.0074)
Her Share of Housework
0.2564 *** 0.0352 *
(0.0121) (0.0167)
Her Results
OLS Housework with employment measures
0.1053 *** -0.1300 *** 0.0464 *** -0.2204 ***
(0.0109) (0.0094) (0.0134) (0.0155)
FE Housework
0.0809 *** -0.0963 *** 0.0371 *** -0.1248 ***
(0.0073) (0.0068) (0.0081) (0.0073)
Share of Housework
-0.2287 *** -0.2699 ***
(0.0108) (0.0162)
The dependent variable is the answer to the question: “Do you do your fair share around the house?”.
The covariates include year and state dummies, state and urbanicity interactions, and all the specification-specific
covariates reported in Appendix Table A.
Standard errors in parentheses.
Asterisks indicate significance using a 2-tailed test against a null of zero: *** 0.5%, ** 1%, * 5%.
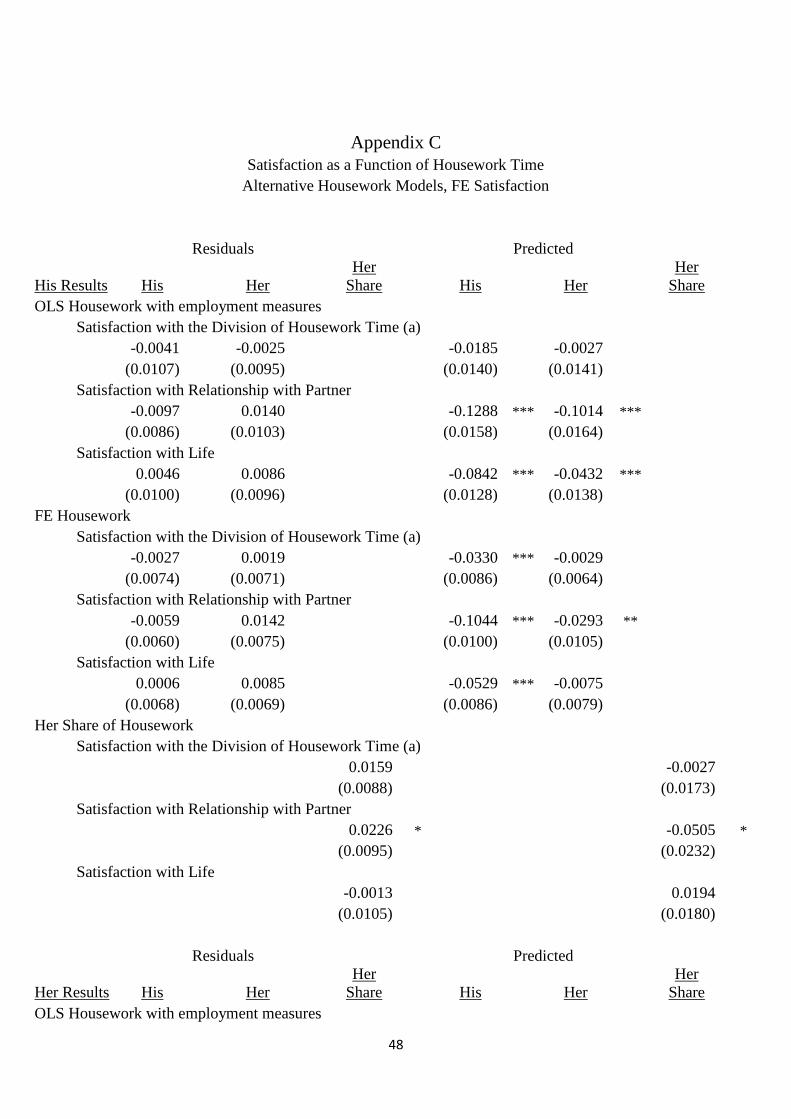
48
Appendix C
Satisfaction as a Function of Housework Time
Alternative Housework Models, FE Satisfaction
Residuals Predicted
His Results His Her
Her
Share His Her
Her
Share OLS Housework with employment measures
Satisfaction with the Division of Housework Time (a)
-0.0041 -0.0025 -0.0185 -0.0027
(0.0107) (0.0095) (0.0140) (0.0141)
Satisfaction with Relationship with Partner
-0.0097 0.0140 -0.1288 *** -0.1014 ***
(0.0086) (0.0103) (0.0158) (0.0164)
Satisfaction with Life
0.0046 0.0086 -0.0842 *** -0.0432 ***
(0.0100) (0.0096) (0.0128) (0.0138)
FE Housework
Satisfaction with the Division of Housework Time (a)
-0.0027 0.0019 -0.0330 *** -0.0029
(0.0074) (0.0071) (0.0086) (0.0064)
Satisfaction with Relationship with Partner
-0.0059 0.0142 -0.1044 *** -0.0293 **
(0.0060) (0.0075) (0.0100) (0.0105)
Satisfaction with Life
0.0006 0.0085 -0.0529 *** -0.0075
(0.0068) (0.0069) (0.0086) (0.0079)
Her Share of Housework
Satisfaction with the Division of Housework Time (a)
0.0159 -0.0027
(0.0088) (0.0173)
Satisfaction with Relationship with Partner
0.0226 * -0.0505 *
(0.0095) (0.0232)
Satisfaction with Life
-0.0013 0.0194
(0.0105) (0.0180)
Residuals Predicted
Her Results His Her
Her
Share His Her
Her
Share
OLS Housework with employment measures

49
Satisfaction with the Division of Housework Time (a)
0.0624 *** -0.0535 *** -0.0155 -0.0517
(0.0110) (0.0095) (0.0144) (0.0156)
Satisfaction with Relationship with Partner
0.0040 -0.0140 -0.1666 *** -0.1224 ***
(0.0088) (0.0088) (0.0157) (0.0181)
Satisfaction with Life
-0.0164 * 0.0042 -0.1272 *** -0.0176
(0.0093) (0.0089) (0.0146) (0.0131)
FE Housework
Satisfaction with the Division of Housework Time (a)
0.0009 -0.0034 -0.1203 *** -0.0384 ***
(0.0077) (0.0069) (0.0129) (0.0086)
Satisfaction with Relationship with Partner
-0.0189 *** 0.0120 -0.0577 *** -0.0090
(0.0061) (0.0063) (0.0112) (0.0121)
Satisfaction with Life
-0.0157 * 0.0099 -0.1249 *** -0.0025
(0.0067) (0.0066) (0.0086) (0.0064)
Her Share of Housework
Satisfaction with the Division of Housework Time (a)
-0.0940 *** -0.0831 ***
(0.0132) (0.0179)
Satisfaction with Relationship with Partner
-0.0087 -0.0650 *
(0.0108) (0.0260)
Satisfaction with Life
0.0374 *** 0.0155
(0.0100) (0.0163)
(a) Based on a sample of 22,322 observations and 4240 couples. All other estimates are based on a sample of 31,929
observations and 5180 couples.
The covariates include year and state dummies, state and urbanicity interactions, and all the specification-specific
covariates reported in Appendix Table A.
Standard errors in parentheses.
Asterisks indicate significance using a 2-tailed test against a null of zero: *** 0.5%, ** 1%, * 5%.

50
Appendix D
Models of Residual Housework
as a function of past changes in Fairness and Satisfaction
Model
Change in
His
Residual
Housework
Change in
Her
Residual
Housework
Change in His Sense of the Fairness of His 0.2553 *** -0.2365
Housework Share between t-1 and t-2 (0.0750) (0.1324)
Change in Her Sense of the Fairness of Her -0.1479 * 0.2907 *
Housework Share between t-1 and t-2 (0.0630) (0.1249)
Change in His Satisfaction with the Division of 0.0307 -0.0213
Housework Time between t-1 and t-2 (0.0327) (0.0616)
Change in Her Satisfaction with the Division of -0.0574 0.0153
Housework Time between t-1 and t-2 (0.0318) (0.0590)
Change in His Satisfaction with Partner 0.0362 0.0265
between t-1 and t-2 (0.0346) (0.0713)
Change in Her Satisfaction with Partner -0.0151 0.0718
between t-1 and t-2 (0.0314) (0.0666)
Change in His Satisfaction with Life 0.0558 0.0626
between t-1 and t-2 (0.0474) (0.0871)
Change in Her Satisfaction with Life 0.0701 0.1011
between t-1 and t-2 (0.0455) (0.0874)
All models also contain an intercept. Asterisks indicate significance using a 2-tailed test against a null of zero: *** 0.5%, ** 1%, * 5%.