Ditch Retrofit
18
Ditch Retrofit 1. Description Roadside ditch management (RDM) retrofits are stormwater best management practices (BMPs) that are used to store, treat, and infiltrate runoff by creating ponding and replacing existing ditch soil with more permeable material. The RDM retrofits in this guidance include specifications that are less stringent than traditional retrofits such as bioretention because of the limited site constraints that ditches pose. For practices that are offline or do not meet the parameters in this guide, traditional retrofits should be considered [1]. RDM retrofit practices include converting existing ditches to one of the types outlined in Table 1. TABLE 1: DESCRIPTION OF RDM RETROFITS Retrofit Description Sand Layer Swale [2] Existing ditch soil is replaced with a layer of sand, a layer of topsoil, and vegetated on the top. Dry Swale [3] Existing ditch soil is replaced with filter media, which is a mixture of sand, soil, and organic material, and vegetated on the top. Wet Swale [4] Linear wetland cells that intercept shallow groundwater to maintain a wetland plant community. Performance Enhancing Devices (PEDs) can be added to any of these practices to improve performance. PEDs include incorporating biochar, water treatment residuals, and other media enhancements to the normal media of the retrofits. 2. Retrofit Feasibility, Site Selection, Practice Selection 2.1. Retrofit Feasibility Depending on site characteristics, retrofits practices may be applied. Key constraints of ditch retrofits include: Existing Ditch Stability • The velocity of water from the drainage area should not exceed the permissible velocity for channels lined with vegetation cover. It is recommended that the velocity of flow from a 1-inch rainfall not exceed 3 feet per second. This is to prevent the ditch from eroding, which can cause the treatment to fail. If the existing ditch vegetation can currently handle most rainfall events, the ditch is likely stable. The contributing drainage area should be stable without any actively eroding soils or bare patches (have 95% groundcover/forest cover). In cases such as agricultural areas where this may not be possible, erosion and sediment controls or pretreatment must be used to minimize the amount of sediment entering the practice. If the existing ditch is eroding and it is suspected that the velocity of the incoming water is too high, either install inlet protection such as riprap, or select an alternative site. Instructions to calculate velocity can be
Transcript of Ditch Retrofit

Ditch Retrofit
1. Description
Roadside ditch management (RDM) retrofits are stormwater best management practices (BMPs) that
are used to store, treat, and infiltrate runoff by creating ponding and replacing existing ditch soil with
more permeable material. The RDM retrofits in this guidance include specifications that are less
stringent than traditional retrofits such as bioretention because of the limited site constraints that
ditches pose. For practices that are offline or do not meet the parameters in this guide, traditional
retrofits should be considered [1]. RDM retrofit practices include converting existing ditches to one of
the types outlined in Table 1.
TABLE 1: DESCRIPTION OF RDM RETROFITS
Retrofit Description
Sand Layer Swale [2] Existing ditch soil is replaced with a layer of sand, a layer of topsoil, and vegetated on the top.
Dry Swale [3] Existing ditch soil is replaced with filter media, which is a mixture of sand, soil, and organic material, and vegetated on the top.
Wet Swale [4] Linear wetland cells that intercept shallow groundwater to maintain a wetland plant community.
Performance Enhancing Devices (PEDs) can be added to any of these practices to improve performance.
PEDs include incorporating biochar, water treatment residuals, and other media enhancements to the
normal media of the retrofits.
2. Retrofit Feasibility, Site Selection, Practice Selection
2.1. Retrofit Feasibility
Depending on site characteristics, retrofits practices may be applied. Key constraints of ditch retrofits
include:
Existing Ditch Stability
• The velocity of water from the drainage area should not exceed the permissible velocity for
channels lined with vegetation cover. It is recommended that the velocity of flow from a 1-inch
rainfall not exceed 3 feet per second. This is to prevent the ditch from eroding, which can cause
the treatment to fail. If the existing ditch vegetation can currently handle most rainfall events,
the ditch is likely stable. The contributing drainage area should be stable without any actively
eroding soils or bare patches (have 95% groundcover/forest cover). In cases such as agricultural
areas where this may not be possible, erosion and sediment controls or pretreatment must be
used to minimize the amount of sediment entering the practice. If the existing ditch is eroding
and it is suspected that the velocity of the incoming water is too high, either install inlet
protection such as riprap, or select an alternative site. Instructions to calculate velocity can be

found in the VA DEQ Stormwater Design Specification No 3. Grass Channel, page 11 (Manning’s
Equation) [5].
Available Space
• Practices should have a trapezoidal or parabolic bottom of at least 2 feet, with side slopes 3:1 or flatter on the road side and side slopes 2:1 or flatter on the opposing side.
Longitudinal Slope.
• Ditch retrofits are limited to longitudinal slopes of less than 4%, unless check dams are used.
Slopes steeper than 4% create rapid runoff velocities that can cause erosion and do not allow
enough contact time for infiltration or filtering, unless check dams are used.
• Longitudinal slopes of less than 2% are ideal and may eliminate the need for check dams.
However, channels designed with longitudinal slopes of less than 1% should be monitored
carefully during construction to ensure a continuous grade, to avoid flat areas with pockets of
standing water [5]. Additionally, ensure that the inlet and outlet grade will allow for positive flow
in and out of the practice.
Utilities
• For all roadside ditch projects, utilities are a concern. Designers should call the local utility locate
services to mark the lines and consult local utility design guidance for the required horizontal
and vertical clearance between utilities and the channels. Typically, utilities can cross grass
channels if they are specially protected (e.g., double-casing) or are located below the channel
invert.
2.2. Site Selection
The follow are characteristics of an ideal potential retrofit site:
• Limited underground utilities and/or
can be avoid.
• Limited overhead utilities that can
interfere with construction equipment
and require utility pole setbacks.
• Less than 2% longitudinal slope.
• Wide right of way.
• Ditch bottom and excavation depth
accessible outside of ditch.
• 3:1 side slopes or flatter.
• Stable upslope conditions.
• Currently eroding ditches. (If the cause
of the erosion is unknown or will not be
remediated, it should not be chosen as
a retrofit site).
• Sites that currently require frequent
maintenance if the issue can be
resolved through a retrofit. (If it
problem is unknown or will not be
remediated, it should not be chosen as
a retrofit site).
• Areas that receive low amounts of
sediment.
• Adding check dams would not
significantly impact the hydraulic
capacity of the ditch (will not cause
flooding).
2.3. Retrofit Type Selection

Below is a decision chart to help narrow down the type of retrofit best suited for a site. Ditch retrofits
are not limited to the practices mentioned in this guide; traditional retrofits can also be used, but
typically have more stringent requirements. The specifications for traditional BMPs can be found at the
end of this guidance.

FIGURE 1: DITCH RETROFIT DECISION CHART
Some other parameters to consider include those listed in Table 2.
TABLE 2: SITE PARAMETERS
Parameter Dry Swale Wet Swale Sand Layer
Maintenance Low- mowing Medium- high variety
of plants Low- mowing
Vegetation Grasses/Perennials Wetland plants (taller) Grasses
Cost Medium Low Medium
Potential for long term standing water
Low High Low
Soils
• Dry swales and sand layers perform best if they are constructed in permeable soils, such as Hydrologic Soil Group (HSG) A and B. Wet swales work best in less permeable Hydrologic Soil Group (HSG) C or D soils or if the water table is high. If soils have low permeability, it is best to install a wet swale, install an underdrain (see Dry Swale specification [3]), or find an alternative site. Soil information can be found on the NRCS Web Soil Survey or an infiltration test can be
Determine water table level.
Is it at least 2’ from the
surface of the ditch?
Yes No
Is the soil type A or B?
Likely poor soils or
intercepts groundwater-
Wet Swale
Or
see traditional dry swale
specifications [3]
Yes No
Is the ditch always wet
(even after cleaning)?
Intercepts
Groundwater-
Wet Swale
Dry Swale or Sand Bottom
(Bottom of soil media or sand
has to be 1’ away from water)
table)
Yes No
Poor soils-
Wet Swale
Or
see traditional dry swale
specifications [3]

performed (Appendix 8-A of Stormwater Design Specification No. 8 Infiltration [6]). If the existing ditch currently holds water for and extended amount of time, even after cleaning, it is likely to be a less permeable soil (C or D), and therefore a wet swale should be chosen.
Depth to Water Table
• The location of a dry swale or sand layer should be in a ditch where the water table is a
minimum of 1 foot below the bottom of the practice. If the water table is high, a wet swale
should be considered. If the depth to water table is uncertain, a small well can be dug to
estimate the water level. Using an auger, dig a 4-foot-deep hole in the ditch. If the hole fills in
with soil, a PVC pipe can be inserted to maintain the structure of the hole. After 24 hours,
determine if there is water in the well and if the
bottom of the practice will be at least 1 foot from the
water surface.
3. Design Parameters and Construction Sequence
Ditch retrofits require a few design elements to properly construct. Design details for construction of
this type of project include a map showing start and end points of ditch retrofit, cross section of the
retrofit (include side slope, depth of media, type of media, width of ditch, and ponding depth), number
and location of check dams, longitudinal slope, and flow direction. Simple designs (aerial photos with
hand drawn designs, notes, GIS, etc.) may be allowed if they provide the required information. Table 3
contains design parameters for ditch retrofits.
FIGURE 3: PVC MONITORING WELL FIGURE 2: MONITORING HOLE DUG VIA
AUGER

TABLE 3: DESIGN PARAMETERS
Parameter Specification
Side Slope 3:1 or flatter on road side, 2:1 or flatter on non-road side
Inlet and outlet protection Provide riprap apron at all inlets and outlets
Longitudinal Slope Less than 4%, or use check dams
Width of Bottom of Ditch Minimum 2 feet
Media Depth Dry Swale: 12-24” of filter media Sand Layer Swale: 12-24” of sand below 8” topsoil layer Wet Swale: N/A
Media Specification
Dry Swale Filter Media: 85-88% sand, 8-12% soil fines, 3-5% organic matter in form of leaf compost; USDA soil types loamy sand, sandy loam, or loam Sand Layer: Clean AASHTO-M-6 or ASTM-C-33 concrete sand
Erosion Control Matting For higher velocity and steep slopes, erosion control matting may be necessary to protect the soils and seeds
Ponding Depth The maximum ponding depth in a ditch should not exceed 12 inches at the most downstream point
Vegetation
Dry Swale and Sand Layer Swale: Include vegetation that can withstand both wet and dry periods as well as relatively high velocity flows within the channel. Salt tolerant grass species and denser grasses are preferable. Grass species should have the following characteristics: A deep root system to resist scouring; a high stem density with well-branched top growth; water-tolerance; resistance to being flattened by runoff; and an ability to recover growth following inundation. Bermudagrass, Kentucky bluegrass, reed canary grass, tall fescue, grass-legume mixture, red fescue (See VA DCR Stormwater Design Specification No.3 Grass Channel [5] and No.10 Dry Swales [3] or local grass channel/dry swale design guidelines). Wet Swale: Choose grass and wetland plant species that can withstand both wet and dry periods as well as relatively high velocity flows within the channel. Salt tolerant grass species and denser grasses are preferable (See VA VEQ Stormwater Design Specification No 13 Constructed Wetland [7] for vegetation selection or local stormwater guidance).
Check Dam
Check dams must be used for retrofits, unless an alternative method for ponding is included in the design. See VA DEQ Stormwater Design Specification No.10 Dry Swales, Section 6.3 for spacing (typically 50-200 feet apart).
Performance Enhancing Devices
Incorporate 10% by volume of the PED. See the Performance Enhancing Devices Final Report for more information [6].

3.1. Design Examples
Table 3 illustrates cross section examples of the different types of retrofit practices.
TABLE 4: DESIGN EXAMPLES
Dry Swale
Sand Layer
Wet Swale

Check Dams
[5]
[7]
3.2. Construction Sequence
Provide erosion and sediment controls according to the local
requirements. Some examples include straw wattles or filter
sock around the outlet of the retrofit.
The following is a typical construction sequence to properly
install a retrofit, although the steps may be modified to adapt
to different site conditions.
1. Installation should only begin after there is no active
erosion upslope. Additional E&S controls may be
needed during construction, particularly to divert
stormwater from the retrofit until the filter bed and
side slopes are fully stabilized.
2. (Optional) If the side slopes and width of the ditch do
not meet the parameters described in this guidance, it is best to reshape the ditch first and
allow it to stabilize before excavating for media replacement. Flatter side slopes and a wider
bottom are more stable and less prone to disturbance from equipment during excavation.
Unstable side slopes can lead to clogging of the soil media, decreasing the lifespan of the
retrofit.
3. Excavators or backhoes should work from the sides to excavate the retrofit area to the
appropriate design depth and dimensions. Excavating equipment should have buckets with
adequate reach so they do not have to sit inside the footprint of the retrofit area. If the full
length of the retrofit cannot be finished within one day, work in sections (ex. 50’ in length) that
can be completed and stabilized with matting at the end of each day.
FIGURE 4: FILTER SOCK AT THE END OF A
RETROFIT

4. (Dry swale, sand layer) The bottom of the retrofit should be ripped, roto-tilled, or otherwise
scarified to depth of at least 6 inches to promote greater infiltration.
5. (Dry swale, sand layer) Obtain filter media or sand that meets the specifications and apply in 12-
inch lifts until the desired top elevation is achieved.
6. (Sand layer only) Add 8 inches of top soil on top of the sand layer to reach the desired top
elevation. This top soil layer is to support plant grow in the ditch.
7. (Optional) To incorporate PEDs:
a. Wet Swale: Till the bottom of the ditch to a depth of 1 foot and incorporate
amendments according to the PED Section.
b. Sand Layer: Incorporate amendments according to the PED Section in the sand and top
soil layer
c. Dry Swale: Incorporate amendments according to the PED Section in the filter media
8. Install check dams, inlet and outlet protection,
culverts, and other features. Fill material used
to construct check dams should be placed in
8- to 12-inch lifts and compacted to prevent
settlement.
9. Prepare planting bed for specified vegetation,
install erosion control matting, and spread
seed (Figure 5).
10. Inspect the ditch after a significant rain event
to ensure that the practice is stable. Also
inspect the ditch to make sure the vegetation
is established and survives during the first
growing season following construction.
3.3. Construction Inspection
Inspections during and immediately after construction are needed to ensure that the retrofit is built in
accordance with the standard designs and parameters. Use a detailed inspection checklist that requires
sign-offs by qualified individuals at critical stages of construction to ensure that the contractor’s or
roadcrew’s interpretations of the plan are consistent with standard practice requirements. A
construction inspection checklist should include:
• Check the filter media or sand media to confirm that it meets specifications and is installed to
the correct depth.
• Check elevations such as inverts for the inflow and outflow points, elevation of the various
layers, and the ponding depth provided between the surface of the filter bed and the check
dams.
• Verify the proper coverage and depth vegetation or soil matting has been achieved following
construction, both on the filter bed and the side-slopes.
• Inspect the check dams to verify that they are properly installed, stabilized, and working
effectively.
FIGURE 5: INLET PROTECTION AND EROSION CONTROL
MATTING (CURLEX®)

• Check that outfall protection/energy dissipation measures at concentrated inflow and outflow
points are stable.
The project should also be inspected after the first significant rain event. The post-storm inspection
should focus on whether the desired flow is occurring, and the project objectives are still being met.
Also, inspectors should check that the retrofit drains completely within a 72-hour drawdown period
(except wet swales). Minor adjustments are normally needed as a result of this post-storm inspection
(e.g. spot reseeding, gully repair, added armoring at inlets or outfalls, and check dam realignment).
Procedures for Acceptance
Project acceptance is a visual inspection that takes place after the first major rain event after the
construction phase is over to make sure it is still working and meeting its project objectives. If so, the
practice is accepted by the local stormwater management authority. Post-construction acceptance
should also include an as-built drawings or sketch showing:
• Start and end of the ditch retrofit project
• Type of retrofit
• Depth and type of replaced media
• Dimensions of new ditch
• Number of check dams and ponding depth
The local approval authority should keep detailed inspection reports describing any needed
maintenance. If any issues are found, identify a timeframe for repair and conduct a subsequent
inspection to ensure completion of repairs.
A written inspection report is part of every inspection and should include:
• The date of inspection;
• Name of inspector;
• The condition of: o Side slopes o Main bed o Ponding elevation o Check dams o Inlet and outlets o Soil permeability o Vegetation o Any other item that could affect the proper function of the stormwater management
system
• Description of needed maintenance
4. Sediment and Nutrient Crediting Protocol 4.1. Credit Calculations
The Bay Program provides retrofit performance curves to calculate sediment and nutrient credit for
traditional retrofits. Retrofits are classified as either stormwater treatment (ST) or runoff reduction (RR),
and depending on the classification, different curves are used.

To determine the runoff volume treated by a retrofit practice, the volume of water held in the practice
and the impervious area treated is required. The standard equation used to determine the amount of
runoff volume (inches) treated at the site is:
Where:
RS = Runoff Storage Volume (cubic feet)
IA = Impervious Area (square feet)
The runoff storage volume includes the water stored in ponding and in the soil media layers. The
simplest estimate of the storage volume is:
The simplest way to estimate the impervious area draining to the retrofit is to use the area of the road
draining parallel to the ditch (length of road x distance from crown to edge of road).
Table 5 shows the type of retrofit, which adjustor curve to use, and also what is included in the runoff
storage volume.
TABLE 5: RETROFIT, CLASSIFICATION AND HOW TO CALCULATE STORAGE VOLUME
Retrofit Adjustor Curve Runoff Storage Volume
Sand Layer ST Ponding + Media Storage
Dry Swale RR Ponding + Media Storage
Wet Swale ST Ponding Only
To use the retrofit curves, take the runoff depth captured per impervious acre value and find where it
intersects either the RR or ST curve. The y-axis value will be the removal rate. Nitrogen, phosphorus and
sediment each have their own graphs. Retrofit curve equations are provided in Table 6 below for ease of
use. Enter the runoff depth captured per impervious acre as the x value and the output, y, is the
removal rate for the corresponding pollutant.
TABLE 6: RETROFIT CURVE EQUATIONS
TN RR y = 0.0308x5 - 0.2562x4 + 0.8634x3 - 1.5285x2 + 1.501x - 0.013
ST y = 0.0152x5 - 0.131x4 + 0.4581x3 - 0.8418x2 + 0.8536x - 0.0046
TP RR y = 0.0304x5 - 0.2619x4 + 0.9161x3 - 1.6837x2 + 1.7072x - 0.0091
ST y = 0.0239x5 - 0.2058x4 + 0.7198x3 - 1.3229x2 + 1.3414x - 0.0072
TSS RR y = 0.0326x5 - 0.2806x4 + 0.9816x3 - 1.8039x2 + 1.8292x - 0.0098
ST y = 0.0304x5 - 0.2619x4 + 0.9161x3 - 1.6837x2 + 1.7072x - 0.0091
Runoff Depth Captured per Impervious Acre (inches) = 𝑅𝑆ሺ12ሻ
𝐼𝐴
Depth of filter media x length of ditch x width of ditch x 0.25 (porosity of filter media)
+
Depth of ponding x length of ditch x width of ditch
Once the removal rate is determined, the total load reduced can be calculated:
If there is more than one type of land use loading rate, a composite number should be used.
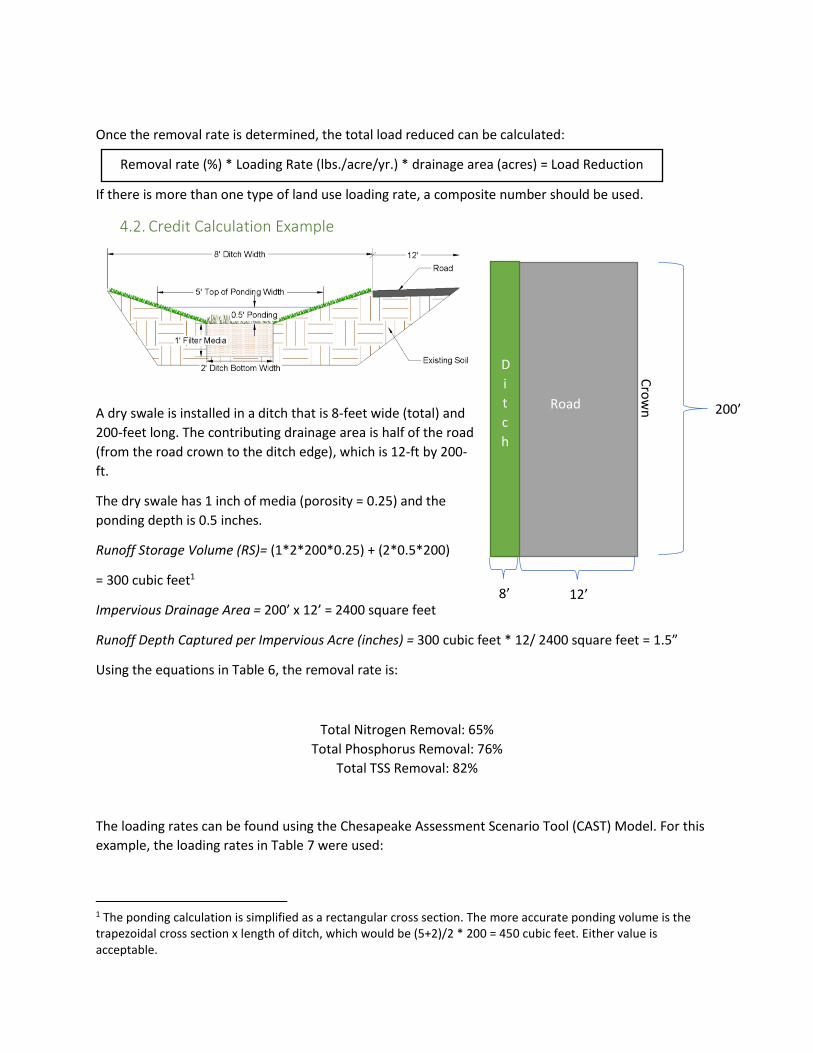
4.2. Credit Calculation Example
A dry swale is installed in a ditch that is 8-feet wide (total) and
200-feet long. The contributing drainage area is half of the road
(from the road crown to the ditch edge), which is 12-ft by 200-
ft.
The dry swale has 1 inch of media (porosity = 0.25) and the
ponding depth is 0.5 inches.
Runoff Storage Volume (RS)= (1*2*200*0.25) + (2*0.5*200)
= 300 cubic feet1
Impervious Drainage Area = 200’ x 12’ = 2400 square feet
Runoff Depth Captured per Impervious Acre (inches) = 300 cubic feet * 12/ 2400 square feet = 1.5”
Using the equations in Table 6, the removal rate is:
Total Nitrogen Removal: 65%
Total Phosphorus Removal: 76%
Total TSS Removal: 82%
The loading rates can be found using the Chesapeake Assessment Scenario Tool (CAST) Model. For this
example, the loading rates in Table 7 were used:
1 The ponding calculation is simplified as a rectangular cross section. The more accurate ponding volume is the trapezoidal cross section x length of ditch, which would be (5+2)/2 * 200 = 450 cubic feet. Either value is acceptable.
200’ Road
D
i
t
c
h
8’ 12’
Cro
wn
Removal rate (%) * Loading Rate (lbs./acre/yr.) * drainage area (acres) = Load Reduction
(lb/yr)

TABLE 7: LOADING RATE FROM “FINAL MODEL DOCUMENTATION FOR THE MIDPOINT ASSESSMENT-
5/11/2018” DOCUMENT
With the drainage area of 2,400 square feet (0.055 acres), the load reductions are shown in Table 8
below:
TABLE 8: LOAD REDUCTION CALCULATIONS
Nutrient Removal Rate
from RR Curves Loading Rate from Table
6 (lbs./acre/yr.) Load Reduction (lbs./yr.)
Nitrogen 65% 22.45 65%*22.45*0.055=0.8
Phosphorus 76% 0.83 76%*0.83*0.055= 0.04
TSS 82% 2980 82%*2980*0.055= 134
4.3. Performance Enhancing Devices (PEDs) For retrofits that include performance enhancing devices, 10% is added to the retrofit curve removal
rates for ST and RR practices for phosphorus and RR practices for nitrogen.
Using the previous dry swale example, Table 9 shows the load reductions if the filter media was
amended with 10% biochar, the removal rates would be:
TABLE 9: LOAD REDUCTION CALCULATIONS WITH PEDS
Pollutant No Biochar With Biochar Load Reduction (lbs./yr.)
Nitrogen 67% 67%+(10%*67%)=73.7% 0.91
Phosphorus 78% 78%+(10%*78%)=85.8% 0.04
TSS 84% 84% 138
Note that the 10% additional removal rate is applied both to phosphorus and nitrogen because a dry
swale is an RR practice. If the practice was an ST practice (i.e. sand layer), it would only receive the extra
10% load reduction for phosphorus [6].
Land Use N (lb./acre/yr.) P (lb./acre/yr.) TSS (ton/acre/yr.)
Developed Non-regulated Road 22.45 0.83 1.49
5. Maintenance and Visual Indicators
Routine maintenance checkups occur annually as part of regular maintenance visits and are used to
immediately correct minor maintenance problems. The checkups are also used to provide quality
control on maintenance activities and to determine whether the road crew needs to schedule a follow
up visit to repair moderate maintenance problems.
TABLE 10: DEFINING NUMERIC TRIGGERS TO CLASSIFY DITCH RETROFIT MAINTENANCE CONDITIONS
INDICATOR Pass Minor Moderate Severe
1
Inle
t, s
ide
slo
pe,
bed
, an
d o
utl
et e
rosi
on
None Some rill erosion Erosion of 6" or less (or side slope 25% steeper than design)
Erosion of more than 6"(or side slope 50% steeper or more)
Severe side slope erosion (almost vertical banks)
2
Inle
t a
nd
ou
tlet
Ob
stru
ctio
n
Free of sediment and debris
Less than 1” of sediment potentially blocking inlet/outlet
1-3” of sediment blocking the inlet/outlet
3” or more of blockage preventing most storms from getting into/out of ditch
Severe inlet obstruction- 3” or more inches of blockage (riprap too high)

INDICATOR Pass Minor Moderate Severe
3
Veg
eta
tio
n C
ove
r >90% cover 75-90% cover 50-75% cover Less than 50% cover
Severe vegetation cover condition on side slopes
4
Veg
eta
tive
Ma
inte
na
nce
Well maintained, few weeds
Isolated areas need re-seeding or weeding
Needs major mowing and weed eradication
Needs major mowing or shrub/tree removal or replanting
Major vegetation maintenance- shrub removal
5
Ch
eck
Da
ms
Good Condition
Minor sediment deposits, or down-gradient erosion
Some sediment deposits or down-gradient erosion
Problems are so severe that structure function is compromised

INDICATOR Pass Minor Moderate Severe
Minor check dam maintenance- small amount of leaves accumulating behind check dam
6
Sed
imen
t D
epo
siti
on
None A few isolated caking areas
Deposits up to 3" deep
Deposits more than 3" deep
Minor sediment deposition
Major sediment deposition- Deposits up to 3”

INDICATOR Pass Minor Moderate Severe
7
Po
nd
ing
Dep
th
Entire ponding depth matches design
10% difference from design
25% difference from design
>50% difference from design
Minor ponding depth maintenance- less than 10% from design (need to know design
ponding depth to determine rating)
6. Verification Procedures
Performance verification inspections occur if the BMP is being used to achieve pollutant reductions
needed to meet load allocations under a local and/or Bay-wide TMDL. This rapid inspection is done in
conjunction with the local regulatory inspection to verify that the BMP still exists, is adequately
maintained and is operating as designed. Verification inspections will typically occur once every other
MS4 permit cycle (or about every 5 to 10 years). The inspection should include comparing the approved
plans with the as-builts and field assessments.
Performance verification uses a subset of the list of visual indicators that assess the hydrologic function
and pollutant removal capability of the ditch by answering three simple questions:
1. Does it still physically exist. i.e. can you find it and are the conditions and cover in the
contributing drainage area still the same?
2. Is it still operating to treat and reduce runoff as it was originally designed?
3. Is the maintenance condition sufficient to still support its pollutant reduction functions?
Table 10 provides specific visual indicators that are used to answer the questions above. A “severe”
maintenance problem detected for one or more of these indicators, means that the facility fails and will
lose pollutant removal credits unless it is brought back into compliance (bioretention illustrated).

TABLE 10: PERFORMANCE VERIFICATION INDICATORS (BIORETENTION ILLUSTRATED)
Condition Type Visual Indicators Description
Hydrologic Condition
Severe inlet obstruction Runoff is not able to get into ditch.
Loss of surface ponding capacity Runoff is not fully being treated.
Severe erosion at outlet Runoff is bypassing treatment.
Standing water for an extended period of time (only dry swale or sand bottom)
Runoff is not fully being treated.
Maintenance Condition Inadequate vegetative cover Runoff is not fully being treated.
Severe inlet, bed, or side slope erosion
Sediment delivery to filter bed.
References
[1] CSN, "Stormwater BMPs," [Online]. Available: https://chesapeakestormwater.net/training-
library/stormwater-bmps/.
[2] VA DEQ, "Viriginia DEQ Stormwater Design Specification No. 12 Filtering Practices," 1 3 2011. [Online].
Available:
https://www.vwrrc.vt.edu/swc/NonPBMPSpecsMarch11/DCR%20BMP%20Spec%20No%2012_FILTERING%
20PRACTICES_Final%20Draft_v1-8_03012011.pdf.
[3] VA DCR, "Virginia DCR Stormwater Design Specification No. 10 Dry Swales," 1 3 2011. [Online]. Available:
http://chesapeakestormwater.net/wp-content/uploads/downloads/2012/02/DCR-BMP-Spec-No-10_DRY-
SWALE_Final-Draft_v1-9_03012011.pdf.
[4] Virginia DCR, "Viriginia DCR Stormwater Design Specification No. 11 Wet Swale," 1 3 2011. [Online].
Available: http://chesapeakestormwater.net/wp-content/uploads/downloads/2012/02/DCR-BMP-Spec-
No-11_WET-SWALE-_Final-Draft_v1-9_03012011.pdf.
[5] Viriginia DEQ, "Virginia DEQ Stormwater Design Specification No. 3 Grass Channels," 1 3 2011. [Online].
Available: https://www.swbmp.vwrrc.vt.edu/wp-content/uploads/2017/11/BMP-Spec-No-3_GRASS-
CHANNELS_v1-9_03012011.pdf.
[6] B. Seipp, T. Schueler and D. Hirschman, "Final Report- Performance Enhancing Devices for Stormwater Best
Management Practices," 24 4 2017. [Online]. Available: http://chesapeakestormwater.net/wp-
content/uploads/dlm_uploads/2017/05/APRIL-26-FINAL-PED-DOCUMENT.pdf.
[7] MDE, "Details from the 2011 Maryland Standards and Specifications for Soil Erosion and Sediment Control-
Stone Check Dam," 2011. [Online]. Available:
http://www.mde.state.md.us/programs/water/StormwaterManagementProgram/Pages/2011_ESC_detail
s.aspx.