DISUSSIN PAP SISftp.iza.org/dp10962.pdf · · 2017-08-30DISUSSIN PAP SIS IZA DP No. 10962...
30
DISCUSSION PAPER SERIES IZA DP No. 10962 Younghwan Song The Effect of Job Displacement on Subjective Well-being AUGUST 2017
-
Upload
trinhthuan -
Category
Documents
-
view
213 -
download
0
Transcript of DISUSSIN PAP SISftp.iza.org/dp10962.pdf · · 2017-08-30DISUSSIN PAP SIS IZA DP No. 10962...
DISCUSSION PAPER SERIES
IZA DP No. 10962
Younghwan Song
The Effect of Job Displacement on Subjective Well-being
AUGUST 2017

Any opinions expressed in this paper are those of the author(s) and not those of IZA. Research published in this series may include views on policy, but IZA takes no institutional policy positions. The IZA research network is committed to the IZA Guiding Principles of Research Integrity.The IZA Institute of Labor Economics is an independent economic research institute that conducts research in labor economics and offers evidence-based policy advice on labor market issues. Supported by the Deutsche Post Foundation, IZA runs the world’s largest network of economists, whose research aims to provide answers to the global labor market challenges of our time. Our key objective is to build bridges between academic research, policymakers and society.IZA Discussion Papers often represent preliminary work and are circulated to encourage discussion. Citation of such a paper should account for its provisional character. A revised version may be available directly from the author.
Schaumburg-Lippe-Straße 5–953113 Bonn, Germany
Phone: +49-228-3894-0Email: [email protected] www.iza.org
IZA – Institute of Labor Economics
DISCUSSION PAPER SERIES
IZA DP No. 10962
The Effect of Job Displacement on Subjective Well-being
AUGUST 2017
Younghwan SongUnion College and IZA

ABSTRACT
IZA DP No. 10962 AUGUST 2017
The Effect of Job Displacement on Subjective Well-being*
Using matched data drawn from the 2010 and 2012 Displaced Workers Supplements
of the Current Population Surveys and the 2010, 2012, and 2013 American Time Use
Survey Well-Being Modules, this paper examines the effect of job displacement on various
measures of subjective well-being. The results indicate that the effect of job displacement
on subjective well-being varies by sex and by measure of subjective well-being: among men
job displacement does not affect moment-to-moment subjective well-being but lowers
their life evaluation through changes in employment, marital status, and earnings, whereas
among women job displacement decreases net affect, mostly by decreasing happiness and
increasing pain, sadness, and stress, but does not affect their life evaluation. Among men,
those displaced by layoffs, not by plant closings, express lower levels of the Cantril ladder
than those not displaced but there is no such difference by cause of displacement among
women. The negative effects of job displacement on subjective well-being decrease over
time for both men and women.
JEL Classification: I31, J63, J65
Keywords: job displacement, subjective well-being, Cantril ladder, net affect
Corresponding author:Younghwan SongDepartment of EconomicsUnion College807 Union StreetSchenectady, NY 12308USA
E-mail: [email protected]
* I would like to thank Philip Cohen and seminar participants at the International Association for Time-use Research
Conference in Ankara, Turkey; the Time Use across the Life Course Conference at University of Maryland; and A World
to Win Conference at Erasmus University, Rotterdam, the Netherlands for their valuable comments. All remaining
errors are mine.

2
1. Introduction
It is well established that displaced workers—individuals who lost their jobs involuntarily due to
plant closings or mass layoffs—incur significant economic costs: long-term earnings losses and
job instability (Jacobson, LaLonde, and Sullivan 1993; Stevens 1997). A growing literature
shows that involuntary job losers also experience additional non-economic consequences: higher
rates of divorce (Charles and Stephens 2004; Doiron and Mendolina 2012; Eliason 2012), worse
health in general, including self-rated health, mental health and depression (Black, Devereux,
and Salvanes 2015; Brand et al. 2008; Gallo et al. 2000; Bungard et al. 2007; Gallo, Bradley et
al. 2006; Gallo, Teng et al. 2006; Schaller and Stevens 2015; Strully 2009), and higher mortality
rates, in particular from suicides (Browning and Heinesen 2012; Eliason and Storrie 2009; Keefe
et al. 2002; Noelke and Beckfield 2014; Sullivan and von Wachter 2009). Using linked data from
the 2010 and 2012 Displaced Workers Supplements (DWS) to the Current Population Surveys
(CPS) and the 2010, 2012, and 2013 American Time Use Survey Well-Being (ATUS WB)
Modules, this paper provides first empirical evidence on the effect of job displacement on
subjective well-being of workers in the United States. Various measures of affective subjective
well-being, such as U-index, net affect, meaningfulness, happiness, pain, sadness, and stress—as
well as a standard life evaluation question using the Cantril ladder and self-rated health status are
analyzed in this paper. The U-index, net affect, happiness, pain, sadness, and stress all measure
the presence of pleasure and the absence of displeasure, which corresponds to affective (or
hedonistic) views of subjective wellbeing, while meaningfulness and the Cantril ladder measure
a cognitive state or a positive attitude towards one’s life, which corresponds to cognitive (or
attitudinal) views of subjective wellbeing (Angner, 2010; Brülde, 2007).
The relationship between unemployment and subjective well-being has been investigated
before: both Knabe et al. (2010) and Krueger and Mueller (2012) find that the unemployed feel
3
sadder when engaged in similar activities than the employed. Knabe et al. (2010) also find that
unemployed people are less satisfied with their life than the employed but duration-weighted
average subjective well-being is not different between the two groups because the unemployed
are using the time the employed are at work in more enjoyable ways. However, the focus of this
paper is not current employment status, but the incidence of job displacement in the prior a few
years. In particular, this paper investigates if job displacement affects subjective well-being
beyond the experience of unemployment, loss of earnings, and changes in marital status.
The existing literature on job displacement also documents that the effect of job
displacement varies by cause of displacement and by gender. For example, Gibbons and Katz
(1991) show that male workers displaced by layoffs receive lower post-displacement wages,
incur larger earnings losses, and have longer unemployment spells than those displaced by plant
closings. According to Gibbons and Katz, it is because when firms have discretion with respect
to whom to lay off, a layoff event signals that laid-off workers are of low ability.1 In the same
context, Charles and Stephens (2004) show that the increase in divorce is found only for men
who were laid off, within three years of job displacement, but not for men displaced by plant
closings. Finally, Brand et al. (2008) find that among older workers, men have significant
increases in depression as a result of layoffs, but not as a result of plant closings, while the
reverse is the case among women. So this paper also examines how the effect of displacement on
subjective well-being varies by cause of displacement and by gender. This separate analysis by
gender also allows taking into consideration of the findings in the psychology literature that
women show more positive and negative emotions than men (Chaplin and Aldao 2013; Fujita,
Diener, and Sandvik 1991; Mestre, Samper, Frias, and Tur 2009).
1 For a review of alternative explanations for larger earnings losses for worker displaced by layoffs than those displaced by plant closings, see Song (2007).

4
It is important to note that the estimated effects of job displacement on various measures
of subjective well-being reported in this paper are likely to be rather conservative. First, because
there could be a gap between two to twenty months between the DWS and the ATUS WB
Modules, it is possible that some of the nondisplaced workers in the DWS could have
experienced displacement by the time they interviewed for the ATUS WB Modules but are still
categorized as the nondisplaced in the analysis. In that case, the differences in subjective well-
being between the displaced and the nondisplaced are likely to be underestimated. Second,
through hedonic adaptation (Brickman and Campbell 1971), displaced workers might have
returned to a relatively stable level of subjective well-being overtime. Then the estimated effects
of job displacement are likely to have a downward bias.
The remainder of the paper is organized as follows. In Section 2, I describe the data and
the econometric model. Section 3 presents the empirical results and discusses the findings.
Finally, Section 4 provides concluding remarks.
2. Data and Methodology
This study uses matched data drawn from the DWS to the 2010 and 2012 January CPS and the
2010, 2012, and 2013 ATUS WB Modules. Details of the matching of the sample of displaced
and nondisplaced respondents from the DWS and the ATUS WB Modules are reported in the
appendix. The DWS has been conducted biennially since 1984 and is a key source of national
level data on worker displacement in the United States. The 2010 and 2012 DWS asked
individuals at least 20 years of age if they have lost or left a job in the prior three years because
of a plant closing, slack work, a position or shift abolished, or other reasons.2 From the workers
2 Other reasons include seasonal job completed, self-operated business failed, and some other reason. Such cases are counted as nondisplaced workers in the sample.
5
who answered affirmatively, detailed information was collected about the predisplacement job
and the year of displacement. Following the literature on worker displacement, those displaced
because of slack work or a position or shift abolished are classified as layoffs (Gibbons and Katz
1991). Following Farber (1993, 1997, 2011), I have also treated nondisplaced workers employed
as of the survey date from the 2010 and 2012 DWS as the reference group—the relevant pool of
workers who were at risk of losing a job during the time-period of the prior three years. The
displaced workers from the 2010 and 2012 DWS involuntarily lost their jobs over the years from
2007 through 2011, when job loss rates jumped up during the Great Recession (Farber 2011).
The ATUS WB Module is a module added to the American Time Use Survey (ATUS), a
time-diary study conducted continuously since 2003 by the U.S. Census Bureau, based on a
nationally representative sample of the U.S. population 15 years of age or older. Through
telephone interviewing, the ATUS collects a detailed account of respondents’ activities on a 24-
hour, preassigned day of the week (the diary day). The diary days of the ATUS include all days
in a year, except Thanksgiving Day and Christmas Day.
In the 2010, 2012 and 2013 ATUS WB Modules, the survey randomly selected three
activities reported by each respondent of the ATUS and for each selected activity asked five
affect questions (happiness, pain, sadness, stress, and tiredness) and one question about how
meaningful the activity was. For each of these questions, respondents were asked to respond
using a scale from 0 to 6, where a 0 would mean he/she did not experience the feeling at all and a
6 would mean the feeling was very strong. In addition, the 2012 and 2013 ATUS WB Modules
also have a standard life-evaluation question using the Cantril ladder (Cantril 1965). It first asked
respondents to imagine a ladder where ten steps increasingly numbered from 0 to 10 to the top,
with the bottom of the ladder representing the worst possible life for them while the top of the

6
ladder representing the best possible life for them. After being given this, respondents were
asked on which step of the ladder they personally feel they stand at this time. The 2010, 2012
and 2013 ATUS WB Modules also contain four general health questions: self-rated general
health status (excellent, very good, good, fair, and poor); whether the respondent was ever
diagnosed with hypertension by a doctor in the last five years; whether the respondent took any
pain medication on the diary day; and how well rested the respondent felt on the diary day.
Using the responses available in the 2010, 2012 and 2013 ATUS WB Modules, I have
constructed two composite measures of individual-level subjective well-being: the U-index and
net affect. Following Kahneman and Krueger (2006) and Krueger, Kahneman, Schkade,
Schwarz, and Stone (2009), I classified an episode as unpleasant if the highest rating on any of
the three negative affect dimensions (pain, sadness, and stress) is strictly greater than the rating
of the positive affect dimension (happines). Then the U-index for a respondent i, 𝑈𝑈𝑖𝑖, is
constructed as the weighted average of these classifications over the episodes from the
respondent as follows
𝑈𝑈𝑖𝑖 = ∑ 𝑤𝑤𝑖𝑖𝑖𝑖𝑈𝑈𝑖𝑖𝑖𝑖𝑖𝑖∑ 𝑤𝑤𝑖𝑖𝑖𝑖𝑖𝑖
(1)
where i denotes the respondent, k denotes the sampled activity, 𝑈𝑈𝑖𝑖𝑖𝑖 denotes an indicator variable
for an episode k being unpleasant for the respondent i, and 𝑤𝑤𝑖𝑖𝑖𝑖denotes the WB Module adjusted
pooled activity weight (WUFNACTWTCP) attached to activity k for respondent i. The WB
Module adjusted pooled activity weights account for both i) differences between activities in the
fraction of time spent in eligible activities and ii) differences between persons in the probability

7
of having a specific eligible activity selected due to variation in the number of eligible activities.
This U-index is an estimate for the fraction of time the respondent spends in an unpleasant state.
I define net affect for each episode as the difference between the positive emotion
(happiness) and the average of the negative ones (pain, sadness, and stress) for the episode
(Kahneman, Krueger, Schkade, Schwarz, and Stone 2004). Using a formula similar to Equation
1, I defined net affect for each individual as the weighted average of net affect over the activities
from the respondent. I have also constructed meaningfulness for each respondent as the weighted
average of the responses to the question about how meaningful the episode was over the episodes
from the respondent. In the same way, I have constructed happiness, pain, sadness, and stress for
each respondent. And to compare the health outcomes, I also analyze self-rated general health
status. For a subsample from the 2012 and 2013 ATUS WB Modules, I use the responses to the
Cantril ladder as another measure of subjective well-being. After excluding the episodes with
missing responses, there are 6,051 respondents (2,942 men and 3,109 women) who are 20 years
of age or older in the final sample and 560 of them (301 men and 259 women), 9.25 percent, are
displaced workers.3
Using each of the measures of subjective well-being as the dependent variable, I first
estimated Ordinary Least Squares (OLS) regressions by gender. In the baseline model, I control
for the following respondents’ characteristics: age and its square; three dummies for
race/ethnicity; five education dummies; number of disabilities4; an immigrant dummy; number
3 Because the question on the Cantril ladder was not included in the 2010 ATUS WB Module, the sample size is smaller for the Cantril ladder: 178 displaced workers and 1,591 nondisplaced workers among men and 148 displaced workers and 1,698 nondisplaced workers among women. 4 Beginning in the 2008 June CPS, the respondents were asked the following six questions on disability: i) whether they have difficulty dressing or bathing; ii) whether they are deaf or have serious difficulty hearing; iii) whether they are blind or have serious difficulty seeing even when wearing glasses; iv) whether they have difficulty doing errands alone such as visiting a doctor's office or shopping because of a physical, mental, or emotional condition; v) whether they have serious difficulty walking or climbing stairs; and vi) whether they have serious difficulty concentrating, remembering, or making decisions because of a physical, mental, or emotional condition. Since the ATUS sample is
8
of children; an SMSA dummy; two season dummies; a holiday dummy; six dummies for the
days of the week; year dummies; dummies for the DWS year; and state dummies. When the
responses to the Cantril ladder or self-rated health status are used as the dependent variable, to
account for the ordered nature of the responses, I used Ordered Probit regressions, controlling for
the same set of independent variables, except a holiday dummy, and six dummies for the days of
the week. Then, in another set of analyses, I additionally included time-varying independent
variables that are likely to have been affected by the incident of job displacement: two marital-
status dummies; two employment-status dummies; and four dummies for family income during
the last twelve months as of the last CPS interview date (Charles and Stephens 2004; Doiron and
Mendolina 2012; Eliason 2012; Jacobson, LaLonde, and Sullivan 1993; Stevens 1997). These
additional analyses would sort out whether the effect of job displacement on subjective well-
being is only through the changes of employment status, marital status, and income or through
other mechanisms beyond the changes in employment, marital status and income.
3. Results
Table 1 reports descriptive statistics by sex and displacement status, weighted using the ATUS
WB Module final weight (WUFINLWGT). Among men, those displaced have significantly
lower levels of the Cantril ladder than those nondisplaced, whereas there is no significant
difference in other measures of subjective well-being. In contrast, among women, those
displaced have significantly lower levels of net affect than those nondisplaced because the
displaced are less happy but feel more pain and sadness than the nondisplaced, while there is no
significant difference in the Cantril ladder between the two groups.
drawn from those who participated in the CPS, the responses to these questions are available for all ATUS WB respondents. Freedman et al. (2012) show that regardless of measures of subjective well-being, older married adults with disability reported worse subjective well-being than those without disability.

9
Table 1 also shows that more than two thirds of the displaced workers lost their jobs due
to layoffs, regardless of sex. Except that the nondisplaced are slightly better educated than the
displaced, regardless of sex, the displaced and the nondisplaced are similar in other
characteristics, such as age, race/ethnicity, number of children, and immigrant status.
Corroborating with the findings in Charles and Stephens (2004), Doiron and Mendolina (2012),
and Eliason (2012), the displaced are less likely to be married than the nondisplaced, regardless
of sex, though the difference is not statistically significant. Furthermore, as consistently found in
the literature on displaced workers (Jacobson, LaLonde, and Sullivan 1993; Stevens 1997),
displaced workers are significantly less likely to be employed and more likely to be unemployed
or not in the labor force than the nondisplaced, regardless of sex. Finally, the nondisplaced tend
to have larger family incomes than the displaced, regardless of sex.
Columns 1 through 7 of Table 2 report the coefficients on the job displacement dummy
of OLS estimation and columns 8 and 9 of Table 2 report the marginal effects of job
displacement for the highest ordered category—10 for the Cantril ladder and excellent for self-
rated general health status—in Ordered Probit estimation for men. In Panel A, the results for the
baseline model are reported, Panel B reports the results for the baseline model with the time-
varying independent variables: two marital-status dummies; two employment-status dummies;
and four dummies for family income. The estimation results in Panel A of Table 2 indicate that
there is no significant difference between displaced and nondisplaced men in all measures of
subjective well-being, except that in column 8 the levels of the Cantril ladder are significantly
lower for the displaced than for the nondisplaced. In contrast, when time-varying independent
variables, such as marital status, employment status and family income, are additionally
controlled for in Panel B of Table 2, there is no significant difference even in the Cantril ladder
10
by displacement status, suggesting that the differences in these additional characteristics between
the displaced and the nondisplaced explain the lower life evaluation for displaced workers
observed in Panel A of Table 2.
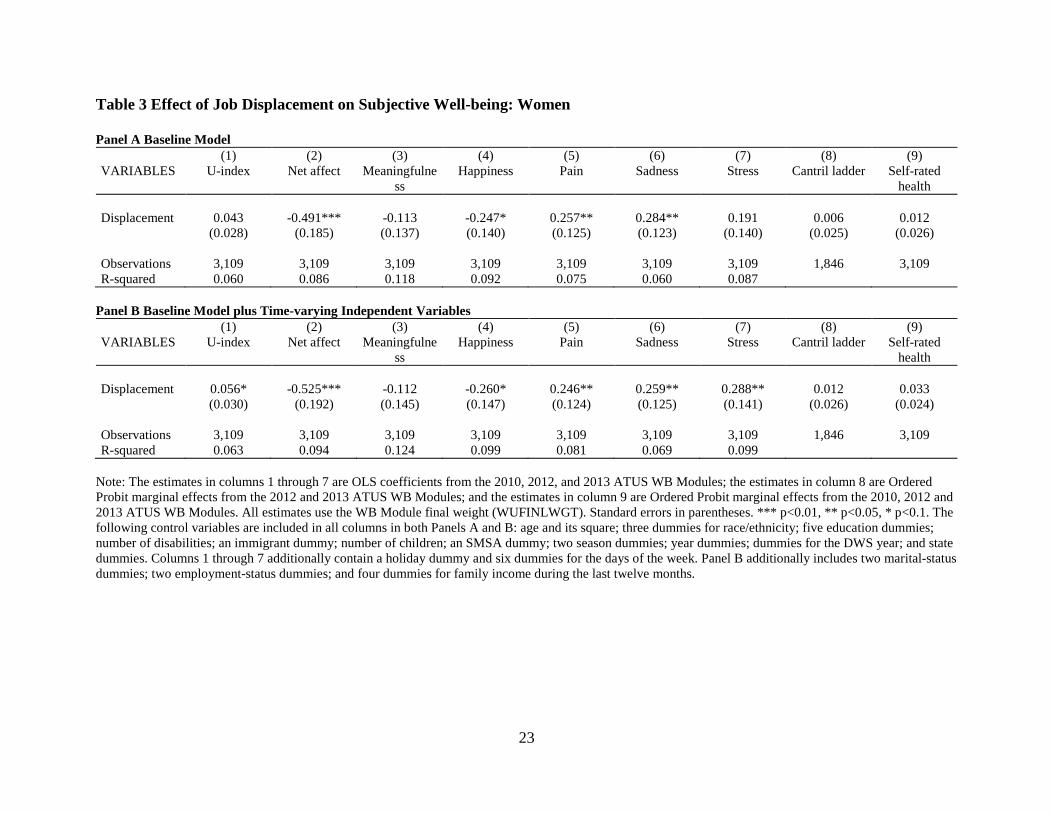
Table 3 shows the results for women: the coefficients on the job displacement dummy of
OLS estimation in columns 1 through 7 and the marginal effects of job displacement for the
highest category of Ordered Probit estimation in columns 8 and 9. The baseline model in Panel A
shows that displaced women have significantly lower levels of net affect than nondisplaced
women, resulting from lower levels of happiness and higher levels of pain and sadness of the
displaced than the nondisplaced, which is similar to the findings in Knabe et al. (2010) and
Krueger and Mueller (2012) that the unemployed feel sadder than the employed. In contrast to
the results for men, the significant difference in net affect between displaced and nondisplaced
women still remains even after controlling for employment status, marital status, and family
income in Panel B of Table 3. Furthermore, unlike the results for men in Table 2, there is no
difference in the Cantril ladder by displacement status among women in column 8 of Table 3,
regardless of the inclusion of the additional control variables.
Overall, these results in Tables 2 and 3 indicate that job displacement affects cognitive
(or attitudinal) measures of subjective well-being, such as the Cantril ladder (Angner 2010;
Brülde 2007), among men through the changes in employment, marriage, and income, whereas it
affects only affective (or hedonistic) measures of subjective well-being among women beyond
the changes in employment, marriage, and income. These findings are also consistent with the
findings that women show more positive and negative emotions than men (Chaplin and Aldao
2013; Fujita, Diener, and Sandvik 1991; Mestre, Samper, Frias, and Tur 2009).

11
Contrary to the findings in Bungard et al. (2007) and Schaller and Stevens (2015), there
is no evidence in column 9 of Tables 2 and 3 that job displacement is associated with poorer self-
reported health, regardless of sex. The difference could be because this paper examines short-
term—at most 4 years—effects of job displacement, whereas both Bungard et al. (2007) and
Schaller and Stevens (2015) examine long-term—15 to 28 years—effects of job displacement on
health.
To examine if the effects of job displacement observed in Tables 2 and 3 vary by cause of
displacement, Tables 4 and 5 report the estimation results for men and women, respectively,
where dummies for layoffs and plant closings are included, instead of the displacement dummy.
The results for men in column 8 of Panel A in Table 4 indicate that those displaced by layoffs
have significantly lower levels of the Cantril ladder than those not displaced but the difference is
not significant between those displaced by plant closings and those not displaced. In column 8 of
Panel B in Table 4, the marginal effect for layoffs becomes insignificant when marital status,
employment status, and family income are additionally controlled for. These results in Table 4
corroborate the findings in Gibbons and Katz (1991) and Charles and Stephens (2004) that plant
closings and layoffs have different impacts on changes in employment, earnings and marital
stability among men. Unexpectedly, those men displaced by plant closings in fact express higher
levels of meaningfulness than those not displaced in column 3 of both Panels A and B in Table 4,
regardless of the inclusion of the additional controls.
The results for women in column 2 of Panels A and B in Table 5 show that the
magnitudes of the negative coefficients on net affect are similar between layoffs and plant
closings, regardless of controlling for the additional time-varying independent variables. These
results for women are different not only from the findings based on men, such as Gibbons and

12
Katz (1991) and Charles and Stephens (2004), but also from the varying effects of layoffs and
plant closings on depression by sex—higher levels of depression among men as a result of
layoffs, but not as a result of plant closings, whereas higher levels of depression among women
as a result of plant closings, but not as a result of layoffs—found by Brand et al. (2008).
One might argue that the variations in subjective well-being by displacement status found
above in this paper could be due to individual heterogeneity or reverse causality. That is, it is not
that job displacement is causing lower levels of subjective well-being but those workers with
lower levels of subjective well-being even before job displacement may be more likely to lose
their jobs involuntarily. This argument seems to be plausible considering the findings in the
literature that unhappy workers are less productive (Oswald, Proto, and Sgroi 2015; Wright and
Cropanzano 2000) and less productive workers are more likely to be laid off (Gibbons and Katz
1991). In order to sort out whether job displacement is causing lower levels of subjective well-
being or it is the other way around, ideally it is necessary to have panel data that spans the
periods before and after displacement. Given the cross-sectional data used in this paper, one at
least needs to have some sort of instrumental variables that are correlated with job displacement
but uncorrelated with the measures of subjective well-being.
Because no valid instruments are available, however, this paper takes a different
approach. In the DWS, displaced workers reported the year of their job loss. Using this
information, I have created three dummies—1˗2 years, 3˗4 years, and missing5—for the number
of years between the year of job displacement and the year of ATUS WB Module interview, in
lieu of the displacement dummy. If displaced workers already had lower levels of subjective
well-being than nondisplaced workers prior to their job displacement and as a result lost their
5 The missing dummy is for a small number of displaced workers, 3 men and 4 women, who failed to provide the exact year of displacement although they said they were displaced in the prior three years in the DWS.

13
jobs, the association between job loss and measures of subjective well-being would not change
as time passes after displacement. However, if the lower levels of subjective well-being among
the displaced are due to job displacement, as more years pass after the event of displacement the
effect of job displacement on subjective well-being would decrease because of hedonic
adaptation (Brickman and Campbell 1971).
To examine if the negative effect of displacement on subjective well-being decreases as
time passes, Tables 6 and 7 report the estimation results for men and women, respectively. The
results for men in column 8 of Panel A of Table 6 show that the negative effect of displacement
on the Cantril ladder weakens over time, while this pattern disappears in column 8 of Panel B of
Table 6 when the additional time-varying controls are included. The results for women in Panels
A and B of Table 7 indicate that in the first two years after job displacement, women report
significantly lower levels of net affect and higher levels of pain, sadness, and stress than
nondisplaced women and the differences decrease over time, which is consistent with hedonic
adaptation (Brickman and Campbell 1971). Although the missing dummies in Tables 6 and 7
show significant results for both men and women, it is difficult to make inference about them
regarding hedonic adaptation.
The findings in Tables 6 and 7 that as time passes the negative effects of displacement on
subjective well-being diminish could also be due to the fact that some of the nondisplaced
workers at the time of the DWS interview might have experienced job displacement by the time
of the ATUS WB Module interview. Nevertheless, the results in Tables 6 and 7 suggest that the
variation in subjective well-being by displacement status found in this paper is not due to
individual heterogeneity or reverse causality. If those workers with lower levels of subjective

14
well-being were more likely to be displaced, their levels of subjective well-being are unlikely to
have changed as time passes.
4. Conclusions
This paper has examined the effect of job displacement on various measures of subjective well-
being based on time-diary data—U-index, net affect, meaningfulness, happiness, pain, sadness,
and stress—as well as a standard life evaluation question using the Cantril ladder and self-rated
health status. The results indicate that the effect of job displacement on subjective well-being
varies by sex and by measure of subjective well-being: among men job displacement does not
affect moment-to-moment subjective well-being but lowers their life evaluation through changes
in employment, marital status and earnings, whereas among women job displacement decreases
net affect, mostly by decreasing happiness and increasing pain, sadness, and stress, but does not
affect their life evaluation. Among men, those displaced by layoffs, not by plant closings,
express lower levels of the Cantril ladder than those not displaced but there is no such difference
by cause of displacement among women. The negative effects of job displacement on subjective
well-being decrease over time for both men and women, rejecting the conjecture that the
association between job displacement and levels of subjective well-being is due to individual
heterogeneity or reverse causality. Finally, no short-term negative effect of job displacement on
self-rated health was found in this paper.
The findings in this paper illustrate that the experience of job displacement lowers
subjective well-being, in addition to causing poor economic, health, and marital outcomes found
in the existing literature. Because current employment status is controlled for in my analysis, the
estimated effects found among women are not capturing the effect of unemployment. Rather,

15
they are reflecting psychological and emotional costs of job displacement, in addition to
economic and marital costs.
One of the limitations of this paper is that many of the displaced workers in the sample
lost their jobs during the Great Recession, around the period between 2007 and 2009 when the
unemployment rate peaked at ten percent in the United States. As a result, these displaced
workers are certainly likely to have had more difficulty finding jobs than other workers displaced
during non-recessionary periods. Then, it may be difficult to generalize the findings of this paper
to the experience of displaced workers in other time periods.

16
Appendix: Matching of the ATUS WB Module and the DWS
Because the ATUS WB Module sample is drawn from the CPS, one can match observations
from the January 2010 and 2012 DWS of the CPS to the 2010, 2012, and 2013 ATUS WB
Modules by utilizing the rotation scheme in the CPS. The CPS is designed so that each
household whose address is selected for the sample is repeatedly interviewed following a 4–8–4
sample rotation scheme: each month there are eight rotation groups in the CPS and a new
rotation group of households enters the survey every month and is interviewed for four
consecutive months, temporarily out for eight consecutive months, and then re-interviewed for
four consecutive months before they are finally dropped from the CPS. Two to five months after
the last CPS interview, some of these households are eligible for the ATUS interview. For
example, a group of households that was in its seventh month of interview (Month in Sample, or
MIS, 7) in the January 2010 DWS finished its eighth month of interview in the CPS in February
2010 and became eligible for the ATUS interview in April through July 2010. In the end, four
rotation groups, those in MIS 5 through 8, from the January 2010 DWS and all eight rotation
groups from the 2012 DWS can be matched to the 2010, 2012, and 2013 ATUS WB Modules.
For these people, all ATUS interviews occurred between March and September. In the end, the
time gap between the two surveys is two months at the minimum and twenty months at the
maximum.
Following the guidelines from Bureau of Labor Statistics (2015), I first linked displaced
workers and nondisplaced workers from the January 2010 and 2012 DWS to the 2010, 2012, and
2013 ATUS WB Modules by using a set of household and individual identification variables
(HRHHID, HRHHID2, and PULINENO). Then I only kept the observations that had the same
values for sex and race, and acceptable ranges of age difference between the two surveys ( -1 to
17
2 years for the 2010 and 2012 ATUS WB and -1 to 3 years for the 2013 ATUS WB), as
suggested by Madrian and Lefgren (2000). Column 3 of Table A1 shows that using a set of
household and individual identification variables, among the sample of 84,323 individuals from
the 2010 and 2012 DWS, 6,413 individuals are successfully merged to the ATUS sample. Of
these, 6,360 observations remained after excluding cases with non-matching sex, race, and age
between the two surveys. Among these individuals, the number of respondents who completed
the ATUS WB Module interviews was 6,051 respondents. Finally, Column 4 of Table A1 shows
that the percentages of displaced workers remain more or less the same throughout this matching
process, suggesting that displaced workers are not more likely to drop out of the surveys than
nondisplaced workers.

18
References Angner E (2010) Subjective well-being. J Socio Econ 39(3):361-368. Black SE, Devereux PJ, Salvanes KG (2015) Losing heart? The effect of job displacement on
health. Ind Labor Relat Rev 68(4):833-861. Brand JE, Levy BR, Gallo WT (2008) Effects of layoffs and plant closings on depression among
older workers. Res Aging 30(6):701-721. Brickman P, Campbell DT (1971) Hedonic relativism and planning the good society. In: Apley
MH (ed.), Adaptation-level theory: A symposium (pp.287-305). New York: Academic Press.
Browning M, Heinesen E (2012) Effect of job loss due to plant closing on mortality and hospitalization. J Health Econ 31(4):599-616.
Brülde B (2007) Happiness theories of the good life. J Happiness Stud 8(1):15-49. Bungard SA, Brand JE, House JS (2007) Toward a better estimation of the effect of job loss on
health. J Health Soc Behav 48:369-384. Cantril H (1965) The pattern of human concerns. New Brunswick: Rutgers University Press. Chaplin TM, Aldao A (2013) Gender differences in emotion expression in children: A meta-
analytic review. Psychol Bull 139(4):735-765. Charles KK, Stephens M (2004) Job displacement, disability, and divorce. J Labor Econ
22(2):489-522. Doiron D, Mendolia S (2012) The impact of job loss on family dissolution. J Popul Econ
25(1):367-398. Eliason M (2012) Lost jobs, broken marriages. J Popul Econ 25(4):1365-1397. Eliason M, Storrie D (2009) Does job loss shorten life? J Hum Resour 44(2):277-302. Farber HS (1993) The incidence and costs of job loss: 1982-91. Brookings Pap Econ Act:
Microecon 1993(1):73-119.
Farber HS (1997) The changing face of job loss in the United States: 1981-1995. Brookings Pap Econ Act: Microecon 1997(1):55-128.
Farber HS (2011) Job loss in the great recession: Historical perspective from the displaced workers survey, 1984-2010. NBER Work Pap Ser 17040.
Freedman VA, Stafford F, Schwarz N, Conrad F, Cornman JC (2012) Disability, participation, and subjective wellbeing among older couples. Soc Sci Med 74(4):588-596.
Fujita F, Diener E, Sandvik E (1991) Gender differences in negative affect and well-being: the case for emotional intensity. J Pers Soc Psychol 61(3):427-434.
Gallo WT, Bradley EH, Dubin JA, Jones RN, Falba TA, Teng H, Kasl SV (2006) The persistence of depressive symptoms in older workers who experience involuntary job

19
loss: Results from the health and retirement survey. J Gerontol B-Psychol 61(4):S221-S228.
Gallo WT, Bradley EH, Siegel M, Kasl SV (2000) Health effects of involuntary job loss among older workers: Findings from the health and retirement survey. J Gerontol B-Psychol 55b(3):S131-S140.
Gallo WT, Teng H, Falba TA, Kasl SV, Krumholz HM, Bradley EH (2006) The impact of late career job loss on myocardial infarction and stroke: A 10 year follow up using the health and retirement survey. Occup Environ Med 63(10):683-687.
Gibbons R, Katz LF (1991) Layoffs and lemons. J Labor Econ 9(4):351-380. Jacobson LS, LaLonde RJ, Sullivan DG (1993) Earnings losses of displaced workers. Am Econ
Rev 83(4):685-709. Kahneman D, Krueger AB, Schkade DA, Schwarz N, Stone AA (2004) Toward national well-
being accounts. Am Econ Rev 94(2):429-434. Kahneman D, Krueger AB (2006) Developments in the measurement of subjective well-being. J
Econ Perspect 20(1):3-24. Keefe V, Reid P, Ormsby C, Robson B, Purdie G, Baxter J, Ngäti Kahungunu Iwi Incorporated
(2002) Serious health events following involuntary job loss in New Zealand meat processing workers. Int J Epidemiol 31(6):1155-1161.
Knabe A, Rätzel S, Schöb R, Weimann J (2010) Dissatisfied with life but having a good day: Time-use and well-being of the unemployed. Econ J 120(547):867-889.
Krueger AB, Kahneman D, Schkade D, Schwarz N, Stone AA (2009) National time accounting: The currency of life, In: Krueger AB (ed.) Measuring the subjective well-being of nations: National accounts of time use and well-being (pp.9-86), Chicago: University of Chicago Press.
Krueger AB, Mueller AI (2012) Time use, emotional well-being, and unemployment: Evidence from longitudinal data. Am Econ Rev 102(3):594-599.
Madrian BC, Lefgren LJ (2000) An approach to longitudinally matching current population survey (CPS) respondents. J Econ Soc Meas 26:31-62.
Mestre MV, Samper P, Frías MD, Tur AM (2009) Are women more empathetic than men? A longitudinal study in adolescence. Span J Psychol 12(1):76-83
Noelke C, Beckfield J (2014) Recessions, job loss, and mortality among older US adults. Am J Public Health 104(11):e126-e134.
Oswald AJ, Proto E, Sgroi D (2015) Happiness and productivity. J Labor Econ 33(4):789-822. Schaller J, Stevens AH (2015) Short-run effects of job loss on health conditions, health
insurance, and health care utilization. J Health Econ 43:190-203. Song Y (2007) Recall bias in the displaced workers survey: Are layoff really lemons? Lab Econ
14 (3):335-345. Stevens AH (1997) Persistent effects of job displacement: The importance of multiple job losses.
J Labor Econ 15(1):165-188.
20
Strully KW (2009) Job loss and health in the U.S. labor market. Demography 46(2):221-246. Sullivan D, Wachter T (2009) Job displacement and mortality: An analysis using administrative
data. Q J Econ 124 (3):1265-1306. U.S. Bureau of Labor Statistics (2015) American time use survey user’s guide, available on the
Web at http://www.bls.gov/tus/atususersguide.pdf Wright TA, Cropanzano R (2000) Psychological well-being and job satisfaction as predictors of
job performance. J Occup Health Psychol 5(1):84-94.

21
Table 1 Descriptive Statistics by Sex and Displacement Status
Men Women Displaced Nondisplaced Displaced Nondisplaced
Dependent Variables U-index .180 (.025) .150 (.008) .197 (.029) .150 (.007) Net affect 3.244 (.147) 3.337 (.050) 2.929 (.190) 3.446 (.050)*** Meaningfulness 4.199 (.144) 4.282 (.039) 4.273 (.151) 4.370 (.040) Happiness 4.183 (.099) 4.229 (.036) 4.107 (.144) 4.367 (.034)* Pain .877 (.119) .735 (.031) 1.059 (.128) .764 (.034)** Sadness .607 (.086) .518 (.027) .829 (.131) .513 (.027)** Stress 1.331 (.107) 1.420 (.039) 1.648 (.141) 1.487 (.041) Cantril ladder 6.493 (.189) 7.066 (.060)*** 7.216 (.186) 7.316 (.058) Self-rated health 3.537 (.073) 3.664 (.024)* 3.601 (.092) 3.637 (.024)
Independent Variables
Layoff .696 (.034) .726 (.036) Plant closing .304 (.034) .274 (.036) Age 44.584 (.900) 44.005 (.381) 44.089 (1.046) 44.034 (.364) White .666 (.033) .721 (.012) .670 (.038) .713 (.011) Black .094 (.018) .079 (.006) .128 (.024) .111 (.007) Hispanic .159 (.024) .143 (.009) .130 (.026) .110 (.008) Other .080 (.021) .057 (.008) .072 (.023) .065 (.007) Elementary school .040 (.013) .031 (.005) .030 (.015) .016 (.003) Some high school .109 (.029) .053 (.006)* .051 (.017) .027 (.004) High school .326 (.035) .297 (.012) .207 (.034) .259 (.012) Some college .216 (.028) .256 (.011) .398 (.040) .286 (.011)*** College .236 (.031) .242 (.011) .231 (.036) .250 (.011) Graduate .073 (.016) .122 (.007)*** .083 (.022) .162 (.009)*** Number of disabilities .089 (.034) .050 (.007) .097 (.029) .044 (.006)* Number of children .693 (.072) .692 (.025) .597 (.070) .644 (.023) Immigrant .172 (.026) .153 (.010) .163 (.030) .122 (.009) SMSA .838 (.026) .827 (.010) .879 (.030) .835 (.009) Single .336 (.035) .296 (.012) .365 (.037) .355 (.012) Married .607 (.036) .651 (.013) .524 (.041) .582 (.012) Partnered .057 (.018) .053 (.006) .111 (.032) .063 (.007) Employed .615 (.037) .947 (.006)*** .668 (.037) .929 (.006)*** Unemployed .257 (.035) .020 (.004)*** .141 (.026) .022 (.004)*** Not in labor force .128 (.024) .033 (.005)*** .190 (.030) .048 (.005)*** Family income: Less than $30,000 .304 (.035) .151 (.009)*** .389 (.039) .169 (.009)*** $30,000-60,000 .287 (.032) .281 (.011) .281 (.038) .286 (.012) $60,000-100,000 .254 (.032) .297 (.012) .182 (.032) .299 (.012)*** $100,000-150,000 .070 (.018) .161 (.010)*** .081 (.024) .153 (.009)*** More than $150,000 .086 (.019) .109 (.008) .068 (.028) .094 (.007) Observations 301 2,641 259 2,850 Note: The numbers of observations for the Cantril ladder are 178 displaced workers and 1,591 nondisplaced workers among men and 148 displaced workers and 1,698 nondisplaced workers among women. All statistics use the WB Module final weight (WUFINLWGT). Standard errors are in parentheses. *, **, *** denote the means are significantly different between the displaced and the nondisplaced at the 10, 5, and 1% level, respectively.

22
Table 2 Effect of Job Displacement on Subjective Well-being: Men Panel A Baseline Model (1) (2) (3) (4) (5) (6) (7) (8) (9) VARIABLES U-index Net affect Meaningfulne
ss Happiness Pain Sadness Stress Cantril ladder Self-rated
health Displacement 0.025 -0.059 -0.048 -0.045 0.096 0.013 -0.066 -0.043** -0.010 (0.025) (0.148) (0.128) (0.101) (0.118) (0.086) (0.107) (0.017) (0.022) Observations 2,942 2,942 2,942 2,942 2,942 2,942 2,942 1,769 2,942 R-squared 0.061 0.075 0.072 0.081 0.096 0.080 0.085
Panel B Baseline Model plus Time-varying Independent Variables (1) (2) (3) (4) (5) (6) (7) (8) (9) VARIABLES U-index Net affect Meaningfulne
ss Happiness Pain Sadness Stress Cantril ladder Self-rated
health Displacement 0.018 -0.026 -0.068 -0.064 0.048 -0.014 -0.149 -0.022 0.001 (0.026) (0.152) (0.120) (0.107) (0.114) (0.092) (0.111) (0.016) (0.022) Observations 2,942 2,942 2,942 2,942 2,942 2,942 2,942 1,769 2,942 R-squared 0.066 0.084 0.079 0.092 0.102 0.087 0.088
Note: The estimates in columns 1 through 7 are OLS coefficients from the 2010, 2012, and 2013 ATUS WB Modules; the estimates in column 8 are Ordered Probit marginal effects from the 2012 and 2013 ATUS WB Modules; and the estimates in column 9 are Ordered Probit marginal effects from the 2010, 2012 and 2013 ATUS WB Modules. All estimates use the WB Module final weight (WUFINLWGT). Standard errors in parentheses. *** p<0.01, ** p<0.05, * p<0.1. The following control variables are included in all columns in both Panels A and B: age and its square; three dummies for race/ethnicity; five education dummies; number of disabilities; an immigrant dummy; number of children; an SMSA dummy; two season dummies; year dummies; dummies for the DWS year; and state dummies. Columns 1 through 7 additionally contain a holiday dummy and six dummies for the days of the week. Panel B additionally includes two marital-status dummies; two employment-status dummies; and four dummies for family income during the last twelve months.
23
Table 3 Effect of Job Displacement on Subjective Well-being: Women Panel A Baseline Model (1) (2) (3) (4) (5) (6) (7) (8) (9) VARIABLES U-index Net affect Meaningfulne
ss Happiness Pain Sadness Stress Cantril ladder Self-rated
health Displacement 0.043 -0.491*** -0.113 -0.247* 0.257** 0.284** 0.191 0.006 0.012 (0.028) (0.185) (0.137) (0.140) (0.125) (0.123) (0.140) (0.025) (0.026) Observations 3,109 3,109 3,109 3,109 3,109 3,109 3,109 1,846 3,109 R-squared 0.060 0.086 0.118 0.092 0.075 0.060 0.087
Panel B Baseline Model plus Time-varying Independent Variables (1) (2) (3) (4) (5) (6) (7) (8) (9) VARIABLES U-index Net affect Meaningfulne
ss Happiness Pain Sadness Stress Cantril ladder Self-rated
health Displacement 0.056* -0.525*** -0.112 -0.260* 0.246** 0.259** 0.288** 0.012 0.033 (0.030) (0.192) (0.145) (0.147) (0.124) (0.125) (0.141) (0.026) (0.024) Observations 3,109 3,109 3,109 3,109 3,109 3,109 3,109 1,846 3,109 R-squared 0.063 0.094 0.124 0.099 0.081 0.069 0.099
Note: The estimates in columns 1 through 7 are OLS coefficients from the 2010, 2012, and 2013 ATUS WB Modules; the estimates in column 8 are Ordered Probit marginal effects from the 2012 and 2013 ATUS WB Modules; and the estimates in column 9 are Ordered Probit marginal effects from the 2010, 2012 and 2013 ATUS WB Modules. All estimates use the WB Module final weight (WUFINLWGT). Standard errors in parentheses. *** p<0.01, ** p<0.05, * p<0.1. The following control variables are included in all columns in both Panels A and B: age and its square; three dummies for race/ethnicity; five education dummies; number of disabilities; an immigrant dummy; number of children; an SMSA dummy; two season dummies; year dummies; dummies for the DWS year; and state dummies. Columns 1 through 7 additionally contain a holiday dummy and six dummies for the days of the week. Panel B additionally includes two marital-status dummies; two employment-status dummies; and four dummies for family income during the last twelve months.

24
Table 4 Effect of Layoffs and Plant closings on Subjective Well-being: Men Panel A Baseline Model (1) (2) (3) (4) (5) (6) (7) (8) (9) VARIABLES U-index Net affect Meaningfulne
ss Happiness Pain Sadness Stress Cantril ladder Self-rated
health Layoff 0.032 -0.149 -0.253 -0.075 0.203 0.058 -0.039 -0.048** -0.008 (0.028) (0.165) (0.157) (0.113) (0.128) (0.097) (0.130) (0.019) (0.023) Plant closing 0.009 0.151 0.431** 0.026 -0.153 -0.092 -0.129 -0.034 -0.016 (0.047) (0.287) (0.177) (0.188) (0.243) (0.166) (0.173) (0.033) (0.045) Observations 2,942 2,942 2,942 2,942 2,942 2,942 2,942 1,769 2,942 R-squared 0.061 0.075 0.076 0.081 0.097 0.081 0.085
Panel B Baseline Model plus Time-varying Independent Variables (1) (2) (3) (4) (5) (6) (7) (8) (9) VARIABLES U-index Net affect Meaningfulne
ss Happiness Pain Sadness Stress Cantril ladder Self-rated
health Layoff 0.023 -0.095 -0.250* -0.076 0.149 0.025 -0.119 -0.028 0.001 (0.030) (0.172) (0.146) (0.119) (0.134) (0.100) (0.132) (0.018) (0.024) Plant closing 0.004 0.144 0.381** -0.035 -0.202 -0.111 -0.224 -0.010 0.000 (0.045) (0.278) (0.185) (0.191) (0.214) (0.171) (0.175) (0.031) (0.042) Observations 2,942 2,942 2,942 2,942 2,942 2,942 2,942 1,769 2,942 R-squared 0.066 0.084 0.083 0.092 0.104 0.087 0.088
Note: The estimates in columns 1 through 7 are OLS coefficients from the 2010, 2012, and 2013 ATUS WB Modules; the estimates in column 8 are Ordered Probit marginal effects from the 2012 and 2013 ATUS WB Modules; and the estimates in column 9 are Ordered Probit marginal effects from the 2010, 2012 and 2013 ATUS WB Modules. All estimates use the WB Module final weight (WUFINLWGT). Standard errors in parentheses. *** p<0.01, ** p<0.05, * p<0.1. The following control variables are included in all columns in both Panels A and B: age and its square; three dummies for race/ethnicity; five education dummies; number of disabilities; an immigrant dummy; number of children; an SMSA dummy; two season dummies; year dummies; dummies for the DWS year; and state dummies. Columns 1 through 7 additionally contain a holiday dummy and six dummies for the days of the week. Panel B additionally includes two marital-status dummies; two employment-status dummies; and four dummies for family income during the last twelve months.

25
Table 5 Effect of Layoffs and Plant closings on Subjective Well-being: Women Panel A Baseline Model (1) (2) (3) (4) (5) (6) (7) (8) (9) VARIABLES U-index Net affect Meaningfulne
ss Happiness Pain Sadness Stress Cantril ladder Self-rated
health Layoff 0.036 -0.481** -0.118 -0.276 0.180 0.285** 0.149 0.019 0.010 (0.034) (0.228) (0.173) (0.179) (0.145) (0.143) (0.163) (0.030) (0.031) Plant closing 0.061 -0.520* -0.100 -0.173 0.459** 0.283 0.300 -0.020 0.016 (0.051) (0.285) (0.196) (0.169) (0.234) (0.234) (0.256) (0.044) (0.042) Observations 3,109 3,109 3,109 3,109 3,109 3,109 3,109 1,846 3,109 R-squared 0.060 0.086 0.118 0.093 0.075 0.060 0.087
Panel B Baseline Model plus Time-varying Independent Variables (1) (2) (3) (4) (5) (6) (7) (8) (9) VARIABLES U-index Net affect Meaningfulne
ss Happiness Pain Sadness Stress Cantril ladder Self-rated
health Layoff 0.049 -0.519** -0.117 -0.292 0.179 0.261* 0.240 0.020 0.029 (0.035) (0.235) (0.180) (0.185) (0.141) (0.142) (0.163) (0.031) (0.029) Plant closing 0.073 -0.540* -0.098 -0.178 0.419* 0.255 0.411 -0.005 0.045 (0.052) (0.287) (0.195) (0.170) (0.235) (0.243) (0.254) (0.043) (0.041) Observations 3,109 3,109 3,109 3,109 3,109 3,109 3,109 1,846 3,109 R-squared 0.063 0.094 0.124 0.100 0.081 0.069 0.099
Note: The estimates in columns 1 through 7 are OLS coefficients from the 2010, 2012, and 2013 ATUS WB Modules; the estimates in column 8 are Ordered Probit marginal effects from the 2012 and 2013 ATUS WB Modules; and the estimates in column 9 are Ordered Probit marginal effects from the 2010, 2012 and 2013 ATUS WB Modules. All estimates use the WB Module final weight (WUFINLWGT). Standard errors in parentheses. *** p<0.01, ** p<0.05, * p<0.1. The following control variables are included in all columns in both Panels A and B: age and its square; three dummies for race/ethnicity; five education dummies; number of disabilities; an immigrant dummy; number of children; an SMSA dummy; two season dummies; year dummies; dummies for the DWS year; and state dummies. Columns 1 through 7 additionally contain a holiday dummy and six dummies for the days of the week. Panel B additionally includes two marital-status dummies; two employment-status dummies; and four dummies for family income during the last twelve months.

26
Table 6 Effect of Years since Displacement on Subjective Well-being: Men Panel A Baseline Model (1) (2) (3) (4) (5) (6) (7) (8) (9) VARIABLES U-index Net affect Meaningfulne
ss Happiness Pain Sadness Stress Cantril ladder Self-rated
health 1˗2 years 0.002 0.114 -0.109 -0.061 -0.160 -0.140 -0.223* -0.053** -0.001 (0.031) (0.190) (0.145) (0.133) (0.129) (0.091) (0.124) (0.023) (0.024) 3˗4 years 0.069* -0.341 0.122 -0.020 0.492** 0.259 0.213 -0.028 -0.019 (0.041) (0.228) (0.250) (0.146) (0.223) (0.166) (0.180) (0.024) (0.040) Missing -0.158* -0.152 -2.225*** -0.010 0.939*** 0.160 -0.675 -0.212*** -0.265** (0.081) (0.704) (0.288) (0.331) (0.318) (0.509) (0.889) (0.069) (0.110) Observations 2,942 2,942 2,942 2,942 2,942 2,942 2,942 1,769 2,942 R-squared 0.063 0.076 0.075 0.081 0.102 0.083 0.086
Panel B Baseline Model plus Time-varying Independent Variables (1) (2) (3) (4) (5) (6) (7) (8) (9) VARIABLES U-index Net affect Meaningfulne
ss Happiness Pain Sadness Stress Cantril ladder Self-rated
health 1-2 years -0.007 0.138 -0.161 -0.093 -0.209 -0.162 -0.322** -0.028 0.006 (0.032) (0.193) (0.158) (0.140) (0.133) (0.102) (0.132) (0.023) (0.026) 3-4 years 0.060 -0.282 0.112 -0.023 0.432** 0.213 0.133 -0.015 -0.003 (0.040) (0.229) (0.236) (0.145) (0.217) (0.166) (0.174) (0.023) (0.038) Missing -0.205** 0.127 -2.269*** 0.079 0.802** 0.077 -1.023 -0.133* -0.232** (0.094) (0.760) (0.379) (0.382) (0.349) (0.532) (0.919) (0.074) (0.111) Observations 2,942 2,942 2,942 2,942 2,942 2,942 2,942 1,769 2,942 R-squared 0.067 0.085 0.082 0.092 0.108 0.089 0.090
Note: The estimates in columns 1 through 7 are OLS coefficients from the 2010, 2012, and 2013 ATUS WB Modules; the estimates in column 8 are Ordered Probit marginal effects from the 2012 and 2013 ATUS WB Modules; and the estimates in column 9 are Ordered Probit marginal effects from the 2010, 2012 and 2013 ATUS WB Modules. All estimates use the WB Module final weight (WUFINLWGT). Standard errors in parentheses. *** p<0.01, ** p<0.05, * p<0.1. The following control variables are included in all columns in both Panels A and B: age and its square; three dummies for race/ethnicity; five education dummies; number of disabilities; an immigrant dummy; number of children; an SMSA dummy; two season dummies; year dummies; dummies for the DWS year; and state dummies. Columns 1 through 7 additionally contain a holiday dummy and six dummies for the days of the week. Panel B additionally includes two marital-status dummies; two employment-status dummies; and four dummies for family income during the last twelve months.

27
Table 7 Effect of Years since Displacement on Subjective Well-being: Women Panel A Baseline Model (1) (2) (3) (4) (5) (6) (7) (8) (9) VARIABLES U-index Net affect Meaningfulne
ss Happiness Pain Sadness Stress Cantril ladder Self-rated
health 1-2 years 0.058 -0.673*** 0.086 -0.215 0.429** 0.600*** 0.345* -0.029 0.002 (0.038) (0.233) (0.140) (0.166) (0.174) (0.185) (0.199) (0.035) (0.033) 3-4 years 0.008 -0.102 -0.271 -0.204 -0.048 -0.166* -0.092 0.052 0.033 (0.042) (0.278) (0.233) (0.231) (0.162) (0.097) (0.180) (0.032) (0.041) Missing 0.252*** -2.287*** -2.686*** -1.821*** 0.886*** -0.397*** 0.910*** -0.270*** -0.092 (0.087) (0.492) (0.929) (0.351) (0.315) (0.135) (0.254) (0.039) (0.062) Observations 3,109 3,109 3,109 3,109 3,109 3,109 3,109 1,846 3,109 R-squared 0.061 0.089 0.124 0.095 0.077 0.068 0.089
Panel B Baseline Model plus Time-varying Independent Variables (1) (2) (3) (4) (5) (6) (7) (8) (9) VARIABLES U-index Net affect Meaningfulne
ss Happiness Pain Sadness Stress Cantril ladder Self-rated
health 1-2 years 0.073* -0.706*** 0.090 -0.220 0.417** 0.576*** 0.464** -0.018 0.030 (0.040) (0.243) (0.142) (0.173) (0.172) (0.189) (0.202) (0.034) (0.031) 3-4 years 0.017 -0.137 -0.253 -0.219 -0.051 -0.178* -0.018 0.057* 0.047 (0.042) (0.274) (0.234) (0.230) (0.159) (0.101) (0.173) (0.033) (0.038) Missing 0.270*** -2.442*** -2.723*** -1.911*** 0.916*** -0.332** 1.009*** -0.311*** -0.092 (0.088) (0.476) (0.948) (0.336) (0.313) (0.153) (0.260) (0.041) (0.060) Observations 3,109 3,109 3,109 3,109 3,109 3,109 3,109 1,846 3,109 R-squared 0.064 0.097 0.130 0.102 0.083 0.077 0.100
Note: The estimates in columns 1 through 7 are OLS coefficients from the 2010, 2012, and 2013 ATUS WB Modules; the estimates in column 8 are Ordered Probit marginal effects from the 2012 and 2013 ATUS WB Modules; and the estimates in column 9 are Ordered Probit marginal effects from the 2010, 2012 and 2013 ATUS WB Modules. All estimates use the WB Module final weight (WUFINLWGT). Standard errors in parentheses. *** p<0.01, ** p<0.05, * p<0.1. The following control variables are included in all columns in both Panels A and B: age and its square; three dummies for race/ethnicity; five education dummies; number of disabilities; an immigrant dummy; number of children; an SMSA dummy; two season dummies; year dummies; dummies for the DWS year; and state dummies. Columns 1 through 7 additionally contain a holiday dummy and six dummies for the days of the week. Panel B additionally includes two marital-status dummies; two employment-status dummies; and four dummies for family income during the last twelve months.

28
Table A1 Number of Matched Individuals between the DWS and the ATUS WB Modules and the Final Sample Size (1)
2010 DWS MIS 5-8
(2) 2012 DWS
MIS 1-8
(3) Total
(4) Displaced workers
DWS
28,744 55,579 84,323 7,821 (9.28%)
Matched to ATUS by identification variables 2,513 3,900 6,413 597 (9.31%)
Sex, race, and age verified
2,508 3,852 6,360 590 (9.28%)
Complete ATUS WB Module interviews 2,436 3,615 6,051 560 (9.25%)
Note: In parentheses are the unweighted percentages of displaced workers out of the total sample.