DISTRICT PLANNING AMR - APARD Hyderabad Pro. R. Suryanarayana Reddy Centre Head, CDP&A.
70
DISTRICT PLANNING AMR - APARD Hyderabad Pro. R. Suryanarayana Reddy Pro. R. Suryanarayana Reddy Centre Head, CDP&A Centre Head, CDP&A
-
Upload
nathan-harper -
Category
Documents
-
view
221 -
download
2
Transcript of DISTRICT PLANNING AMR - APARD Hyderabad Pro. R. Suryanarayana Reddy Centre Head, CDP&A.

DISTRICT PLANNING
AMR - APARD Hyderabad
Pro. R. Suryanarayana ReddyPro. R. Suryanarayana ReddyCentre Head, CDP&ACentre Head, CDP&A

Prelude Planning fundamentals Decentralised Planning Institutional Mechanism for planning PRIs and Planning District Planning Methodolgy Panchayat Level Planning Mandal Level Planning Urban Planning Role of DPC Issues in Decentralised Planning

Some basic questions
What is a Plan? Why do we need a plan? When do we need a plan? Objectives of Planning Success and Failures of Centralised
Planning Decentralised Planning

Article 243 GPowers, authority and responsibilities of Panchayats.-
Subject to the provisions of this Constitution, the Legislature of a State may, by law, endow the Panchayats with such powers and authority as may be necessary to enable them to function as institutions of self-government and such law may contain provisions for the devolution of powers and responsibilities upon Panchayats at the appropriate level, subject to such conditions as may be specified therein, with respect to-
(a) the preparation of plans for economic development and social justice; (b)the implementation of schemes for economic
development and social justice as may be entrusted to them including those in relation to the matters listed in the Eleventh Schedule.

Article 243 ZD-DPC
“There shall be constituted in every State at the district level a District Planning Committee to consolidate the plans prepared by the Panchayats and the Municipalities in the district and to prepare a draft development plan for the district as a whole.”
The Legislature of a State may, by law, make provision with respect to - the composition of the District Planning
Committees the manner in which the seats in such
Committees shall be filled

The object of district planning is to arrive at an integrated, participatory coordinated idea of development of a local area
Each Panchayat at any level or Municipality is treated as a planning unit and the ‘district plan’ is built up through consolidation and integration of these plans
A Plan(Yojana)would be a composite whole which consists of several programmes (karyakrams)in a mutual interdependent way

Five Year Plan 15/20 Year Perspective Plan
More exact and attuned to the budgetary allocations that are fixed in the five year plan
Concentrates on the larger picture and sets out broad development goals that are not affected by funding constraints
Is guided by existing funding priorities and schemes
Aims at influencing funding priorities over the long term
Capable of being projectised and implemented through annual plans, which take out prioritised activities and implement them.
Not in projectisable mode but more of setting out priorities

Goal Setting
Monitoring &Evaluation
Envisioning
Implementation
PlanningStockTaking
District/Mandal/GPPlanning

Stock taking
Baseline Survey Secondary data Data Collation Data Analysis Data Synthesis Vision Building

Stock Taking
Human Development
Infrastructure Development
Productivity Sector
Health, Education, Women &
Child Welfare, Social Justice & other
basic minimum Services
Social InfrastructureEconomic Infrastructure
Communication Networks
Food and agricultural Production, Watersheds,
Animal Husbandry, Irrigation, Handlooms,
Handicrafts, Khadi VillageIndustries etc.,
Natural Resource
Management
LandForest Water

Status of Various Schemes Along with
financial resources on hand & to be received
during this year for district and Mandals
Centrally Sponsored Schemes
State Plan SchemesPRI AND ULBsOwn Resources
Flag Ship Programmes SSA, NRHM, MDM, TSC, DWSM, NREGS ICDS, JNNURM
Other CSS like PMGSY, ARWS, RGGVY BHARAT NIRMAN Etc
AllSectorral Department
Schemes
GP/MP/ZP/ULB OWN FUNDS
Externally Aided Projects
Contributions fromNGOs, NRIs, People Corporate Bodies, etc
SCHEMES AND RESOURCES

SWOT
Strengths Weakness Opportunities Threats

Stock Taking -Human Development
UN HDI INDIA HUMAN DEVELOPMENT REPORT
2001 AP HUMAN DEVELOPMENT REPORT
2007

Children in India-Present Scenario UNICEF Report 2008
Every 3 seconds, One child is dying 2.1 million children die annually before reaching 5th
birthday India accounts for 21% of the world’s under 5 child
deaths India Accounts for 8.3% of the worlds low weight
deaths 1/3 of the world’s neonatal (0-28 days period) deaths
occur in India Low Birth weight infants accounts for 43% of the
world’s infants 35 % of the Worlds under weight children below 5
years age live in India

DescriptionIndia Japan USA China
S.Lanka
PakB.
Desh
Population under nourished (% of total population) 2002
20 2.5 2.5 12 22 24 30
Births attended by skilled health personnel (%) 1997-2005a
43 100 99 97 96 31 13
Infant mortality rate (per 1,000 live births 2005
56 3 6 23 12 79 54
Under-five mortality rate (per 1,000 live births 2005
74 4 7 27 14 99 73
Births attended by skilled health personnel (%) 1997-2005a
43 100 99 97 96 31 13
HUMAN DEVELOPMENT REPORT 2007-08

Human Development Report 2007Description India Japan USA China S.Lanka Pak B. Desh
HDI Rank 128 8 12 81 99 136 140
Human poverty index (HPI-) Rank
62 .. .. 29 44 77 93
Gender related Development Index (GDI) Rank
112 13 16 72 88 124 120
Life Expectancy 63.7 82.3 77.9 72.5 71.6 64.6 63.1
Adult Literacy 61 .. .. 90.9 90.7 49.9 47.5
Children under weight for age (% under age 5)1996-2005e
47 .. 2 8 29 38 48
Infants with low birth weigt.(%) 1998-2005e
30 8 8 4 22 19 36
Population living below $1 a day (%) 1990-2005e
34.3 .. .. 9.9 5.6 17 41.3

Description India Japan USA ChinaS.Lan
ka PakB.
Desh
Life expectancy at birth, quinquennial estimates (years)
62.9 81.9 77.4 72 70.8 63.6 62
Births attended by skilled health personnel (%) 1997-2005a
43 100 99 97 96 31 13
Population using improved sanitation (%) 2004
33 100 100 44 91 59 39
Population using an improved water source (%) 2004
86 100 100 77 79 91 24
Population under nourished (% of total population) 2002
20 2.5 2.5 12 22 24 30
HIV prevalence (% aged 15-49)2005
0.9 < 0.1 0.6 0.1 < 0.1 0.1 < 0.1

Description India Japan USA ChinaS.
Lanka PakB.
Desh
TB cases, prevalence (per 1 Lakh people) 2005e
299 38 3 208 80 297 406
Infant mortality rate (per 1,000 live births 2005
56 3 6 23 12 79 54
Under-five mortality rate (per 1,000 live births 2005
74 4 7 27 14 99 73
Population with out Electricity (millions)
487.2.. ..
8.5 6.7 71 6.2
Forest Area (% of total land)
22.8 68.2 33.1 21.2 29.9 2.5 6.7
Seats in Parliament % held by women
9 11.1 16.3 20.3 4.9 20.4 15.1
GDP per capita (PPP US$) 2005
3452 31267 41890 6757 4595 2370 2053

Some Important Socio Economic Indicators-South IndiaDESCRIPTION INDIA A.P Karnataka Kerala Tamilanadu
% BPL Pop 2004-05 21.8 11.1 17.4 11.4 17.8
IMR 2005 58 57 50 14 37
MMR 27.4 14.8 18.9 6.6 8.8
Life Expectancy-Male (2001-06) 63.90 62.8 62.4 717 67
Life Expectancy-Female (2001-06) 66.90 65 66.4 75 69.8
% Area Under Forest 22.79 22.59 16.12 27.85 16.29
Literacy Male % 75.26 70.32 76.10 94.24 82.42
Female Litteracy % 53.67 50.43 56.87 87.72 64.43
Total Literacy % 64.84 60.47 66.64 90.86 73.45
% Urban House holds having sanitation facility 73.72 78.07 75.23 92.02 64.33
% Rural House holds having sanitation facility 21.92 18.15 17.40 81.33 14.36
Per Capita Income 2005-06 (Q) 25716 26211 27101 32852 29924
Enrolment Ratio ( Classes 1-5th ) 98.20 87.72 108.91 96.92 116.51
Drop Out rate (1-5th Class) 31.47 42.61 9.75 0 3.23
Enrolment Ratio ( Classes 6 -8th ) 62.40 64.86 76.2 93.64 100.41
Dropout Rate (Classes 1-8th) 52.32 59.79 50.59 -9.54 25.15Source: Compilation Book on Socio Economic Indicators, Dir.Econ.&Stat, Govt.A.P,Hyd, 2007
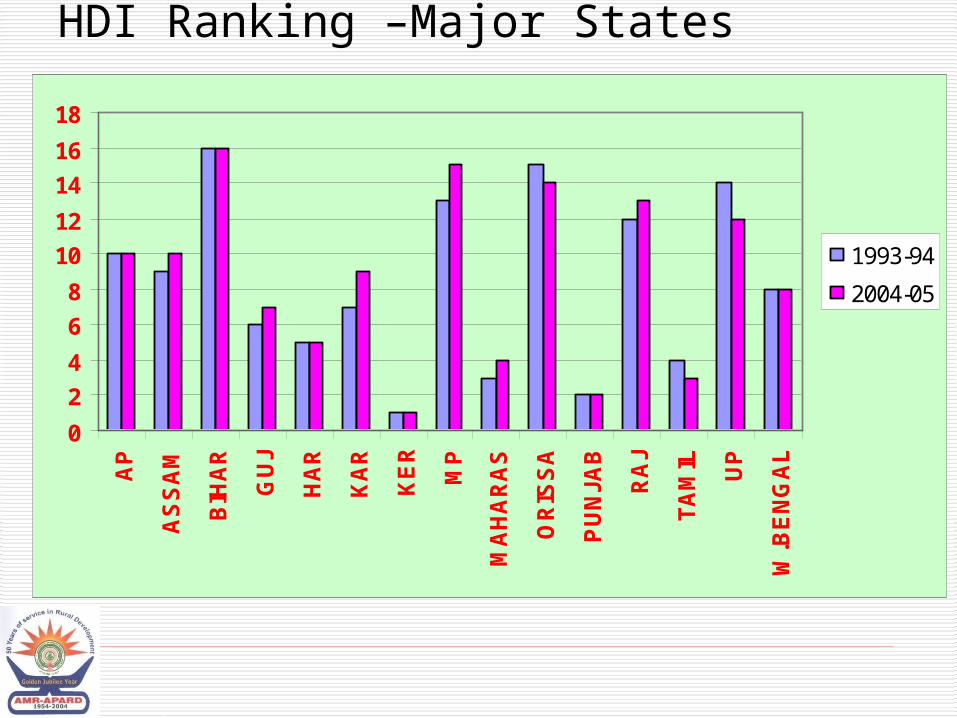
HDI Ranking –Major States
0
2
4
6
8
10
12
14
16
18A
P
AS
SA
M
BIH
AR
GU
J
HA
R
KA
R
KE
R
MP
MA
HA
RA
S
OR
ISS
A
PU
NJA
B
RA
J
TA
MIL UP
W.B
EN
GA
L
1993-94
2004-05

Human Development Ranking 2007
12
34
56
78
910
1112
1314
1516
1718
1920
2122
23
0
5
10
15
20
25H
YD
KR
IG
UN
TN
EL
R.R
ED
CH
ITW
.G
KA
RIM
KD
PK
HM
E.G
PR
KM
ME
DA
K
NZ
MB
VIS
AK
HA
AD
LB
NA
LGW
GL
AN
TP
UR
KU
RS
KK
LMM
AH
VZ
NM

Human Development Report 200721
22 23
2019
1817
1615
1413
1211
109
87
43
21
65
0123456789
1011121314151617181920212223
HY
D
KR
I
GU
NT
NE
L
R.R
ED
CH
IT
W.G
KA
RIM
KD
P
KH
M
E.G
PR
KM
ME
DA
K
NZ
MB
VIS
AK
HA
AD
LB
NA
LG
WG
L
AN
TP
UR
KU
R
SK
KL
M
MA
H
VZ
NM
1990s
2000s

Per capita GDDP 2004-05
02000400060008000
100001200014000160001800020000
VSP
HYD RR
MED
AK KHA
WG EG
KRS
GNT AP NEL
KAR
PRK
CHI
NZBD
ADLB KU
RKA
DW
GL ANT
NAL
MAH
SKKL
MVZ
NM

Sex Ratio Total
900
920
940
960
980
1000
1020
1040
Niz
am
ab
ad
Sri
kaku
lam
Viz
ian
ag
ara
m
Ka
rim
na
ga
r
E.G
od
ava
ri
W.G
od
ava
ri
Ad
ilab
ad
Vis
akh
ap
atn
am
Gu
ntu
r
Ne
llore
Ch
itto
or
AP
ST
AT
E
Kri
shn
a
Kh
am
ma
m
Ka
da
pa
Me
da
k
Wa
ran
ga
l
Ma
hb
ub
na
ga
r
Pra
kasa
m
Na
lgo
nd
a
Ku
rno
ol
An
ata
pu
r
Ra
ng
are
dd
y
Se
x R
ati
o

Literacy Total
74
69
67
66
66
65
65
63
63
60
60
57
57
57
57
56
55
55
53
53
52
52
51
44
0
10
20
30
40
50
60
70
80W
.Godavari
Krishna
Chitto
or
Rangare
ddy
E.G
odavari
Nello
re
NA
TIO
NA
L
Kadapa
Guntu
r
AP
ST
AT
E
Vis
akhapatn
am
Pra
kasam
Nalg
onda
Wara
ngal
Kham
mam
Anata
pur
Srikakula
m
Karim
nagar
Kurn
ool
Adila
bad
Niz
am
abad
Medak
Viz
ianagara
m
Mahbubnagar

Infant Mortality Rate (per 1000 live births)
0
10
20
30
40
50
60
70
80M
ahbu
bnag
ar
Viz
iana
gara
m
Srik
akul
am
Adi
laba
d
Kur
nool
Ana
tapu
r
Med
ak
Niz
amab
ad
Kha
mm
am
Kar
imna
gar
Nal
gond
a
Pra
kasa
m
War
anga
l
Kad
apa
AP
ST
AT
E
Vis
akha
patn
am
Gun
tur
Chi
ttoo
r
Ran
gare
ddy
E.G
odav
ari
Nel
lore
W.G
odav
ari
Kris
hna

Maternal Mortality Rate (per 100000 live births)
0
50
100
150
200
250
300
350
400
450
Srik
akul
am
Ana
tapu
r
Adi
laba
d
Viz
iana
gara
m
Ran
gare
ddy
Mah
bubn
agar
Nal
gond
a
Kur
nool
Med
ak
AP
ST
AT
E
Kad
apa
Chi
ttoo
r
W.G
odav
ari
War
anga
l
Pra
kasa
m
Kha
mm
am
E.G
odav
ari
Kar
imna
gar
Nel
lore
Vis
akha
patn
am
Gun
tur
Niz
amab
ad
Kris
hna

% of Women assisted by skilled personnel during delivery
0
10
20
30
40
50
60
70
80
90
100
Kris
hna
Niz
amab
ad
Gun
tur
Vis
akha
patn
am
Nel
lore
Nal
gond
a
Kar
imna
gar
E.G
odav
ari
Kha
mm
am
Pra
kasa
m
War
anga
l
W.G
odav
ari
AP
ST
AT
E
Chi
ttoo
r
Kad
apa
Med
ak
Kur
nool
Mah
bubn
agar
Ran
gare
ddy
Viz
iana
gara
m
Adi
laba
d
Ana
tapu
r
Srik
akul
am

Dropout Rate
0
10
20
30
40
50
60
70
80
Mah
bubn
agar
Med
ak
War
anga
l
Pra
kasa
m
Adi
laba
d
Niz
amab
ad
Nal
gond
a
Kur
nool
Gun
tur
Kha
mm
am
AP
ST
AT
E
Kar
imna
gar
VZ
NM
RR
Dis
t
Srik
akul
am
Kris
hna
E.G
odav
ari
Nel
lore
Ana
tapu
r
Vis
akha
patn
am
Kad
apa
W.G
odav
ari
CH

Incidence of Poverty (%)-20026
7
13 14
15 15 16 16
18 18
22 23
26
31
33 33
35
39
25
31
22
2121
0
5
10
15
20
25
30
35
40
45N
ZD
KA
D
VS
P
EG
RR
ME
D
KR
M
KU
R
AN
T
WR
G
NA
L
VZN
M
KR
AP
NE
L
CH
T
PK
S
GN
T
MA
H
AD
L
KH
M
WG
SK
LM

Distribution of Physically Challenged Persons in Andhra Pradesh
MR155,199
11%
Speech138,974
10%
Visual581,587
44%
Hearing73,373
5%
Locomotor415,848
30%VisualSpeechHearingLocomotorMR

Urban Population %10
0
54.2
39.9
5
32.0
8
28.8
27.3
26.5
3
25.2
6
23.5
23.1
6
22.5
9
22.4
5
21.6
5
19.8
1
19.7
4
19.4
4
19.2
18.3
3
18.1
1
15.2
8
14.3
6
13.3
2
10.9
8
10.5
7
0
20
40
60
80
100
120
HY
D
RR
VS
P
KR
GN
T
AP
AD
L
AN
T
EG
KU
R
KA
D
NE
L
CH
T
KH
M
WG
KR
M
WR
G
VZ
NM
NZ
D
PK
S
ME
D
NA
L
SK
LM
MA
H

Identification of Lead Sectors
Agriculture and Allied Sector Mineral Processing Handicrafts Services Industry Tourism
Potentially Linked Credit Plans of NABARD

Vivid idealized description of a desired outcome that inspires, energizes and helps you create a mental picture of your target
A vision is not a project report or a plan target. It is an articulation of the desired end results in broader terms.
--A. P. J. Abdul Kalam
VISION

My Dream Village
…………every village’s first concern will be to grow its own food crops and cotton for its cloth. It should have a reserve for its cattle, recreation and playground for adults and children. The village will maintain a village theatre, school and public hall. It will have its own waterworks, ensuring clean water supply. Education will be compulsory up to the final basic course. As far as possible every activity will be conducted on the cooperative basis.

"India with her mighty scientific knowledge and power house of young, should build her own huge rocket systems (satellite launch vehicles) and also build her own communication, remote sensing and meteorological spacecraft and launch from her own soil to enrich the Indian life in satellite communication, remote sensing and meteorology."
Space Vision for India 1970

Sam’s Agenda “If the global standards meet our
needs, we will adopt them, if not then we will create our own standards.We have to crash the transaction costs substantially. We want to do open source and open standards as much as possible and sit Indian languages on top of that. Broadband connectivity needs to be expanded to the 250,000 panchayats in the country, which are the backbone of local governance When you go to 250,000 panchayats, they have to have trained people, systems etc.,.
Sam Pitroda,
Advisor to the P.M. On Public Information Infrastructure &
Innovations

Setting Goals is an important step in Planning exercise
Where do we (District, Mandal, GP) want to be in next five years; ten years; twenty years ?
a) What the rate of literacy in our District / Mandal / GP will be ?
b) What will be the number of our children in Schools ?
c) All deliveries will be in institutions or by trained workers ?
d) Where will our MMR stands ?

e) Where will our Infant Mortality Rate stands ?f) All unemployed will get employment ?
1) Wage earning or self employment. 2) All the unemployed will be trained in various skills
g) All people will have access to potable Drinking Water ?
h) All the houses have drainage facility ?i) All the habitations have road connectivity ?j) Can we have food security for all, including
destitute?k) Can we establish rural business hubs ?l) All houses have electricity ?

We may use the Millennium Development Goals as a basis191 United Nations member states pledged in 2000 to meet the following eight goals by 2015:

Millennium Development Goals
Manishankar on MDGs
Salil Shetty on MDGs

Finding Availablity of
Resources
Monitoring and Evaluation
Prioritisation
Implementation
Consolidation and integration
Linking Needs to the
avialableResources
Identification of felt needs
Planning Sutras

IDENTIFY YOUR FELT NEEDS
Safe drinking water Nutrition for children & mothers Playground & teachers Dispensary/Hospital with building,
equipment, medicines & doctors Loan for the self employed Training in trades/vocations Roads, electricity, markets If none of these- you could have an
alternative set of needs in your district!

PRIORITISATION OF FELT NEEDS
What we will take up first ? What is the most urgent ?
What is that helps the poor in the village ? What is that helps the women & children in
the village ? What will benefit the most number of people
? If you have to make a choice, won’t you give
priority to the work that helps the poorest and the weakest in the village ?

What are the available resources?
People Know How Sramdan
Natural resources Man made assets Funds
Own funds Devolved funds Funds under various schemes Contribution from the public / NRIs etc.

Natural resources are equally important…
What is the nature of the land in the district? How much is under agriculture? How much is irrigated? How much is under forest? Mining?
What is the state of agriculture? Major crops? Scope for horticulture, animal husbandry, fisheries, fuel plantation?
What is the extent of availability of water? How much is being used for drinking water, agriculture, industry and other purposes?
How do we protect and sustain the natural resources?

Manmade resources come next .. What is the government infrastructure
available? What are the private assets available? You could make a checklist - Tanks,
handpumps, schools, dispensaries, hospitals, roads, drains, veterinary dispensaries, cottage- small-scale industry, ITI, godowns, cold storages etc.
It is a good idea to complete asset registers for all Panchayats and departments!
Can you mark this on a district map? You can use the NIC to help out.

And last but not the least – the financial resources
What are the programmes in operation in your district and how much money is available under each?
Central Plan funds, State plan funds, Central finance Commission grants, State finance commission grants, Your own resources, through taxes and user
charges. Do not forget salaries and maintenance
expenditure --- they are equally important.

You must invariably find out how much money is available under the following schemes,
National Rural Employment Guarantee Programme, National Rural Health Mission Sarva Shiksha Abhiyan, Midday Meal Scheme, Accelerated Rural Water Supply Programme Pradhan Mantri Gram Sadak Yojana Integrated Child Development Scheme Indira Awas Yojana Swarna Jayanthi Gram Swarozgar Yojana Backward Regions Grant Fund Central Finance Commission Grants State Finance Commission Grants

5th Sutra
Matching the needs with resources Tied Partially Tied Untied

Sixth Sutra- Consolidation
ZP President has two roles – one as president and one as Chairperson of DPCs.
Each Panchayat will make its plan based on its needs & available resources
Municipalities will do the same. These plan will need to be put together
for the whole district by the District Planning Committee

Consolidation includes convergence of plans…
Convergence can be at each Panchayat level when projects cutting across different scheme sources are taken up,
Panchayats at different levels can also put their resources together to implement common projects which benefit all,
Finally, the Municipalities and the Panchayats would sit together to explore areas where their plans can pool resources and take up common projects.

Publicity for the plan is the key to better implementation
Once activities are mapped with available resources and needs of all sections of the society are taken into account, the draft plan should be made public.

Seventh Sutra-Implementation
You must ensure and monitor regular release of funds to Panchayats and Urban bodies from the schemes entrusted to them,
Determine who will take up the works – the Panchayats, Municipalities or the departments themselves?
Monitor the sanctioning of works, tendering, hiring, outsourcing – Time to be specified for each milestones
Key question – will you take up works even for assets that do not belong to you?
Ensure mandatory and regular quality checks.

The eighth Sutra-Checking whether the goals have been reached
Independent monitoring is the only way to find out if you have succeeded or failed.
Is is easier to check whether physical and financial goals have been reached - “how many PHCs or schools have been built?”
But more difficult to find out if quality goals have been reached – Has child mortality come down? Has the drop-out rate come down? Has the learning ability of children gone up?
Is a failed plan a useful plan? Yes – if one knows why one failed,

The eighth Sutra-Checking whether the goals have been reached
Encourage innovative ways in your district of checking whether you have succeeded or failed,
For example, Panchayats could inspect each other and rank themselves….
Or citizens can be encouraged to give report cards on implementation!

PRE GRAM SABHA MEETING/
WARD SABHA
Ward Member/Ex. Elected
Reps
Education Committees
Mothers Committees
RMGs
VTDA/VSS
WUA
VO’s
Water Shed
SC/ST/Disabled sections
YOUTH GROUPS
ARTISAN GROUPS
IDENTIFICATION OF CRITICAL GAPS IN THRUST AREAS AS
IDENTIFIED BY DPC
HOLDING GRAM SABHA
PRIORITISING FELT NEEDS
PLAN PREPARATION
HOLDING GP MEETING
APPROVAL OF PLANS AND SUBMISSION TO MANDAL
GRAM PANCHAYAT LEVEL PLANNING
NGOs
NETWORKING OF FELT NEEDS AND RESOURCES

Inter Panchayat Issues
Manintenance of markets
Drinking water schemes
Maintenance of Hostels
Drains Maintetance
Minor Irrigation Tanks
Bus StandsHealth Sub Centres/RLUs
Forest Conservation Electric Transmission
Primary/UP School Education
Link roads
GP 1
GP 2
GP 3

Rural-Urban Interface
Drainage facilitiesMaintenance of Hostels
Drinking water and Irrigation Channels
Garbage Disposal
Electric TransmissionGP 1 GP 2
Mpl
Migration of workers
Educational Institutes
Food Processing Units
Marketing Facilities
Forward Linkages

CONSULTATIVE MEETING
WITH STAKE HOLDERS
MPTCs
SARPANCH’S
MANDAL EDN.COMMITTEES
MANDAL MAHILASAMAKHYAS
DISTRIBUTORY COMMITTEES
CO-OPERATIVESOCIETIES
OFFICIAL FUNCTIONARIES
ARTISAN GROUPS
IDENTIFICATION OF CRITICAL GAPS IN THRUST AREAS AS
IDENTIFIED IN DPC
PRIORITISING FELT NEEDS
MANDAL PLAN PREPARATION
HOLDING MANDAL PARISHADGENERAL BODY MEETING
APPROVAL OF PLANS AND FORWARDING TO ZILLA PARISHAD
MANDAL LEVEL PLANNING
TECHNICAL VETTING OF GP PLANS
CONSOLIDATION OF GP PLANS
NETWORKING OF FELT NEEDS FOR MANDAL AND RESOURCES

CONSULTATIVE MEETING
WITH STAKE HOLDERS
ZPTCs
MPPS
DIST. EDN.COMMITTEES
ZILLA MAHILASAMAKHYAS
PROJECT COMMITTEES
OFFICIAL FUNCTIONARIES
ARTISAN GROUPS
IDENTIFICATION OF CRITICAL GAPS IN THRUST AREAS
PRIORITISING FELT NEEDS
ZP PLAN(DISTRICT RURAL) PREPARATION
HOLDING ZP STANDING COMMITTEES 1&7 MEETING
APPROVAL OF PLANS AND FORWARDING TO ZILLA PARISHAD
ZP (DISTRICT RURAL) LEVEL PLANNING
TECHNICAL VETTING AND CONSOLIDATIONOF MP PLANS
MP/MLA/MLC
NGOS
NETWORKING OF FELT NEEDS FOR ZP AND RESOURCES

FUNCTIONAL CLASSIFICATIONGP PLAN MP PLAN ZP PLAN
Maintenance of Drinking Water Schemes/tanks
School Building construction, Maintenance
Construction of New ZP School Buildings
Sanitation, ISLs, drain maintenance
MI Tanks ZP Roads,
Electricity Street Lighting/ Extn.of lines
New Colonies Electrification
CPWS Schemes
Maintenance to GP Buildings
Construction of new GP buildings
MP Office Buildings
Internal Roads Link Roads
Shopping Complexes Shopping Complexes Shopping Complexes
Manintenance of hostel buildings
Hostel Buildings
Drinking water/Sanitation to existing AWCs/RLUs/ and Subcentres
Construction of RLU/GP Building/Subcentres/Community Halls/Anganwadi Centre construction
Construction of RLU/GPBuilding/Subcentres/Community Halls/Anganwadi Centre construction

CALAMITY FUND
• Unforeseen circumstances like natural calamities . . . . .
• Provision may be made in plan

What about Maintenance of
Assets Created???
Plan has to take care of this also.

GP Plan
GP Plan GP
PlanWard Plan
Ward Plan
Ward Plan
Mandal PlanULB Plan
GP Plan
GP Plan
GP Plan
Mandal Plan
ZILLA PARISHAD Dist. Rural
PLAN
DPC
HIGH POWER COMMITTEE

Chapterisation-Excutive summary Chapter 1:
Location of Area, Year of constitution, access to capitalBasic Data on population, density, socio economic indicators compared to state and national averagesData on PRI and ULBs NRM data, Rainfall, forests, minerals, water and soilsHuman Resources: working age group, level of unemployment, SHG particularsInfrastructure : Roads, railways, telecommunications, irrigation, credit facilities, hospitals, schools, collegesVocational training institutions, research institutions ICAR etcIncome and expenditure details for five yearsSpecial economic activities

Chapterisation-Executive summaryChapter 2:
Diagnostic analysis identifying critical gaps1. Strategic vision regarding listing historical legacies, traditions etc leading to backwardness2. Identification of geographical areas requiring specific attention
Chapter 3. Sector wise details –flow of funds to various schemes
Chapter 4 Vision Chapter : Priorities, summary of thrust areas and outcomes to be achieved in 5 years
Chapter 5 Abstract of GP/MP/ZP/MPl wise development plans addressing the priorities

DPC
GP PLAN
MP PLAN
ZP PLAN
ULB PLAN
DPC
ENVISIONINGSTOCKTAKING
DISTRICT VISION FORMULATION
IDENTIFICATION OF THRUST
AREAS
GOALS SETTING
DISSEMINATION OF VISION
MEET WITH VO/CBOS
STOCK TAKING
HOLIDING GRAMSABHA
PRIORITISATION OF FELT NEEDS
PLAN PREPARATION
APPROVAL IN GP MEETING
SUBMISSION TO MANDAL
MEET WITHMPTC/SARPANCH
ALL CBOS
STOCK TAKING
PRIORITISATION OF NEEDS
CONSOLIDATION OF GP PLNAS & MANDAL OWN
PLAN PREPARATION
APPROVAL IN MPP GENERAL
BODY MEETING0
SUBMISSION TO ZPP
MEET WITH ALL MLAMP/MLC/ZPTC/
& CBOS
STOCK TAKING
PRIORITISATION OF NEEDS
APPROVAL IN ZPP STANDING
COMMITTEE 1&7
APPROVAL IN ZPP GENERAL
BODY MEETING
SUBMISSION TO DPC
MEET WITHCBOS
STOCK TAKING
HOLIDING WARDSABHA
PRIORITISATION OF NEEDS
PLAN PREPARATION
APPROVAL IN COUNCILMEETING
SUBMISSION TO DPC
CONSOLIDATION OF GP/MPP/ZP/ULB PLANS
TECHNICALVETTING OF
GP PLANS
INTEGRATION WITH
OTHER PLANS
ADMINISTRATIVE SANCTION TO
GP/MP/ZP/ULB PLANS
TECHNICALVETTING OF
ZP/ ULB PLANS
DRAFT PLAN FOR DISTRICT
SUBMISSIONTO HIGH POWER
COMMITTEE
TECHNICALVETTING OF
MP PLANS
CONSOLIDATION OF MP PLNAS & ZPP OWN PLAN PREPARATION
DISTRICT PLAN PREPARATION

Issues of Concern Lack of Information about Resource
Envelop Availability of Data Lack of capabilities Incomplete Devolution Lack of Political will Programme Guidelines Inadequate professional planners

Thank you