District Housing 3Q 2015 Activity Update · Builders produce 286 starts and 224 closings in the...
35
Schertz-Cibolo-Universal City ISD District Housing Activity Update 3Q 2015 Solutions Through Demographics
Transcript of District Housing 3Q 2015 Activity Update · Builders produce 286 starts and 224 closings in the...
Schertz-Cibolo-Universal City ISD
District Housing
Activity Update 3Q 2015
Solutions Through Demographics

2
GREATER SAN ANTONIO NEW HOME CONSTRUCTION STARTS,
CLOSINGS, & LOT DELIVERIESYear-Over-Year Change
Annual Starts +2.2%
Annual Closings +11.5%
Annual Starts: 10,089
Annual Closings: 9,766
Start = Foundation started
Closing = Occupied home
Starts increased in the 3rd quarter, but the current annual rate remains below the high
point for the current cycle which occurred in the 4th quarter of 2014
Closings continue to climb; annual pace is now at the highest level since early 2009

3
GREATER SAN ANTONIO ANNUAL JOB GROWTH(8 county MSA: Atascosa, Bandera, Bexar, Comal, Guadalupe, Kendell, Medina, Wilson counties)
Source: Texas Workforce Commission Current Employment Survey (CES)
Annual Growth
Sept. ‘15 = +35,000 (+3.7%)
Unemployment Rates – September 2015
San Antonio: 3.7%
Austin: 3.3%, DFW: 3.9%, Houston: 4.6%
Texas: 4.4%, US: 4.9%

4
S.C.U.C. ISD QUARTERLY NEW HOME CONSTRUCTION
Start = Foundation started Closing = Occupied home
Builders produce 286 starts and 224 closings in the district during the 3rd quarter
Most starts in a quarter since 2007; most quarterly closings in 4 years
Starts 2011 2012 2013 2014 2015 Closings 2011 2012 2013 2014 2015
1Q 156 151 173 158 170 1Q 178 150 154 119 149
2Q 211 197 198 196 231 2Q 208 139 181 179 176
3Q 184 174 215 184 286 3Q 231 183 177 163 224
4Q 151 159 136 165 4Q 178 178 170 163
Total 702 681 722 703 687 Total 795 650 682 624 549

5
S.C.U.C. ISD ANNUAL NEW HOME CONSTRUCTION
Annual Starts: 852
Annual Closings: 712
Year-Over-Year Change
Annual Starts +27%
Annual Closings +13%
852 new homes started and 712 occupied in the district over the past 12 months
Highest annual start rate in 5 years; most annual closings since 2012
Developers deliver 800 new lots over the past year
Start = Foundation started Closing = Occupied home

Rank District
Total Starts
4Q14-3Q15
Total Closings
4Q14-3Q15
1 Northside 3,303 3,122
2 Comal 1,688 1,526
3 Schertz-Cibolo-U.C. 852 712
4 Boerne 671 684
5 Judson 630 665
6 New Braunfels 542 584
7 East Central 506 563
8 North East 554 535
9 Southwest 406 400
10 Medina Valley 404 376
11 San Marcos Con. 126 119
12 Harlandale 50 107
13 Southside 92 92
14 San Antonio 56 91
15 Navarro 83 82
16 South San Antonio 62 72
17 Seguin 105 59
18 Bandera 19 45
6
GREATER SAN ANTONIO SCHOOL DISTRICT RANKINGS
BY NEW HOME CONSTRUCTION
• SCUC ISD ranks
3rd in total annual
new home activity
among Greater
San Antonio school
districts
Start = Foundation started Closing = Occupied home

7
S.C.U.C. ISD NEW HOME CONSTRUCTION BY CITY
0
50
100
150
200
250
300
350
400
Cibolo Schertz Selma Converse St. Hedwig
355
307
125
65
0
357
198
9760
0
Starts
Closings
4Q14-3Q15 Closings: 50% Cibolo, 28% Schertz, 14% Selma, 8% Converse
Annual starts in Schertz exceed 300 homes for the first time since 2011
Start = Foundation started Closing = Occupied home

1. Kensington Ranch (All) 112 Paschal/Schertz Wilder Schertz/Selma
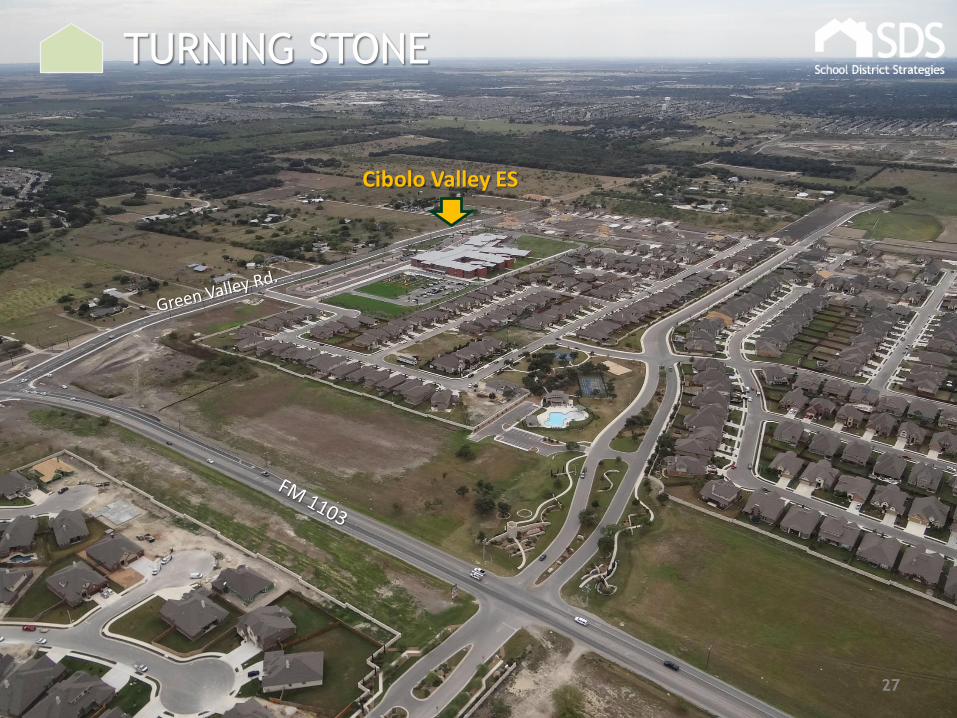
2. Turning Stone (All) 101 Cibolo Valley Schlather Cibolo
3. MacArthur Park 60 Rose Garden Jordan Converse
4. Willow Grove (All) 53 Rose Garden Wilder Schertz
5. Cibolo Valley Ranch 47 Wiederstein Jordan Cibolo
6. Saddle Creek Ranch 47 Cibolo Valley Schlather Cibolo
7. Cibolo Vista (All) 41 Cibolo Valley Jordan Cibolo
8. Buffalo Crossing 38 Wiederstein Jordan Cibolo
9. Riata Terrace 38 Sippel Schlather Schertz
10. Landmark Pointe 33 Cibolo Valley Schlather Cibolo
8
S.C.U.C. ISD TOP PRODUCING NEW HOME SUBDIVISIONS
Annual
Closings
4Q14-3Q15
Elementary
Attendance
Zone
2 of the top 4 producers of new homes are in the Rose Garden ES zone
4 of the top 10 producers are in the Cibolo Valley ES zone
Up and coming new subdivisions: Rhine Valley (53 starts/Watts), Saratoga (44
starts/Green Valley), The Crossvine (41 starts/Rose Garden)
Intermediate
Attendance
ZoneCity

9
NEW HOME ACTIVITY BY ELEMENTARY ZONE
• 35% of new homes occupied over the past 12 months are located in the
Cibolo Valley ES zone
• Paschal, Schertz, and Rose Garden zones (combined) produced 38% of new
home occupancies over the past year

10
NEW HOME ACTIVITY BY INTERMEDIATE ZONE
41% of the district’s new home construction over the past year occurred
in the Schlather zone
Annual starts in the Wilder zone approaching 300 homes

11
NEW HOME ACTIVITY BY
JUNIOR HIGH/HIGH SCHOOL ZONE
Dobie/Steele zone sees 59% of district’s annual closings
Starts becoming more balanced between JH/HS attendance zones

12
DISTRICT MEDIAN NEW HOME PRICE
71% of new homes are being
built in neighborhoods priced
between $201K and $300K
District’s median new home
price levels off at $254,247
(+2% vs. 3Q14)
Greater San Antonio median
new home price = $253,141
(+9.2% vs. 3Q14)
Median New Home Price by City
Cibolo = $260,266
Schertz = $274,934
Selma = $176,102
Converse = $214,000

13
SCHERTZ-CIBOLO-UNIVERSAL CITY ISD
NEW RESIDENTIAL LOTS DELIVERIES
329 new lots delivered in 3Q15
1,463 vacant developed lots on the ground (20.6 month supply)
Subdivision Section(s) Total Lots Attendance Zones City
Saratoga 9 44 Green Valley/Schlather/Dobie/Steele Cibolo
Williams Ranch
1 5 Wiederstein/Schlather/Dobie/Steele Cibolo
Riata Terrace 4C, 5 108 Sippel/Schlather/Dobie/Steele Schertz
Willow Grove 3 93 Rose Garden/Wilder/Corbett/Clemens Schertz
Trails of Kensington Ranch
2-5,2-7 79 Schertz/Wilder/Corbett/Clemens Selma

14
SCHERTZ-CIBOLO-UNIVERSAL CITY ISD
RESIDENTIAL LOTS UNDER DEVELOPMENT
861 future lots under development
Subdivision Section(s) Total Lots Attendance Zones City
Saratoga 3, 4, 11 89 Green Valley/Schlather/Dobie/Steele Cibolo
Heights of Cibolo 5 67 Cibolo Valley/Schlather/Dobie/Steele Cibolo
Mesa at Turning Stone 3,5 81 Cibolo Valley/Schlather/Dobie/Steele Cibolo
Saddle Creek Ranch 6 80 Cibolo Valley/Schlather/Dobie/Steele Cibolo
Foxbrook 1 52 Cibolo Valley/Schlather/Dobie/Steele Cibolo
Landmark Pointe 3 50 Cibolo Valley/Schlather/Dobie/Steele Cibolo
The Crossvine 1-2 120 Rose Garden/Wilder/Corbett/Clemens Schertz
Cypress Point 3 83 Sippel/Schlather/Dobie/Steele Schertz
Misty Woods 1 39 Paschal/Wilder/Corbett/Clemens Schertz
Rhine Valley 3A, 4 132 Watts/Wilder/Corbett/Clemens Schertz
Trails of Kensington Ranch
2-8 68 Schertz/Wilder/Corbett/Clemens Selma
419 lots are in Cibolo
374 lots are in Schertz

15
RESIDENTIAL LOT INVENTORY BY ELEM. ZONE 3Q15
ATTENDANCE ZONE ANNUAL STARTS
4Q14-3Q15
DEVELOPED LOTS
REMAINING TO BE
OCCUPIED
PLANNED
FUTURE
SINGLE FAMILY LOTS
PLANNED FUTURE
APARTMENT UNITS
CIBOLO VALLEY 251 699 961 0
GREEN VALLEY 67 291 328 0
PASCHAL 34 28 95 0
ROSE GARDEN 185 436 2,219 0
SCHERTZ 116 132 298 0
SIPPEL 90 260 1,595 0
WATTS 53 112 334 0
WIEDERSTEIN 56 56 1,473 0
TOTAL 852 2,014 7,303 0

16
S.C.U.C ISD RESIDENTIAL LOT INVENTORY BY IS, JH, AND HS ZONE
ATTENDANCE ZONE ANNUAL STARTS4Q14-3Q15
DEVELOPED LOTSREMAINING TO BE
OCCUPIED
PLANNEDFUTURE
SINGLE FAMILY LOTS
PLANNED FUTURE APARTMENT
UNITS
JORDAN 206 432 3,692 0
SCHLATHER 349 1,007 2,799 0
WILDER 297 575 812 0
TOTAL 852 2,014 7,303 0
ATTENDANCE ZONE ANNUAL STARTS4Q14-3Q15
DEVELOPED LOTSREMAINING TO BE
OCCUPIED
PLANNEDFUTURE
SINGLE FAMILY LOTS
PLANNED FUTURE APARTMENT
UNITS
CORBETT/CLEMENS 407 836 3,419 0
DOBIE/STEELE 445 1,178 3,884 0
TOTAL 852 2,014 7,303 0

17
AERIAL PHOTOS
OCTOBER 5, 2015

18
KENSINGTON RANCH
Schertz ESPaschal ES
Green Valley ES

19
MISTY WOODS

20
WILLOW GROVE

21
RHINE VALLEY
Corbett JH

22
THE CROSSVINE

23
MACARTHUR PARK
Loop 1604

24
SADDLE CREEK RANCH / HEIGHTS OF CIBOLO

25
LANDMARK POINTE

26
MESA AT TURNING STONE / FOXBROOK
FM 1103
Cibolo Valley ES
27
TURNING STONE
Cibolo Valley ES

28
SARATOGA

29
RIATA TERRACE
Sippel ES

30
FAIRWAY RIDGE

31
CYPRESS POINT
Comal ISD

32
S.C.U.C. ISD PRE-OWNED HOME SALES
• 448 existing home sales in the 3rd quarter ($208K median sold price)
• 1,470 total resales over the past 12 months
23% year-over-year increase
Source: SABORSF Sales Only

33
DISTRICT NEW HOME OCCUPANCY FORECAST
If additional lots are developed in the Wiederstein ES zone, then the district
could average of 765 homes per year over the next 5-7 years
Annual Period = 4Q-3Q

34
S.C.U.C. ISD 3Q 2015 SUMMARY
• New home builders produce 286 starts and 224 closings in the district in 3Q15
Most starts in a quarter since 2007; most quarterly closings in 4 years
• 852 new homes started and 712 occupied in the district over the past 12 months
Annual start rate currently at the highest point in 5 years; closings pace at 3-yr. high
• 3rd most new home construction among Greater San Antonio’s 32 school districts
• 50% of new home construction from 4Q14-3Q15 occurred in the City of Cibolo
• Cibolo Valley ES attendance zone sees 35% of district’s new home construction
• Rose Garden, Green Valley, and Watts ES zones experiencing increased activity
• Kensington Ranch and Turning Stone remain the most active neighborhoods
• 2 of the top 4 producers now in the Rose Garden ES zone (MacArthur Park & Willow Grove)
• District’s median new home price levels off at $254K (+2% Y-o-Y)
• Developers deliver 329 new lots in 3Q15 (Saratoga, Kens. Ranch, Riata Terr., Willow Grove)
• 1,463 fully developed vacant single family lots on the ground as of 9-30-2015
• 861 future lots under development (419 lots located in Cibolo, 374 in Schertz)
• Another 6,400-plus future single-family residential lots are planned
• District projected to average 765 new homes per year over the 5-7 years

35
Copyright 2015 School District Strategies.
Disclaimer - Although School District Strategies (SDS) has used commercially reasonable efforts to obtain information from sources in a manner that
SDS believes to be reliable, we do not guarantee its accuracy and such information may be incomplete, condensed or interpolated. Information
presented in this report represents our estimates as of the date of the publication and is subject to change without notice. This report is not
intended as a recommendation or endorsement for any action taken by others. In no event will School District Strategies be liable for direct,
indirect, incidental or consequential lost profits, lost savings, damages or other liabilities resulting from any information provided herein.
16980 N. Dallas Parkway
Suite 101
Dallas, Texas 75248
www.schooldistrictstrategies.com