
Distribution,Density,andAbundanceofPartheniumWeed...
9
Research Article Distribution, Density, and Abundance of Parthenium Weed (Parthenium hysterophorus L.) at Kuala Muda, Malaysia C.M.Maszura,S.M.R.Karim , M. Z. Norhafizah, F. Kayat, and M. Arifullah Faculty of Agro-Based Industry, Universiti Malaysia Kelantan, Jeli Campus, Kota Bharu, Malaysia Correspondence should be addressed to S. M. R. Karim; [email protected] Received 2 January 2018; Accepted 29 April 2018; Published 25 June 2018 Academic Editor: Maria Serrano Copyright©2018C.M.Maszuraetal.isisanopenaccessarticledistributedundertheCreativeCommonsAttributionLicense, which permits unrestricted use, distribution, and reproduction in any medium, provided the original work is properly cited. Knowledge of distribution, density, and abundance of weed in a place is a prerequisite for its proper management. Parthenium hazard is a national agenda in Malaysia, and Kedah is the worst infested state in the country. Despite it, the distribution and abundance of the weed is not systematically documented. Periodical weed surveys were conducted at Kuala Muda, Kedah, during March and September 2015 to identify infested locations, to determine density, abundance, and severity of infestation, and to do mapping of weed distribution of the area. Geographic locations were recorded using a GPS. Weed density was measured following the list count quadrat method. e mapping of weed infestation was done by the ArcGIS software using data of GPS and weed density. Different letters were used to indicate the severity of infestation. Results indicated that in Kuala Muda, sixteen sites are infested having average weed density of 10.6 weeds/m 2 . e highest density was noted at Kg. Kongsi 6 (24.3 plants/m 2 ). e relative density was highest at Semeling (27.25%) followed by Kg. Kongsi 6 (23.14%). e average severity of infestation was viewed as the medium. Parthenium abundance and relative density increased by 18.0% and 27%, respectively, in the second survey conducted. e intervention of concerned authority to tackle the weed problem using integrated weed management approach is emphasized. 1.Introduction e most obnoxious, allergenic, and environmental pol- lutant weed, Parthenium hysterophorus L. (locally called as Rumpai Miang Mexico) is an invasive alien species in Malaysia. e weed scientists of Universiti Malaysia Kelantan detected it for the first time at Batang Kali, Selangor, in 2013 [1–3]. At present, ten states of Malaysia are invaded by the weed, and the state Kedah is the worst infested area [4, 5]. e weed has harmful impacts on crop production, livestock production, human and animal health, and biodiversity [6, 7]. e weed spreads very fast through transport, agricultural implements, crop seeds, compost, and organic manures. It also spreads through flood water, wind pressure, and tyre-carried mud of vehicles [8]. It is essential to know the critical analytical characters such as density, frequency, and abundance of the species if we want to know its dominance in a community. Weed density measures the number of the species in a unit area, sometimes expressed as a percentage. Frequency is the number of times the species occur in the sampling unit, or it is the degree of dispersal of the species. e abundance of a species is the total number of the species present in the weed community and is a relative measure [9]. e severity of weed infestation usually regards the percentage of area covered by the species. e study of weed distribution, abundance, and severity over time are helpful in determining how a population changes over time in response to agronomic practices and agroclimatic con- ditions [5]. erefore, it is essential to identify the parthe- nium infested locations, that is, the geographical range of the weed, its abundance, and severity of infestation in the study site. e primary objective of the study was to accurately identify the areas with parthenium populations and quantify their abundance and severity of infestation. It is intended that the scientists, land managers, and the inhabitants can foresee those areas, potentially subject to parthenium in- vasion, understand the biology of invasion process, and thereby develop the appropriate weed management plans. Hindawi International Journal of Agronomy Volume 2018, Article ID 1046214, 8 pages https://doi.org/10.1155/2018/1046214
Transcript of Distribution,Density,andAbundanceofPartheniumWeed...

Research ArticleDistribution, Density, and Abundance of Parthenium Weed(Parthenium hysterophorus L.) at Kuala Muda, Malaysia
C. M. Maszura, S. M. R. Karim , M. Z. Norhafizah, F. Kayat, and M. Arifullah
Faculty of Agro-Based Industry, Universiti Malaysia Kelantan, Jeli Campus, Kota Bharu, Malaysia
Correspondence should be addressed to S. M. R. Karim; [email protected]
Received 2 January 2018; Accepted 29 April 2018; Published 25 June 2018
Academic Editor: Maria Serrano
Copyright © 2018 C.M.Maszura et al.(is is an open access article distributed under the Creative Commons Attribution License,which permits unrestricted use, distribution, and reproduction in any medium, provided the original work is properly cited.
Knowledge of distribution, density, and abundance of weed in a place is a prerequisite for its proper management. Partheniumhazard is a national agenda in Malaysia, and Kedah is the worst infested state in the country. Despite it, the distribution andabundance of the weed is not systematically documented. Periodical weed surveys were conducted at Kuala Muda, Kedah, duringMarch and September 2015 to identify infested locations, to determine density, abundance, and severity of infestation, and to domapping of weed distribution of the area. Geographic locations were recorded using a GPS.Weed density was measured followingthe list count quadrat method. (e mapping of weed infestation was done by the ArcGIS software using data of GPS and weeddensity. Different letters were used to indicate the severity of infestation. Results indicated that in Kuala Muda, sixteen sites areinfested having average weed density of 10.6 weeds/m2. (e highest density was noted at Kg. Kongsi 6 (24.3 plants/m2). (erelative density was highest at Semeling (27.25%) followed by Kg. Kongsi 6 (23.14%). (e average severity of infestation wasviewed as the medium. Parthenium abundance and relative density increased by 18.0% and 27%, respectively, in the second surveyconducted. (e intervention of concerned authority to tackle the weed problem using integrated weed management approachis emphasized.
1. Introduction
(e most obnoxious, allergenic, and environmental pol-lutant weed, Parthenium hysterophorus L. (locally called asRumpai Miang Mexico) is an invasive alien species inMalaysia. (e weed scientists of Universiti MalaysiaKelantan detected it for the first time at Batang Kali,Selangor, in 2013 [1–3]. At present, ten states of Malaysia areinvaded by the weed, and the state Kedah is the worstinfested area [4, 5]. (e weed has harmful impacts on cropproduction, livestock production, human and animal health,and biodiversity [6, 7]. (e weed spreads very fast throughtransport, agricultural implements, crop seeds, compost, andorganic manures. It also spreads through flood water, windpressure, and tyre-carried mud of vehicles [8]. It is essentialto know the critical analytical characters such as density,frequency, and abundance of the species if we want to knowits dominance in a community. Weed density measures thenumber of the species in a unit area, sometimes expressed as
a percentage. Frequency is the number of times the speciesoccur in the sampling unit, or it is the degree of dispersal ofthe species.(e abundance of a species is the total number ofthe species present in the weed community and is a relativemeasure [9]. (e severity of weed infestation usually regardsthe percentage of area covered by the species. (e study ofweed distribution, abundance, and severity over time arehelpful in determining how a population changes over timein response to agronomic practices and agroclimatic con-ditions [5]. (erefore, it is essential to identify the parthe-nium infested locations, that is, the geographical range of theweed, its abundance, and severity of infestation in the studysite. (e primary objective of the study was to accuratelyidentify the areas with parthenium populations and quantifytheir abundance and severity of infestation. It is intendedthat the scientists, land managers, and the inhabitants canforesee those areas, potentially subject to parthenium in-vasion, understand the biology of invasion process, andthereby develop the appropriate weed management plans.
HindawiInternational Journal of AgronomyVolume 2018, Article ID 1046214, 8 pageshttps://doi.org/10.1155/2018/1046214
A regular weed monitoring is needed to control the weedsustainably. Weed monitoring involves repetitive surveys totrack weed populations over time. (e comparisons betweendifferent periodic surveys can help to elucidate the effect of newweed control technologies on weed species shift. Our pre-liminary investigation indicated that the weed is scattered invarious areas of Batang Kali (Selangor) and Sungai Petani(Kedah), but detailed information was not documented fromelsewhere [2, 5].
2. Materials and Methods
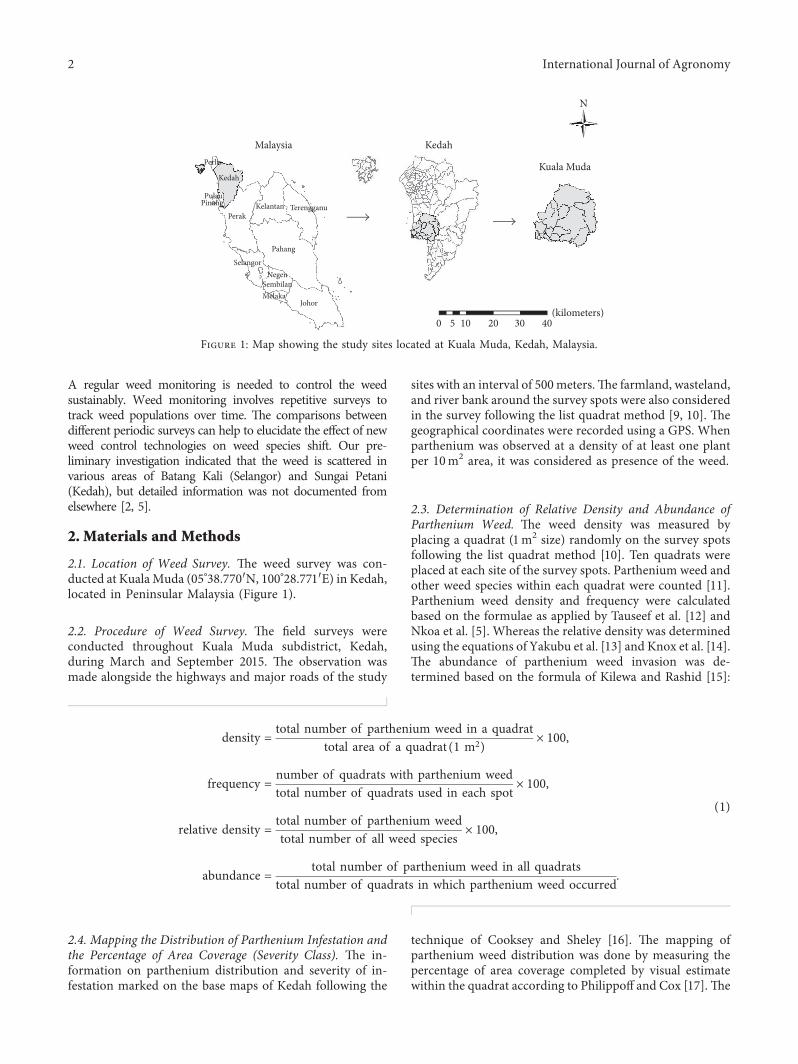
2.1. Location of Weed Survey. (e weed survey was con-ducted at KualaMuda (05°38.770′N, 100°28.771′E) in Kedah,located in Peninsular Malaysia (Figure 1).
2.2. Procedure of Weed Survey. (e field surveys wereconducted throughout Kuala Muda subdistrict, Kedah,during March and September 2015. (e observation wasmade alongside the highways and major roads of the study
sites with an interval of 500meters.(e farmland, wasteland,and river bank around the survey spots were also consideredin the survey following the list quadrat method [9, 10]. (egeographical coordinates were recorded using a GPS. Whenparthenium was observed at a density of at least one plantper 10m2 area, it was considered as presence of the weed.
2.3. Determination of Relative Density and Abundance ofParthenium Weed. (e weed density was measured byplacing a quadrat (1m2 size) randomly on the survey spotsfollowing the list quadrat method [10]. Ten quadrats wereplaced at each site of the survey spots. Parthenium weed andother weed species within each quadrat were counted [11].Parthenium weed density and frequency were calculatedbased on the formulae as applied by Tauseef et al. [12] andNkoa et al. [5]. Whereas the relative density was determinedusing the equations of Yakubu et al. [13] and Knox et al. [14].(e abundance of parthenium weed invasion was de-termined based on the formula of Kilewa and Rashid [15]:
density �total number of parthenium weed in a quadrat
total area of a quadrat 1 m2( )× 100,
frequency �number of quadrats with parthenium weedtotal number of quadrats used in each spot
× 100,
relative density �total number of parthenium weedtotal number of all weed species
× 100,
abundance �total number of parthenium weed in all quadrats
total number of quadrats in which parthenium weed occurred.
(1)
2.4. Mapping the Distribution of Parthenium Infestation andthe Percentage of Area Coverage (Severity Class). (e in-formation on parthenium distribution and severity of in-festation marked on the base maps of Kedah following the
technique of Cooksey and Sheley [16]. (e mapping ofparthenium weed distribution was done by measuring thepercentage of area coverage completed by visual estimatewithin the quadrat according to Philippoff and Cox [17]. (e
Malaysia
Kedah
Perlis
Kelantan TerengganuPerak
Selangor
Pahang
NegenSembilan
0 5 10 20 30 40(kilometers)
MelakaJohor
PulauPinang
Kedah
Kuala Muda
N
Figure 1: Map showing the study sites located at Kuala Muda, Kedah, Malaysia.
2 International Journal of Agronomy

severity of infestation is categorized and presented inTable 1.
All the data of infested areas were transferred intoa digital map using Geographic Information System (GIS)software, ArcGIS [16]. (e distribution, density, and per-centage of coverage by the parthenium weed were consid-ered in mapping the weed infestation.
3. Results and Discussion
3.1. Location and Distribution of Parthenium Infestation.(e survey results indicated that in Kuala Muda, Kedah,parthenium grew vigorously in 16 villages namely, LadangSungai Bongkok, Havard Golf Course area, Kg. Sungai TokRawang, Kg. Zainal Abidin, Kg. Semeling, Kg. Kongsi 6, Kg.Telok, Penghulu Him, Taman Kg. Raja, Batu Dua, TamanSongket Indah, Pokok Terap, Taman Nilam Sari, TamanCahaya Baiduri, Teluk Wang Besar, and Kg. Banggol. Mostof the villages have medium (M) level of infestation exceptthe places like Batu Dua, Pokok Terap, Taman Nilam Sari,and Kg. Banggol, where low (L) infestation was recorded,and at Teluk Wang Besar it was regarded as rare, especiallyduring the first survey (Figure 2(a)). (e difference in in-tensity of infestation is due to natural selection as no otherextra influence has worked here to make difference.
However, during the second survey, all the villages had“medium” level of infestation signposted by “M,” and Kg.Semeling had a high level of infestation designated by “H.” Itis mentioned here that the personnel from Department ofAgriculture (DOA), Kedah, sprayed with glyphosate twice(trade name: Knockdown) between the surveys. Althoughthe above-ground parts of the weed were destroyed, a vastnumber of seeds remained within the soil and emerged laterwith higher energy. (at is why the infestation level washigher in the second survey (Figure 2(b)). Probably the weedseedbank of parthenium was encouraged after herbicidespraying above ground. Worku [19] stated that partheniumbecame the major weed in Ethiopia, India, and Australiawithin a short period, even after herbicide sprays. (erefore,continuous monitoring and control measures are needed foran extended period.
3.1.1. Parthenium Preference according to Habitat. In KualaMuda, most of the infestations are noticed along roadsides,residential areas, wasteland, and crop farms (Figure 3).When parthenium is prevalent on roadsides, it is subject toquick spread through wind pressure of moving transports[20]. According to Ayele et al. [21], parthenium weed wasintroduced to Ethiopia in the year 1968 through cereals
consignment. However, another form of introduction oc-curred to eastern Ethiopia in the year 1976 through weedseeds attached to the army transport at the time of Ethio-Somali war.
When parthenium grows in the wasteland, it usuallyremains undisturbed and leads the plant to produce a highernumber of seeds. Parthenium growth in the residential areais dangerous to the inhabitants. (e children who play withthe weed are prone to be infected by parthenium showywhite flowers which cause allergy. People may inhale thepollen from the parthenium flowers during breathing whichmight adversely affect their respiratory system. (e weedsurveyors noticed many parthenium plants in front ofmosques and Hindu temples, which are also risky for thepeople who come for worships. (e dominance of parthe-nium weed in crop farms may lead to its contamination withcrop seeds which leads to its further spread. Upadhyay et al.[22] commented that parthenium weed commonly growsnear the roadsides, in farms, and paddocks. Adnan et al. [11]also noted that most of the habitats infested by the par-thenium weed are alongside road, the fields for crop cul-tivation, and wasteland rather than alongside water canal.
Presence of parthenium near cattle farm is risky for thecattle. If the cattle graze on the parthenium infested land, theanimals might be infected with skin dermatitis due to closecontact with the weed. When parthenium is abundant alongthe river bank or watercourses, the spread of the weed mayoccur due to the mixing of parthenium weed seeds with riverwater. All these information indicate the risks of the par-thenium weed at Kuala Muda.
3.2. Density and Abundance of PartheniumWeed at DifferentSites. (e density, relative density, frequency, abundance,and other parameters of parthenium weed infestation atKuala Muda, Kedah, are shown in Table 2.
3.2.1. Weed Density. (e parthenium weed density at KualaMuda, Kedah, significantly varied (P< 0.05) at differentvillages in both the surveys on March and September 2015.During the first survey, the highest density of partheniumweed was found at Kg. Kongsi 6 (18.8 weed/m2) followed byTaman Cahaya Baiduri (16.0 weed/m2), Kg. Penghulu Him(15.8 weed/1m2), and Kg. Zainal Abidin (13.4weeds/m2).(e lowest density was noticed at Kg. Teluk Wang Besar(0.4 weeds/m2) and Kg. Banggol (1.2 weeds/m2) (Figure 4).
(e highest relative density was in Taman CahayaBaiduri (23.74%) followed by Kg. Penghulu Him (22.19%),Kg. Kongsi 6 (19.85%), and Kg. Zainal Abidin (19.79%)(Table 2).
It is not clear to us that why such a variability in par-thenium density exists among different villages. Since thepeople of all these villages were unaware about this invasivespecies [4], the discrepancy in weed densities might be due tonatural selection. More or less similar ranking of weedfrequency was noticed in different survey sites. For example,the highest frequency was noted in Kg. Kongsi 6, Kg.Penghulu Him, Kg. Telok, Taman, and Cahaya Baiduri, and
Table 1: Classification of severity of parthenium infestation.
Symbol used Severity class Percent coverageT Trace/rare Less than 1%L Low/occasional plants Between 1 and 5%M Moderate/scattered plants Between 5 and 25%H High/fairly dense Between 25 and 100%Adopted from the U.S. Department of the Interior [18] and Cooksey andSheley [16].
International Journal of Agronomy 3

the lowest frequency was in Kg. Banggol, Kg. Teluk WangBesar, and Pokok Terap (Table 2).
During the second survey in September 2015, a signifi-cant change occurred in weed density at Kuala Muda,Kedah. (e weed density increased in most of the surveysites, ranging from 2.2 to 24.3weeds/m2. (e highest densitywas recorded at Kg. Kongsi 6 (24.3 weeds/m2), Kg. Semeling
(21.2 weeds/m2), and Kg. Zainal Abidin (15.1 weeds/m2),and the lowest was at Kg. Banggol (2.2 weeds/m2) (Figure 5).(e average density was higher in the second survey(10.6 weeds/m2) compared to 8.43 weeds/m2 in the firstsurvey, although statistically, both were similar (Figure 6).However, there was a little decrease in weed density at foursites, for example, Kg. PenghuluHim, Taman Songket Indah,
N
0 1 2 4 6 8(kilometers)
Area infested by parthenium weed1 = Ladang Sg. Bongkok 2 = Havard Golf Course3 = Kg. Sg. Tok Rawang4 = Kg. Zainal Abidin5 = Kg. Semeling6 = Kg. Kongsi 67 = Kg. Telok8 = Penghulu Him9 = Tmn. Kg. Raja10 = Batu Dua11 = Tmn. Songket Indah12 = Pokok Terap13 = Tmn. Nilam Sari
15 = Teluk Wang Besar14 = Tmn. Cahaya Baiduri
16 = Kg. Banggol
Symbol for severity classT = traceL = low
M = mediumH = high
(a)
0 1 2 4 6 8(kilometers)
Area infested by parthenium weed1 = Ladang Sg. Bongkok 2 = Havard Golf Course3 = Kg. Sg. Tok Rawang4 = Kg. Zainal Abidin5 = Kg. Semeling6 = Kg. Kongsi 67 = Kg. Telok8 = Penghulu Him9 = Tmn. Kg. Raja10 = Batu Dua11 = Tmn. Songket Indah12 = Pokok Terap13 = Tmn. Nilam Sari
15 = Teluk Wang Besar14 = Tmn. Cahaya Baiduri
16 = Kg. Banggol
Symbol for severity classT = traceL = low
M = mediumH = high
N
(b)
Figure 2: Map showing parthenium infestation at Kuala Muda, Kedah, in March (a) and September 2015 (b). Note that, in the secondsurvey, the severity of infestation has changed from “L” to “M” in some locations and in one location from “M” to “H.”
4 International Journal of Agronomy

Taman Cahaya Baiduri, and Havard Golf Course. Probablythis change is due to the greater efforts of monitoring andherbicide spraying by the Department of Agriculture, Kedah.
(e relative density was in the similar trend as recordedin both the surveys. (e highest relative density was in Kg.Semeling (27.25%), followed by Kg. Kongsi 6 (23.14%),Taman Cahaya Baiduri (23.13%), and Kg. Zainal Abidin(23.09%). (e lowest relative density was in Kg. Banggol(5.34%) (Table 2). (ere was more or less similar weedfrequency noticed in the second survey, and the highest wasin Kg. Kongsi 6 followed by Kg. Sungai Tok Rawang, Kg.Zainal Abidin, and Kg. Semeling.(e lowest weed frequencywas in Batu Dua, Pokok Terap, and Kg. Banggol. Higherfrequency and density of parthenium weed caused itsabundance also higher in both the surveys in Kuala Muda,Kedah. From Table 2, it is obvious that the value of weedabundance increased the most in Teluk Wang Besar(85.23%) followed by Taman Nilam Sari (75.0%) and Pokok
Terap (52.38%). However, there were decreases in parthe-nium abundance in some locations, especially in TamanSongket Indah (35.09% decrease). While an average impactof the weed distribution considered, it is clear that on anaverage, more than 18.0% increase in weed abundance and28.0% increase in relative density were observed in thesecond survey. Nkoa et al. [5] stated that the weed abun-dance is related to weed number (density) or frequency,which might have influenced the abundance positively inthis study.
3.2.2. Percent Weed Coverage. A significant difference inpercent coverage by parthenium weed was observed in dif-ferent villages (P< 0.05). In the first survey, parthenium weedcoverage was higher at Kg. Zainal Abidin (23.5%), followed byplaces Kg. Semeling and Taman Cahaya Baiduri (23%) andwas the lowest at Teluk Wang Besar (0.9%) (Figure 7).
Table 2: Total number of quadrats used (NQ), other species/quadrats (OS), number of all species/quadrats (AS), number of quadrats withparthenium (QP), frequency of parthenium distribution (F), parthenium weed abundance (A), relative density (RD) (%), and symbol forseverity class (SC) at Kuala Muda in March and September 2015.
Sites NQ OS AS QP F A RD SC OS AS QP F A RD SC % increaseMarch 2015 September 2015 A RD
1 10 55.6 61.6 7 0.7 8.6 9.74 M 41.5 53.2 7 0.7 16.7 21.99 M 48.50 55.712 10 59.6 64.9 6 0.6 8.8 8.17 M 32.5 37.4 6 0.6 8.2 13.1 M −7.32 37.633 10 59.9 72.6 7 0.7 18.1 17.49 M 46.4 60 8 0.8 17.0 22.67 M −6.47 22.854 10 54.3 67.7 7 0.7 19.1 19.79 M 50.3 65.4 8 0.8 18.9 23.09 M −1.06 14.295 10 48.2 59.4 7 0.7 16.0 18.86 M 56.6 77.8 8 0.8 26.5 27.25 H 39.62 30.796 10 75.9 94.7 8 0.8 23.5 19.85 M 80.7 105.0 9 0.9 27.0 23.14 M 12.96 14.227 10 50.2 62.5 8 0.8 15.4 19.68 M 53.8 67.4 7 0.7 19.4 20.18 M 20.62 2.488 10 55.4 71.2 8 0.8 19.8 22.19 M 56.7 70.0 7 0.7 19.0 19 M −4.21 −16.799 10 53.0 60.9 7 0.7 11.3 12.97 M 55 63 6 0.6 13.3 12.7 M 15.04 −2.1310 10 52.0 54.6 4 0.4 6.5 4.76 L 44.9 47.5 4 0.4 6.5 5.47 M 0 12.9811 10 64.5 72.2 5 0.5 15.4 10.66 M 49.7 55.4 5 0.5 11.4 10.29 M −35.09 −3.6012 10 65.5 67.0 3 0.3 5.0 2.24 L 63 67.2 4 0.4 10.5 6.25 M 52.38 64.1613 10 41.6 43.6 4 0.4 5.0 4.59 L 39.8 49.8 5 0.5 20.0 20.08 M 75.00 77.1414 10 51.4 67.4 8 0.8 20.0 23.74 M 49.2 64 7 0.7 21.1 23.13 M 5.21 −2.6415 10 83.1 83.5 3 0.3 1.3 0.48 T 51.8 56.2 5 0.5 8.8 7.83 M 85.23 93.8716 10 41.5 42.7 3 0.3 4.0 2.81 L 39 41.2 4 0.4 5.5 5.34 M 27.27 47.38Total 160 911.7 1046.5 95 9.5 197.8 198.02 810.9 980.5 100 10 249.8 261.51Note. Site 1� Ladang Sg. Bongkok; Site 2�Havard Golf Course; Site 3�Kg. Sg. Tok Rawang; Site 4�Kg. Zainal Abidin; Site 5�Kg. Semeling; Site 6�Kg.Kongsi 6; Site 7�Kg. Telok; Site 8�Kg. Penghulu Him; Site 9�Tmn. Kg. Raja; Site 10�Batu Dua; Site 11�Tmn. Songket Indah; Site 12�Pokok Terap;Site 13�Tmn. Nilam Sari; Site 14�Tmn. Cahaya Baiduri; Site 15�Teluk Wang Besar; Site 16�Kg. Banggol; Kg.�Kampung; Tmn.�Taman; Sg.� Sungai.
Kuala Muda
141210
86420
A B C D E F GInfested habitats
Num
ber o
f hab
itats
infe
sted
Figure 3: (e number of habitats infested with parthenium weed at different sites of Kuala Muda. A�wasteland, B� cattle farm area,C� damping place, D� roadside, E� bank of river, F� farmlands or plantations, and G� residential area and temples/mosques. Smallvertical lines above the bars indicate the standard error of means.
International Journal of Agronomy 5

In the second survey, partheniumweed coverage (%) washigher in Kg. Semeling (27%), followed by Kg. Kongsi 6(25%), and the lowest was at Teluk Wang Besar (5.5%)(Figure 8).
From the data of percent area coverage, the severity ofinfestation is regarded as “M” in most of the sites, except in Kg.TelukWang Besar which is regarded as trace (T) and BatuDua,Pokok Terap, Taman Nilam Sari, and Kg. Banggol are regardedas low (L) infested areas. However, the percent coverage in thesecond survey increased, and the severity of infestation isregarded as “M” in those sites. However, the severity of theweed is regarded as high (H) in Kg. Semeling. (e overalldifferences between the two surveys in March and September2015 were statistically significant (P< 0.05) (Figure 9).
0
10
20
30
March September
Mea
n de
nsity
(wee
d nu
mbe
r)
Months
aa
Figure 6: Mean density of parthenium weed during two surveys inMarch and September 2015.(e results are the means of all villages.Similar small letters on bars indicate a nonsignificant difference.
0
10
20
30
Mea
n of
par
then
ium
wee
dco
vera
ge (%
) in
Mar
ch
abab
ab
a
b
ab abab ab
ab
ab
ab
ab ab
ab
ab
Sites (village)
Lada
ng S
g. B
ongk
okH
avar
d G
olf C
ours
eKg
. Sg.
Tok
Raw
ang
Kg. Z
aina
l Abi
din
Kg. S
emel
ing
Kg. K
ongs
i 6Kg
. Tel
okKg
. Pen
ghul
u H
imTm
n. K
g. R
aja
Batu
Dua
Tmn.
Son
gket
Inda
hPo
kok
Tera
pTm
n. N
ilam
Sar
i
Telu
k W
ang
Besa
rTm
n. C
ahay
a Bai
duri
Kg. B
angg
ol
Figure 7: Percent coverage by parthenium weed in different vil-lages of Kuala Muda in March 2015. Kg.�Kampung, Tmn.�Taman, and Sg.� Sungai. Dissimilar small letters on bars indicatea significant difference.
a
a
a aa a
a
a
aa
a
aa
a
a
a
0
10
20
30M
ean
of p
arth
eniu
m w
eed
cove
rage
((%
)/1m
2 ) in
Sep
tem
ber
Sites (village)
Lada
ng S
g. B
ongk
okH
avar
d G
olf C
ours
eKg
. Sg.
Tok
Raw
ang
Kg. Z
aina
l Abi
din
Kg. S
emel
ing
Kg. K
ongs
i 6Kg
. Tel
okKg
. Pen
ghul
u H
imTm
n. K
g. R
aja
Batu
Dua
Tmn.
Son
gket
Inda
hPo
kok
Tera
pTm
n. N
ilam
Sar
i
Telu
k W
ang
Besa
rTm
n. C
ahay
a Bai
duri
Kg. B
angg
olFigure 8: Percent coverage by parthenium weed in different vil-lages of Kuala Muda in September 2015. Kg.�Kampung, Tmn.�Taman, and Sg.� Sungai. Dissimilar small letters on bars indicatea significant difference.
0
10
20
30
Mea
n of
par
then
ium
wee
dde
nsity
(1m
2 ) in
Mar
ch
Sites (village)
bcdebcde
abcdabcabcde
a
abcdab
abcde
cde
abcde
de cde
ab
e de
Lada
ng S
g. B
ongk
okH
avar
d G
olf C
ours
eKg
. Sg.
Tok
Raw
ang
Kg. Z
aina
l Abi
din
Kg. S
emel
ing
Kg. K
ongs
i 6Kg
. Tel
okKg
. Pen
ghul
u H
imTm
n. K
g. R
aja
Batu
Dua
Tmn.
Son
gket
Inda
hPo
kok
Tera
pTm
n. N
ilam
Sar
i
Telu
k W
ang
Besa
rTm
n. C
ahay
a Bai
duri
Kg. B
angg
olFigure 4: Parthenium weed density of different villages of KualaMuda in March 2015. Kg.�Kampung, Tmn.�Taman, and Sg.�Sungai. Dissimilar small letters on bars indicate a significantdifference.
abc
c
abc abc
aba
abc abc
bc
cc c
bc
abc
cc
Sites (village)
Lada
ng S
g. B
ongk
okH
avar
d G
olf C
ours
eKg
. Sg.
Tok
Raw
ang
Kg. Z
aina
l Abi
din
Kg. S
emel
ing
Kg. K
ongs
i 6Kg
. Tel
okKg
. Pen
ghul
u H
imTm
n. K
g. R
aja
Batu
Dua
Tmn.
Son
gket
Inda
hPo
kok
Tera
pTm
n. N
ilam
Sar
i
Telu
k W
ang
Besa
rTm
n. C
ahay
a Bai
duri
Kg. B
angg
ol
0
10
20
30
Mea
n of
par
then
ium
wee
dde
nsity
(1m
2 ) in
Sept
embe
r
Figure 5: Parthenium weed density at different villages of KualaMuda, Kedah, in September 2015. Kg.�Kampung, Tmn.�Taman,and Sg.� Sungai. Dissimilar small letters on bars indicate a sig-nificant difference.
6 International Journal of Agronomy
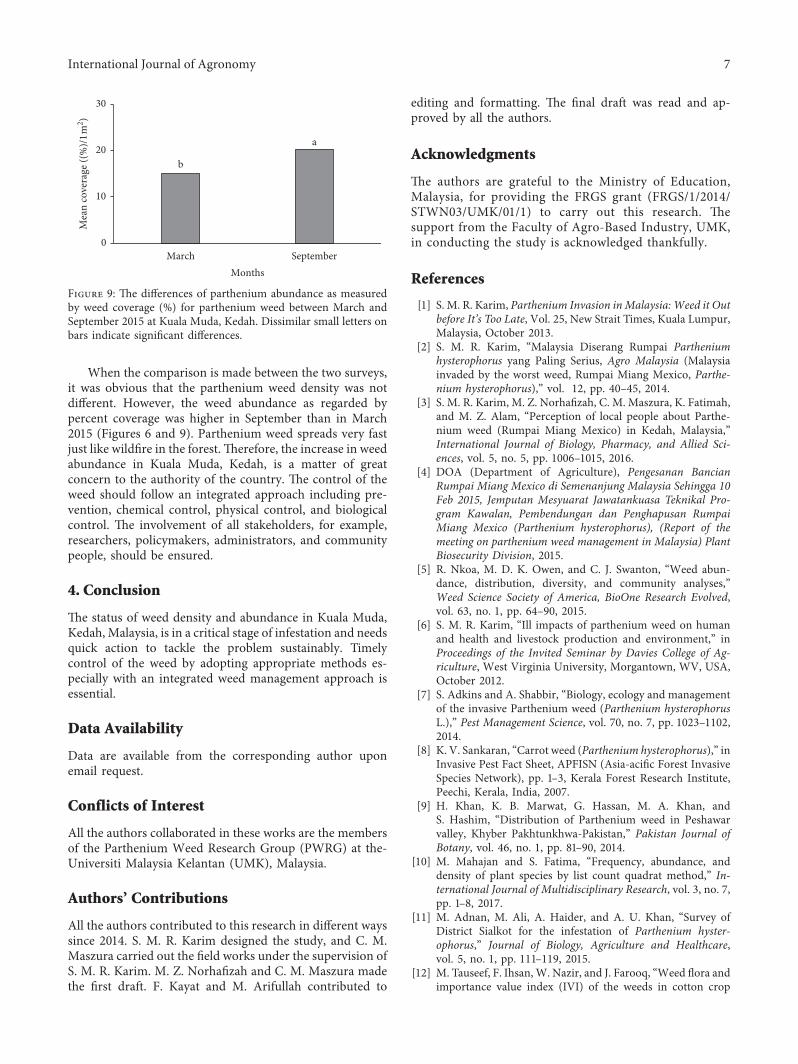
When the comparison is made between the two surveys,it was obvious that the parthenium weed density was notdifferent. However, the weed abundance as regarded bypercent coverage was higher in September than in March2015 (Figures 6 and 9). Parthenium weed spreads very fastjust like wildfire in the forest. (erefore, the increase in weedabundance in Kuala Muda, Kedah, is a matter of greatconcern to the authority of the country. (e control of theweed should follow an integrated approach including pre-vention, chemical control, physical control, and biologicalcontrol. (e involvement of all stakeholders, for example,researchers, policymakers, administrators, and communitypeople, should be ensured.
4. Conclusion
(e status of weed density and abundance in Kuala Muda,Kedah, Malaysia, is in a critical stage of infestation and needsquick action to tackle the problem sustainably. Timelycontrol of the weed by adopting appropriate methods es-pecially with an integrated weed management approach isessential.
Data Availability
Data are available from the corresponding author uponemail request.
Conflicts of Interest
All the authors collaborated in these works are the membersof the Parthenium Weed Research Group (PWRG) at the-Universiti Malaysia Kelantan (UMK), Malaysia.
Authors’ Contributions
All the authors contributed to this research in different wayssince 2014. S. M. R. Karim designed the study, and C. M.Maszura carried out the field works under the supervision ofS. M. R. Karim. M. Z. Norhafizah and C. M. Maszura madethe first draft. F. Kayat and M. Arifullah contributed to
editing and formatting. (e final draft was read and ap-proved by all the authors.
Acknowledgments
(e authors are grateful to the Ministry of Education,Malaysia, for providing the FRGS grant (FRGS/1/2014/STWN03/UMK/01/1) to carry out this research. (esupport from the Faculty of Agro-Based Industry, UMK,in conducting the study is acknowledged thankfully.
References
[1] S. M. R. Karim, Parthenium Invasion in Malaysia: Weed it Outbefore It’s Too Late, Vol. 25, New Strait Times, Kuala Lumpur,Malaysia, October 2013.
[2] S. M. R. Karim, “Malaysia Diserang Rumpai Partheniumhysterophorus yang Paling Serius, Agro Malaysia (Malaysiainvaded by the worst weed, Rumpai Miang Mexico, Parthe-nium hysterophorus),” vol. 12, pp. 40–45, 2014.
[3] S. M. R. Karim, M. Z. Norhafizah, C. M. Maszura, K. Fatimah,and M. Z. Alam, “Perception of local people about Parthe-nium weed (Rumpai Miang Mexico) in Kedah, Malaysia,”International Journal of Biology, Pharmacy, and Allied Sci-ences, vol. 5, no. 5, pp. 1006–1015, 2016.
[4] DOA (Department of Agriculture), Pengesanan BancianRumpai Miang Mexico di Semenanjung Malaysia Sehingga 10Feb 2015, Jemputan Mesyuarat Jawatankuasa Teknikal Pro-gram Kawalan, Pembendungan dan Penghapusan RumpaiMiang Mexico (Parthenium hysterophorus), (Report of themeeting on parthenium weed management in Malaysia) PlantBiosecurity Division, 2015.
[5] R. Nkoa, M. D. K. Owen, and C. J. Swanton, “Weed abun-dance, distribution, diversity, and community analyses,”Weed Science Society of America, BioOne Research Evolved,vol. 63, no. 1, pp. 64–90, 2015.
[6] S. M. R. Karim, “Ill impacts of parthenium weed on humanand health and livestock production and environment,” inProceedings of the Invited Seminar by Davies College of Ag-riculture, West Virginia University, Morgantown, WV, USA,October 2012.
[7] S. Adkins and A. Shabbir, “Biology, ecology and managementof the invasive Parthenium weed (Parthenium hysterophorusL.),” Pest Management Science, vol. 70, no. 7, pp. 1023–1102,2014.
[8] K. V. Sankaran, “Carrot weed (Parthenium hysterophorus),” inInvasive Pest Fact Sheet, APFISN (Asia-acific Forest InvasiveSpecies Network), pp. 1–3, Kerala Forest Research Institute,Peechi, Kerala, India, 2007.
[9] H. Khan, K. B. Marwat, G. Hassan, M. A. Khan, andS. Hashim, “Distribution of Parthenium weed in Peshawarvalley, Khyber Pakhtunkhwa-Pakistan,” Pakistan Journal ofBotany, vol. 46, no. 1, pp. 81–90, 2014.
[10] M. Mahajan and S. Fatima, “Frequency, abundance, anddensity of plant species by list count quadrat method,” In-ternational Journal of Multidisciplinary Research, vol. 3, no. 7,pp. 1–8, 2017.
[11] M. Adnan, M. Ali, A. Haider, and A. U. Khan, “Survey ofDistrict Sialkot for the infestation of Parthenium hyster-ophorus,” Journal of Biology, Agriculture and Healthcare,vol. 5, no. 1, pp. 111–119, 2015.
[12] M. Tauseef, F. Ihsan, W. Nazir, and J. Farooq, “Weed flora andimportance value index (IVI) of the weeds in cotton crop
0
10
20
30
March September
Mea
n co
vera
ge ((
%)/
1m2 )
Months
b
a
Figure 9: (e differences of parthenium abundance as measuredby weed coverage (%) for parthenium weed between March andSeptember 2015 at Kuala Muda, Kedah. Dissimilar small letters onbars indicate significant differences.
International Journal of Agronomy 7

fields in the region of Khanewal, Pakistan,” Pakistan Journal ofWeed Science Research, vol. 18, no. 3, pp. 319–330, 2012.
[13] A. I. Yakubu, J. Alhassan, A. Lado, and S. Sarkindiya,“Comparative weed density studies in irrigated carrot (Daucuscarota L.) Potato (Solanum tuberosum L.) and wheat (Triticumaestivum L.) in Sokoto-Rima valley, Sokoto State, Nigeria,”Journal of Plant Sciences, vol. 1, no. 1, pp. 14–21, 2006.
[14] J. Knox, D. Jaggi, and M. S. Paul, “Population dynamics ofParthenium hysterophorus (Asteraceae) and its biologicalsuppression through Cassia occidentalis (Caesalpiniaceae),”Turkish Journal of Botany, vol. 35, pp. 111–119, 2011.
[15] R. Kilewa and A. Rashid, “Distribution of invasive weedParthenium hysterophorus in natural and agro-ecosystems inArusha Tanzania,” International Journal of Science and Re-search, vol. 3, no. 12, pp. 1–4, 2014.
[16] D. Cooksey and R. Sheley,Montana NoxiousWeed Survey andMapping System, MSU Extension Service MT199613 AG 7,Bozeman, MT, USA, 2002.
[17] Z. Philippoff and E. Cox,Measuring Abundance: Transects andQuadrats, University of Hawaii, Honolulu, HI, USA, 2017.
[18] U. S. Department of Interior, Guidelines for CoordinatedManagement of Noxious Weeds: Development of WeedManagement Areas, National Park Service, and U.S. ForestService, Bureau of LandManagement, Washington, DC, USA,2001.
[19] M. Worku, “Prevalence and distribution survey of an invasivealien weed (Parthenium hysterophorus L.) in Sheka Zone,Southwestern Ethiopia,” African Journal of Agricultural Re-search, vol. 5, no. 9, pp. 922–927, 2010.
[20] S. M. Masum, M. Hasanuzzaman, and M. H. Ali, “(reats ofParthenium hysterophorus on agroecosystems and its man-agement: a review,” International Journal of Agriculture andCrop Science, vol. 6, no. 11, pp. 684–697, 2013.
[21] S. Ayele, L. Nigatu, T. Tana, and S. W. Adkins, “Impact ofParthenium weed (Parthenium hysterophorus L.) on theabove-ground and soil seed bank communities of Rangelandsin Southeast Ethiopia,” International Research Journal ofAgricultural Science and Soil Science, vol. 3, no. 7, pp. 262–274,2013.
[22] S. K. Upadhyay, M. Ahmad, and A. Singh, “Ecological impactsof weed (Parthenium hysterophorus L.) on saline soil,” In-ternational Journal of Scientific and Research Publications,vol. 3, no. 4, pp. 1–4, 2013.
8 International Journal of Agronomy

Nutrition and Metabolism
Journal of
Hindawiwww.hindawi.com Volume 2018
Hindawiwww.hindawi.com Volume 2018
Food ScienceInternational Journal of
Hindawiwww.hindawi.com Volume 2018
International Journal of
Microbiology
Hindawi Publishing Corporation http://www.hindawi.com Volume 2013Hindawiwww.hindawi.com
The Scientific World Journal
Volume 2018
Hindawiwww.hindawi.com
Applied &EnvironmentalSoil Science
Volume 2018
AgricultureAdvances in
Hindawiwww.hindawi.com Volume 2018
PsycheHindawiwww.hindawi.com Volume 2018
BiodiversityInternational Journal of
Hindawiwww.hindawi.com Volume 2018
Scienti�caHindawiwww.hindawi.com Volume 2018
GenomicsInternational Journal of
Hindawiwww.hindawi.com Volume 2018
Plant GenomicsInternational Journal of
Hindawiwww.hindawi.com Volume 2018
Biotechnology Research International
Hindawiwww.hindawi.com Volume 2018
Forestry ResearchInternational Journal of
Hindawiwww.hindawi.com Volume 2018
BotanyJournal of
Hindawiwww.hindawi.com Volume 2018
EcologyInternational Journal of
Hindawiwww.hindawi.com Volume 2018
Veterinary Medicine International
Hindawiwww.hindawi.com Volume 2018
Cell BiologyInternational Journal of
Hindawiwww.hindawi.com Volume 2018
Hindawiwww.hindawi.com Volume 2018
BioMed Research International
Agronomy
Hindawiwww.hindawi.com Volume 2018
International Journal of
Submit your manuscripts atwww.hindawi.com


![PlasticityofTillerDynamicsinWildRiceOryzarufipogonGriff ...downloads.hindawi.com/journals/ija/2011/543237.pdf · cereals [3]. Hence for cultivated rice, the wild species of Oryza](https://static.fdocuments.us/doc/165x107/604d5efdafce9f31563c314f/plasticityoftillerdynamicsinwildriceoryzarufipogongriff-cereals-3-hence-for.jpg)


