Distributional Analysis and...
38
Distributional Analysis and Inequality HMRC-HMT Economics of Taxation http://darp.lse.ac.uk/HMRC-HMT Frank Cowell, 7 December 2015
Transcript of Distributional Analysis and...

Distributional Analysis and Inequality
HMRC-HMT Economics of Taxation http://darp.lse.ac.uk/HMRC-HMT Frank Cowell, 7 December 2015

Overview...
Inequality basics
Social welfare
Ranking
Evidence
Distributional analysis & inequality
Figuring out inequality from first principles
2 7 Dec 2015 Frank Cowell: Economics of Taxation 9.1 2

Distributional analysis • Covers a broad class of economic problems
• inequality • social welfare • poverty
• Similar techniques • rankings • measures
• Four basic components need to be clarified • “income” concept… • “income receiving unit” concept • a distribution • method of assessment or comparison
• See Cowell (2000, 2008, 2011, 2016), Sen and Foster (1997)
7 Dec 2015 Frank Cowell: Economics of Taxation 9.1 3

Irene’s income 0 45°
Income distributions n = 2
µ(x)
xi
xj
Jane
t’s in
com
e
• x
µ1
• x′
7 Dec 2015 Frank Cowell: Economics of Taxation 9.1 4
1
1( )n
ii
xn
µ=
:= ∑x

Income distributions n = 3
xi
xk
xj
0
x • µ1
•
A representation with 3 incomes
Income distributions with given total
income distribution x
Equal income distributions
7 Dec 2015 Frank Cowell: Economics of Taxation 9.1 5

A fundamental question • What makes a “good” set of principles? • There is no such thing as a “right” or “wrong” axiom. • However axioms could be appropriate or inappropriate
• Need some standard of “reasonableness” • For example, how do people view income distribution comparisons?
• Use a simple framework to list some of the basic axioms • Assume a fixed population of size n. • Assume that individual utility can be measured by x • Income normalised by equivalence scales
• Follow the approach of Amiel-Cowell (1999) Appendix A
7 Dec 2015 Frank Cowell: Economics of Taxation 9.1 6

Inequality axioms (1)
• 1 Anonymity. Suppose x′ is a permutation of x. Then: I(x′) = I(x)
• 2 Population principle. I(x) ≥ I(y) ⇒ I(x,x,…,x) ≥ I(y,y,…,y)
• 3 Transfer principle. (Dalton 1920) Suppose xi< xj then, for small δ:
I(x1,x2..., xi+ δ,..., xj− δ,..., xn) < I(x1,x2,..., xi,..., xn)
7 Dec 2015 Frank Cowell: Economics of Taxation 9.1 7

(v)
(iv)
Income distributions n = 3 (close-up)
[Karen]
[Janet]
[Irene]
(ii) (iii)
(vi)
• x • (i)
7 Dec 2015 Frank Cowell: Economics of Taxation 9.1 8

x′
x and x′ cannot be ranked
[Karen]
[Janet]
[Irene]
• x
•
7 Dec 2015 Frank Cowell: Economics of Taxation 9.1 9

Two contour maps
7 Dec 2015 Frank Cowell: Economics of Taxation 9.1 10
Gini 21 1
1( ) | |2 ( )
n n
i ji j
I x xn µ = =
:= − .∑∑xxCV
var( )( )
( )I
µ:= .
xx
x
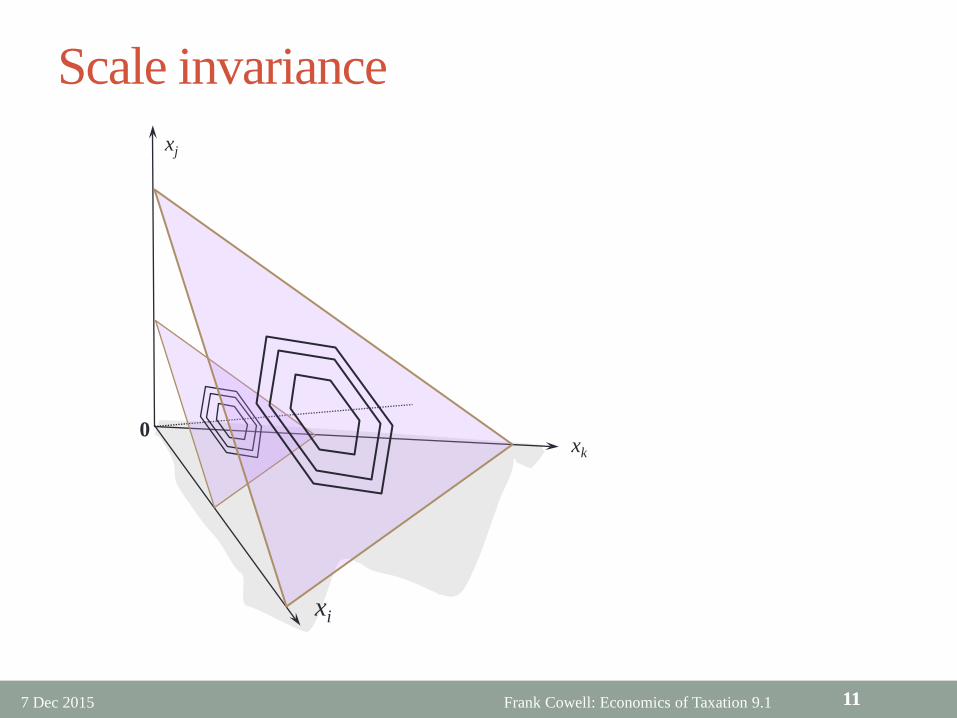
Scale invariance
xi
xk
xj
0
11 7 Dec 2015 Frank Cowell: Economics of Taxation 9.1 11

Inequality axioms (2)
• 4 Decomposability. Suppose x' is formed by joining x with z and y' is formed by joining y with z. Then :
I(x) ≥ I(y) ⇒ I(x') ≥ I(y') • 5 Scale invariance. For λ > 0: I(x) ≥ I(y) ⇒ I(λx) ≥ I(λy) • 6 Translation invariance. I(x) ≥ I(y) ⇒ I(x+1δ) ≥ I(y+1δ) • Axioms 1-5 yield the Generalised Entropy class of indices
• Axioms 1-4 + 6 yield the Kolm class + variance
7 Dec 2015 Frank Cowell: Economics of Taxation 9.1 12
[ ]( )K
1
1 1( ) log in
x
iI e
nβ µβ
β
−
=
:= ∑ xx
GE 21
1 1( ) 1( )
ni
i
xIn
αα
α α µ=
= − −
∑xx

Generalised Entropy measures • Defines a class of inequality measures, given parameter α :
• GE class is rich. Some important special cases • for α < 1 it is ordinally equivalent to Atkinson (α = 1 – ε ) • α = 0: (mean logarithmic deviation) • α = 1: (the Theil index)
• or α = 2 it is ordinally equivalent to (normalised) variance. • Parameter α can be assigned any positive or negative value
• indicates sensitivity of each member of the class • α large and positive gives a “top-sensitive” measure • α negative gives a “bottom-sensitive” measure • each α gives a specific distance concept
7 Dec 2015 Frank Cowell: Economics of Taxation 9.1 13
GE 21
1 1( ) 1( )
ni
i
xIn
αα
α α µ=
= − −
∑xx
0 1GE 1( ) log( ( ))n
i inI x µ=:= − ∑ /x x1 1GE 1( ) [ ( )]log( ( ))n
i i inI x xµ µ== ∑ / /x x x

Generalised Entropy
7 Dec 2015 Frank Cowell: Economics of Taxation 9.1 14

0
xi
xk
xj
x* •
µ1 •
xi
xk
xj
0
Scale or translation independence?
µ1 •
x* •
15 7 Dec 2015 Frank Cowell: Economics of Taxation 9.1 15

Inequality basics
Overview...
Social welfare
Ranking
Evidence
Distributional analysis & inequality
Connecting with Social values
16 7 Dec 2015 Frank Cowell: Economics of Taxation 9.1 16

Social-welfare functions • A standard approach to a method of assessment • Basic tool is a social welfare function (SWF)
• Maps set of distributions into the real line W = W(x) • I.e. for each distribution we get one specific number
• Properties will depend on economic principles • Simple example of a SWF: W = Σι xi • Principles on which SWF could be based?
• use counterparts of inequality axioms • “reverse them” so welfare increases as inequality decreases • also…
• Monotonicity. W(x1,x2..., xi+δ,..., xn) > W(x1,x2,..., xi,..., xn)
7 Dec 2015 Frank Cowell: Economics of Taxation 9.1 17

xi
xk
xj
0
Social welfare and income growth
18
xk
xi
xj
0
µ1 •
x •
µ1 •
W(x + dx) > W(x)
x •
(a) (b)
7 Dec 2015 Frank Cowell: Economics of Taxation 9.1 18

Classes of SWFs • Anonymity and population principle:
• can write SWF in either Irene-Janet form or F form • may need to standardise for needs etc
• Introduce decomposability • get class of Additive SWFs 𝔚: • W(x) = Σι u(xi) • or equivalently W(F) = ∫ u(x) dF(x)
• If we impose monotonicity we get • 𝔚1 ⊂ 𝔚: u(•) increasing
• If we further impose the transfer principle we get • 𝔚2 ⊂ 𝔚1: u(•) increasing and concave
7 Dec 2015 Frank Cowell: Economics of Taxation 9.1 19

0 x
u(x)
0 x
u(x)
Evaluation functions u
(a) (b)
7 Dec 2015 Frank Cowell: Economics of Taxation 9.1 20

SWF and inequality
0 xi
xj
ξ(x) µ(x)
• x
• µ1 • ξ1
7 Dec 2015 Frank Cowell: Economics of Taxation 9.1 21
The Irene &Janet diagram A given distribution Distributions with same mean Contours of the SWF Construct an equal distribution with same social welfare Equally-Distributed Equivalent income Social waste from inequality
Curvature of contour indicates society’s willingness to tolerate “efficiency loss” in pursuit of greater equality
contour: x values such that W(x) = const
Inequality ( )1( )
− .ξµ
xx

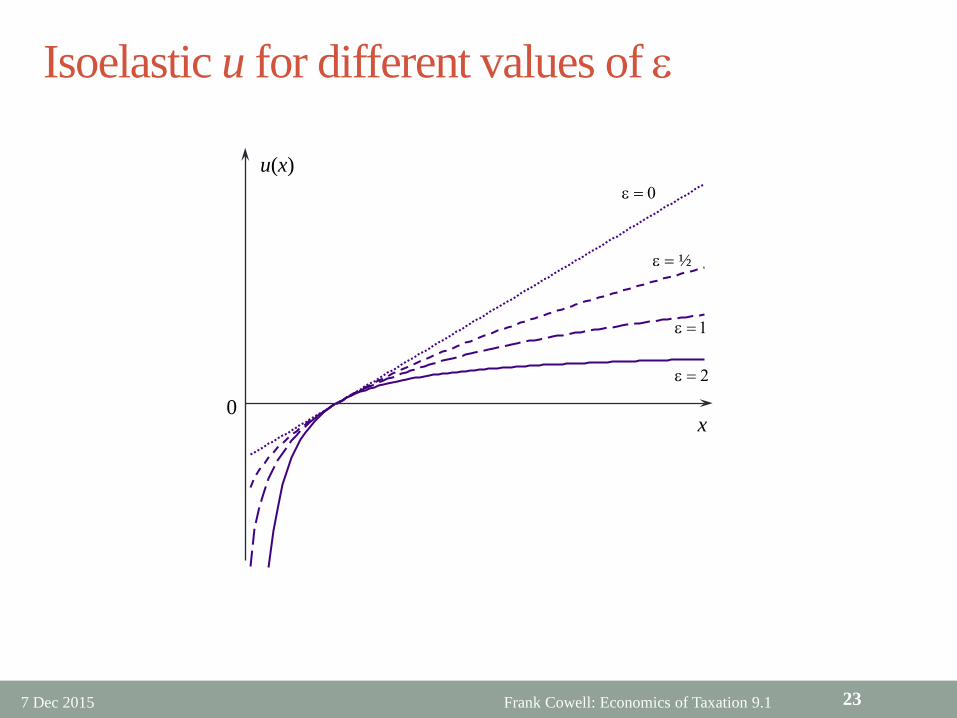
An important family • Take the W2 subclass and impose scale invariance. • Get the family of SWFs where u is iso-elastic: x 1 – ε – 1 u(x) = ————— , ε ≥ 0 1 – ε
• has same form as CRRA utility function • Parameter ε captures society’s inequality aversion.
• Similar to individual risk aversion ( Atkinson 1970)
7 Dec 2015 Frank Cowell: Economics of Taxation 9.1 22
111
A1
1( ) 1 .( )
ni
i
xIn
εεε
µ
−−
=
:= −
∑x
x
11
1
1
1( ) 0n
ii
xn
εεξ ε
− −
=
= , >∑x
0
ε = ½
ε = 0
ε = 1
ε = 2
x
u(x)
Isoelastic u for different values of ε
7 Dec 2015 Frank Cowell: Economics of Taxation 9.1 23

Inequality basics
Overview...
Social welfare
Ranking
Evidence
Distributional analysis & inequality
Alternative approaches within Distributional Analysis
24 7 Dec 2015 Frank Cowell: Economics of Taxation 9.1 24
Ranking and dominance • Introduce two simple concepts
• first illustrate using the Irene-Janet representation • take income vectors x and y for a given n
• First-order dominance: • y[1] > x[1], y[2] > x[2], y[3] > x[3] • Each ordered income in y larger than that in x
• Second-order dominance: • y[1] > x[1], y[1]+y[2] > x[1]+x[2], y[1]+y[2] +…+ y[n] > x[1]+x[2] …+ x[n] • Each cumulated income sum in y larger than that in x
• Generalise this a little • represent distributions in F-form (anonymity, population principle) • q: population proportion (0 ≤ q ≤ 1) • F(x): proportion of population with incomes ≤ x • µ(F): mean of distribution F
7 Dec 2015 Frank Cowell: Economics of Taxation 9.1 25

1st-Order approach • Basic tool is the quantile, expressed as
Q(F; q) := inf {x | F(x) ≥ q} = xq • “smallest income such that cumulative frequency is at least as great as q”
• Use this to derive a number of intuitive concepts Parade
• Also to characterise the idea of 1st-order (quantile) dominance: • “G quantile-dominates F” means:
• for every q, Q(G;q) ≥ Q(F;q), • for some q, Q(G;q) > Q(F;q)
• A fundamental result: • G quantile-dominates F iff W(G) > W(F) for all W∈𝔚1
7 Dec 2015 Frank Cowell: Economics of Taxation 9.1 26

Parade and 1st-order dominance
F
G
Q(.; q)
1 0 q
Plot quantiles against proportion of population
Parade for distribution F again
Parade for distribution G
In this case G clearly quantile-dominates F But (as often happens) what if it doesn’t? Try second-order method
7 Dec 2015 Frank Cowell: Economics of Taxation 9.1 27

2nd-Order approach
• Basic tool is the income cumulant, expressed as C(F; q) := ∫ Q(F; q) x dF(x) • “The sum of incomes in the Parade, up to and including position q”
• Use this to derive a number of intuitive concepts • the “shares” ranking, Gini coefficient • graph of C is the generalised Lorenz curve
• Also to characterise the idea of 2nd-order (cumulant) dominance: • “G cumulant-dominates F” means:
• for every q, C(G;q) ≥ C(F;q), • for some q, C(G;q) > C(F;q)
• A fundamental result (Shorrocks 1983): • G cumulant-dominates F iff W(G) > W(F) for all W∈𝔚2
7 Dec 2015 Frank Cowell: Economics of Taxation 9.1 28

GLC and 2nd-order dominance
1 0
0
C(G; . )
C(F; . )
C(.; q)
µ(F)
µ(G)
q
cum
ulat
ive
inco
me
Plot cumulations against proportion of population
GLC for distribution F
GLC for distribution G
Intercept on vertical axis is at mean income
7 Dec 2015 Frank Cowell: Economics of Taxation 9.1 29

2nd-Order approach (continued)
• The share of the proportion q of distribution F is L(F;q) := C(F;q) / µ(F) • “income cumulation at q divided by total income”
• Yields Lorenz dominance, or the “shares” ranking: • “G Lorenz-dominates F” means:
• for every q, L(G;q) ≥ L(F;q), • for some q, L(G;q) > L(F;q)
• Another fundamental result (Atkinson 1970): • For given µ, G Lorenz-dominates F iff W(G) > W(F) for all W∈𝔚2
7 Dec 2015 Frank Cowell: Economics of Taxation 9.1 30
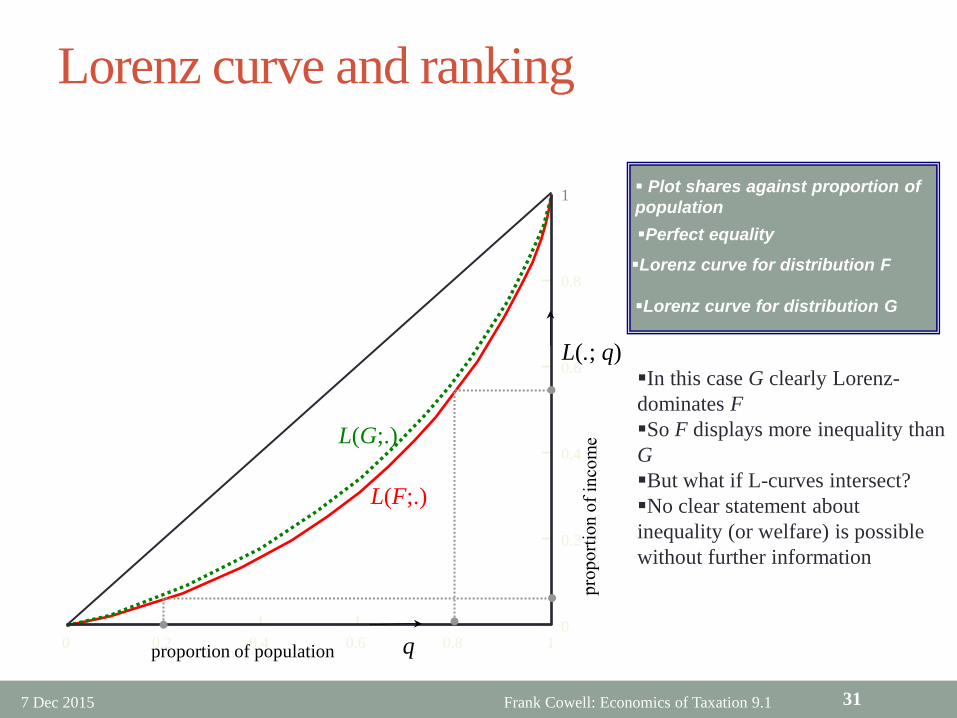
Lorenz curve and ranking
0 0.2 0.4 0.6 0.8 1 0
0.2
0.4
0.6
0.8
1
proportion of population
L(G;.)
L(F;.)
L(.; q)
q
Plot shares against proportion of population
Lorenz curve for distribution F
Lorenz curve for distribution G
In this case G clearly Lorenz-dominates F So F displays more inequality than G But what if L-curves intersect? No clear statement about inequality (or welfare) is possible without further information
Perfect equality
7 Dec 2015 Frank Cowell: Economics of Taxation 9.1 31

Lorenz curves for different types of data
0
(a)
0
(b)
0
(c)
• (a) non-negative incomes
• (b) some negative incomes, but positive mean
• (c) many negative incomes and negative mean
7 Dec 2015 Frank Cowell: Economics of Taxation 9.1 32

Inequality basics
Overview...
Social welfare
Ranking
Evidence
Distributional analysis & inequality
Attitudes and perceptions
33 7 Dec 2015 Frank Cowell: Economics of Taxation 9.1 33

Views on distributions
• Do people make distributional comparisons in the same way as economists?
• Summarised from Amiel-Cowell (1999) • examine proportion of responses in conformity with standard axioms • both directly in terms of inequality and in terms of social welfare
Inequality SWF Num Verbal Num Verbal Anonymity 83% 72% 66% 54% Population 58% 66% 66% 53% Decomposability 57% 40% 58% 37% Monotonicity - - 54% 55% Transfers 35% 31% 47% 33% Scale indep. 51% 47% - -
7 Dec 2015 Frank Cowell: Economics of Taxation 9.1 34

Inequality aversion • Are people averse to inequality?
• evidence of both inequality and risk aversion (Carlsson et al 2005) • risk-aversion as proxy for inequality aversion? (Cowell and Gardiner 2000)
• What value for ε? • affected by way the question is put? (Pirttilä and Uusitalo 2010) • high values of risk aversion from survey evidence Barsky et al 1997) • lower values of risk aversion from savings analysis (Blundell et al 1994) • from happiness studies 1.0 to 1.5 (Layard et al 2008) • related to the extent of inequality in the country? (Lambert et al 2003) • perhaps a value of around 0.7 – 2 is reasonable (HM Treasury 2011 pp 93-94)
7 Dec 2015 Frank Cowell: Economics of Taxation 9.1 35

Conclusion • Axiomatisation of inequality or welfare can be
accomplished using just a few basic principles • Ranking criteria can provide broad judgments • But may be indecisive, so specific SWFs could be used
• What shape should they have? • How do we specify them empirically?
• Several axioms survive scrutiny in experiment • but Transfer Principle often rejected
7 Dec 2015 Frank Cowell: Economics of Taxation 9.1 36
References (1) • Amiel, Y. and Cowell, F.A. (1999) Thinking about Inequality, Cambridge University Press • Atkinson, A. B. (1970) “On the Measurement of Inequality,” Journal of Economic Theory, 2,
244-263 • Barsky, R. B., Juster, F. T., Kimball, M. S. and Shapiro, M. D. (1997) “Preference parameters
and behavioral heterogeneity: An Experimental Approach in the Health and Retirement Survey,” Quarterly Journal of Economics, 112, 537-579
• Blundell, R., Browning, M. and Meghir, C. (1994) “Consumer Demand and the Life-Cycle Allocation of Household Expenditures,” Review of Economic Studies, 61, 57-80
• Carlsson, F., Daruvala, D. and Johansson-Stenman, O. (2005) “Are people inequality averse or just risk averse?” Economica, 72,
• Cowell, F. A. (2000) “Measurement of Inequality,” in Atkinson, A. B. and Bourguignon, F. (eds) Handbook of Income Distribution, North Holland, Amsterdam, Chapter 2, 87-166
• * Cowell, F.A. (2008) “Inequality: measurement,” The New Palgrave, second edition • * Cowell, F.A. (2011) Measuring Inequality, Oxford University Press • Cowell, F.A. (2016) “Inequality and Poverty Measures”, in Oxford Handbook of Well-Being
And Public Policy, edited by Matthew D. Adler and Marc Fleurbaey • Cowell, F.A. and Gardiner, K.A. (2000) “Welfare Weights”, OFT Economic Research Paper
202, Office of Fair Training, Salisbury Square, London
7 Dec 2015 Frank Cowell: Economics of Taxation 9.1 37

References (2)
• Dalton, H. (1920) “Measurement of the inequality of incomes,” The Economic Journal, 30, 348-361
• HM Treasury (2011) The Green Book: Appraisal and Evaluation in Central Government (and Technical Annex), TSO, London
• Lambert, P. J., Millimet, D. L. and Slottje, D. J. (2003) “Inequality aversion and the natural rate of subjective inequality,” Journal of Public Economics, 87, 1061-1090.
• Layard, P. R. G., Mayraz, G. and Nickell S. J. (2008) “The marginal utility of income,” Journal of Public Economics, 92, 1846-1857.
• Pen, J. (1971) Income Distribution, Allen Lane, The Penguin Press, London • Pirttilä, J. and Uusitalo, R. (2010) “A ‘Leaky Bucket’ in the Real World: Estimating
Inequality Aversion using Survey Data,” Economica, 77, 60–76 • Sen, A. K. and Foster, J. E. (1997) On Economic Inequality (Second ed.). Oxford:
Clarendon Press. • Shorrocks, A. F. (1983) “Ranking Income Distributions,” Economica, 50, 3-17
7 Dec 2015 Frank Cowell: Economics of Taxation 9.1 38