Distribution this document unlimited. CONSTITUTIONAL · PDF fileDistribution of this document...
29
Distribution of this document is unlimited. CONSTITUTIONAL AND ENVIRONMENTAL FACTORS RELATED TO SERUM LIPID AND LIPOPROTEIN LEVELS* William R. Harlan, Jr., Albert Oberman, Robert E. Mitchell, Ashton Graybiel, and Robert J. Wherry, Jr. Bureau of Medicine and Surgery MF022.03.02-5007.14 NASA Order R- 136 Released b y Capiuin H. C. Hunley, MC USN Commanding OfFtcer 2 March 1967 *This research was conducted under the sponsorship of the United States Public Health Service, and National Aeronautics and Space Administration. NAVAL AEROSPACE MEDICAL INSTITUTE NAVAL AEROSPACE MEDICAL CENTER PENSACOLA, FLORIDA 32512 https://ntrs.nasa.gov/search.jsp?R=19670020736 2018-05-24T07:05:57+00:00Z
Transcript of Distribution this document unlimited. CONSTITUTIONAL · PDF fileDistribution of this document...

Distribution of this document i s unlimited.
CONSTITUTIONAL AND ENVIRONMENTAL FACTORS RELATED TO
SERUM LIPID AND LIPOPROTEIN LEVELS*
William R. Harlan, Jr., Albert Oberman, Robert E. Mitchell, Ashton Graybiel, and Robert J. Wherry, Jr.
Bureau of Medicine and Surgery MF022.03.02-5007.14
NASA Order R- 136
Released by
Capiuin H. C. Hunley, MC USN Commanding OfFtcer
2 March 1967
*This research was conducted under the sponsorship of the United States Public Health Service, and National Aeronautics and Space Administration.
NAVAL AEROSPACE MEDICAL INSTITUTE NAVAL AEROSPACE MEDICAL CENTER
PENSACOLA, FLORIDA 32512
https://ntrs.nasa.gov/search.jsp?R=19670020736 2018-05-24T07:05:57+00:00Z
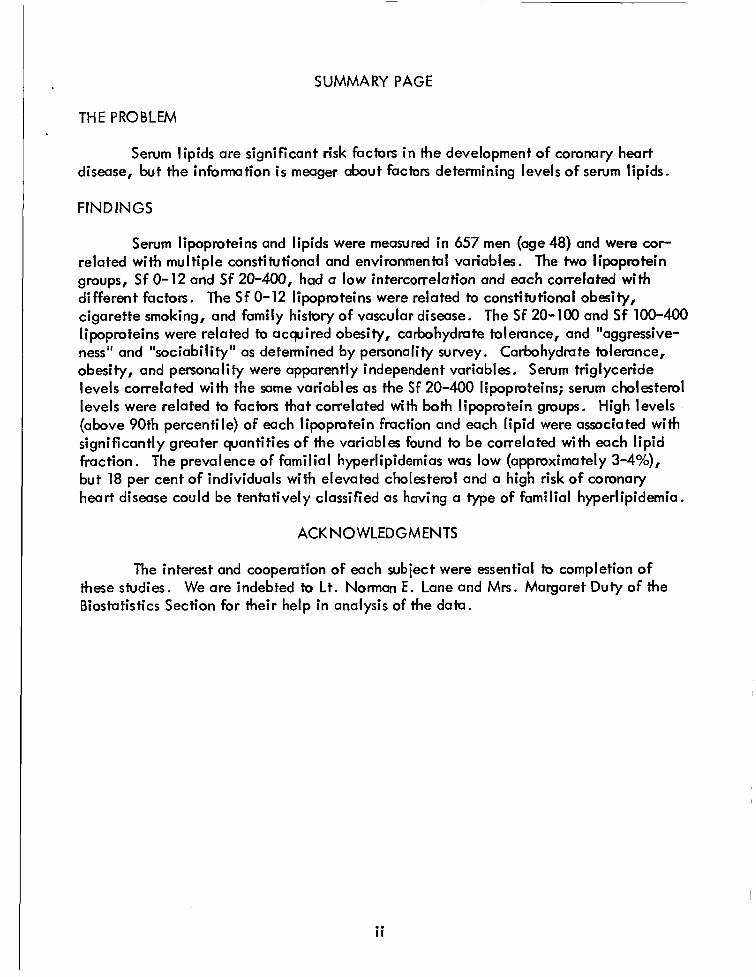
SUMMARY PAGE 1 . ~ THEPROBLEM I
Serum lipids are significant risk factors i n the development of coronary heart disease, but the information i s meager about factors determining levels o f serum lipids.
I FINDINGS
Serum lipoproteins and lipids were measured in 657 men (age 48) and were cor- related with multiple constitutional and environmental variables. The two lipoprotein groups, S f 0-12 and S f 20-400, had a low intercorrelation and each correlated with different factors. The S f 0-12 lipoproteins were related to constitutional obesity, cigarette smoking, and family history of vascular disease. The Sf 20-100 and S f 100-400 lipoproteins were related to acquired obesity, carbohydm te tolerance, and "aggressive- ness" and I'sociability'' as determined by personality survey. Carbohydrate tolernnce, obesity, and personality were apparently independent variables. Serum triglyceride levels correlated with the same variables as the S f 20-400 lipoproteins; serum cholesterol levels were related to factors that correlated with both lipoprotein gmups. High levels (above 90th percentile) of each lipoprotein fraction and each lipid were associated with significantly greater quantities o f h e variables found to be correlated with each lipid fraction. The prevalence of familial hyperlipidemias was low (approximately 3-4%), but 18 per cent of individuals with elevated cholesterol and a high risk of coronary heart disease could be tentatively classified as having a type of familial hyperlipidemia.
ACKNOWLEDGMENTS
The interest and cooperation of each subject were essential to completion o f these studies. We are indebted to Lt. Norman E. Lane and Mrs. Margaret Duty of the
.. II

INTRODUCTION
Despite the important association between elevated plasma lipids and the devel- opment of coronary heart disease, there i s a surprising lack of information relating plasma lipid levels to specific genetic and environmental factors. The striking differ- erences in plasma lipids between populations with environments that are widely diver- gent are readily explained by dietary and other ecological differences. However, these factors are relatively homogenous within population groups, particularly in this country, and individual differences in l ipid levels cannot be accounted for by ecological differ- ences. Constitutional and environmental facton are primarily responsible for these differences (1-3), but few of these have been identified and quantified in the general population. The majority of studies have focused on the influence of one factor or studied a single l ipid measurement, usually cholesterol. Moreover, these studies were usually confined to special segments of the population, often those with disease, or hospitalized patients. The present investigation examines the relationships between serum lipids and a variety of factors, both hereditary and environmental, in a group of men who have been studied extensively for 24 years.
These men, former naval aviation cadets, have been examined periodically since age 24, and during the last two examim tions in 1958 and 1964, serum lipids and lipo- proteins were measured. Their average age i n 1964 was 48 years (*2.1 years), and although not a cross-sectional sample o f the general population, they are generally charncteristic of middle-class, middle-aged American men who are particularly suscepti- ble to coronary heart disease. Data acquired in these examinations were used to deter- mine the frequency of various lipid patterns, and these lipid patterns were correlated i n turn with other parameters, including family history, somatotype, personality assessment, obesity, exercise, carbohydtute tolerance, and smoking. This i s the first comprehensive study in which a l l of the factors suspected o f influencing lipids have been evaluated in each member of a population unselected for a particular characteristic and the only study to relate these factors to a complete lipid profile.
Particular emphasis was directed to relationships between these variables and lipoproteins; though serum lipids were assessed, lipoproteins represent the physiologic form in which plasma lipid i s ttansported. Two lipoprotein groups are of particular importance in atherogensis: the S f 0-12 (beta) lipoproteins which contain cholesterol and phospholipid, and the S f 20-100, S f 100-400 (pre-beta) lipoproteins which contain primarily triglyceride, but also contain significant amounts of cholesterol and phospho- lipid. These lipoprotein groups are related to different metabolic processes, have a low intercorrelation (r = .09), and thus may be treated as independent variables. On the other hand, serum cholesterol and triglyceride are closely related (r = 0.44, p < .OOl) and cannot be considered as independent variables. Furthermore, the familial hyper- lipidemias, which may be particularly important in coronary heart disease, are best de- fined by lipoprotein analysis (4). The present report also presents a preliminary evalua- tion o f the variability of serum lipids and o f their relationship to coronary artery disease.
1

PROCEDURE
COMPOSITION OF THE GROUP
The siudy group i s composed of survivors of a group of 1056 men who were phys- ical ly qualified for naval flight training in 1940. They were examined in 1940 (mean age 24 years), 1952 (36 years), 1958 (42 years), and 1964 (48 years). A history, phys- ical examination, chest x-ray, and electrocardiogram were obtained on each examina- tion. General aspects o f these examinations and studies of electrocardiograms and blood pressure have been reported (5-8). Ninety-six per cent o f the survivors were re- examined in 1958, and 84 per cent i n 1964. Of those not examined i n 1964, medical histories were available on a l l but four who are considered lost to follow-up. Eighty per cent of the group were scored between 24 and 37 on the social scale described by McGuire and White (9); th is indicates that the majority correspond to middle-class American men. Slightly less than half have continued a career i n the military or i n flying.
PERTINENT ASPECTS OF HISTORY AND PHYSICAL EXAMINATION
Complete information on testing procedures, analysis of results, and frequency distribution o f variables are available (8, lo), and only aspects pertinent to the present analysis are described here.
Special attention was directed toward obtaining an accurate family history, especially of cardiovascular disease. A "pseudovariable" was constructed by ranking these data in the following manner: death from cardiovascular disease, history of cardio- vascular disease, death from cancer or other causes, healthy. The histories of mother, father, and siblings were evaluated separately. Cigarette smoking was evaluated during the 1964 examination both as to amount and to duration; there was a close correlation of these items. The amount o f cigarette smoking was categorized i n the following way: nonsmokers and pipe or cigar smokers, 1-19 cigarettes/day, 20/day, 21-39/dayf 40 or more/day. The consumption o f alcohol was coded similarly: never drink, rarely drink, drink once or twice/week, one drink/day, two or three drinks/day, more than three drinks/day, and problem with alcohol. Physical activity was quantified using a ques- tionnaire designed to evaluate activity during work hours and leisure hours (8). Weight was recorded to the nearest pound and height to the nearest tenth o f an inch. Several blood pressure measurements were obtained, but "casual I' supine blood pressures recorded during the 1964 examination were utilized for these present analyses.
PHYS IO LOGICAL AND PSYCHO LOG ICAL M EASUREMENTS
During the examinations in 1940 and 1964, nude photographs were taken of each subject for detemina tion o f somatotype (1 1). Photographs from both examinations were scored by Dr. Albert Damon. The scores from the examination i n 1940 were utilized for the present analysis because a l l subjects were at ideal weight and structural features were less likely to be obscured by obesity or by changes due to aging. The subject was
2

rated on the following components: endomorphy (visceral structure and body round- ness), mesomorphy (dominance of muscle and bone), and ectomorphy (linearity and delicacy of siwctwe). Skinfold thickness (12) was measured in 1964 with Lange calipers in b u r areas: 1) midway between the acromial process and the olecaranon ("skinfolds- arm"), 2) inferior tip of scapula ("skinfolds-back"), 3) midaxillary line at the level o f the xiphoid ("skinfolds-chest"), and 4) midaxillary line a t level of umbilicus ("skinfolds- abdomen"). The calipers were read to the nearest 0.5 millimeter, and the mean o f three determinations was recorded. Anthropometric measurements were made in 1964 and cal- culations o f lean body mass (13) and body fat were made.
Each subject completed the Guilford-Zirnrnerman Temperament Survey (14) which i s a self-administered paper and pencil test consisting of 300 questions and assessing the following personality characteristics: general activity, energy, restraint, seriousness, emotiona I stabi lity, ascendance sociali ty, objectivity, friend1 iness , thoughtful ness, personal relations, and masculinity. There i s minimal intercorrelation between the traits assessed by this test (14).
LAB0 RATORY D ETERMINATIONS
During examina tions i n 1964, blood was obtained bl lowing an overnight fast. In 1958 some subjects were not fasting, but no record was kept o f the dietary status be- cause i t was not believed to influence the concentration of lipoproteins. Therefore, the present analysis i s bused on datu from the study in 1964 when the subjects were post- absorptive. llStandad'l sewm lipoproteins were determined i n 1958 and 1964 a t the Institute of Medical Physics using the method of de Lalla and Gofman (15). Serum cholesterol was measured by the method of Abell e t al. (16) during both examinations. Serum triglyceride was measured in 1964 using the method o f Carlson and Waldstrb'm (17). Because o f methodological difficulties (probably involving inadequate activation of silica ), only the last 252 determinations o f triglyceride were considered to be suf- ficiently accurate for analysis. The laboratory performing the triglyceride and choles- terol determinations participated i n the standardization program o f the Public Health Service.
Blood b r determination o f sugar (18) was obtained in the fasting state and two hours after a 100 g-glucose meal. Although t h i s blood was placed i n tubes containing sodium fluoride, comparison of data from the first 384 subjects and from the subsequent 253 subjects indicated that the blood sugars averaged 12mg/100 ml less in the first group. Initially, these two ''series" of blood sugars were analyzed separately and com- pared. The distribution curves o f values fmm both were identical i n configuration, and there were no apparent differences between the tvm groups. The correlations between blood sugar and other variables were the same in both groups. To make the data com- parable, the blood sugars from both series were separated into 13 percentiles and the corresponding percentiles combined for analysis. Blood from fasting subjects were also analyzed for protein bound iodine (19) and for uric acid (20).
3

ANALYSIS OF DATA
Frequency distributions o f values for each lipid fraction and the multiple cor- relations o f nonlipid variables with each fraction are presented in Figures 1-5. Data from 657 individuals comprise the frequency distributions; the multiple correlations are based on data from 441 individuals on whom a l l data were available. Variables with multiple correlation coefficients significant a t the 5 per cent level or less appear i n large lettering on the Figures and variables making contributions with less statistical significance (up to 30% level) appear i n small lettering. Where the Z-score i s negative, a (-) follows the variable. i
Data were coded and analyzed on an IBM 1620 computer using standard statis- tical procedures. When distributions of a variable were found to be skewed (e.g., S f 20-100 and S f 100-400 lipoproteins), these variables were converted to the natural logarithm: f (x) = loge (x + 1); this procedure yielded a standard distribution, Corre- lation coefficients ( Pearson product-moment) were determined between each lipid measurement and 94 other Variables. Parameters having significant correlations (p < .01) were analyzed further. Multiple correlation coefficients, corrected for shrinkage in the correlation, were calculated using each lipid measurement as the cri- terion variable and relating nonlipid parameters to each, using the technique and formu- lation described by Wherry (21). This i s an iterative technique that selects at each iteration the variable making the largest addition (or explanation o f variance) unti l the level of significance of t h i s addition drops below 0.3. When twr, variables are interrelated, this program selects the variable most closely related to the criterion variable and selects the remaining variable only i f i t makes a significant contribution that i s independent o f i t s association with the first selected variable.
R ESU LTS
The Sf 0- 12 lipoproteins (p- lipoprotein), which are composed predominantly of cholesterol (51%) and phospholipid (24%) but l i t t le triglyceride (5%), were related to cigarette smoking, skinfold thickness o f the chest, uric acid, and had a negative rela- tionship to weight gained from age 24 to age 48. Although the number o f cigarettes was selected by th is analysis, the duration o f cigarette smoking also had a significant cor- relation, these variables being highly interrelated. Similarly, skinfold thickness o f the chest and back were closely related, and selection of the chest measurement excluded that of the back. However, skinfold thickness in other areas w a s not related to these lipoproteins. The minor contribution o f protein bound iodine (PBI) to the multiple cor- relation i s of interest, considering the close rela tiomhip between pathological levels of PBI and serum cholesterol.
The S f 20-100 and S f 100-400 lipoproteins are frequently combined and considered as a single fraction, the S f 20-400 lipoproteins, but each w a s evaluated separately to determine whether each might have different correlations. The correlates were similar
4
~~

loo r 80
60
40
20
IO
Sf 0-12 LIPOPROTEINS
Moon = 406 S.D.= f91
f.................
I30 240 340 470 590 670 780
mg/lOOml
V a r i ab I Cumu I a t i v e M u l t i p l e r
S M O K I N G - AMOUNT 0 . 1 4 4 S K I N F O L D S - CHEST . 1 9 8 U R I C A C I D . 2 2 1
Fast ing g lucose . 2 5 2 F a m i l y h i s t o r y - f a t h e r . 2 6 0 Mesomorphy . 2 6 7
P B I ( - ) . 2 7 8
W E I G H T G A I N 2 4 - 4 8 y r . ( - ) . 2 4 1
F a m i l y h i s t o r y - mother . 2 7 4
Figure 1
Frequency distribution o f values for Sf 0-12 (beta) lipoproteins and factors correlated with levels of these lipoproteins. Factors having correlations significant at 5 per cent level or greater are l i s ted in bold type. Skinfolds are a measurement of subcutaneous adipose tissue at the site noted. See text foroiher abbreviations and des- cription of ana lytica I methods.
5

140
I20
100
$ 00
3 Q
60
40
20
IO
Sf 20-100 LIPOPROTEINS
Mean = 109
S.Q. = f06
3 90 150 240 330 410 510 630 690
m g / 1 0 0 m l
V a r i a b l e C u m u l a t i v e M u l t i p l e r
W E I G H T G A I N 2 4 - 4 8 y r G - Z , R SCALE ( - 1 G L U C O S E - 2 h p c S K I N F O L D S - A R M ( - ) S K I N F O L D S - CHEST M E S O M O R P H Y ( - ) F A M I L Y H I S T O R Y - M O T H E R G - 2 , 5 S c a l e U r i c a c i d F a s t i n g g l u c o s e F a m i l y h i s t o r y - f a t h e r S m o k i n g - amount
0 . 2 1 5 . 2 4 0 . 2 6 7 . 2 7 9 .312 . 3 2 4 .334 .340 .345 .349 .353 .356
Figure 2
Frequency distribution o f values for S f 20-100 (pre-beta) lipopro- teins and factors correlated with levels of these lipoproteins. G-Z refers to Guilford-Zimmennan personality test; the R scale measures restraint; the S scale measures sociability.
for each of these fractions but differed from factors correlating with the S f 0-12 lipo- proteins (Figures 2 and 3). Two measurements of adiposity, weight gain and skinfold
6

I60
I 20
100
$ 80 $
60
40
Sf 100-400 LIPOPROTEINS
M
Mean = 36 S.D. = i 51
20
10
0 40 80 120 160 260 300 600 1000
mg / 100ml
Vorloblm C v m u l a t i v c M u l t i o l e r
U R I C A C I D G L U C O S E - 2 h p c
W E I G H T G A I N 2 4 - 4 8 y r . S k i n f o l d r - Arm ( - ) A l c o h o l i n t a k e F a m i l y h i s t o r y - f a t h e r M e s o m o r p h y ( - ) G - Z, 5 Scale
G - Z, R SCALE ( - )
0 . 1 8 6 . 2 4 7 . 2 7 0 . 2 8 6 - 2 9 6 1303 . 3 0 9 . 3 1 5 .320
Figure 3
Frequency distribution o f values for serum triglyceride and factors correlated with levels o f these lipoproteins. Abbreviations as noted for Figures 1 and 2.
thickness (chest), correlated independently with these lipoproteins. The negative Z- score (-) noted for arm skinfold probably indicates that th is was acting as a suppressor variable to remove variance from the more important variable, skinfold thickness o f the chest. The relationship was, therefore, primarily to truncal adiposity, and elimination o f individuals with peripheml adiposity strengthened this relationship. Similarly, mesomorphy, a measure of muscular development, had a negative Z-score and perhaps removed muscularity from the estimate o f truncal mass. This suggests that centml adi- p o s i t y and particularly that developing in middle-life i s the variable having thegreutest
7
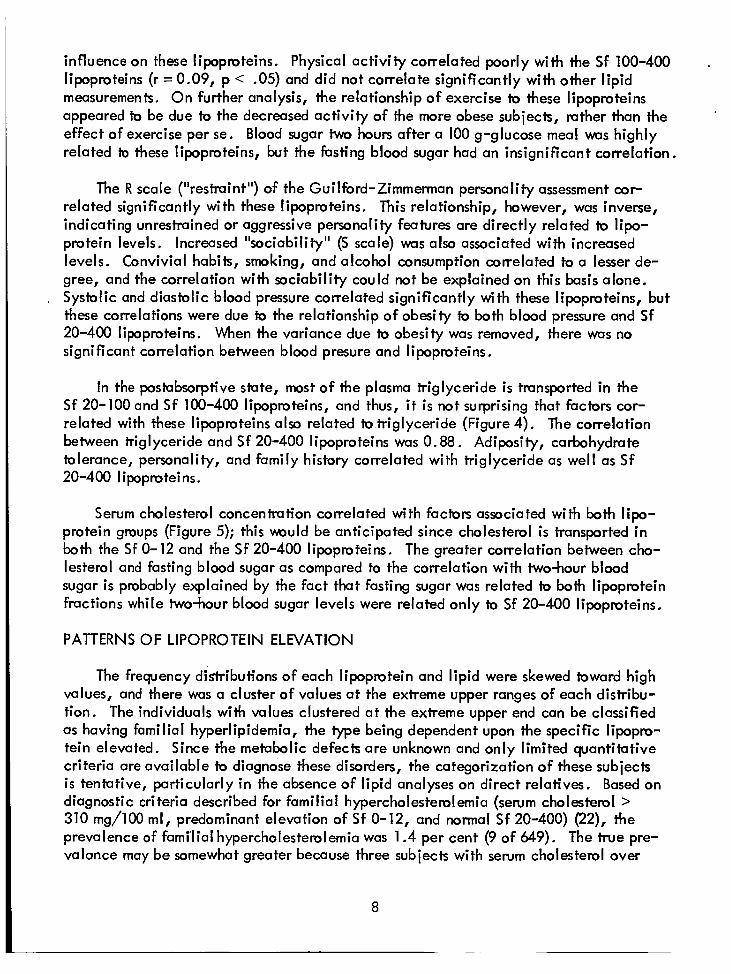
influence on these lipoproteins. Physical activity correlated poorly with the S f 100-400 lipoproteins (r = 0.09, p < .05) and did not correlate significantly with other lipid measurements. On further analysis, the relationship o f exercise to these lipoproteins appeared to be due to the decreased activity of the more obese subjects, rather than the effect of exercise per se. Blood sugar two hours after a 100 g-glucose meal w a s highly related to these lipoproteins, but the fasting blood sugar had an insignificant correlation.
.
The R scale ("restraint") of the Guilford-Zimmerman personality assessment cor- related significantly with these lipoproteins. This relationship, however, was inverse, indicating unrestrained or aggressive personality features are directly related to lipo- protein levels. Increased "sociability" (S scale) was also associated with increased levels. Convivial habits, smoking, and alcohol consumption correlated to a lesser de- gree, and the correlation with sociability could not be explained on this basis alone. Systolic and diastolic blood pressure correlated significantly with these lipoproteins, but these correlations were due to the relationship o f obesity to both blood pressure and S f 20-400 lipoproteins. When the variance due to obesity was removed, there was no significant correlation between blood presure and lipoproteins.
In the postabsorptive state, most o f the plasma triglyceride i s transported i n the Sf 20-100 and S f 100-400 lipoproteins, and thus, i t i s not surprising that facbrs cor- related with these lipoproteins also related to triglyceride (Figure 4). The correlation between triglyceride and S f 20-400 lipoproteins was 0.88. Adiposity, carbohydrate tolerance, personality, and family history correlated with triglyceride as well as S f 20-400 lipoproteins.
Serum cholesterol concentration correlated with factors associated with both lipo- protein groups (Figure 5); this m u l d be anticipated since cholesterol i s transported i n both the S f 0-12 and the S f 20-400 lipoproteins. The greater correlation between cho- lesterol and fasting blood sugar as compared to the correlation with two-hour blood sugar i s probably explained by the fact that fasting sugar was related to both lipoprotein fractions while two-hour blood sugar levels were related only to S f 20-400 lipoproteins,
PATTERNS OF LIPOPROTEIN ELEVATION
The frequency distributions of each lipoprotein and lipid were skewed toward high values, and there was a cluster o f values at the extreme upper ranges of each distribu- tion. The individuals with values clustered at the extreme upper end can be classified as having familial hyperlipidemia, the type being dependent upon the specific lipopro- tein elevated. Since the metabolic defects are unknown and only limited quantiktive criteria are available to diagnose these disorders, the categorization o f these subjects i s tentative, particularly i n the absence o f lipid analyses on direct relatives. Based on diagnostic criteria described for familial hypercholesterolemia (serum cholesterol > 310 mg/100 ml, predominant elevation of Sf 0-12, and normal S f 20-400) (22), the prevalence o f familial hypercholesterolemia was 1.4 per cent (9 of 649). The true pre- valance may be somewhat greater because three subjects with serum cholesterol over
8

25
20 TRIGLYCERIDE
t 2
5
Moan = 127 S.D. = f76
30 50 100 130 2 0 0 . 250 860
V a r i a b l e C u m u l a t l v e M u l t i p l e r
~~
S K I N F O L D S - CHEST 0 . 2 3 1
G L U C O S E - 2 h pc . 3 6 6 D i a s t o l i c B P . 3 8 4
G - Z , S s c a l e .406
F A M I L Y H i S T O R Y - S I B . . 3 1 1
G - Z , R s c a l e ( - ) . 3 9 9
Figure 4
Frequency distribution of values for serum triglyceride and factors correlated with t h i s serum lipid. Only the 252 measurements con- sidered to be reliable were analyzed.
9

60
50
40
30
20
10
10
40 150 200 250 300 350
mg/100ml
V a r i a b I e C u m u l a t i v e M u l t i p l e r
F A S T I N G G L U C O S E S K I N F O L D S - CHEST S M O K I N G - A M O U N T F A M I L Y H I S T O R Y - M O T H E R U R I C A C I D G - Z, R S c a l e ( - ) F a m i l y h i r t o r f o t h e r ' V e i g h t g a i n i4-- 4 8 y r . ( - ) , y r t o l i c B P Ec tomorphy F a m i l y ' h i r t a r y - S i b .
0 . 1 9 3 . 2 2 9 . 2 6 4 . 2 7 8 . 2 8 9 . 2 9 9 . 3 0 5 . 3 1 1 - 3 1 7 . 3 2 1 . 3 2 4
Figure 5
Frequency distribution of values for serum cholesterol and facton correlated with t h i s serum lipid. Factors influencing both S f 0-12 (beta) and Sf 20-400 (pre-beta) lipoproteins were found to influ- ence cholesterol as might be anticipated since cholesterol i s trans- ported in both of these lipoprotein fractions.

. 310 mg/100 died before the last two examinations. However, lack of complete lipid data precludes exact classification of these men. T m o f the subjects with familial hyperchoIe;te;o!emia had borderline or abnormal glucose tolerance tests; t h i s i s the incidence i n the entire group. There are no quantitative criteria for diagnosis of familial endogenous hyperglyceridemia, and subjects were arbitrarily classified as hav- ing t h i s disorder i f the S f 20-400 lipoprotein concentration was greater than 500 mg/100 m l and the S f 0-12 lipoprotein Concentration w a s less than 450 mg/100 ml. There were eleven subjects (1.7%) so classified using these criteria, and seven of these eleven subjects had borderline or abnormal glucose tolerance. Three subjects (0.5%) had elevation o f S f 0-12 and S f 20-400 fractions and could be classified as having i n t e r mediate hyperlipidemia; a l l o f these subjects had abnormal glucose tolemnce. Eighteen subjects had serum cholesterol levels greater than 300 mg/100 ml; eleven of these had familial hypercholesterolemia, three had intermediate hyperlipidemia, and four had endogenous hyperglyceridemia. One subject could not be classified since the cho- lesterol w s elevated without elevation of the measured lipoproteins.
Individuals with elevated lipoproteins were investigated to determine whether the factors correlating throughout the entire range were also related to high levels since individuals with elevated lipids are of greatest clinical interest. The S f 0-12 and S f 20-400 lipoproteins were handled as independent variables because of their low cor- relation (r = 0.09). The Sf 12-20 fraction correlated highly with the S f 0-12 (r = .41) and the Sf 20-400 (r = .53) lipoproteins and was not considered fbrther. Elevation of each fmction was arbitrarily defined as the 90th percentile and above. Four groups were determined by th is separation: both fractions I1normal" (Group A), elevation o f Sf 0-12 only (Group B), elevation of Sf 20-400 only (Group C), and elevation o f both (Group D). The number of subjects i n each group and the values for associated variables and their statistical significance are shown in Table I. Approximately 10 per cent had elevation of either the S f 0-12 or S f 20-400 lipoproteins and approximately 1 per cent had elevation of both fractions. This prevalence pattern suggests that elevation o f both fractions may result from the coincidence of factors causing elevation of each, rather than being caused by a third, unique, set of factors. Further confirmation for th is interpretation i s provided by the finding that the characteristics of Group D were similar to those of Groups B and C.
The variables correlated with lipoprotein levels were also significantly related to high levels of the corresponding lipoproteins. Thus, elevated Sf 20-400 lipoproteins were associated with significantly greater truncal adiposity (skinfold thickness of chest) and higher postprandial blood sugar; these factors were previously found to correlate at a l l levels. This was also true for the relationship between cigarette smoking and the S f 0-12 lipoproteins. For these analyses, individuals tentatively designated as having familial hyperlipidemia were not removed from these groups.
Serum cholesterol was high when either or both lipoprotein fractions were elevated, but significant elevation o f triglyceride was present only when the S f 20-400 fractions were increased (Group C and D). This i s consistent with the lipid compositions of these
1 1

h a r
L1 L. C 0
U a, ai
a, -(r l-
.- v)
.- e -
L .-
a U
S
a, 0
ln .- c
k fl .- --I
E 3 a, m
0
S a, n a
L
u-
v)
L
c c
I-
.- --I
* m OIm +I
d m . . m -
+I
-n- d 9 v +
. .
8 % - +I
0 3 9 o m m +
m OI * 0
m $ i 7
1 0 o m
g J / / z z 6
9 5 9.- + I
-nOI O I - +I
h m m - + . .
- h 99 . . - + I
? % - + I
In 9
0 m o
0 0 - 9 I
u - m
9- +
m m o m - +
a3m m - . .
+ I
-03
-nu) - + . .
,"a m - +
OI 9
0 0
z s V
5? 9.- +
-0 OI* +
0 0 m - 7
A %
I I
ln > a
V O
6 V
l n v ) > >
c X a,
c S a, > u)
U -0
c
.-
.- v)
9" V *
12

fractions. The S f 0-12 lipoproteins contain primarily cholesterol while the S f 20-400 lipoprotein coniuin both triglyceride (52%) and significant amounts of cholesterol (22%), .
RELATIONSHIPS TO WEIGHT AND CARBOHYDRATE TOLERANCE
Since adiposity and carbohydrate tolerance are related to each other, i t was important to separate these factors and determine the relation o f each to lipoprotein elevation. These factors were separated by comparison of groups with comparable weight gain and carbohydrate tolerance (Table 1 1 ) . The Sf 20-100 and S f 100-400 lipoproteins were significantly higher i,n groups 6 and D which had abnormal carbohydrate tolerance (2 hr. blood sugar >120 mg/100 ml) than i n Groups A and C, respectively, which had comparable weight gains but normal carbohydrate tolerance. In addition, groups with comparable glucose tolerance had significantly higher lipoproteins of the S f 20-100 and S f 100-400 groups when the weight gain was 20 pounds or more. Thus, both weight and carbohydrate tolerance were independently related to elevations of the very low density (Sf 20-100 and Sf 100-400) lipoproteins, and the influence of each factor was present in both lipoprotein fractions. Serum uric acid was significantly related to increase in weight but not to abnormalities in glucose tolerance. Serum cholesterol and S f 0-12 lipoproteins were not significantly affected by weight change or carbohydrate tolemnce.
The temporal relationship between weight change and lipoprotein levels was de- termined by separating the 24 years of follow-up into two periods, age 24-42 (first 18 years) and age 42-48 (last 6 years) (Table Ill). No significant differences were found between subjects maintaining constant weight during both periods (Group B) and subjects having init ial weight gain followed by a decrease in weight (Group D) although Group D gained 10 pounds more during the entire period. Group C ("constant-gain") and Group D ("gain-decrease") had comparable total increments in weight and degrees of truncal adiposity, and the lipoproteins were not significantly different, although the S f 20-400 lipoproteins were slightly less in the group with recent weight loss. Postprandial blood sugar was not significantly related to the pattern of weight change. We conclude that the total weight gained (or adiposity) i s a more important factor than recent alterations in weight, but the latter has some influence on lipoprotein concentration.
RELATIONSHIP OF LIPOPROTEINS TO CORONARY ARTERY DISEASE
The stvdy population was separated by electrocardiographic and clinical criteria into a group with coronary artery disease and a "healthy" group (Table IV). Serum cholesterol and S f 0-12 lipoproteins were significantly higher in the group with coronary disease, but serum triglyceride and S f 20-400 lipoproteins were not significantly different from those in the ''normal" group. Three patients dying with myocardial infarction prior to the time when complete l ipid analysis was performed had serum cholesterol values above 320 mg/100 ml and a fourth patient had a serum cholesterol of 238 mg/100 ml. Blood sugar two hours after a 100 g-glucose meal tended to be higher in the coronary group but the difference was not statistically significant.
13

N m 9- . .
+I
0 0 0 m 9
+ I
90 -00 - + I
h m s TI
$ 1
L 0 m 3
73 0 0 n
v)
- $4 E - 8 ll
z z U

Q) 0 S U a, 0 I-
0 0 3
L - 91
(3
?
P-
E
-
0 ln
Q -I .- 3 o) m 0
Q
L-
c
.- f S 0
0 Q) oi ln 4-
.- c -
- U S U Q) 0) S 0 L u c L 0) .- 5 bb 0 C Q)
U a
L
c c
rr)
rr) +
9 OI
cv m 7
8 d
m 03
n
2 3 z? u e G L
0 -
0
c
m

u) 0
V Q
u) 0
A - V P
3:
v)
z
c
0
V P
7
0
V P
In
z
- 0
V Q
a 0 c 0 0
c 0) In
.- .- rc
.-
c S 0 0
S u)
.- 2
.- v)
c
2
i
1
In
.y
16
Although the limited number of individuals with coronary disease precludes ex- tensive analysis, the patterns of l ipid elevation are interesting in this group. Fourteen individuals (33%) had oniy elevation of the Sf 0-12 lipopmteins (and cholesterol); bur (10%) had elevation of the S f 20-400 lipoproteins (and triglyceride); and four (10%) had elevation of both lipoprotein fractions. The last group with elevation of both fractions was found in the coronary group in considerably greater prevalence than t h i s pattern was found in the general population. Abnormal glucose tolerance was not associated with a particular l ipid pattern i n these subjects and appeared to operate as an independent varia bl e.
*
VARIABILITY OF SERUM LIPIDS
Repeat determinations of cholesterol and lipoproteins were available on 381 subjects who had these analyses i n 1958 and 1964. Correlations between the two deter- minations were high: cholesteml, r = .78; S f 0-12, r = .72; S f 20-400, r = .42. Of greater importance, however, i s the intraindividual variability between examinations since this indicates the reliability of a single determination. For the S f 0-12 lipoproteins, 80 per cent o f the values on the second examination were within -12 per cent and +20 per cent of the first examination. For cholesterol, 80 per cent of the values were within -18 per cent and -21 per cent of the first examination. For each, 90 per cent of the group had values within +30 per cent of the first detetmination. The variability was not related to the absolute levels. The variability of the S f 20-100 or S f 100-400 lipoproteins could not be determined because not a l l subjects were postabsorptive during the 1958 examination.
DISCUSS ION
Individual differences in circulating lipids result from the interaction between genetic and environmental facto^. In t h i s study group, as in the majority of Americans with similar socioeconomic and dietary backgrounds, constitutional factors probably have the greatest influence on l ipid levels, although environment may modify expression of these herediiury differences. Genetic differences may be expressed in two ways. A single mutant gene, altering a particular metabolic pathway, can cause extreme eleva- tions o f lipids. These familial hyperlipidernias are affected by environment to a relatively minor degree (22). Similarly, very low levels due to absence o f a particular lipoprotein species may result from monogentic inheritance. However, i n the majority o f the popu- lation, multiple hereditary factors, each o f which i s insufficient to produce major changes, determine l ipid levels and environment plays a more important role. It i s important to determine the frequency of each of these mechanisms and to identify and quantify the factors involved in the mu1 tifactorial determination of lipid concentrations.
The frequency distributions o f lipids and lipoproteins in this group were continu- ous but skewed toward higher values, and there was a cluster of subjects at the extreme upper end. These individuals, comprising approximately 3 or 4 per cent, were categorized as having familial hyperlipidemia, although without precise biochemical criteria this definition must be teniative. The type of familial hyperlipidemia can be classified by
17

the elevated lipoprotein fraction, the Sf 0-12 in familial hypercholesterolemia, the S f 20-400 in familial hyperglyceridemia (endogenous), and both in intermediate hyperlipi- demia (4, 22). The diagnosis of familial hypercholesterolemia i s more secure due to the more compact distribution of values for cholesterol and Sf 0-12 lipoproteins and the availability of quantitative criteria (22). Th is disorder, affecting approximately 1.4 per cent of th i s population i s associated with elevated cholesterol, normal triglyceride, and the same frequency of abnormal glucose tolerance observed in the remainder of this group. The skewness of values for triglyceride and Sf 20-400 lipoproteins makes exact classification of familial hyperglyceridemia more difficult. This disorder, comprising perhaps 1.7 per cent of t h i s gmup, i s associated with high triglyceride levels, an in- creased prevalence o f abnormal glucose tolerance, and high serum cholesterol. Elevation o f both groups of lipoproteins w a s present i n only 0.5 per cent, and a l l o f these patients had abnormal glucose tolerance.
I
The relatively low prevalence o f familial hyperlipidemia belies its potential imporiance i n arteriosclerotic disease. The incidence of coronary heart disease i s in- creased in individuals with sewn cholesterol above 274 mg/100 ml (23), and in the present study, 18 per cent of these "high risk" individuals could be classified as having familial hyperlipidemia. Similar data relating triglyceride levels to risk of disease are not available, but a relatively high prevalence of familial hyperlipidemia would also be expected in the group having high triglyceride levels.
I
The maiority of the population, including individuals with vulues skewed to higher levels, had lipid levels determined by mu1 tiple factors. Different factors correlated with the major group o f Iipopmteins, the Sf 0-12 and the Sf 20-100 and Sf 100-400 fractions, as might be expected since these lipoprotein groups have different metabolism. The Sf
lar disease, body habitus, cigarette smoking, and serum uric acid. The relationship of these lipoproteins to adiposity and body habitus deserves clarification because o f the contradiction between the direct relationship to truncal adiposity (expressed by skinfold thickness of chest) and the inverse relationship to weight gain. Th is apparent paradox was resolved by the demonstration that S f 0-12 lipoproteins and cholesterol correlated (r = 0.18, p < .001) with endomorphic habitus at age 24, but not with endormorphy at age 48. This suggested that adiposity a t different phases of l i fe has different physiologic implications. Thus, constitutional obesity (manifest by endomorphic habibs while a t "ideal weight") rather than acquired obesity, expressed by weight gain i n middle life, was the more important determinant of levels of these lipids. This formulation i s com- patible with observations that serum cholesterol correlates with skinfold thickness i n younger men (20 to 24 yea^) but not i n older men (24) and with the studies of others (25, 26) that body weight and weight gain are not related to serum cholesterol or Sf 0-12 lipoproteins after the subjects reach maturity.
I 0-12 lipoproteins correlated with a variety of factors, includi ng family history of vascu-
The association between cigarette smoking and S f 0-12 lipoproteins has been reported (27) i n smaller numbers of subjects as has the relationship between serum choles- terol and smoking (28), but the mechanism of th is relationship remains unknown. The
I absence of correlations with other variables related to these lipids suggests that smoking
18

may not be dependent on other facton for its relationship to lipid levels. Unforiunately, i t has been diff icult to induce individuals to stop smoking, thus making i t diff icult to determine whether &e re!ct!onship to lipids i s a causal one. The direct correlation be- tween smoking and serum cholesterol does suggest a mechanism to eq la in partiaiiy the observations relating cigarette smoking to the degree o f coronary arteriolsclerosis (29) and to the development of myocardial infarction (30). Of additional interest i s the relatively minor relationship between Sf 0- 12 lipoproteins and protein-bound iodine (PBI) because serum cholesterol and S f 0-12 lipoproteins are dramatically altered by pathological levels o f PBI. However, as reported by Tucker and Keys (31), the relation- ship i s relatively minor within the physiologic mnge.
'
.
In contrast to the S f 0-12 lipoproteins, the S f 20-100 and S f 100-400 lipoproteins reflected the envimnmental influence of increasing weight. Numerous variables related to adiposity were measured, but skinfold thickness, a measurement of subcutaneous adi- pose tissue, and the amount of weight gained were as infotmative as more complex measurements. The relationship w a s stronger with central or truncal adiposity than with peripheral adiposity (skinfold thickness of arms), and this association with truncal obesity was impmved when variance due to peripheral adiposity and muscular build (mesomorphy) were removed. Albrink and Meigs (32) also found that weight gain after age 25 and increased central adiposity were associated with higher levels o f triglyceride. Since the S f 20-400 lipoproteins transport most of the triglyceride in the postabsorptive state, these results are in general agreement. These observations suggest that higher triglyceride (and S f 20-400 lipoprotein) levels are associated wiih caloric excess and acquired fruncal adi- posity, whereas constiiutional obesity, present early i n l i fe and having a fairly uniform distribution, i s related to serum cholesteml and S f 0-12 lipoproteins.
Obesity and abnormal carbohydrate tolerance occur together frequently and both have been reported i n association with high plasma triglyceride levels (33, 34). In spite of their frequent coincidence, these characteristics correlate independently with the Sf 20-400 lipoproteins. Significantly higher levels of S f 20-400 lipoproteins were found in subjects with excessive weight gain (over 20 pounds) but normal carbohydrate tolerance; conversely, subjects with abnormal glucose tolerance without excessive weight gain also had significantly higher levels. Recent changes in weight appeared to influence these lipoproteins as well, although not so much as the total weight gained. However, physical activity, when separated from inactivity associated with obesity, did not have a signifi- cant relationship to lipid levels.
The implication that personality and stress may be involved i n the pathogenesis of coronary heart disease has intrigued physicians and the public, but documentation of their influence and even reliable measurement o f individual differences have been elusive. The Guilford-Zimmerman temperament survey, an objective and reliable test measuring personality characteristics, was used in these studies. Lack of "restraint" ("aggressive- ness") correlated directly with h e S f 20-100 and S f 100-400 lipoproteins and to a lesser degree with serum cholesterol and triglyceride. This characteristic did not correlate with other variables that were associated with these lipoproteins, thus suggesting that this psychological factor or some associated, but unmeasured, Characteristic was responsible
19

for this relationship. The "sociability" index also had a positive correlation, but th i s relationship may reflect differences in convivial patterns of eating and alcohol consump- tion rnther than a difference in temperament, although no related differences i n these patterns were elicited i n the medical history. Friedman and Rosenman (35, 36), using a subjective classification based on interviews, found competitive, ambitious individuals (Type A) had significantly higher cholesterol and triglyceride and a greater incidence of coronary heart disease, and further noted that this relationship could not be explained by differences i n glucose metabolism. Our observations, however, represent the fint demon- strntion of such relationships using an objective assessment of temperament. The mechanism for t h i s influence i s unknown, but may be related to observations that periodic "stress" i s associated with increases i n cholesterol (37). The apparent influence of stress and person- al i ty could be dependent on differences i n diet or physical activity, which are also diffi- cult to quantify. Obviously, much more work needs to be done in this area which has been beclouded by a paucity of objective measurements.
The correlative data express relationships between lipids and nonlipid variables throughout the entire range of lipid conceniration, but high levels command the greatest clinical interest and deserve some comment. Elevated levels of the S f 0-12 and S f 20-400 fractions were found to occur independently, and those variables correlated with each lipoprotein group were found i n significantly greater degree in subjects with high levels. Elevation of both lipoprotein groups vms encountered with a frequency suggesting that t h i s situation resulted from coincidence of factors responsible for elevation o f each fmc- tion. Hyperlipidemia can be examined from another standpoint, that of l ipid patterns associated with increased risk of coronary disease. Assuming serum cholesterol above 274 mg/100 m l conveys an increased risk (23), the following lipoprotein patterns were found in th is group: elevation of the S f 0-12 lipoproteins alone in 57 per cent, elevation o f S f 20-400 lipoproteins alone in 33 per cent, and elevation of both fractions i n 10 per cent. Thus hypercholesterolemia and increased risk can result from any o f these three patterns, but elevation of the S f 0-12 fraction was most common. Hyperglyceridemia, however, can be present only when the S f 20-400 lipoproteins are elevated.
Coronary heart disease in t h i s group has not become manifest with sufficient frequency to permit more than a tentative statement regarding the relationship between lipid patterns and heart disease. Serum cholesterol and S f 0-12 lipoproteins were signifi- cantly higher in the group with coronary heart disease, but serum triglyceride and the S f 20-400 lipoproteins, although higher, were not significantly greater than values i n "healthy" subjects. Our findings are comparable to those of Brown, Kinch, and Doyle (38) who found serum cholesterol discriminated between individuals with high and hose with low prevalence o f disease better than did semm triglyceride. These results con- trast with those o f others (39, 40) who compared patients with myocardial infarction to control subjects selected i n different manner. Rather than belabor these differences, which wil l be clarified only when data from prospective sfudies are available, i t i s perhaps more pertinent to inquire whether measurements of triglyceride or Sf 20-400 lipoproteins define individuals at significant risk who would not be defined by elevated cholesterol levels or by abnormal glucose tolerance. In th is siudy and that of Brown, Kinch, and Doyle (38), individuals with extremely high levels o f S f 20-400 lipoproteins
20

- (and triglyceride) had high levels of cholesterol as well, Therefore, these individuals would be categorized as "high risk" on the basis of serum cholesterol. Serum triglyceride and Sf 20-400 lipoproteins would, consequently, have va!ue on!y !n identifying individ- uals with moderate elevations o f these lipids that are not accompanied by high serum cholesterol. However, this latter grouphe a greater prevalence o f abnormal carbo- hydrate tolerance, and our experience plus that of others (41) indicates that t h i s i s also a significant risk factor. The more appropriate question might be, therefore, whether the circulating triglyceride or the underlying metabolic abnormality, perhaps diabetes mellitus, i s the primary factor in the pathogenesis o f coronary disease. Further studies in which both carbohydrate tolerance and triglyceride are assessed should permit evalu- ation of each factor separately, and determine whether triglyceride per se i s the i m p o r tant factor or its association with other factors, high serum cholesterol and abnormal carbohydrate tolerance.
These observations must be interpreted in light of the population studied and the reliability of the measurements. The value of observations on a free-living population, unselected for presence of disease, i s obvious, but the uniqueness of this group, which w a s init ially selected by rigorous medical criteria, suggests caution in extending these observations to the general population. In fact, the relative homogeneity of the group with the restricted range of most variables probably substantually reduced the size of the correlations obtained. However, i t i s l ikely that these observations can be extrapolated to middle-aged American men with some confidence since i t i s the extremes, or abnormals, that are not studied. In studies o f patients selected for abnormality, i t i s the normal subjects who are missing. Moreover, the results from this comprehensive evaluation agree, in general, with observations by others evaluating a limited number of variables in smaller groups of subjects.
The reliability of a single lipid measurement, subject io laboratory ermr and biologic variability, has concerned some investigators (42). ation in values over a six-year interval was significant, but less than many other biolog- ical measurements, such as blood pressure. Despite t h i s variability, single determinations do permit rough categorization o f individuals, and the relationships developed from this categorization did not change between the two examinations.
The intraindividual vari-
21

REFERENCES
1. Adlersberg, D., and Schaefer, L. E., Editorial: The interplay of heredity and environment i n the regulation of circulating lipids and in atherogenesis. Amer. J. Med. 26:l-7, 1959.
- ---
2. Schaefer, L. E., Adlersberg, D., and Steinberg, A. G., Heredity, environment, and serum cholesterol: A study of 201 healthy families. Circulation, 17:537-542, 1958.
-
3. Deutscher, S., Epstein, F. H., and Kjelsberg, M. 0 ., Familial aggregation o f factors associated with coronary heart disease. Circulation, 33:9-11-924, 1966. -
4. Fredrickson, D. S., and Lees, R. S., Editorial: A system for phonotyping hyper- Iipoproteinemia. Ci rculation, - 31:321-327, 1965.
5 . Packard, J. M. Graettinger, J. S., and Graybiel, A., Analysis of the electro- cardiograms obtained from 1000 young heal thy aviators. Ten-year follow-up. Circulation, - 10:384-4OO, 1954.
6. Harlan, W. R., Jr., Graybiel, A., and Osborne, R. K., Determinants of cardio- vascular disease in a young population. Amer. J. Cardiol., - 151-12, 1965. - -
7. Harlan, W. R., Jr., Osbome, R. K., and Graybiel, A., A longitudinal study of blood pressure. Circulation, - 26:530-543, 1962.
8. Oberman, A., Mitchell, R. E., and Graybiel, A., Thousand aviator study: Methodology. NSAM Monograph 11. NASA Order R-136. U. S. Public Health Service. Pensacola, Fla.: Naval School o f Aviation Medicine, 1965.
9. McGuire, C., and White, G. P., The measurement o f social status. Report No. 3, Austin, Texas: University of Texas, Department of Educational Psychology, 1955.
10. Oberman, A., Lane, N. E., Mitchell, R. E., and Graybiel, A., The Thousand Aviator Study: Distributions and intercorrelations o f selected variables. NAMl Monograph 12. NASA Order R- 136. U. S. Public Health Service. Pensacola, Fla.: Naval Aerospace Medical Institute, 1965.
1 1 . Sheldon, W. H., Dupertius, C. W., and McDermott, E., Atlas of Men. New --- York: Harper and Bros. , 19%.
12. Committee on Nutritional Anthropometry, Food, and Nutrition Board, National Research Council, 1956. Recornmenda tions concerning body measurements for the characterization of nutritional status. Human Bioi., 28:lll-123, 1956. -- -

13. Behnke, A. R., Guttentag, 0. E., and Brodsky, C., Qua.7tification of body weight and configuration in geometrical terms. Human Biol., 31:213-234, 1959. - -
14. Guilford, J. P., and Zimmerman, W. S., The - Gui!brcl-Zlr??merman Temperament Survey. Manual of Instructions and - Interpretations. Beverly Hills, Calif: Sheridan su pp I y corn pa n y ,1949.
15. delalla, O., and Gofman, J.: Ultracentrifugal analysis o f human serum lipopm- teins. In: Glick, D. (Ed.). Methods of Biochemical Analysis. New York: Interscience Publishers, 1954. Pp. 459-478.
16. Abell, L. L., Levy, B. B., Brady, B. B., and Kendall, F. E., A simplified method for the estimation of total cholesterol in serum and demonstration of i t s specificity. J. Biol. Chem.: 195357-366, 1952. - - - -
17. Carlson, L. A., and WaIdstGm, L. B., Determination of glycerides in blood serum. Clin. Chem. Acta, 4:197-205, 1959. - ---
18. Somogyi, M., Determination of blood sugar. J. Bioi. Chem., 160:69-73, 1945. --- - 19. Chaney, A. L., Pmtein-bound iodine. Adv. Clin. Chem., 1:81-109, 1958. --- -
20. Brown, H., Determination of uric acid in human blood. J . Biol . Chem., 158: - - - - 601-608, 1945.
21. Wherry, R. J., Appendix V. In: Stead, W. H., and Sartle, C. P. (Eds.), Occupational Counselling Tecxniques. New York: American Book Company, 1940. Pp. 245-252.
22. Harlan, W. R., Jr., Graham, J. B., and Estes, E. H., Familial hypercholes- terolemia: A genetic and metabolic study. Medicine, 4577-1 - 10, 1966.
23. Doyle, J. T., Heslin, A. S., Hilleboe, H. E., and Formel, P. F., Early diagnosis of ischemic heart disease. New Eng. J. Med., 261:1096-1101, 1959. --- - -
24. Montoye, H. J ., Epstein, F. H., and Kjelsberg, O., Relationship between serum cholesteml and body fatness. An epidemiologic study. Amer. J. Clin. Nutr., 18: 397-406, 1966.
-- - -
25. Keys, A., Vivanco, F., Minon, J. L. R., Keys, M. H., and Mendoza, H. E., Studies on the diet, body fatness, and semm cholesteml in Madrid, Spain. Metabolism, - 3:195-212, 1954.
26. Keys, A., Taylor, H. L., Blackburn, H., Bmzek, J., Anderson, J. T., and Simonson, E., Coronary heart disease among Minnesota business and professional men followed fifteen years. Circulation, - 28:381-395, 1963.
23

27. Gofman, J. W. , Lindgren, F. T., Strisower, B., delalla, O., Glazier, A. B., and Tamplin, A. , Cigarette smoking, serum lipoproteins and coronary heart disease. Geriatrics, - 10: 349-354, 1955.
28. Karvonen, M., Keys, A., Orma, E., Fidanza, F., and Brozek, J., Cigarette smoking, serum cholesterol , blood pressure, and body fatness. Observations in Finland Lancet, - 1:492-494, 1959.
29. Auerbach, O., Hammond, E. C., and Garfinkel, L., Smoking i n relation to atherosclerosis of the coronary arteries. New Eng. J . Med. , 273:775-779, 1965. -----
30. Doyle, J. T., Dawber, T. R., Kannel, W. B. , Heslin, A. S., and Kahn, H. A., Cigarette smoking and coronary heart disease: combined experience o f Albany and Framingham studies. New Eng. J. Med. , 266:796-801 , 1962. -- -- -
31. Tucker, R. G. , and Keys, A. , Concentration o f serum protein-bound iodine in normal men. J. Clin. Invest. , 30:869-873, 1951. - - - -
32. Albrink, M. J . , and Meigs, J . W. , Interrelationship between skinfold thickness, serum lipids and blood sugar i n normal men. Amer. J. Clin. Nutr. , 15255-261 , 1964.
- - - - -
33. Knittle, J. L. , and Ahrens, E. H. , Jr. , Carbohydmte metabolism in tvm forms of hyperglyceridemia. J . CI in. Invest. , 43:485-495, 1964. --- -
34. Albrink, M. J. , Meigs, J. W. , and Granoff, M. A., Weight gain and serum triglycerides i n normal men. New Eng . J . Med. , 266:484-489, 1962. - - - - -
35. Rosenman, R. H., Friedman, M., and Byen, S. O., Glucose metabolism in subjects with behavior pattern A and hyperlipidemia. Circulation, - 33:704-707, 1966.
36. Rosenman, R. H. , Friedman, M. , Straus, R. , Wrm, M. , Kositchek, R. , Hahn, W. , and Werthessen, N. T. , A predictive study of coronary heart disease. The Western Collaborative Group Study. - - - - J .A.M.A. , - 189:15-22, 1964.
37. Grundy, S. M. , and Griffin, A. C. , Effects of periodic mental stress on serum chol es tero I I evels . Circulation , - 19:496-498 , 1959.
38. Brown, D. F., Kinch, S. H., and Doyle, J. T., Serum triglycerides i n health and i n ischemic heart disease. New Eng. J. Med. , 273:947-952, 1965. ---- -
39. Albrink, M. J., Meigs, J . W., and Man, E. B., Serum lipids, hypertension and coronary artery disease. Amer. J . Med. , 31:4-23, 1961. - - - -
24

40. Carlson, L. A., Serum lipids in men with myocardial infarction. Acta Med. -- Stand., 167:399-413, 1960. - -
* 41. Ostmnder, L. D., Jr., Francis, T. , Jr., Hayner, N. S. , Kjelsberg, M. O. , and Epstein, F. H , , The relationship o f cardiovascular disease to hyperglycemia. Ann. Int. Med., 62:1188-1198, 1965. --- -
42. Dunn, J. P . , and Moses, C. , Correlation of serum lipids with uric acid and blood sugar in normal males. Metabolism, - 14:788-792, 1965.
25

Unc I assi fi ed sc< I l r l l , CIds, l f tcal l"n
DOCUMENT CONTROL D A T A - R a D
~ k i i i i w A T i : iG A t T ' \ " T v (Vnr,norafe author)
Naval Aerospace Medical Institute
Pensacola, Florida 32512 Nava I Aerospace .Medica I Center
20 . R E P O R T SE C U RI T Y C L A 551 F I C A T ION
Unclassified 2b. G R O U P
Wherry, Robert J., Jr.
2 March 1967 R E P O R T D A T E
NASA Order R- 136
M FO22.03.02-5007
la C O N T H A C - O R G R A N T N O
b. P R O J E C T N O
7a. T O T A L N O O F P A G E S
28
d .
I O O I S T R l 8 U T I O N S T A T E M E N T
7 b . N O O F R E F S
42
I 1 S U P P L E M E N T A R Y N O T E S
Study supported in part by U. S. Public Health Service
3b. O T H E R R E P O R T N O I S ) (Any other numbers that may be assigned this report)
14
1 2 S P O N S O R I N G M I L I T A R Y A C T I V I T Y
Distribution of this document i s unlimited
I D ! F N ~ v M 6 5 1 473 ( P A G E ) Unclassified S e c u r i t y C l a s s i f i c a t i o n S/N 0101- 8 0 7 - G801

Unclassified Security Classification
I K E Y W O R D S
Coronary heart disease
Biochemica I tests
Clinical medicine
Come I a tion ana I ysis
Environmentcrl factors
Hereditnry factors
Follow-up study
(PAGE 2) \ -
~~
L I N K A
R O L E - L I N K 0
R O L E
Unclassified Security Classification


![UNLIMITED ADVENTURES. UNLIMITED OPPORTUNITIES [INBOUND 2014]](https://static.fdocuments.us/doc/165x107/55d54daebb61ebd6228b4731/unlimited-adventures-unlimited-opportunities-inbound-2014.jpg)