Distribution, Persistence, and Hydrologic Characteristics ...
48
Distribution, Persistence, and Hydrologic Characteristics of Salmon Spawning Habitats in Clearwater Side Channels of the Matanuska River, Southcentral Alaska Scientific Investigations Report 2011–5102 Prepared in cooperation with the U.S. Fish and Wildlife Service and Chickaloon Village Traditional Council U.S. Department of the Interior U.S. Geological Survey
Transcript of Distribution, Persistence, and Hydrologic Characteristics ...

Distribution, Persistence, and Hydrologic Characteristics of Salmon Spawning Habitats in Clearwater Side Channels of the Matanuska River, Southcentral Alaska
Scientific Investigations Report 2011–5102
Prepared in cooperation with the U.S. Fish and Wildlife Service and Chickaloon Village Traditional Council
U.S. Department of the InteriorU.S. Geological Survey

Cover: Photograph showing a clearwater side channel flowing across the braid plain and into a turbid channel of the Matanuska River, Alaska. Photograph taken by Janet Curran, U.S. Geological Survey, August 14, 2007.
Inset: Photograph showing sockeye and chum salmon swimming from a turbid channel into a clearwater side channel of the Matanuska River, Alaska. Photograph taken by Christian Zimmerman, U.S. Geological Survey, August 28, 2008.

Distribution, Persistence, and Hydrologic Characteristics of Salmon Spawning Habitats in Clearwater Side Channels of the Matanuska River, Southcentral Alaska
By Janet H. Curran, Monica L. McTeague, Sean E. Burril, and Christian E. Zimmerman
Prepared in cooperation with U.S. Fish and Wildlife Service and Chickaloon Village Traditional Council
Scientific Investigations Report 2011–5102
U.S. Department of the InteriorU.S. Geological Survey

U.S. Department of the InteriorKEN SALAZAR, Secretary
U.S. Geological SurveyMarcia K. McNutt, Director
U.S. Geological Survey, Reston, Virginia: 2011
For more information on the USGS—the Federal source for science about the Earth, its natural and living resources, natural hazards, and the environment, visit http://www.usgs.gov or call 1–888–ASK–USGS.
For an overview of USGS information products, including maps, imagery, and publications, visit http://www.usgs.gov/pubprod
To order this and other USGS information products, visit http://store.usgs.gov
Any use of trade, product, or firm names is for descriptive purposes only and does not imply endorsement by the U.S. Government.
Although this report is in the public domain, permission must be secured from the individual copyright owners to reproduce any copyrighted materials contained within this report.
Suggested citation:Curran, J.H., McTeague, M.L., Burril, S.E., and Zimmerman, C.E., 2011, Distribution, persistence, and hydrologic characteristics of salmon spawning habitats in clearwater side channels of the Matanuska River, southcentral Alaska: U.S. Geological Survey Scientific Investigations Report 2011–5102, 38 p.

iii
Contents
Abstract ...........................................................................................................................................................1Introduction.....................................................................................................................................................1Description of Study Area ............................................................................................................................2Methods of Study and Data Collection .....................................................................................................5
Determinations of Channel Distribution, Geomorphic Characteristics, and Salmon Use of Side Channels ..............................................................................................................5
Selection of Field Reconnaissance, Intensive-Survey, and Monitoring Sites ............................6Measurements and Monitoring of Surface Water and Channel Characteristics ....................10Measurements and Monitoring of Intergravel Water Temperature ..........................................11
Distribution and Persistence of Side Channels and Their Use by Salmon ........................................11Hydrologic, Physical, and Water-Quality Characteristics of Side Channels .....................................18
Physical Characteristics and Riparian Vegetation ........................................................................24Surface Water Characterization and Comparison to Source Waters .......................................24Reach-Scale Spawning Site Selection ...........................................................................................27Intergravel Water Temperature ........................................................................................................30
Summary and Conclusions .........................................................................................................................34Acknowledgments .......................................................................................................................................34References Cited..........................................................................................................................................34Appendix A. Description of Matanuska River Clearwater Side Channel Geographic
Information System Products .......................................................................................................37

iv
Figures Figure 1. Map showing location of Matanuska River and vicinity, Alaska ………………… 3 Figure 2. Orthophotograph showing typical clearwater side channels in the 2006 braid
plain of the Matanuska River, Alaska …………………………………………… 4 Figure 3. Map showing locations of reconnaissance measurement, survey, and
monitoring sites in clearwater side channels, tributaries, springs, and mainstem channels of the Matanuska River, Alaska, 2007–09 …………………… 7
Figure 4. Map showing locations of monitoring sites in clearwater side channels and tributaries of the Matanuska River, Alaska ……………………………………… 9
Figure 5. Map showing locations of side channels delineated from 2006 orthophotography, Matanuska River, Alaska ……………………………………… 13
Figure 6. Graph showing total length of side channels in 1 kilometer-long polygons and braid plain width at 1 kilometer transects, Matanuska River, Alaska …………… 14
Figure 7. Orthophotographs and corresponding maps showing clearwater side channels and mainstem from braid plain kilometer 3–9 in 1949, 1978, 1985, and 1996, Matanuska River, Alaska …………………………………………………… 15
Figure 8. Orthophotographs showing clearwater side channels and tributaries from braid plain kilometers 37–40 in 1949 and 2006, Matanuska River, Alaska ………… 16
Figure 9. Map showing salmon presence/absence survey limits and results, Matanuska River, Alaska, September 13, 2007 ………………………………………………… 17
Figure 10. Photograph showing salmon in a clearwater side channel of the Matanuska River, Alaska ……………………………………………………………………… 18
Figure 12. Photograph showing lack of ice cover typical of winter conditions in clearwater side channels, site SC18, Matanuska River, Alaska ………………… 25
Figure 11. Graph showing maximum, mean, and minimum daily surface water temperatures at side channel monitoring site SC19, Matanuska River, Alaska, 2007–09 …………………………………………………………………………… 25
Figure 13. Graph showing specific conductance in side channels and spring, mainstem, and tributary source waters along the Matanuska River, Alaska, 2007–08 ……… 26
Figure 14. Graphs showing surface and intergravel water temperature at monitoring sites on side channels and tributaries along Matanuska River, Alaska, September 2008–May 2009 …………………………………………………………………… 31
Figure 15. Graphs showing longitudinal distribution of intergravel temperature within 100-m reaches at intensive survey sites on clearwater side channels and a tributary along Matanuska River, Alaska, September–October 2008 ……………… 33

v
Tables Table 1. Orthophotography and satellite orthoimagery used to determine location,
turbidity, braid plain characteristics, and historical conditions of clearwater side channels, Matanuska River, Alaska ……………………………………………… 5
Table 2. Map numbers, location data, and activities at field sites in clearwater side channels, springs, tributaries, and mainstem channels of the Matanuska River, Alaska, 2007–09 …………………………………………………………………… 8
Table 3. Length, distribution, and density of side channels in six geomorphic reaches of the Matanuska River, Alaska, 2006 ……………………………………………… 11
Table 4. Summary of selected attributes of clearwater side channels of the Matanuska River, Alaska, 2006 ………………………………………………………………… 12
Table 5. Surface water and channel characteristic reconnaissance data for clearwater side channels, springs, tributaries, and mainstem streams, Matanuska River, Alaska, 2007–08 …………………………………………………………………… 19
Table 6. Summary statistics for spring-autumn surface water and channel characteristic reconnaissance data for side channels and source waters, Matanuska River, Alaska …………………………………………………………………………… 24
Table 7. Discharge measurements in side channel sites for the Matanuska River (sites SC18 and SC19) and the Moose Creek tributary (site T4), Matanuska River, Alaska, 2007–08 …………………………………………………………………… 27
Table 8. Surface water and channel characteristic intensive survey data for a Matanuska River clearwater side channel (site SC19) near Palmer and Moose Creek (site T4), Alaska …………………………………………………………………………… 28
Table 9. Descriptive statistics for surface water and channel characteristic intensive survey data for Matanuska River side channel sites SC19(a) and SC19(b) and Moose Creek tributary site T4, Alaska …………………………………………… 30
Table 10. Summary of intergravel and surface water temperature data and accumulated thermal units from monitoring sites at three clearwater side channels and two tributaries of the Matanuska River, Alaska ……………………………………… 32

vi
Conversion Factors and Datums
Conversion Factors
Multiply By To obtain
Length
centimeter (cm) 0.3937 inch (in.)millimeter (mm) 0.03937 inch (in.)meter (m) 3.281 foot (ft) kilometer (km) 0.6214 mile (mi)
Area
square kilometer (km2) 247.1 acresquare kilometer (km2) 0.3861 square mile (mi2)
Flow rate
meter per second (m/s) 3.281 foot per second (ft/s) cubic meter per second (m3/s) 35.31 cubic foot per second (ft3/s)
Temperature in degrees Celsius (°C) may be converted to degrees Fahrenheit (°F) as follows:
°F=(1.8×°C)+32.
Specific conductance is given in microsiemens per centimeter at 25 degrees Celsius (µS/cm at 25°C).
Concentrations of chemical constituents in water are given either in milligrams per liter (mg/L) or micrograms per liter (µg/L).
Datums
Vertical coordinate information is referenced to the National Geodetic Vertical Datum of 1929 (NGVD 29).
Horizontal coordinate information is referenced to the North American Datum of 1983 (NAD 83).
Elevation, as used in this report, refers to distance above the vertical datum.

Distribution, Persistence, and Hydrologic Characteristics of Salmon Spawning Habitats in Clearwater Side Channels of the Matanuska River, Southcentral Alaska
By Janet H. Curran, Monica L. McTeague, Sean E. Burril, and Christian E. Zimmerman
AbstractTurbid, glacially influenced rivers are often considered
to be poor salmon spawning and rearing habitats and, consequently, little is known about salmon habitats that do occur within rivers of this type. To better understand salmon spawning habitats in the Matanuska River of southcentral Alaska, the distribution and characteristics of clearwater side-channel spawning habitats were determined and compared to spawning habitats in tributaries. More than 100 kilometers of clearwater side channels within the braided mainstem of the Matanuska River were mapped for 2006 from aerial images and ground-based surveys. In reaches selected for historical analysis, side channel locations shifted appreciably between 1949 and 2006, but the relative abundance of clearwater side channels was fairly stable during the same period. Geospatial analysis of side channel distribution shows side channels typically positioned along abandoned bars at the braid plain margin rather than on bars between mainstem channels, and shows a strong correlation of channel abundance with braid plain width. Physical and geomorphic characteristics of the channel and chemical character of the water measured at 19 side channel sites, 6 tributary sites, 4 spring sites, and 5 mainstem channel sites showed conditions suitable for salmon spawning in side channels and tributaries, and a correlation of side channel characteristics with the respective tributary or groundwater source water. Autumn-through-spring monitoring of intergravel water temperatures adjacent to salmon redds (nests) in three side channels and two tributaries indicate adequate accumulated thermal units for incubation and emergence of salmon in side channels and relatively low accumulated thermal units in tributaries.
IntroductionIn the management of salmon populations, mainstem
glacial rivers are primarily considered as migration corridors, with little attention given to their possible role as spawning habitats. Tributaries are typically the focus of salmon habitat protection and restoration, while actions or practices on mainstem waterways focus on facilitating passage of migrating salmon. Mainstem habitats, however, have been shown to provide valuable spawning areas and to contribute significantly to the overall production of some salmon populations (Wood and others, 1987; Eiler and others, 1992). Further, because glacial rivers are characterized by high turbidity levels and high concentrations of suspended sediments, they are generally considered to be poor spawning habitat for salmon (Lloyd and others, 1987; Young and Woody, 2007). In glacial river systems, salmon habitat has often been assumed to consist primarily of clearwater tributaries, but the mainstem of braided rivers commonly consists of large, turbid channels, smaller turbid channels, and clearwater side channels that potentially provide non-turbid habitat. Other studies have documented habitat use by salmon in clearwater channels and small, seasonally turbid channels within mainstem valleys (Lorenz and Eiler, 1989, Eiler and others, 1992, McPhee and others, 2009), but many large glacial river systems have been virtually ignored as salmon habitat. Thus, the nature of clearwater side channels and the extent to which they provide salmon spawning habitat is underexplored but has implications for habitat restoration and preservation.
2 Salmon Spawning Habitats in Clearwater Side Channels, Matanuska River, Southcentral Alaska
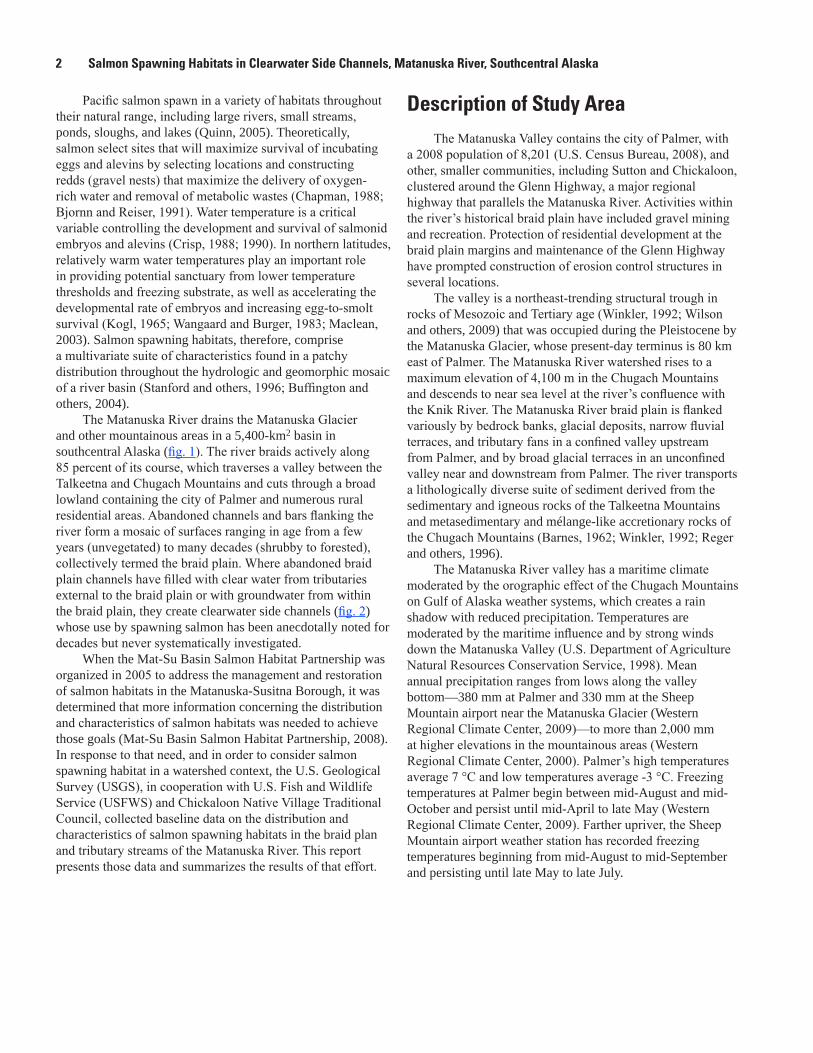
Pacific salmon spawn in a variety of habitats throughout their natural range, including large rivers, small streams, ponds, sloughs, and lakes (Quinn, 2005). Theoretically, salmon select sites that will maximize survival of incubating eggs and alevins by selecting locations and constructing redds (gravel nests) that maximize the delivery of oxygen-rich water and removal of metabolic wastes (Chapman, 1988; Bjornn and Reiser, 1991). Water temperature is a critical variable controlling the development and survival of salmonid embryos and alevins (Crisp, 1988; 1990). In northern latitudes, relatively warm water temperatures play an important role in providing potential sanctuary from lower temperature thresholds and freezing substrate, as well as accelerating the developmental rate of embryos and increasing egg-to-smolt survival (Kogl, 1965; Wangaard and Burger, 1983; Maclean, 2003). Salmon spawning habitats, therefore, comprise a multivariate suite of characteristics found in a patchy distribution throughout the hydrologic and geomorphic mosaic of a river basin (Stanford and others, 1996; Buffington and others, 2004).
The Matanuska River drains the Matanuska Glacier and other mountainous areas in a 5,400-km2 basin in southcentral Alaska (fig. 1). The river braids actively along 85 percent of its course, which traverses a valley between the Talkeetna and Chugach Mountains and cuts through a broad lowland containing the city of Palmer and numerous rural residential areas. Abandoned channels and bars flanking the river form a mosaic of surfaces ranging in age from a few years (unvegetated) to many decades (shrubby to forested), collectively termed the braid plain. Where abandoned braid plain channels have filled with clear water from tributaries external to the braid plain or with groundwater from within the braid plain, they create clearwater side channels (fig. 2) whose use by spawning salmon has been anecdotally noted for decades but never systematically investigated.
When the Mat-Su Basin Salmon Habitat Partnership was organized in 2005 to address the management and restoration of salmon habitats in the Matanuska-Susitna Borough, it was determined that more information concerning the distribution and characteristics of salmon habitats was needed to achieve those goals (Mat-Su Basin Salmon Habitat Partnership, 2008). In response to that need, and in order to consider salmon spawning habitat in a watershed context, the U.S. Geological Survey (USGS), in cooperation with U.S. Fish and Wildlife Service (USFWS) and Chickaloon Native Village Traditional Council, collected baseline data on the distribution and characteristics of salmon spawning habitats in the braid plan and tributary streams of the Matanuska River. This report presents those data and summarizes the results of that effort.
Description of Study AreaThe Matanuska Valley contains the city of Palmer, with
a 2008 population of 8,201 (U.S. Census Bureau, 2008), and other, smaller communities, including Sutton and Chickaloon, clustered around the Glenn Highway, a major regional highway that parallels the Matanuska River. Activities within the river’s historical braid plain have included gravel mining and recreation. Protection of residential development at the braid plain margins and maintenance of the Glenn Highway have prompted construction of erosion control structures in several locations.
The valley is a northeast-trending structural trough in rocks of Mesozoic and Tertiary age (Winkler, 1992; Wilson and others, 2009) that was occupied during the Pleistocene by the Matanuska Glacier, whose present-day terminus is 80 km east of Palmer. The Matanuska River watershed rises to a maximum elevation of 4,100 m in the Chugach Mountains and descends to near sea level at the river’s confluence with the Knik River. The Matanuska River braid plain is flanked variously by bedrock banks, glacial deposits, narrow fluvial terraces, and tributary fans in a confined valley upstream from Palmer, and by broad glacial terraces in an unconfined valley near and downstream from Palmer. The river transports a lithologically diverse suite of sediment derived from the sedimentary and igneous rocks of the Talkeetna Mountains and metasedimentary and mélange-like accretionary rocks of the Chugach Mountains (Barnes, 1962; Winkler, 1992; Reger and others, 1996).
The Matanuska River valley has a maritime climate moderated by the orographic effect of the Chugach Mountains on Gulf of Alaska weather systems, which creates a rain shadow with reduced precipitation. Temperatures are moderated by the maritime influence and by strong winds down the Matanuska Valley (U.S. Department of Agriculture Natural Resources Conservation Service, 1998). Mean annual precipitation ranges from lows along the valley bottom—380 mm at Palmer and 330 mm at the Sheep Mountain airport near the Matanuska Glacier (Western Regional Climate Center, 2009)—to more than 2,000 mm at higher elevations in the mountainous areas (Western Regional Climate Center, 2000). Palmer’s high temperatures average 7 °C and low temperatures average -3 °C. Freezing temperatures at Palmer begin between mid-August and mid-October and persist until mid-April to late May (Western Regional Climate Center, 2009). Farther upriver, the Sheep Mountain airport weather station has recorded freezing temperatures beginning from mid-August to mid-September and persisting until late May to late July.

Description of Study Area 3
tac1
1-51
75_f
ig01
Base
map
mod
ified
from
U.S
. Geo
logi
cal S
urve
y di
gita
l dat
aset
s, v
ario
us s
cale
s.
Proj
ectio
n: U
nive
rsal
Tra
nsve
rse
Mer
cato
r Zon
e 6N
, Nor
th A
mer
ican
Dat
um 1
983.
ALAS
KA
Figur
elo
catio
n
010
205
MIL
ES
010
205
KILO
MET
ERS
Knik
Riv
er
Matanuska
Glacier
Coo
k In
let
Susitna River
GLEN
N H
IGHW
AY
Mat
anus
ka R
iver
Bas
in B
ound
ary
TALK
EETN
A MOUNTA
INS
CHUG
ACH
MOU
NTAIN
S
MU
NIC
IPA
LIT
Y O
F A
NC
HO
RA
GE
MAT
AN
USK
A-S
USI
TN
A B
OR
OU
GH
147º
149º
62º
61º 3
0'K
nik
Sutto
n
Palm
er
Eklu
tna
Eagl
e R
iver
Hou
ston
Was
illa
Big
Lak
e
Anc
hora
ge
Chi
ckal
oon
Mat
anus
ka R
iver
Littl
e Su
sitn
aRi
ver
Figu
re 1
. Lo
catio
n of
Mat
anus
ka R
iver
and
vic
inity
, Ala
ska.

4 Salmon Spawning Habitats in Clearwater Side Channels, Matanuska River, Southcentral Alaska
The mean annual flow of the Matanuska River is 110 m3/s at Palmer, based on records from 1949–2008 (U.S. Geological Survey, 2008). Peak flows ranging from 420 to 2,300 m3/s typically occur in June or July and often are associated with glacial runoff. The mainstem of the river is turbid from spring through autumn, when glacial runoff is greatest, and is relatively clear beneath an ice cover in winter. Tributaries, the largest of which are Kings and Chickaloon Rivers, originate in the Chugach and Talkeetna Mountains and join the Matanuska along its entire confined length. Lakes occupy less than 1 percent of the Matanuska River’s basin (Curran and others, 2003) and are distributed as lakes and ponds 0.5 km2 or less in area along the Matanuska Valley bottom.
Five species of Pacific salmon, including Chinook salmon (Oncorhynchus tshawytscha), sockeye salmon (O. nerka), coho salmon (O. kisutch), chum salmon (O. keta), and pink salmon (O. gorbuscha), spawn and rear in the Matanuska River and its tributaries. Matanuska River salmon contribute to commercial fisheries in Upper Cook Inlet as well as supporting a small sport fishery in the Matanuska River. In 2008, migration of chum, coho, and sockeye salmon into the Matanuska River lasted from July 22 to September 20. In 2008, detections of 263 radio-tagged salmon that were tracked to spawning sites indicated that 90 percent of chum salmon (42 of 46), 98 percent of sockeye salmon (81 of 82), and 45 percent of coho salmon (61 of 135) spawned in the braid plain (Anderson and Bromaghin, 2009).
Figure 2. Typical clearwater side channels in the 2006 braid plain of the Matanuska River, Alaska. Three side channels in an unvegetated channel-margin bar are shown. Channel A is along the braid plain margin and channels B and C are away from the braid plain margin.
tac11-5175_fig02
48
GLENN HIGHWAY
EXPLANATION
Braid plain kilometer
Braid plain boundary
48
0 100 200 FEET
0 100 200 METERS
clearwater side channels
island
unvegetated channel-margin bar
vegetated channel-margin bar
A
B
C
braid plain
upland
Imagery: U.S. Geological Survey orthophotograph, 1 ft pixels, 2006 photography. Projection: Universal Transverse Mercator Zone 6, North American Datum 1983.

Methods of Study and Data Collection 5
Methods of Study and Data Collection
Determinations of Channel Distribution, Geomorphic Characteristics, and Salmon Use of Side Channels
Clearwater side channels are defined here as channels that convey water from a non-mainstem source through the braid plain to the turbid mainstem. Thus, the existence of such channels requires a primary water source from a tributary or spring and a mainstem connection at the distal end. For this study of the Matanuska River, where side channels were joined by a slough of the mainstem, the side channel designation was dropped if that slough overwhelmed the volume of the side channel. The presence or absence of fish was not a factor in defining side channels, but the channels needed to be accessible to fish by virtue of a connection to the mainstem.
A true-color orthophotograph derived from 1:24,000-scale aerial photographs taken in October 2006 for a USGS bank erosion study (U.S. Geological Survey, 2006) provided shadow-free base imagery for mapping side channels. Side channels were digitized at a scale of 1:2,300 using
heads-up digitizing in a Geographic Information System (GIS) (appendix A). Additional orthophotographs from 1949 and 1962 aerial photographs provided a comparison of the historical distribution of side channels in the Matanuska River braid plain, and true-color orthophotography from 2004 (below Chickaloon) and satellite imagery from 2005 (above Chickaloon) provided coverage outside the mainstem corridor (table 1). Orthophotography from additional dates between those of the primary full-river orthophotographs (table 1) was used to confirm observations and allowed for decadal-scale analysis of side channel persistence downstream from Palmer. In true-color photographs, side channels were detectable as those with bluish (clear) water, and the turbid mainstem and sloughs appeared gray or brown (fig. 2). In black and white photographs, the clearwater side channels appeared much darker than those carrying turbid water. In areas where historical photography was difficult to interpret, known water sources and patterns of clearwater side channels visible in 2004/2005 and 2006 color aerial orthophotographs were used to verify channel presence. In the lower resolution historical photography, the downstream connection to the mainstem was not always visible but was inferred from the size and position of the channels.
Table 1. Orthophotography and satellite orthoimagery used to determine location, turbidity, braid plain characteristics, and historical conditions of clearwater side channels, Matanuska River, Alaska.
[Abbreviations: m, meter; USGS, U.S. Geological Survey; N/A, not available]
Date(s) Type Media SourceExtent (downstream to
upstream location)
Aerial photograph
scale
Pixel resolution
(m)
08-10-1949, 08-14-1949, 08-15-1949
Orthophotograph mosaic
Black and white
USGS Mouth of Matanuska River to Matanuska Glacier
1:50,000 0.6096
06-06-19601, 05-24-1962
Orthophotograph mosaic
Black and white
USGS Mouth of Matanuska River to Matanuska Glacier
1:24,000 (1960), 1:40,000 (1962)
0.6096
08-25-1978 Orthophotograph mosaic
Color infared
Matanuska-Susitna Borough
Mouth of Matanuska River to Palmer
1:64,000 2
09-21-1985 Orthophotograph mosaic
True color Matanuska-Susitna Borough
Mouth of Matanuska River to Palmer
1:36,000 2
07-19-1990, 08-12-1991
Orthophotograph mosaic
True color USGS Mouth of Matanuska River to Palmer
1:40,000 0.6096
1996 Orthophotograph mosaic
True color Matanuska-Susitna Borough
Mouth of Matanuska River to Palmer
1:24,000 2
06-2004 Orthophotograph mosaic
True color Natural Resources Conservation Service
Mouth of Matanuska River to Chickaloon
1:24,000 1
2005 DigitalGlobe satellite data
True color Matanuska-Susitna Borough
Chickaloon to Matanuska Glacier N/A 1
10-14-2006 Orthophotograph mosaic
True color USGS Mouth of Matanuska River to Matanuska Glacier
1:24,000 0.3
1 1960 photography was used to create the orthophotograph in a small area near the river mouth that was not covered by the 1962 photography.
6 Salmon Spawning Habitats in Clearwater Side Channels, Matanuska River, Southcentral Alaska
Side channels in an active braid plain are by nature ephemeral, so the 2006 condition was used as a baseline. Ground observations and low-elevation aerial surveys confirmed the presence of clear water, thus providing calibration of the process of delineation from the orthophotography. Field observations of clearwater side channels during the first spring and early summer following the October 2006 photography, before river flows could alter channels, provided the most robust confirmation of side channel locations.
For reference, a braid plain centerline was drawn and used to generate braid plain kilometer numbers, starting at the river mouth (at its confluence with the Knik River; fig. 3). For comparison and discussion purposes, the Matanuska River was divided into six geomorphic reaches on the basis of channel and braid plain characteristics.
Each side channel was assigned attributes in a GIS database describing the type of alluvial surface it flowed through and its position within the braid plain, the water source for the side channel, and the degree of turbidity (clear or semi-turbid) (see appendix A). Channel position, water source, and qualitative turbidity level were assigned on the basis of ground observations, aerial flight reconnaissance, and examination of orthophotographs. The alluvial surface containing the side channel was categorized as either a bar attached to the braid plain margin (channel-margin bar), a mid-channel bar (island), or a flood plain. Most surfaces within the braid plain have been part of the channel within the historical record (57 years from aerial photography plus an estimated 30–50 years from vegetation patterns, or roughly a century) and can be considered bars with ground cover ranging from unvegetated to forested. Flood plains were considered to be indistinctly bounded areas where flooding can occur without lateral migration of the channel and a braid plain cannot be defined. Side channel position was categorized as being either along the braid plain margin or away from the margin, and water source was described as tributary, spring, or a mix of those sources. Where mainstem water joined the side channel, the turbidity descriptor was identified as semi-turbid.
The presence or absence of salmon was determined on the basis of a comprehensive aerial survey on September 13, 2007. For side channels that were not observed during the survey, presence/absence data are noted as “not determined” rather than absent.
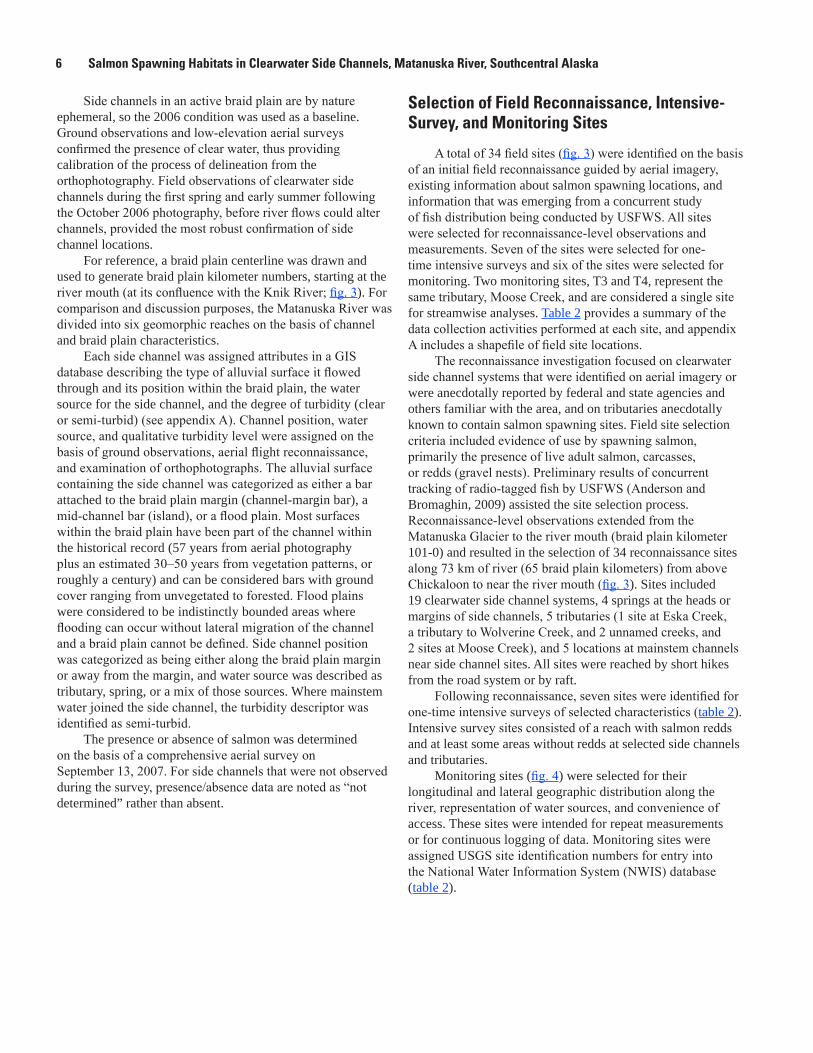
Selection of Field Reconnaissance, Intensive-Survey, and Monitoring Sites
A total of 34 field sites (fig. 3) were identified on the basis of an initial field reconnaissance guided by aerial imagery, existing information about salmon spawning locations, and information that was emerging from a concurrent study of fish distribution being conducted by USFWS. All sites were selected for reconnaissance-level observations and measurements. Seven of the sites were selected for one-time intensive surveys and six of the sites were selected for monitoring. Two monitoring sites, T3 and T4, represent the same tributary, Moose Creek, and are considered a single site for streamwise analyses. Table 2 provides a summary of the data collection activities performed at each site, and appendix A includes a shapefile of field site locations.
The reconnaissance investigation focused on clearwater side channel systems that were identified on aerial imagery or were anecdotally reported by federal and state agencies and others familiar with the area, and on tributaries anecdotally known to contain salmon spawning sites. Field site selection criteria included evidence of use by spawning salmon, primarily the presence of live adult salmon, carcasses, or redds (gravel nests). Preliminary results of concurrent tracking of radio-tagged fish by USFWS (Anderson and Bromaghin, 2009) assisted the site selection process. Reconnaissance-level observations extended from the Matanuska Glacier to the river mouth (braid plain kilometer 101-0) and resulted in the selection of 34 reconnaissance sites along 73 km of river (65 braid plain kilometers) from above Chickaloon to near the river mouth (fig. 3). Sites included 19 clearwater side channel systems, 4 springs at the heads or margins of side channels, 5 tributaries (1 site at Eska Creek, a tributary to Wolverine Creek, and 2 unnamed creeks, and 2 sites at Moose Creek), and 5 locations at mainstem channels near side channel sites. All sites were reached by short hikes from the road system or by raft.
Following reconnaissance, seven sites were identified for one-time intensive surveys of selected characteristics (table 2). Intensive survey sites consisted of a reach with salmon redds and at least some areas without redds at selected side channels and tributaries.
Monitoring sites (fig. 4) were selected for their longitudinal and lateral geographic distribution along the river, representation of water sources, and convenience of access. These sites were intended for repeat measurements or for continuous logging of data. Monitoring sites were assigned USGS site identification numbers for entry into the National Water Information System (NWIS) database (table 2).

Methods of Study and Data Collection 7
tac1
1-51
75_f
ig03
Coal C
reek
Moose Creek
Wol
verin
e Cr
eek
Kings R
iver
Granite Creek
Eska C
reek
Sawm
ill C
reek
Carpenter Creek
Carbon Creek
Young Creek
Boul
der C
reek
Ninemile Creek
Chickaloon River
Riley Creek
California Cree
k
Knob Creek
Linquist Cree
k
Littl
e Gra
nite
Cree
k
Kni
k Ri
ver
Metal Creek
Frid
ay C
reek
Jim C
reek
Little Susitna RiverWasilla Creek
Bodenburg Creek
McR
ober
ts Cr
eek
GoatCree
k
Mata
nusk
a Rive
r
GLEN
N
HIGH
WAY
OLD GLENN HIGHWAY
PALM
ER-W
ASI
LLA
HIG
HW
AY
GLENN HIGHWAY
But
te
Sutto
n
Palm
er
Chi
ckal
oon
EXPL
AN
ATIO
N
Reco
nnai
ssan
ce m
easu
rem
ent,
surv
ey,
or
mon
itori
ng s
ite—
See
tabl
e 2
for
sp
ecifi
c ac
tivity
per
form
ed
USG
S ga
ging
sta
tion
1528
4000
Bra
id p
lain
kilo
met
er
80SC17
0
80
70
60
50
40
30
20
10
T5
T3
T2
T4
T6
T1
SC2
SC9
SC8
SC4
MC1
MC5M
C3
SC1
MC2
SC7
SC3
SC5
SC6
MC4
SC19
SC11
SC10
SC15
SC17
SC16 SP
R4
SC14
SC13
SC12
SPR3
SC18
SPR2
SPR1
Base
map
mod
ified
from
U.S
. Geo
logi
cal S
urve
y di
gita
l dat
aset
s, v
ario
us s
cale
s.
Proj
ectio
n: U
nive
rsal
Tran
sver
se M
erca
tor Z
one
6N, N
orth
Am
eric
an D
atum
198
3.
04
8 M
ILES
04
8 K
ILOM
ETER
S
148˚
45’
148˚
30’
148˚
15’
149˚
149˚
15’
61˚4
5’
61˚3
0’
Figu
re 3
. Lo
catio
ns o
f rec
onna
issa
nce
mea
sure
men
t, su
rvey
, and
mon
itorin
g si
tes
in c
lear
wat
er s
ide
chan
nels
, trib
utar
ies,
spr
ings
, and
mai
nste
m
chan
nels
of t
he M
atan
uska
Riv
er, A
lask
a, 2
007–
09.

8 Salmon Spawning Habitats in Clearwater Side Channels, Matanuska River, Southcentral Alaska
Table 2. Map numbers, location data, and activities at field sites in clearwater side channels, springs, tributaries, and mainstem channels of the Matanuska River, Alaska, 2007–09.
[Map No.: Shown in figure 3. Braid plain kilometer: Sites near tributary mouths were given braid plain kilometer of confluence. Abbreviations: USGS, U.S. Geological Survey; N/A, not applicable]
Map No.
Braid plain
kilometer
ActivitiesUSGS site
identification No.
Reconnaissance Intensive survey Monitoring
Surface water attributes
Channel and surface water
Intergravel temperature
Surface water temperature
Intergravel temperature
Streamflow
Side channel sites
SC1 72 XSC2 67 X XSC3 48 XSC4 47 XSC5 46 X X X X 614414148410300SC6 46 XSC7 44 XSC8 37 XSC9 33 XSC10 31 XSC11 31 XSC12 31 XSC13 24 XSC14 24 XSC15 21 XSC16 19 XSC17 19 X XSC18 15 X X X X X 613653149045600SC19 7 X X X X X X 613339149062400
Spring sites
SPR1 48 XSPR2 46 XSPR3 15 XSPR4 8 X
Tributary sites
T1 N/A XT2 N/A XT3 1 N/A X X 614104149031500T4 1 24 X X X X 614024149021600T5 N/A X X X X 613928148585500T6 17 X
Mainstem sites
MC1 48 XMC2 32 XMC3 24 XMC4 15 XMC5 8 X1T3 and T4 are located on Moose Creek and are considered a single site for the purpose of analysis.

Methods of Study and Data Collection 9
tac1
1-51
75_f
ig04
USG
S ga
ging
sta
tion
1528
4000
Wol
verin
e Cre
ek
Moose
Creek
Eska Creek
Carpen
ter C
reek
King
s Rive
r
Granite Creek
Knob Creek
Premier
Creek
Wol
veri
ne
Lake
GLEN
N
TRUN
K
OLD GLENN
PALM
ER-F
ISHH
OOK
PALM
ER-W
ASIL
LA
ARCT
IC
COBB
GLENN
But
te
Sutto
n
Palm
er
T5
T3
T4
SC5
SC19
SC18
50
40
30
20 10
10
EXPL
AN
ATIO
N
Mon
itori
ng s
ite
Bra
id p
lain
kilo
met
er
02
4 M
ILES
1
02
4 K
ILOM
ETER
S1
Base
map
mod
ified
from
U.S
. Geo
logi
cal S
urve
y di
gita
l dat
aset
s, v
ario
us s
cale
s.
Proj
ectio
n: U
nive
rsal
Tran
sver
se M
erca
tor Z
one
6N, N
orth
Am
eric
an D
atum
198
3.
148˚
45’
149˚
61˚4
5’
61˚4
0’
61˚3
5’
Figu
re 4
. Lo
catio
ns o
f mon
itorin
g si
tes
in c
lear
wat
er s
ide
chan
nels
and
trib
utar
ies
of th
e M
atan
uska
Riv
er, A
lask
a.

10 Salmon Spawning Habitats in Clearwater Side Channels, Matanuska River, Southcentral Alaska
Measurements and Monitoring of Surface Water and Channel Characteristics
Field measurements of surface water and channel characteristics were made during reconnaissance, intensive survey, and monitoring activities in 2007–09. Reconnaissance and intensive surveys included measurements of the pH, temperature, conductivity, dissolved oxygen, and turbidity of the water, referred to collectively as water-quality field parameters, as well as measurements of channel depth, width, substrate, and water velocity. Surface-water monitoring included continuous recording of water temperatures and discrete measurements of water-quality field parameters and stream discharge.
Field measurements were made at all reconnaissance sites between April and September 2007 or between March and October 2008. Selected sites were visited on multiple dates for an informal inspection of the temporal variability of water and channel characteristics. Measurements of water-quality field parameters typically consisted of three point readings with a YSI multi-parameter sonde made while wading along a transect across side channels and tributaries, and single point readings at springs and mainstem channels. Instrument calibration and field measurement of water-quality parameters generally followed procedures described in Chapter A6 of the USGS National Field Manual for the Collection of Water-Quality Data (Wilde, variously dated). Water velocity was measured with a Price AA meter, and depth was noted on the wading rod. Channel substrate at reconnaissance sites was qualitatively categorized on the basis of visual observations of the presence of silt, sand, gravel, or cobbles.
Summary statistics were calculated from the reconnaissance data to generally characterize surface-water and channel characteristics in Matanuska River clearwater side channels. Point data were considered to be sufficiently distributed so as to avoid overweighting a particular site, so no transect or site averaging was applied. Data collection was not extensive enough to draw statistically significant comparisons between single transects and areas, between different seasons at a single site, or between different reaches of the river.
Intensive surveys for channel and surface-water characteristics consisted of a single field visit to make more densely spaced measurements of characteristics measured at reconnaissance sites, as well as to make measurements of water-surface gradient and particle size. Site T4 and two reaches at SC19 were surveyed within a 1-week period in August 2007. A reach 60–120 m long containing areas with and
without salmon redds was identified at each site. Measurement points within each reach included all redds observed and a grid of three points along transects spaced about a channel width apart. Measurement locations and reach water-surface elevations were surveyed with a total station surveying instrument. Water-quality parameters and stream velocity and depth were measured using the same methods as for the reconnaissance sites. The median substrate particle size (D50) was visually estimated to the nearest 5 mm, or noted as sand or silt for particles less than 2 mm (Platts and others, 1983).
Surface-water temperature monitoring focused on a single winter period—from September 2008 to May 2009—but included an extended record at one site that documented temperature variability for 2 years. Deployment of the surface-water temperature loggers generally coincided with deployment of the intergravel water temperature loggers (described in a following section) to provide a comparison between surface and subsurface waters. Surface water temperature at each site was monitored with a single continuously recording Onset Hobo Pro v2 thermistor fastened to a steel rod. The thermistors were positioned near the bed so that they would not be exposed to air because of low flows and low water stages, but shallow channel depths and sparse, short deciduous streamside vegetation could have exposed them to the thermal influence of sunlight. The temperature data were collected and processed in general accordance with procedures described in Wagner and others (2006). Field checks of thermistor performance consisted of comparison of temperature indicated by the deployed thermistor to temperatures recorded by a hand held thermistor housed in a hollow steel probe held adjacent to the surface water loggers.
Streamflow monitoring consisted of several discrete measurements of discharge in 2007 and 2008 at side channel monitoring sites SC18 and SC19 and at tributary monitoring site T4. These measurements were opportunistic assessments of flow conditions at the time of site visits for reconnaissance work and were intended as an exploration of streamflow quantity and patterns in the side channels. Water-quality field measurements were made at all six monitoring sites (SC5, SC18, SC19, T3, T4, and T5) along a single transect using the procedures referred to above.
All data collected at monitoring sites, including water-quality field parameters, surface-water temperature, and stream discharge measurements, are stored in the USGS NWIS database and can be accessed at http://waterdata.usgs.gov/nwis (see table 2 for site identification numbers).

Distribution and Persistence of Side Channels and Their Use by Salmon 11
Measurements and Monitoring of Intergravel Water Temperature
Intergravel water temperatures were mapped over a short reach at intensive survey sites selected for general characterization of the clearwater side channels and tributaries. Single visits were made to side channel sites SC2, SC5, SC17, SC18, and SC19, and to tributary site T5 between September 12 and October 2, 2008. Measurements were made along a 100-m transect that followed the centerline of the channel rather than the thalweg because a thalweg was generally not prominent. At every 10 to 25 m, depending on stream size and desired resolution, measurements were made, perpendicular to the transect, at evenly spaced points (0.5 to 2.5 m apart, again depending on stream size) on each side of the centerline. Measurements of intergravel water temperature were made using an electronic thermistor (Barnant LogR, thermistor data logger, model 600-1075) housed in a slightly flexible steel rod. The rod was inserted to 35 cm, a documented redd depth of sockeye and chum salmon (Montgomery and others, 1996; DeVries, 1997). Where gravel penetration to 35 cm was not possible, the maximum depth of penetration was recorded; 77 percent of the measurement depths were either 30 or 35 cm. Temperature readings were allowed to stabilize before being recorded.
At monitoring sites selected as representative of spawning habitat in the clearwater side channels and tributaries (SC5, SC18, SC19, T3, and T5), temperature data loggers (Onset TidbiT v2 water temperature data loggers) were installed adjacent to redds, at a 35-cm intergravel depth, to document temperatures during the incubation period for observed spawning salmon. Loggers recorded temperature every 15 minutes from September 12, 2008, until April 27, 2009. Field visits to check thermistor performance consisted of comparison of the temperatures indicated by the deployed thermistor to temperatures recorded by a hand held thermistor housed in a hollow steel probe pushed to the depth of the buried loggers. In addition to the data loggers, small containers
called “freeze vials” were installed along right and left banks near data logger locations to determine depth of freeze within the substrate. Freeze vials consisted of a series of four glass vials, filled with water, and secured at 0, 10, 20, and 30 cm within a tube of plastic mesh. Depth of freezing was determined based on breakage of the vials. When retrieved, the data were downloaded from temperature data loggers, and accumulated thermal units (ATUs) were calculated for each intergravel location. ATUs are the sum of mean daily temperature values above freezing and are used to track the development of incubating salmon eggs and embryos (Crisp, 1988). To calculate ATU, only positive mean daily temperatures were summed from date of installation to date of retrieval.
Distribution and Persistence of Side Channels and Their Use by Salmon
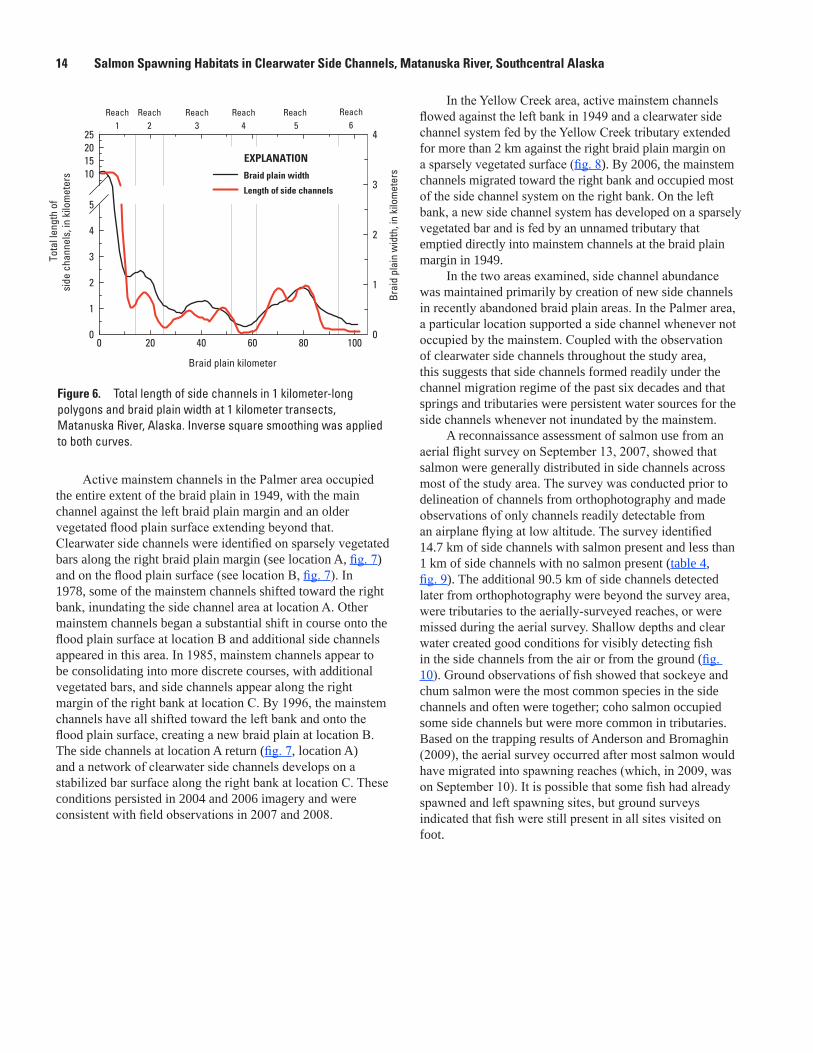
In 2006, the Matanuska River contained 105.8 km of clearwater side channels detectable from the 2006 orthophotograph and field observations (fig. 5). Of these, 42 channel sub-systems with at least one channel longer than 150 m could be identified. Some of these sub-systems consisted of a single channel and others consisted of a network with many small headwater channels that coalesced to form a single larger mainstem. Although the channels occurred in every geomorphic reach of the Matanuska River, they were most abundant in the wide braid plain of the lower river below the Old Glenn Highway bridge (reach 1), at 1.5 km/km2, and least common in the single-thread channel of the river near Chickaloon (reach 4), at 0.3 km/km2 (table 3). The sum of side channel lengths in 1 km-long segments of the braid plain correlates well to the braid plain width measured at 1 km transects (fig. 6).
Table 3. Length, distribution, and density of side channels in six geomorphic reaches of the Matanuska River, Alaska, 2006.
[Reach locations are shown in figure 5. Abbreviations: km, kilometer; km2, square kilometer; km/km2, kilometer per square kilometer]
ReachBraid plain kilometer
Reach area (km2)
Cumulative side channel length (km)
Side channel density (km/km2)
1 0–14 35.6 53.8 1.52 14–25 11.1 .9 .93 25–51 13.7 16.2 1.24 51–61 1.5 .5 .35 61–94 20.5 23.8 1.26 94–101 1.4 .7 .5
Study area 0–101 83.8 104.8 1.3

12 Salmon Spawning Habitats in Clearwater Side Channels, Matanuska River, Southcentral Alaska
Most side channels in the braid plain are on channel-margin bars (91.7 km) with relatively few on islands (11.8 km) or flood plain (2.3 km) surfaces (table 4). Side channels most frequently occur away from the braid plain margin (83.4 km) as opposed to along the braid plain margin (22.4 km). The right braid plain (as defined by the area to the right of the main channel’s thalweg, viewed in a downstream direction) had more abundant side channels (72.2 km) than did the left braid plain (33.6 km). Much of this length (46.9 km) can be accounted for in the wide, lower part of the braid plain (braid plain kilometers 0–8). Springs were the main water source for clearwater side channels (78.1 km), with only 2.6 km of side channels originating solely from tributaries, and 25.1 km of side channels containing a mixture of tributary and spring water (table 4). Aerial and ground surveys confirmed the presence of clearwater side channels for 35 percent of the length of side channels delineated from orthophotography (table 4).
Decadal scale analysis in reaches of the Matanuska River with frequent migration of the mainstem channel shows mainstem channels moving over a period of years to decades, with the relative abundance of side channels remaining fairly stable within a specific reach. Two study areas were selected to examine the process of side channel generation and the persistence of side channel sites over time in areas where the mainstem reoccupied an existing side channel site. The first reach includes a large spring-fed system including site SC19 near Palmer that was analyzed with the aid of comparative orthophotography from 1949, 1978, 1985, and 1996 (fig. 7). The second reach includes a tributary-influenced site near Sutton that includes T1, a stream locally known as Yellow Creek, that was compared in 1949 and 2006 orthophotography (fig. 8).
Table 4. Summary of selected attributes of clearwater side channels of the Matanuska River, Alaska, 2006.
[Abbreviation: km, kilometer]
CategorySide channel length (km)
Side channel length (percent)
Type of surface containing the side channel
Channel-margin bar 91.7 87Island 11.8 11Flood plain 2.3 2
Position of side channel within braid plain
Along margin 22.4 21Away from margin 83.4 79
Water source
Spring 78.1 74Tributary 2.6 2Tributary and spring 25.1 24
Field check of side channel presence
Aerial 18.6 17Aerial and ground 5.0 5Ground 13.7 13Not checked 68.6 65
Salmon observations on September 13, 2007
Present 14.7 14Not present .6 1Not determined 90.5 85

Distribution and Persistence of Side Channels and Their Use by Salmon 13
tac1
1-51
75_f
ig05
Knik R
iver
Metal Creek
Frid
ay C
reek
Little Susitna River
Jim C
reek
Wasilla Creek
Goat C
reek
Hunter Creek
McRoberts Creek
Fall C
reek
Glen
n Hi
ghw
ay
Old Glenn Highway
Palmer-Fishhook Road Glenn Highway
But
te
Sutto
n
Chi
ckal
oon
MAT
AN
USK
A-S
USI
TNA
BO
RO
UG
HM
UN
ICIP
ALI
TY O
F A
NC
HO
RA
GE
Palm
er 0
9080
7060
50
40
30
20 10
100
4
5
3
2 1
6
50
EXPL
AN
ATI
ON
Side
cha
nnel
Geo
mor
phic
reac
h
Bra
id p
lain
kilo
met
er
4
04
8 M
ILES
04
8 K
ILOM
ETER
S
Base
map
mod
ified
from
U.S
. Geo
logi
cal S
urve
y di
gita
l dat
aset
s, v
ario
us s
cale
s.
Proj
ectio
n: U
nive
rsal
Tra
nsve
rse
Mer
cato
r Zon
e 6N
, Nor
th A
mer
ican
Dat
um 1
983.
148˚
30’
148˚
149˚
61˚4
5’
61˚3
0’
Kings R
iver
Moose Creek
Granite Creek
Gravel Creek
Coal C
reek
Boulder Cree
k
Wol
verin
e Cr
eek
Hicks C
reek
Chickaloon River
Eska Creek
Glacier Creek
Saw
mill
Cre
ek
Carpenter Creek
Carbon Creek
Young Creek
Lake
Cre
ek
Pinochle Cree
k
Cascade Creek
Monument Creek
Doon
eCr
eek
Ninemile Creek
Fortress C
reek
Dan Creek
Riley Creek
Muddy Creek
Purinton Cree
k
Knob Creek
Premier Creek
Linqu
ist C
reek
Littl
e Gra
nite C
reek
O'Brien Creek
Mat
anus
ka R
iver
Frid
ay C
reek
Figu
re 5
. Lo
catio
ns o
f sid
e ch
anne
ls d
elin
eate
d fro
m 2
006
orth
opho
togr
aphy
, Mat
anus
ka R
iver
, Ala
ska.
14 Salmon Spawning Habitats in Clearwater Side Channels, Matanuska River, Southcentral Alaska
Active mainstem channels in the Palmer area occupied the entire extent of the braid plain in 1949, with the main channel against the left braid plain margin and an older vegetated flood plain surface extending beyond that. Clearwater side channels were identified on sparsely vegetated bars along the right braid plain margin (see location A, fig. 7) and on the flood plain surface (see location B, fig. 7). In 1978, some of the mainstem channels shifted toward the right bank, inundating the side channel area at location A. Other mainstem channels began a substantial shift in course onto the flood plain surface at location B and additional side channels appeared in this area. In 1985, mainstem channels appear to be consolidating into more discrete courses, with additional vegetated bars, and side channels appear along the right margin of the right bank at location C. By 1996, the mainstem channels have all shifted toward the left bank and onto the flood plain surface, creating a new braid plain at location B. The side channels at location A return (fig. 7, location A) and a network of clearwater side channels develops on a stabilized bar surface along the right bank at location C. These conditions persisted in 2004 and 2006 imagery and were consistent with field observations in 2007 and 2008.
In the Yellow Creek area, active mainstem channels flowed against the left bank in 1949 and a clearwater side channel system fed by the Yellow Creek tributary extended for more than 2 km against the right braid plain margin on a sparsely vegetated surface (fig. 8). By 2006, the mainstem channels migrated toward the right bank and occupied most of the side channel system on the right bank. On the left bank, a new side channel system has developed on a sparsely vegetated bar and is fed by an unnamed tributary that emptied directly into mainstem channels at the braid plain margin in 1949.
In the two areas examined, side channel abundance was maintained primarily by creation of new side channels in recently abandoned braid plain areas. In the Palmer area, a particular location supported a side channel whenever not occupied by the mainstem. Coupled with the observation of clearwater side channels throughout the study area, this suggests that side channels formed readily under the channel migration regime of the past six decades and that springs and tributaries were persistent water sources for the side channels whenever not inundated by the mainstem.
A reconnaissance assessment of salmon use from an aerial flight survey on September 13, 2007, showed that salmon were generally distributed in side channels across most of the study area. The survey was conducted prior to delineation of channels from orthophotography and made observations of only channels readily detectable from an airplane flying at low altitude. The survey identified 14.7 km of side channels with salmon present and less than 1 km of side channels with no salmon present (table 4, fig. 9). The additional 90.5 km of side channels detected later from orthophotography were beyond the survey area, were tributaries to the aerially-surveyed reaches, or were missed during the aerial survey. Shallow depths and clear water created good conditions for visibly detecting fish in the side channels from the air or from the ground (fig. 10). Ground observations of fish showed that sockeye and chum salmon were the most common species in the side channels and often were together; coho salmon occupied some side channels but were more common in tributaries. Based on the trapping results of Anderson and Bromaghin (2009), the aerial survey occurred after most salmon would have migrated into spawning reaches (which, in 2009, was on September 10). It is possible that some fish had already spawned and left spawning sites, but ground surveys indicated that fish were still present in all sites visited on foot.
Figure 6. Total length of side channels in 1 kilometer-long polygons and braid plain width at 1 kilometer transects, Matanuska River, Alaska. Inverse square smoothing was applied to both curves.
Braid plain kilometer
0 20 40 60 80 100
Brai
d pl
ain
wid
th, i
n ki
lom
eter
s
0
1
2
3
4
Tota
l len
gth
ofsi
de c
hann
els,
in k
ilom
eter
s
0
1
2
3
4
5
10152025
Braid plain width
Length of side channels
Reach1
Reach2
Reach3
Reach4
Reach 5
Reach6
EXPLANATION

Distribution and Persistence of Side Channels and Their Use by Salmon 15
tac11-5175_fig07
-
Imagery: (1949) U.S. Geological Survey black-and-white orthophotograph, 0.6 m pixels, 1949 photography. (1978) Matanuska-Susitna Borough false-color orthophotograph, 2 m pixels, 1978 photography. (1985) Matanuska-Susitna Borough true color orthophotograph, 2 m pixels, 1985 photography. (1996) Matanuska-Susitna Borough true color orthophotograph, 2 m pixels, 1996 photography. Projection: Universal Transverse Mercator Zone 6N, North American Datum 1983.
B
C
1949A
B
C
1978A
B
C
1985A
C
1996A
B
upland
braid plain
flood plain
A, B, C
EXPLANATION
Clearwater side channels
Reference location
Figure 7. Clearwater side channels and mainstem from braid plain kilometer 3–9 in 1949, 1978, 1985, and 1996, Matanuska River, Alaska. Over the time period shown, location A cycles from a clearwater side channel to mainstem and back to a clearwater side channel. Location B transitions from a flood plain to braid plain and has varying amounts of clearwater side channels. Location C transitions from mainstem to an abandoned braid plain with long clearwater side channels.

16 Salmon Spawning Habitats in Clearwater Side Channels, Matanuska River, Southcentral Alaska
tac11-5175_fig08
Yellow Creek
Yellow Creek
40
39
38
37
2006
m a i n c h a n n e l s
40
39
38
37
1949
m a i n c h a n n e l s
EXPLANATION
Tributary
Clearwater side channel
Braid plain kilometer38
0 0.2 0.4 MILES0.1
0 0.2 0.4 KILOMETERS0.1Imagery: U.S. Geological Survey (USGS) orthophotograph, 1 ft pixels, 2006 photography, and USGS orthophotograph, 2 ft pixels, 1949 photography. Base map modified from USGS digital datasets, various scales. Projection: Universal Transverse Mercator Zone 6, North American Datum 1983.
Figure 8. Clearwater side channels and tributaries from braid plain kilometers 37–40 in 1949 and 2006, Matanuska River, Alaska.

Distribution and Persistence of Side Channels and Their Use by Salmon 17
tac1
1-51
75_f
ig09
Kings R
iver
Moose Creek
Granite Creek
Gravel Creek
Coal C
reek
Boulder Cree
k
Wol
verin
e Cr
eek
Hicks C
reek
Chickaloon River
Eska Creek
Glacier Creek
Saw
mill
Cre
ek
Carpenter Creek
Carbon Creek
Young Creek
Lake
Cre
ek
Pinochle Cree
k
Cascade Creek
Monument Creek
Doon
e Cre
ek
Ninemile Creek
Fortress C
reek
Dan Creek
Riley Creek
Muddy Creek
Purinton Cree
k
Knob Creek
Premier Creek
Linqu
ist C
reek
Littl
e Gra
nite
Cree
kO'Brien Creek
Knik
Riv
er
Mat
anus
ka R
iver
OLD GLENN
TRUN
K
ROAD
PALMER-FISHHOOK
PALM
ER-W
ASIL
LAHI
GHW
AY
PARKS
HIGHWAY
GLENN HIGHWAY
GLEN
N H
IGHW
AY
100
90
8060
70
40
50
30
20
10
0
But
te
Sutto
n
Palm
er
Chi
ckal
oon
80
05
10 M
ILES
2.5
05
10 K
ILOM
ETER
S2.
5Ba
se m
ap m
odifi
ed fr
om U
.S. G
eolo
gica
l Sur
vey
digi
tal d
atas
ets,
var
ious
sca
les.
Pr
ojec
tion:
Uni
vers
al T
rans
vers
e M
erca
tor Z
one
6N, N
orth
Am
eric
an D
atum
198
3.
EXPL
AN
ATI
ON
Surv
ey li
mits
No
salm
on p
rese
nt
Salm
on p
rese
nt
Bra
id p
lain
kilo
met
er
148˚
30’
148˚
149˚
61˚4
5’
61˚3
0’
Figu
re 9
. Sa
lmon
pre
senc
e/ab
senc
e su
rvey
lim
its a
nd re
sults
, Mat
anus
ka R
iver
, Ala
ska,
Sep
tem
ber 1
3, 2
007.

18 Salmon Spawning Habitats in Clearwater Side Channels, Matanuska River, Southcentral Alaska
Hydrologic, Physical, and Water-Quality Characteristics of Side Channels
Measurements of surface water flow and quality, intergravel temperature, and channel characteristics provided data for (1) generally characterizing the clearwater side channels, (2) comparing the water-quality characteristics of surface water in side channels to surface water at their sources (tributaries and springs within the braid plain) and in the mainstem, (3) contrasting surface water and channel characteristics at sites selected by salmon for spawning to those not selected for spawning within the same reach, and (4) comparing intergravel water temperature to surface water temperature, and comparing intergravel water temperature between side channels and tributaries, during salmon spawning and incubation periods. The characterization and comparisons in items 1 and 2 drew from the reconnaissance data collected as point measurements at 19 sites over 65 braid plain kilometers (fig. 3) and from additional measurements at 6 of those sites designated as monitoring sites (fig. 4). Salmon spawning site selection analysis drew from intensive survey data collected at two locations at side channel site SC19 near Palmer and at a single location at tributary site T4, Moose
Figure 10. Salmon in a clearwater side channel of the Matanuska River, Alaska. (Photograph taken by Christian Zimmerman, U.S Geological Survey, August 28, 2007.)
Creek (fig. 4). Intergravel water temperature analysis drew from intensive survey data collected at 6 sites and monitoring at 5 sites.
Side channel reconnaissance point measurements were made when spawning salmon were present in August and September of 2007 and 2008, while measurements at springs and tributaries were made in spring (March, April, or May) and autumn (August, September, or October) of those years. Surface water and channel characteristics measured at these sites are presented in table 5 and summarized in table 6 for comparison. Care should be taken in interpreting seasonally-affected variables, such as water temperature, as the periods for measurement varied between types of stream listed in the summary tables. Summary statistics shown in table 6 are average values, except that for pH, which is presented as the median of the pH values to show the distribution of values (rather than the true average computed as the negative logarithm of the average of the hydrogen ion concentrations), and turbidity, which is represented by median values to account for the wide range and multimodal distribution of the values for this property. Additional water-quality field parameter data collected at monitoring sites along the Matanuska River in April, August, and September 2007 and in February and March of 2008 can be accessed at http://waterdata.usgs.gov/nwis.

Hydrologic, Physical, and Water-Quality Characteristics of Side Channels 19
Poin
t ide
ntifi
erM
ap
No.
Dat
eD
epth
(m
)
Wet
ted
w
idth
(m
)
Velo
city
(m
/s)
Tem
pera
ture
(°
C)
Spec
ific
cond
ucta
nce
(µS/
cm)
Dis
solv
ed
oxyg
en
(mg/
L)pH
Turb
idity
(N
TU)
Wat
er
sour
cePa
rtic
le s
ize
Fish
spe
cies
ob
serv
ed
Side
Cha
nnel
s
Long
Lake
XS1
WP2
15SC
109
-26-
2007
0.17
3.5
<0.0
36.
248
310
.38.
2<1
.0G
Wgr
avel
, cob
ble
coho
Long
Lake
XS1
WP2
16SC
109
-26-
2007
.17
<.03
6.2
483
10.5
8.2
<1.0
Long
Lake
XS1
WP2
17SC
109
-26-
2007
.08
<.03
6.3
483
10.5
8.2
<1.0
Rile
yCre
ekX
S1W
P278
.1SC
209
-30-
2008
.15
–.0
9–
––
––
GW
––
Rile
yCre
ekX
S1W
P278
.2SC
209
-30-
2008
.15
.20
––
––
–R
ileyC
reek
XS2
WP2
85.1
SC2
09-3
0-20
08.1
73.
5.0
9–
––
––
GW
––
Rile
yCre
ekX
S2W
P285
.2SC
209
-30-
2008
.15
<.03
––
––
–Pi
nnac
leX
S1W
P181
SC3
09-0
6-20
07.2
48.
7.2
29.
535
311
.56.
622
GW
, mai
nsa
nd, g
rave
l, co
bble
chum
, soc
keye
Pinn
acle
XS1
WP1
82SC
309
-06-
2007
.26
.09
9.2
359
11.5
6.7
22Pi
nnac
leX
S1W
P180
SC3
09-0
6-20
07.0
9.1
09.
933
811
.26.
729
Pinn
acle
XS2
WP1
85SC
309
-06-
2007
.09
2.1
.18
6.5
386
9.7
6.4
10G
W, m
ain
sand
, gra
vel
–Pi
nnac
leX
S2W
P183
SC3
09-0
6-20
07.0
9.1
46.
238
610
.46.
455
Opp
osite
Pinn
acle
XS1
WP3
.1SC
409
-05-
2007
.09
2.5
.12
8.7
381
10.5
7.5
–G
Wsi
lt, g
rave
l–
Opp
osite
Pinn
acle
XS1
WP3
.2SC
409
-05-
2007
.09
.14
6.8
400
10.8
7.4
–O
ppos
itePi
nnac
leX
S2W
P3.3
SC4
09-0
5-20
07.1
52.
3<.
037.
838
711
.67.
6–
GW
silt,
gra
vel
coho
Opp
osite
Pinn
acle
XS2
WP3
.4SC
409
-05-
2007
.15
<.03
7.6
388
11.9
7.5
–O
ppos
itePi
nnac
leX
S3W
P3.5
SC4
09-0
5-20
07.1
25.
1.0
58.
138
710
.87.
4–
GW
–so
ckey
eO
ppos
itePi
nnac
leX
S3W
P3.6
SC4
09-0
5-20
07.1
8<.
038.
038
710
.97.
4–
Opp
osite
Pinn
acle
XS3
WP3
.7SC
409
-05-
2007
.30
<.03
8.0
386
10.8
7.4
–Pi
nnac
leD
SXS1
WP1
69SC
509
-06-
2007
.11
3.8
.18
8.3
406
7.7
6.9
3G
Wgr
avel
chum
, soc
keye
Pinn
acle
DSX
S1W
P168
SC5
09-0
6-20
07.1
2.2
17.
440
38.
66.
74
Pinn
acle
DSX
S1W
P167
SC5
09-0
6-20
07.1
2.1
16.
840
38.
76.
85
Pinn
acle
DSX
S2W
P172
SC5
09-0
6-20
07.0
94.
0.1
98.
640
67.
66.
42
GW
grav
elch
umPi
nnac
leD
SXS2
WP1
71SC
509
-06-
2007
.09
.18
7.2
402
8.3
6.3
3Pi
nnac
leD
SXS2
WP1
70SC
509
-06-
2007
.09
.20
6.6
401
8.8
6.4
14Pi
nnac
leD
SXS3
WP1
73SC
509
-06-
2007
.09
4.1
<.03
5.9
399
8.8
6.3
3G
W–
chum
, soc
keye
Pinn
acle
DSX
S3W
P174
SC5
09-0
6-20
07.1
2.1
65.
839
88.
86.
26
Pinn
acle
DSX
S3W
P175
SC5
09-0
6-20
07.1
2.1
75.
839
68.
66.
38
Pinn
acle
DSX
S4W
P176
SC5
09-0
6-20
07.1
23.
5.1
25.
739
78.
96.
33
GW
–ch
um, s
ocke
yePi
nnac
leD
SXS4
WP1
78SC
509
-06-
2007
.12
.14
5.8
398
8.4
6.4
3Pi
nnac
leD
SXS4
WP1
77SC
509
-06-
2007
.09
<.03
5.7
397
8.7
6.3
7Pi
nnac
leD
SXS1
WP3
28SC
508
-28-
2008
.19
3.9
–10
.544
16.
06.
7<1
.0G
Wgr
avel
, cob
ble
chum
, soc
keye
, Dol
ly V
arde
nPi
nnac
leD
SXS1
WP3
29SC
508
-28-
2008
.34
–10
.544
25.
66.
7<1
.0Pi
nnac
leD
SXS1
WP3
30SC
508
-28-
2008
.41
–10
.544
35.
46.
7<1
.0Pi
nnac
leD
SXS2
WP3
32SC
508
-28-
2008
.13
7.3
–9.
843
95.
87.
0<1
.0G
Wsa
nd, g
rave
l, co
bble
chum
, soc
keye
Pinn
acle
DSX
S2W
P333
SC5
08-2
8-20
08.2
4–
10.8
439
5.2
7.0
<1.0
Pinn
acle
DSX
S2W
P331
SC5
08-2
8-20
08.1
0–
9.3
443
6.1
7.0
<1.0
Tabl
e 5.
Su
rface
wat
er a
nd c
hann
el c
hara
cter
istic
reco
nnai
ssan
ce d
ata
for c
lear
wat
er s
ide
chan
nels
, spr
ings
, trib
utar
ies,
and
mai
nste
m s
tream
s, M
atan
uska
Riv
er, A
lask
a,
2007
–08.
[Sha
ding
indi
cate
s tra
nsec
t gro
upin
g. A
bbre
viat
ions
: m, m
eter
; m/s
, met
er p
er se
cond
; °C
, deg
rees
Cel
sius
; µS/
cm, m
icro
siem
ens p
er c
entim
eter
; mg/
L, m
illig
ram
per
lite
r; N
TU, n
ephe
lom
etric
turb
idity
uni
ts;
GW
, gro
undw
ater
; mai
n, m
ains
tem
; trib
, trib
utar
y; o
rg. m
at.,
orga
nic
mat
eria
l; co
ho, c
oho
salm
on; c
hum
, chu
m sa
lmon
; soc
keye
, soc
keye
salm
on; <
, les
s tha
n; –
not
ava
ilabl
e; N
/A, n
ot a
pplic
able
]

20 Salmon Spawning Habitats in Clearwater Side Channels, Matanuska River, Southcentral Alaska
Poin
t ide
ntifi
erM
ap
No.
Dat
eD
epth
(m
)
Wet
ted
w
idth
(m
)
Velo
city
(m
/s)
Tem
pera
ture
(°
C)
Spec
ific
cond
ucta
nce
(µS/
cm)
Dis
solv
ed
oxyg
en
(mg/
L)pH
Turb
idity
(N
TU)
Wat
er
sour
cePa
rtic
le s
ize
Fish
spe
cies
ob
serv
ed
Side
Cha
nnel
s—Co
ntin
ued
Pinn
acle
DSX
S3W
P334
SC5
08-2
8-20
08.2
914
.9–
7.8
437
7.0
7.1
2G
Wor
g. m
at.,
silt,
sand
, gra
vel
sock
eye
Pinn
acle
DSX
S3W
P335
SC5
08-2
8-20
08.3
2–
7.9
436
6.7
7.1
5Pi
nnac
leD
SXS3
WP3
36SC
508
-28-
2008
.54
–8.
543
76.
07.
25
Pinn
acle
DSX
S5W
P338
SC6
08-2
8-20
080.
214.
6–
8.2
278
13.1
7.5
380
GW
, mai
ngr
avel
, cob
ble
none
Pinn
acle
DSX
S5W
P339
SC6
08-2
8-20
08.2
3–
8.1
278
12.7
7.5
400
Pinn
acle
DSX
S5W
P340
SC6
08-2
8-20
08.2
4–
8.2
278
12.8
7.5
402
Pinn
acle
DSX
S6W
P341
SC6
08-2
8-20
08.1
76.
1–
9.3
336
10.2
7.6
262
GW
, mai
ngr
avel
, cob
ble
chum
, soc
keye
Pinn
acle
DSX
S6W
P343
SC6
08-2
8-20
08.2
3–
9.3
332
10.6
7.6
263
Pinn
acle
DSX
S6W
P342
SC6
08-2
8-20
08.2
3–
9.2
330
10.5
7.6
282
Kin
gsR
iver
XS1
WP1
89SC
709
-06-
2007
.12
5.6
0.23
10.0
348
11.3
6.6
2G
Wsa
nd, g
rave
lch
umK
ings
Riv
erX
S1W
P190
SC7
09-0
6-20
07.0
9.2
09.
934
511
.46.
62
Kin
gsR
iver
XS1
WP1
88SC
709
-06-
2007
.17
.33
9.7
338
11.3
6.6
3K
ings
Riv
erX
S2W
P192
SC7
09-0
6-20
07.1
46.
6<.
0310
.336
99.
46.
7<1
.0G
Wsa
nd, g
rave
l, co
bble
sock
eye
Kin
gsR
iver
XS2
WP1
93SC
709
-06-
2007
.22
<.03
10.3
371
9.1
6.7
6K
ings
Riv
erX
S2W
P191
SC7
09-0
6-20
07.1
2<.
038.
537
18.
46.
714
Kin
gsR
iver
XS3
WP1
94SC
709
-06-
2007
.11
3.0
.04
10.3
369
10.1
6.8
<1.0
GW
–so
ckey
eK
ings
Riv
erX
S3W
P195
SC7
09-0
6-20
07.1
2.0
910
.937
010
.96.
81
Opp
osite
YC
XS2
WP4
.4SC
809
-05-
2007
.14
14.8
.09
9.3
185
11.7
7.4
–tri
b–
sock
eye
Opp
osite
YC
XS2
WP4
.3SC
809
-05-
2007
.18
.48
8.9
176
11.7
7.3
–O
ppos
iteY
CX
S2W
P4.2
SC8
09-0
5-20
07.1
5.3
39.
117
911
.77.
4–
Eska
Cre
ekX
S2W
P206
SC9
09-1
2-20
07.1
13.
5.2
67.
728
510
.08.
2<1
.0G
Wsa
nd, g
rave
lch
umEs
kaC
reek
XS2
WP2
05SC
909
-12-
2007
.09
.25
7.8
285
8.6
8.2
<1.0
Eska
Cre
ekX
S2W
P207
SC9
09-1
2-20
07.1
4.1
27.
728
59.
78.
2<1
.0Es
kaC
reek
XS3
WP1
7SC
909
-11-
2008
.15
3.0
–8.
328
010
.59.
3<1
.0G
Wsa
nd, g
rave
l, co
bble
chum
Eska
Cre
ekX
S3W
P18
SC9
09-1
1-20
08.0
9–
8.3
287
10.5
9.1
<1.0
Eska
Cre
ekX
S3W
P19
SC9
09-1
1-20
08.1
1–
8.2
286
10.3
9.0
<1.0
Eska
Cre
ekX
S4W
P22
SC9
09-1
1-20
08.2
110
.4–
8.2
286
10.3
8.7
<1.0
GW
sand
, gra
vel
chum
, soc
keye
Eska
Cre
ekX
S4W
P20
SC9
09-1
1-20
08.1
8–
8.2
288
10.4
8.9
<1.0
Eska
Cre
ekX
S4W
P21
SC9
09-1
1-20
08.1
8–
8.1
286
10.4
8.8
<1.0
Eska
Cre
ekX
S3W
P209
SC10
09-1
2-20
07.1
27.
0.3
87.
496
12.8
7.9
8tri
bgr
avel
so
ckey
eEs
kaC
reek
XS3
WP2
10SC
1009
-12-
2007
.37
.48
7.4
9612
.57.
88
Eska
Cre
ekX
S3W
P211
SC10
09-1
2-20
07.4
6.2
67.
496
12.8
7.8
8Es
kaC
reek
XS1
WP1
3SC
1009
-11-
2008
.11
4.0
–7.
211
510
.57.
6<1
.0tri
bgr
avel
, cob
ble
chum
, coh
o, so
ckey
eEs
kaC
reek
XS1
WP1
1SC
1009
-11-
2008
.12
–7.
311
510
.67.
6<1
.0Es
kaC
reek
XS1
WP1
2SC
1009
-11-
2008
.15
–7.
211
510
.87.
6<1
.0Es
kaC
reek
XS2
WP1
6SC
1109
-11-
2008
.18
6.6
–7.
112
511
.37.
75
mai
n, tr
ibgr
avel
, cob
ble
coho
, soc
keye
Eska
Cre
ekX
S2W
P14
SC11
09-1
1-20
08.1
5–
7.1
127
11.4
7.7
5Es
kaC
reek
XS2
WP1
5SC
1109
-11-
2008
.11
–7.
112
511
.37.
65
Tabl
e 5.
Su
rface
wat
er a
nd c
hann
el c
hara
cter
istic
reco
nnai
ssan
ce d
ata
for c
lear
wat
er s
ide
chan
nels
, spr
ings
, trib
utar
ies,
and
mai
nste
m s
tream
s, M
atan
uska
Riv
er, A
lask
a,
2007
–08.
—Co
ntin
ued
[Sha
ding
indi
cate
s tra
nsec
t gro
upin
g. A
bbre
viat
ions
: m, m
eter
; m/s
, met
er p
er se
cond
; °C
, deg
rees
Cel
sius
; µS/
cm, m
icro
siem
ens p
er c
entim
eter
; mg/
L, m
illig
ram
per
lite
r; N
TU, n
ephe
lom
etric
turb
idity
uni
ts;
GW
, gro
undw
ater
; mai
n, m
ains
tem
; trib
, trib
utar
y; o
rg. m
at.,
orga
nic
mat
eria
l; co
ho, c
oho
salm
on; c
hum
, chu
m sa
lmon
; soc
keye
, soc
keye
salm
on; <
, les
s tha
n; –
not
ava
ilabl
e; N
/A, n
ot a
pplic
able
]

Hydrologic, Physical, and Water-Quality Characteristics of Side Channels 21
Poin
t ide
ntifi
erM
ap
No.
Dat
eD
epth
(m
)
Wet
ted
w
idth
(m
)
Velo
city
(m
/s)
Tem
pera
ture
(°
C)
Spec
ific
cond
ucta
nce
(µS/
cm)
Dis
solv
ed
oxyg
en
(mg/
L)pH
Turb
idity
(N
TU)
Wat
er
sour
cePa
rtic
le s
ize
Fish
spe
cies
ob
serv
ed
Side
Cha
nnel
s—Co
ntin
ued
Eska
Cre
ekX
S4W
P212
SC12
09-1
2-20
070.
249.
10.
686.
916
511
.57.
913
1m
ain,
trib
–so
ckey
eEs
kaC
reek
XS4
WP2
14SC
1209
-12-
2007
.27
.59
6.9
164
11.9
7.9
135
Eska
Cre
ekX
S4W
P213
SC12
09-1
2-20
07.3
7.6
06.
916
311
.67.
913
6M
oose
Cre
ekX
S2W
P5.1
SC13
08-2
9-20
07.1
7–
.13
6.0
157
8.7
7.8
34G
W, m
ain
––
Moo
seC
reek
XS2
WP5
.2SC
1308
-29-
2007
.09
.14
7.6
238
9.6
7.7
55M
oose
Cre
ekX
S2W
P5.3
SC13
08-2
9-20
07.1
1.3
37.
724
29.
97.
855
Moo
seC
reek
XS3
WP5
.4SC
1408
-29-
2007
.08
–.0
97.
325
08.
27.
7<1
.0G
W–
–M
oose
Cre
ekX
S3W
P5.5
SC14
08-2
9-20
07.0
9.0
96.
229
88.
57.
7<1
.0W
olC
reek
USX
S5W
P215
SC15
09-2
4-20
08.1
25.
6.0
65.
231
810
.78.
2<1
.0G
Wsa
nd, g
rave
lch
um, s
ocke
yeW
olC
reek
USX
S5W
P216
SC15
09-2
4-20
08.1
8.2
65.
131
810
.68.
1<1
.0W
olC
reek
USX
S5W
P217
SC15
09-2
4-20
08.1
8.1
75.
131
910
.58.
1<1
.0W
olC
reek
DSX
S1W
P206
SC16
09-2
4-20
08.1
210
.2<.
039.
430
110
.58.
1<1
.0G
Wsa
nd, g
rave
l, co
bble
sock
eye
Wol
Cre
ekD
SXS1
WP2
04SC
1609
-24-
2008
.15
<.03
8.1
318
9.5
8.1
<1.0
Wol
Cre
ekD
SXS1
WP2
05SC
1609
-24-
2008
.18
<.03
9.5
308
10.5
8.1
<1.0
Wol
Cre
ekD
SXS2
WP2
07SC
1709
-24-
2008
.09
2.3
–6.
834
68.
18.
3<1
.0G
Wsa
nd, g
rave
lso
ckey
eW
olC
reek
DSX
S2W
P208
SC17
09-2
4-20
08.0
9–
6.7
347
7.8
8.2
<1.0
Wol
Cre
ekD
SXS3
WP2
09SC
1709
-24-
2008
.24
3.7
.05
6.8
347
8.6
8.6
<1.0
GW
sand
sock
eye
Wol
Cre
ekD
SXS3
WP2
11SC
1709
-24-
2008
.15
.15
6.8
347
8.3
8.3
<1.0
Wol
Cre
ekD
SXS3
WP2
10SC
1709
-24-
2008
.21
.17
6.8
347
8.3
8.4
<1.0
Wol
Cre
ekD
SXS4
WP2
12SC
1709
-24-
2008
.09
3.4
–6.
834
78.
58.
61
GW
sand
, gra
vel
sock
eye
Wol
Cre
ekD
SXS4
WP2
13SC
1709
-24-
2008
.09
–6.
834
88.
58.
51
Wol
Cre
ekD
SXS4
WP2
14SC
1709
-24-
2008
.06
–6.
834
78.
68.
42
Lazy
Mou
ntai
nXS1
WP2
SC18
09-0
3-20
08.3
08.
3–
5.8
326
9.5
7.9
5G
Wgr
avel
, cob
ble
chum
, soc
keye
Lazy
Mou
ntai
nXS1
WP3
SC18
09-0
3-20
08.4
7–
5.7
321
10.0
8.0
5La
zyM
ount
ainX
S1W
P4SC
1809
-03-
2008
.38
–6.
031
510
.28.
05
Lazy
Mou
ntai
nXS2
WP7
SC18
09-0
3-20
08.2
916
.6–
5.9
314
10.6
8.1
5G
Wsi
lt, g
rave
l, co
bble
chum
, soc
keye
Lazy
Mou
ntai
nXS2
WP6
SC18
09-0
3-20
08.4
7–
5.9
319
9.9
8.0
6La
zyM
ount
ainX
S2W
P5SC
1809
-03-
2008
.36
–6.
032
99.
07.
97
Riv
erB
endX
S1W
P240
SC19
09-2
5-20
08.2
610
.1.2
35.
433
712
.88.
0<1
.0G
Wsa
nd, g
rave
l, co
bble
sock
eye
Riv
erB
endX
S1W
P238
SC19
09-2
5-20
08.2
4.2
35.
433
812
.48.
0<1
.0R
iver
Ben
dXS1
WP2
41SC
1909
-25-
2008
.21
<.03
5.3
338
12.8
8.0
<1.0
Riv
erB
endX
S1W
P242
SC19
09-2
5-20
08.1
5.2
35.
333
812
.88.
0<1
.0R
iver
Ben
dXS1
WP2
43SC
1909
-25-
2008
.09
.35
5.3
337
13.2
8.0
<1.0
Riv
erB
endX
S2W
P246
SC19
09-2
5-20
08.1
813
.4.3
45.
533
713
.48.
0<1
.0G
Wsa
nd, g
rave
l, co
bble
sock
eye
Riv
erB
endX
S2W
P248
SC19
09-2
5-20
08.1
8.2
25.
433
713
.38.
0<1
.0R
iver
Ben
dXS2
WP2
44SC
1909
-25-
2008
.15
.09
5.7
337
13.7
8.0
<1.0
Riv
erB
endX
S2W
P245
SC19
09-2
5-20
08.2
0.2
55.
633
613
.38.
0<1
.0R
iver
Ben
dXS2
WP2
47SC
1909
-25-
2008
.15
.32
5.5
337
13.3
8.0
<1.0
Tabl
e 5.
Su
rface
wat
er a
nd c
hann
el c
hara
cter
istic
reco
nnai
ssan
ce d
ata
for c
lear
wat
er s
ide
chan
nels
, spr
ings
, trib
utar
ies,
and
mai
nste
m s
tream
s, M
atan
uska
Riv
er, A
lask
a,
2007
–08.
—Co
ntin
ued
[Sha
ding
indi
cate
s tra
nsec
t gro
upin
g. A
bbre
viat
ions
: m, m
eter
; m/s
, met
er p
er se
cond
; °C
, deg
rees
Cel
sius
; µS/
cm, m
icro
siem
ens p
er c
entim
eter
; mg/
L, m
illig
ram
per
lite
r; N
TU, n
ephe
lom
etric
turb
idity
uni
ts;
GW
, gro
undw
ater
; mai
n, m
ains
tem
; trib
, trib
utar
y; o
rg. m
at.,
orga
nic
mat
eria
l; co
ho, c
oho
salm
on; c
hum
, chu
m sa
lmon
; soc
keye
, soc
keye
salm
on; <
, les
s tha
n; –
not
ava
ilabl
e; N
/A, n
ot a
pplic
able
]

22 Salmon Spawning Habitats in Clearwater Side Channels, Matanuska River, Southcentral Alaska
Poin
t ide
ntifi
erM
ap
No.
Dat
eD
epth
(m
)
Wet
ted
w
idth
(m
)
Velo
city
(m
/s)
Tem
pera
ture
(°
C)
Spec
ific
cond
ucta
nce
(µS/
cm)
Dis
solv
ed
oxyg
en
(mg/
L)pH
Turb
idity
(N
TU)
Wat
er
sour
cePa
rtic
le s
ize
Fish
spe
cies
ob
serv
ed
Side
Cha
nnel
s—Co
ntin
ued
Riv
erB
endX
S3W
P249
SC19
09-2
5-20
080.
0917
.00.
075.
833
613
.98.
0<1
.0G
Wsa
nd, g
rave
l, co
bble
sock
eye
Riv
erB
endX
S3W
P250
SC19
09-2
5-20
08.1
8.1
15.
833
613
.88.
0<1
.0R
iver
Ben
dXS3
WP2
52SC
1909
-25-
2008
.21
.14
5.7
338
13.7
8.0
<1.0
Riv
erB
endX
S3W
P251
SC19
09-2
5-20
08.1
8.1
35.
733
713
.88.
0<1
.0R
iver
Ben
dXS3
WP2
53SC
1909
-25-
2008
.24
.09
5.6
338
13.6
8.0
<1.0
Sprin
gs
Pinn
acle
WP0
15SP
R1
05-0
3-20
07–
––
2.1
415
9.9
7.4
<1.0
N/A
N/A
N/A
Pinn
acle
WP2
.1_1
SPR
109
-06-
2007
––
–7.
238
47.
36.
31
N/A
N/A
N/A
Pinn
acle
WP2
.1_2
SPR
109
-06-
2007
––
–7.
338
37.
56.
42
N/A
N/A
N/A
Pinn
acle
DSW
P035
SPR
205
-03-
2007
––
–3.
142
69.
97.
5<1
.0N
/AN
/AN
/ALa
zyM
ount
ainW
P8_1
SPR
309
-03-
2008
––
–5.
535
55.
97.
8–
N/A
N/A
N/A
Lazy
Mou
ntai
nWP8
_2SP
R3
09-0
3-20
08–
––
5.8
355
6.2
7.7
–N
/AN
/AN
/AR
iver
Ben
dWP0
02SP
R4
04-2
3-20
07–
––
3.0
312
9.5
7.8
<1.0
N/A
N/A
N/A
Trib
utar
ies
Yello
wC
reek
XS1
WP1
97T1
09-0
6-20
070.
274.
30.
0410
.834
710
.36.
72
N/A
org.
mat
., gr
avel
, cob
ble
sock
eye
Yello
wC
reek
XS1
WP1
98T1
09-0
6-20
07.2
1<.
0310
.934
710
.26.
73
Yello
wC
reek
XS1
WP1
96T1
09-0
6-20
07.2
4<.
0310
.934
910
.66.
83
Yello
wC
reek
XS2
WP1
99T1
09-0
6-20
07.1
52.
1.1
310
.934
711
.16.
82
N/A
grav
elso
ckey
eYe
llow
Cre
ekX
S2W
P201
T109
-06-
2007
.15
.16
10.9
346
10.6
6.7
3Ye
llow
Cre
ekX
S2W
P200
T109
-06-
2007
.15
.15
10.9
347
10.7
6.8
5Es
kaC
reek
XS1
WP2
04T2
09-1
2-20
07.3
76.
2.9
87.
194
12.1
7.9
8N
/Agr
avel
sock
eye
Eska
Cre
ekX
S1W
P202
T209
-12-
2007
.15
.53
7.1
9412
.17.
98
Eska
Cre
ekX
S1W
P203
T209
-12-
2007
.35
.75
7.1
9412
.27.
99
Eska
Cre
ekX
S6W
P26
T209
-11-
2008
.15
9.1
–7.
199
13.4
8.4
1N
/Agr
avel
, cob
ble
none
Eska
Cre
ekX
S6W
P25
T209
-11-
2008
.18
–7.
199
13.4
8.4
3Es
kaC
reek
XS6
WP2
4T2
09-1
1-20
08.1
2–
7.1
9913
.48.
47
Moo
seC
reek
XS1
WP3
13T3
10-0
9-20
08.5
810
.4.4
1.8
115
14.2
7.8
<1.0
N/A
grav
el, c
obbl
eco
hoM
oose
Cre
ekX
S1W
P311
T310
-09-
2008
.40
.60
.811
514
.37.
8<1
.0M
oose
Cre
ekX
S1W
P312
T310
-09-
2008
.58
.68
.811
514
.27.
8<1
.0M
oose
Cre
ekX
S1W
P309
T310
-09-
2008
.21
.48
.711
514
.37.
8<1
.0M
oose
Cre
ekX
S1W
P310
T310
-09-
2008
.37
.43
.811
514
.37.
81
Moo
seC
reek
XS2
WP3
15T3
10-0
9-20
08.3
412
.6.6
6.8
115
14.2
7.9
<1.0
N/A
cobb
le, g
rave
lco
hoM
oose
Cre
ekX
S2W
P318
T310
-09-
2008
.15
.34
.911
514
.27.
9<1
.0M
oose
Cre
ekX
S2W
P314
T310
-09-
2008
.40
.88
.811
514
.37.
9<1
.0M
oose
Cre
ekX
S2W
P316
T310
-09-
2008
.27
.72
.811
514
.27.
9<1
.0M
oose
Cre
ekX
S2W
P317
T310
-09-
2008
.24
.66
.811
514
.27.
9<1
.0
Tabl
e 5.
Su
rface
wat
er a
nd c
hann
el c
hara
cter
istic
reco
nnai
ssan
ce d
ata
for c
lear
wat
er s
ide
chan
nels
, spr
ings
, trib
utar
ies,
and
mai
nste
m s
tream
s, M
atan
uska
Riv
er, A
lask
a,
2007
–08.
—Co
ntin
ued
[Sha
ding
indi
cate
s tra
nsec
t gro
upin
g. A
bbre
viat
ions
: m, m
eter
; m/s
, met
er p
er se
cond
; °C
, deg
rees
Cel
sius
; µS/
cm, m
icro
siem
ens p
er c
entim
eter
; mg/
L, m
illig
ram
per
lite
r; N
TU, n
ephe
lom
etric
turb
idity
uni
ts;
GW
, gro
undw
ater
; mai
n, m
ains
tem
; trib
, trib
utar
y; o
rg. m
at.,
orga
nic
mat
eria
l; co
ho, c
oho
salm
on; c
hum
, chu
m sa
lmon
; soc
keye
, soc
keye
salm
on; <
, les
s tha
n; –
not
ava
ilabl
e; N
/A, n
ot a
pplic
able
]

Hydrologic, Physical, and Water-Quality Characteristics of Side Channels 23
Poin
t ide
ntifi
erM
ap
No.
Dat
eD
epth
(m
)
Wet
ted
w
idth
(m
)
Velo
city
(m
/s)
Tem
pera
ture
(°
C)
Spec
ific
cond
ucta
nce
(µS/
cm)
Dis
solv
ed
oxyg
en
(mg/
L)pH
Turb
idity
(N
TU)
Wat
er
sour
cePa
rtic
le s
ize
Fish
spe
cies
ob
serv
ed
Trib
utar
ies —
Cont
inue
d
Moo
seC
reek
XS1
WP2
28T4
03-2
0-20
08–
5.9
–0.
115
014
.18.
7<1
.0N
/Agr
avel
, cob
ble,
bou
lder
–M
oose
Cre
ekX
S1W
P229
T403
-20-
2008
––
.115
014
.18.
4<1
.0M
oose
Cre
ekX
S1W
P230
T403
-20-
2008
––
.115
014
.18.
3<1
.0M
oose
Cre
ekX
S1W
P231
T403
-20-
2008
––
.115
014
.18.
2<1
.0M
oose
Cre
ekX
S1W
P232
T403
-20-
2008
––
.115
014
.18.
1<1
.0W
olve
rineX
S1W
P300
T510
-02-
2008
0.21
4.4
0.15
4.9
154
12.6
8.6
<1.0
N/A
sand
, gra
vel,
cobb
leco
hoW
olve
rineX
S1W
P299
T510
-02-
2008
.15
.20
4.9
154
12.6
8.6
<1.0
Wol
verin
eXS1
WP3
01T5
10-0
2-20
08.2
7.1
04.
915
412
.68.
6<1
.0W
olve
rineX
S2W
P16.
1T5
10-0
2-20
08.1
83.
4.2
34.
915
412
.78.
61
N/A
sand
, gra
vel
–W
olve
rineX
S2W
P16.
2T5
10-0
2-20
08.1
5.3
74.
915
412
.78.
61
Wol
verin
eXS2
WP1
6.3
T510
-02-
2008
.18
.09
4.9
154
12.7
8.6
2W
olve
rineX
S3W
P303
T510
-02-
2008
.12
3.3
.35
4.9
154
12.8
8.7
<1.0
N/A
grav
el, c
obbl
e–
Wol
verin
eXS3
WP3
04T5
10-0
2-20
08.2
1.1
05.
015
412
.88.
7<1
.0W
olve
rineX
S3W
P302
T510
-02-
2008
.12
.24
4.9
154
12.8
8.7
<1.0
Lazy
Mou
ntai
nWP0
46T6
05-0
4-20
07–
––
1.9
104
14.5
7.6
17N
/A–
–
Mai
nste
m
Pinn
acle
WP0
19M
C1
05-0
3-20
07–
––
1.8
377
14.8
7.8
136
N/A
––
Eska
Cre
ekM
atRW
P208
MC
209
-12-
2007
––
–5.
125
115
.68.
261
0N
/A–
–M
oose
Cre
ekM
atRW
P6.1
MC
308
-29-
2007
––
–9.
521
810
.17.
610
0N
/A–
–La
zyM
ount
ainW
P9M
C4
09-0
3-20
08–
––
7.7
298
11.7
8.2
–N
/A–
–R
iver
Ben
dMat
RWP0
13M
C5
04-2
3-20
07–
––
.930
814
.47.
916
8N
/A–
–
Tabl
e 5.
Su
rface
wat
er a
nd c
hann
el c
hara
cter
istic
reco
nnai
ssan
ce d
ata
for c
lear
wat
er s
ide
chan
nels
, spr
ings
, trib
utar
ies,
and
mai
nste
m s
tream
s, M
atan
uska
Riv
er, A
lask
a,
2007
–08.
—Co
ntin
ued
[Sha
ding
indi
cate
s tra
nsec
t gro
upin
g. A
bbre
viat
ions
: m, m
eter
; m/s
, met
er p
er se
cond
; °C
, deg
rees
Cel
sius
; µS/
cm, m
icro
siem
ens p
er c
entim
eter
; mg/
L, m
illig
ram
per
lite
r; N
TU, n
ephe
lom
etric
turb
idity
uni
ts;
GW
, gro
undw
ater
; mai
n, m
ains
tem
; trib
, trib
utar
y; o
rg. m
at.,
orga
nic
mat
eria
l; co
ho, c
oho
salm
on; c
hum
, chu
m sa
lmon
; soc
keye
, soc
keye
salm
on; <
, les
s tha
n; –
not
ava
ilabl
e; N
/A, n
ot a
pplic
able
]

24 Salmon Spawning Habitats in Clearwater Side Channels, Matanuska River, Southcentral Alaska
Physical Characteristics and Riparian Vegetation
The physical characteristics of clearwater side channels were similar over the length of the study area. Most were wide and shallow (averaging 7.6 m wide and 0.18 m deep and a width/depth ratio of 40), with few bedforms such as pools or bars. Tributary-fed side channels averaged more than a meter wider than the groundwater-fed side channels (table 6). Substrates consisted of gravel with differing amounts of cobbles, sand, or silt. Sand and silt were commonly present as a drape over the gravelly bed, which observations suggest is likely the result of bioturbation during construction of redds. Short riffles interrupted long runs in many of the channels. Large woody debris, such as logs or trees with root wads, was scarce. Surveyed water-surface gradients of 0.0013 and 0.00018 at intensive survey sites SC19 (a) and SC19 (b), respectively, confirmed observations that side channel gradients were typically relatively gentle. Flow velocities in the side channels were low, regardless of whether fed by a tributary or a spring, with only one measurement exceeding 0.6 m/s. For comparison, similarly-sized tributaries with spawning sites had, on average, a width/depth ratio of 27, more and deeper pools, and steeper slopes (for example, the surveyed water surface gradient at T4 was 0.0058) than did the side channels, and tributaries, on average, had higher velocities than groundwater-fed side channels (table 6).
Riparian vegetation in the braid plain ranged from a sparse cover of small low-lying shrubs on young gravel bars to small shrubs and patches of taller shrubs including alders, willow, and cottonwoods on older bars. On the oldest vegetated surfaces in the braid plain, the vegetation consisted of mature stands of cottonwood and spruce trees. The side channel margins commonly supported a narrow vegetated corridor in which plants were denser than on the surrounding vegetated surface and included cottonwood, alder, and willow saplings, as well as horsetails, sedges, and moss. By contrast,
the vegetation bordering Matanuska River tributary streams commonly consisted of a stable mature forest with large cottonwoods and willows lining the banks. A subcanopy of tall alder shrubs densely covered the tributary banks, with fewer low sedges and mosses lining the banks than on the braid plain surfaces.
Surface Water Characterization and Comparison to Source Waters
Water temperatures during the August and September reconnaissance visits to the side channels averaged 7.5 °C. Despite the lack of vegetative cover and shallow depths, recorded water temperatures at reconnaissance sites never exceeded 11 °C. Data from the continuously logging thermistor at site SC19, a side channel near Palmer, show the maximum temperature over the summers of 2007 and 2008 was 12.1 °C (fig. 11). Relatively warm winter water temperatures noticeably distinguished the side channels from most mainstem channels and from tributaries. Unlike the mainstem and tributaries, side channels rarely froze over completely (fig. 12); site SC19 was observed to be ice-free even after several weeks of air temperatures below -18 °C. Temperature loggers recorded the coldest surface-water temperatures in December through February, with an average over that period ranging from 0.5 to 2.4 °C for the three side channel monitoring sites.
The specific conductance of water can be used to indicate its ionic content, or the concentration of dissolved solids. In the clearwater channels of the Matanuska River, specific conductance varied consistently with the source of the water. Specific conductance of the water averaged 352 µS/cm in groundwater-fed side channels, but was much less, an average of 136 µS/cm, in tributary-fed side channels (table 6). For comparison, specific conductance of water near the margins of mainstem Matanuska River channels averaged 290 µS/cm.
Table 6. Summary statistics for spring-autumn surface water and channel characteristic reconnaissance data for side channels and source waters, Matanuska River, Alaska.
[Abbreviations: m, meter; m/s, meter per second; ºC, degrees Celsius; µS/cm, microsiemens per centimeter; mg/L, milligram per liter; NTU, nephelometric turbidity unit; – not available; <, less than]
Stream type
Number of
measurements
Mean wetted width
(m)
Mean depth
(m)
Mean velocity
(m/s)
Mean spring-autumn
temperature (ºC)
Mean specific
conductance (µS/cm)
Mean dissolved
oxygen (mg/L)
Median pH
Median turbidity
(NTU)
Side channels
Groundwater-fed 103 7.0 0.17 0.13 7.4 352 10.0 7.7 <1Tributary-fed 15 8.3 .21 .43 7.6 136 11.6 7.7 7.5
Source waters
Springs 7 – – – 4.9 376 8.0 7.5 <1Tributaries 37 6.8 0.25 0.37 4.4 164 13.0 7.9 <1
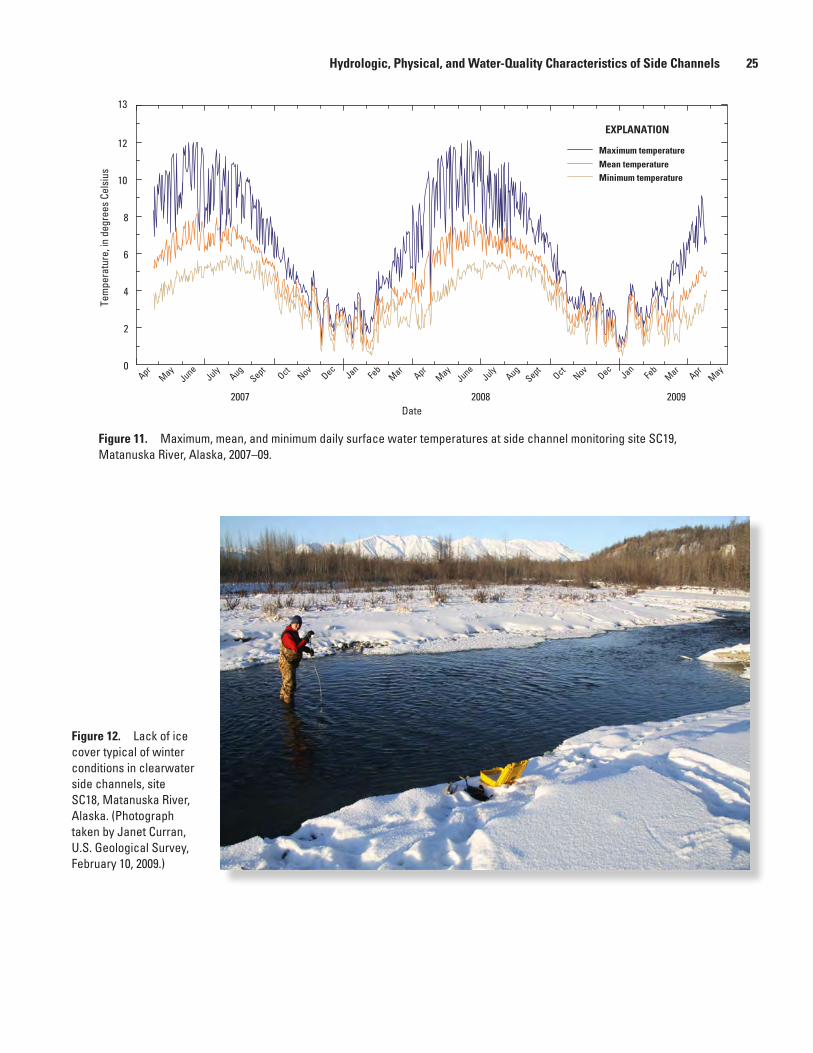
Hydrologic, Physical, and Water-Quality Characteristics of Side Channels 25
Figure 12. Lack of ice cover typical of winter conditions in clearwater side channels, site SC18, Matanuska River, Alaska. (Photograph taken by Janet Curran, U.S. Geological Survey, February 10, 2009.)
Date
AprMay
JuneJuly
AugSept
OctNov
DecApr
JanFe
bMar
MayApr
JanFe
bMar
MayJune
JulyAug
SeptOct
NovDec
Tem
pera
ture
, in
degr
ees
Cels
ius
0
2
4
6
8
10
12
13
Maximum temperature
Minimum temperature Mean temperature
2007 2008 2009
EXPLANATION
Figure 11. Maximum, mean, and minimum daily surface water temperatures at side channel monitoring site SC19, Matanuska River, Alaska, 2007–09.
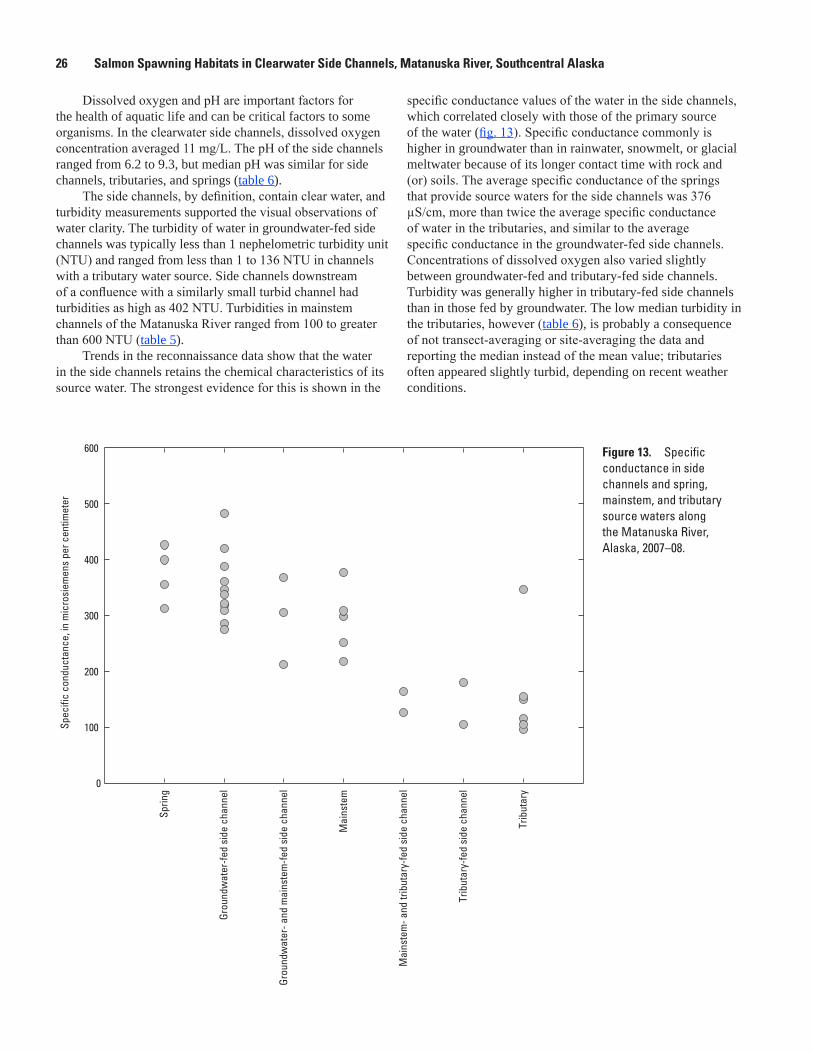
26 Salmon Spawning Habitats in Clearwater Side Channels, Matanuska River, Southcentral Alaska
Dissolved oxygen and pH are important factors for the health of aquatic life and can be critical factors to some organisms. In the clearwater side channels, dissolved oxygen concentration averaged 11 mg/L. The pH of the side channels ranged from 6.2 to 9.3, but median pH was similar for side channels, tributaries, and springs (table 6).
The side channels, by definition, contain clear water, and turbidity measurements supported the visual observations of water clarity. The turbidity of water in groundwater-fed side channels was typically less than 1 nephelometric turbidity unit (NTU) and ranged from less than 1 to 136 NTU in channels with a tributary water source. Side channels downstream of a confluence with a similarly small turbid channel had turbidities as high as 402 NTU. Turbidities in mainstem channels of the Matanuska River ranged from 100 to greater than 600 NTU (table 5).
Trends in the reconnaissance data show that the water in the side channels retains the chemical characteristics of its source water. The strongest evidence for this is shown in the
specific conductance values of the water in the side channels, which correlated closely with those of the primary source of the water (fig. 13). Specific conductance commonly is higher in groundwater than in rainwater, snowmelt, or glacial meltwater because of its longer contact time with rock and (or) soils. The average specific conductance of the springs that provide source waters for the side channels was 376 µS/cm, more than twice the average specific conductance of water in the tributaries, and similar to the average specific conductance in the groundwater-fed side channels. Concentrations of dissolved oxygen also varied slightly between groundwater-fed and tributary-fed side channels. Turbidity was generally higher in tributary-fed side channels than in those fed by groundwater. The low median turbidity in the tributaries, however (table 6), is probably a consequence of not transect-averaging or site-averaging the data and reporting the median instead of the mean value; tributaries often appeared slightly turbid, depending on recent weather conditions.
Sprin
g
Grou
ndw
ater
-fed
side
cha
nnel
Grou
ndw
ater
- and
mai
nste
m-fe
d si
de c
hann
el
Mai
nste
m
Mai
nste
m- a
nd tr
ibut
ary-
fed
side
cha
nnel
Trib
utar
y-fe
d si
de c
hann
el
Trib
utar
y
Spec
ific
cond
ucta
nce,
in m
icro
siem
ens
per c
entim
eter
0
100
200
300
400
500
600 Figure 13. Specific conductance in side channels and spring, mainstem, and tributary source waters along the Matanuska River, Alaska, 2007–08.

Hydrologic, Physical, and Water-Quality Characteristics of Side Channels 27
Side-channel discharge appears to be relatively constant throughout the year, particularly in groundwater-fed systems. Visual observations of mossy channel margins, which generally would be eroded away by high flows, and lack of fine-grained or debris overbank deposits suggests that the channels do not receive enough snowmelt or rainfall runoff to generate the large spring and summer flows typical in a similarly sized tributary channel. Measured discharge at side channel site SC19 and tributary site T4 near the mouth of Moose Creek on the same day or consecutive days in different seasons (table 7) illustrate this difference. The 35 percent decrease in discharge from August 28, 2007, to March 20, 2008, in the side channel contrasts sharply with the near order-of-magnitude decrease in Moose Creek discharge from August 29, 2007, to March 20, 2008.
Reach-Scale Spawning Site Selection
Intensive surveys provided a reach-scale assessment of variability and an opportunity to examine the relation of surface water characteristics to spawning site locations. Point measurements from intensive surveys at two locations along side channel site SC19 near Palmer and at one location at tributary site T4 on Moose Creek are presented in table 8. These surveys consisted of measurement points on a regular grid as well as measurements at all redds observed. Table 9 summarizes surface water and channel characteristics for measurements at grid points and at chum and sockeye salmon redds.
Reconnaissance and intensive survey data showed that variability of individual surface water-quality parameters was generally minor within reaches on the order of 100 m long. Distribution of water-quality parameters at the 100-m-long intensively surveyed reaches showed no distinct patterns and no correlation to position within the channel. However, at confluences of clearwater side channels with tributaries or another branch of a side channel, lateral variability of water-quality field parameters persisted for at least 100 m downstream, suggesting that mixing lengths are greater than this distance.
Table 7. Discharge measurements in side channel sites for the Matanuska River (sites SC18 and SC19) and the Moose Creek tributary (site T4), Matanuska River, Alaska, 2007–08.
[Locations of discharge measurements are shown in figure 4. Abbreviations: m3/s, cubic meter per second; USGS, U.S. Geological Survey]
USGS site No. Map No. DateDischarge, in
(m3/s)
613653149045600 SC18 05-04-2007 0.309613339149062400 SC19 04-23-2007 .329613339149062400 SC19 08-23-2007 .402613339149062400 SC19 08-28-2007 .402613339149062400 SC19 03-20-2008 .261614024149021600 T4 08-29-2007 2.46614024149021600 T4 03-20-2008 .348
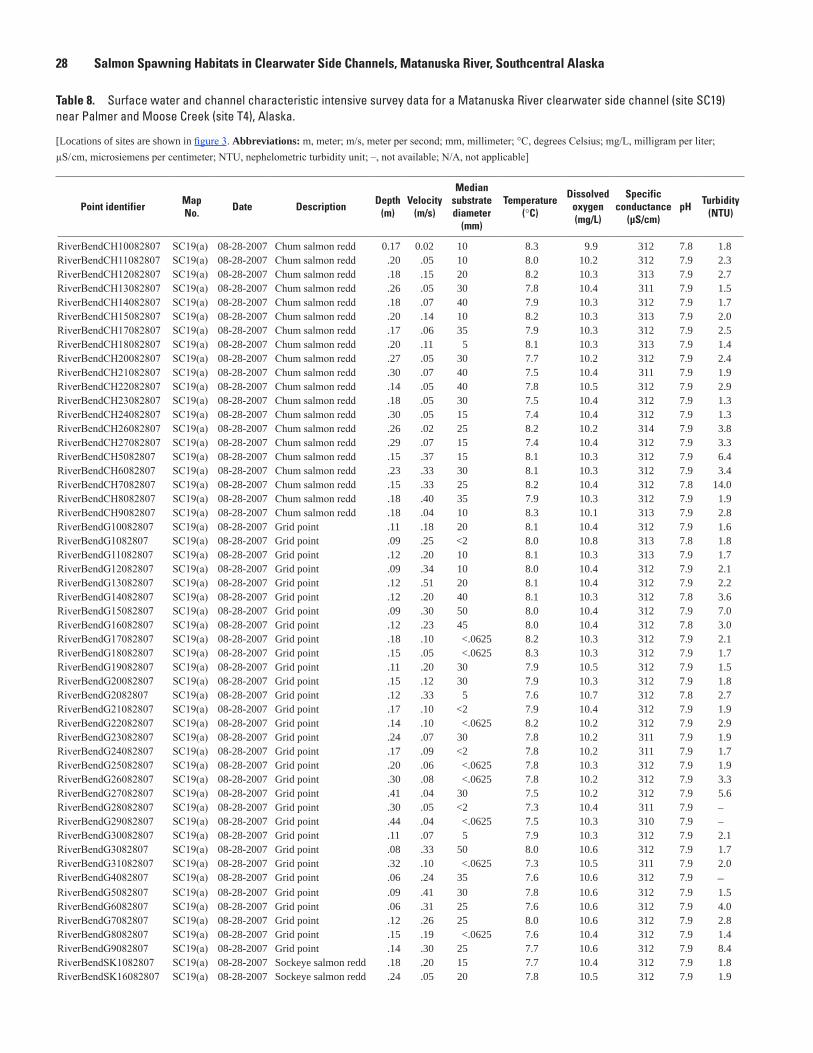
28 Salmon Spawning Habitats in Clearwater Side Channels, Matanuska River, Southcentral Alaska
Point identifier Map No. Date Description Depth
(m)Velocity
(m/s)
Median substrate diameter
(mm)
Temperature (°C)
Dissolved oxygen (mg/L)
Specific conductance
(µS/cm)pH Turbidity
(NTU)
RiverBendCH10082807 SC19(a) 08-28-2007 Chum salmon redd 0.17 0.02 10 8.3 9.9 312 7.8 1.8RiverBendCH11082807 SC19(a) 08-28-2007 Chum salmon redd .20 .05 10 8.0 10.2 312 7.9 2.3RiverBendCH12082807 SC19(a) 08-28-2007 Chum salmon redd .18 .15 20 8.2 10.3 313 7.9 2.7RiverBendCH13082807 SC19(a) 08-28-2007 Chum salmon redd .26 .05 30 7.8 10.4 311 7.9 1.5RiverBendCH14082807 SC19(a) 08-28-2007 Chum salmon redd .18 .07 40 7.9 10.3 312 7.9 1.7RiverBendCH15082807 SC19(a) 08-28-2007 Chum salmon redd .20 .14 10 8.2 10.3 313 7.9 2.0RiverBendCH17082807 SC19(a) 08-28-2007 Chum salmon redd .17 .06 35 7.9 10.3 312 7.9 2.5RiverBendCH18082807 SC19(a) 08-28-2007 Chum salmon redd .20 .11 5 8.1 10.3 313 7.9 1.4RiverBendCH20082807 SC19(a) 08-28-2007 Chum salmon redd .27 .05 30 7.7 10.2 312 7.9 2.4RiverBendCH21082807 SC19(a) 08-28-2007 Chum salmon redd .30 .07 40 7.5 10.4 311 7.9 1.9RiverBendCH22082807 SC19(a) 08-28-2007 Chum salmon redd .14 .05 40 7.8 10.5 312 7.9 2.9RiverBendCH23082807 SC19(a) 08-28-2007 Chum salmon redd .18 .05 30 7.5 10.4 312 7.9 1.3RiverBendCH24082807 SC19(a) 08-28-2007 Chum salmon redd .30 .05 15 7.4 10.4 312 7.9 1.3RiverBendCH26082807 SC19(a) 08-28-2007 Chum salmon redd .26 .02 25 8.2 10.2 314 7.9 3.8RiverBendCH27082807 SC19(a) 08-28-2007 Chum salmon redd .29 .07 15 7.4 10.4 312 7.9 3.3RiverBendCH5082807 SC19(a) 08-28-2007 Chum salmon redd .15 .37 15 8.1 10.3 312 7.9 6.4RiverBendCH6082807 SC19(a) 08-28-2007 Chum salmon redd .23 .33 30 8.1 10.3 312 7.9 3.4RiverBendCH7082807 SC19(a) 08-28-2007 Chum salmon redd .15 .33 25 8.2 10.4 312 7.8 14.0RiverBendCH8082807 SC19(a) 08-28-2007 Chum salmon redd .18 .40 35 7.9 10.3 312 7.9 1.9RiverBendCH9082807 SC19(a) 08-28-2007 Chum salmon redd .18 .04 10 8.3 10.1 313 7.9 2.8RiverBendG10082807 SC19(a) 08-28-2007 Grid point .11 .18 20 8.1 10.4 312 7.9 1.6RiverBendG1082807 SC19(a) 08-28-2007 Grid point .09 .25 <2 8.0 10.8 313 7.8 1.8RiverBendG11082807 SC19(a) 08-28-2007 Grid point .12 .20 10 8.1 10.3 313 7.9 1.7RiverBendG12082807 SC19(a) 08-28-2007 Grid point .09 .34 10 8.0 10.4 312 7.9 2.1RiverBendG13082807 SC19(a) 08-28-2007 Grid point .12 .51 20 8.1 10.4 312 7.9 2.2RiverBendG14082807 SC19(a) 08-28-2007 Grid point .12 .20 40 8.1 10.3 312 7.8 3.6RiverBendG15082807 SC19(a) 08-28-2007 Grid point .09 .30 50 8.0 10.4 312 7.9 7.0RiverBendG16082807 SC19(a) 08-28-2007 Grid point .12 .23 45 8.0 10.4 312 7.8 3.0RiverBendG17082807 SC19(a) 08-28-2007 Grid point .18 .10 <.0625 8.2 10.3 312 7.9 2.1RiverBendG18082807 SC19(a) 08-28-2007 Grid point .15 .05 <.0625 8.3 10.3 312 7.9 1.7RiverBendG19082807 SC19(a) 08-28-2007 Grid point .11 .20 30 7.9 10.5 312 7.9 1.5RiverBendG20082807 SC19(a) 08-28-2007 Grid point .15 .12 30 7.9 10.3 312 7.9 1.8RiverBendG2082807 SC19(a) 08-28-2007 Grid point .12 .33 5 7.6 10.7 312 7.8 2.7RiverBendG21082807 SC19(a) 08-28-2007 Grid point .17 .10 <2 7.9 10.4 312 7.9 1.9RiverBendG22082807 SC19(a) 08-28-2007 Grid point .14 .10 <.0625 8.2 10.2 312 7.9 2.9RiverBendG23082807 SC19(a) 08-28-2007 Grid point .24 .07 30 7.8 10.2 311 7.9 1.9RiverBendG24082807 SC19(a) 08-28-2007 Grid point .17 .09 <2 7.8 10.2 311 7.9 1.7RiverBendG25082807 SC19(a) 08-28-2007 Grid point .20 .06 <.0625 7.8 10.3 312 7.9 1.9RiverBendG26082807 SC19(a) 08-28-2007 Grid point .30 .08 <.0625 7.8 10.2 312 7.9 3.3RiverBendG27082807 SC19(a) 08-28-2007 Grid point .41 .04 30 7.5 10.2 312 7.9 5.6RiverBendG28082807 SC19(a) 08-28-2007 Grid point .30 .05 <2 7.3 10.4 311 7.9 –RiverBendG29082807 SC19(a) 08-28-2007 Grid point .44 .04 <.0625 7.5 10.3 310 7.9 –RiverBendG30082807 SC19(a) 08-28-2007 Grid point .11 .07 5 7.9 10.3 312 7.9 2.1RiverBendG3082807 SC19(a) 08-28-2007 Grid point .08 .33 50 8.0 10.6 312 7.9 1.7RiverBendG31082807 SC19(a) 08-28-2007 Grid point .32 .10 <.0625 7.3 10.5 311 7.9 2.0RiverBendG4082807 SC19(a) 08-28-2007 Grid point .06 .24 35 7.6 10.6 312 7.9 –RiverBendG5082807 SC19(a) 08-28-2007 Grid point .09 .41 30 7.8 10.6 312 7.9 1.5RiverBendG6082807 SC19(a) 08-28-2007 Grid point .06 .31 25 7.6 10.6 312 7.9 4.0RiverBendG7082807 SC19(a) 08-28-2007 Grid point .12 .26 25 8.0 10.6 312 7.9 2.8RiverBendG8082807 SC19(a) 08-28-2007 Grid point .15 .19 <.0625 7.6 10.4 312 7.9 1.4RiverBendG9082807 SC19(a) 08-28-2007 Grid point .14 .30 25 7.7 10.6 312 7.9 8.4RiverBendSK1082807 SC19(a) 08-28-2007 Sockeye salmon redd .18 .20 15 7.7 10.4 312 7.9 1.8RiverBendSK16082807 SC19(a) 08-28-2007 Sockeye salmon redd .24 .05 20 7.8 10.5 312 7.9 1.9
Table 8. Surface water and channel characteristic intensive survey data for a Matanuska River clearwater side channel (site SC19) near Palmer and Moose Creek (site T4), Alaska.
[Locations of sites are shown in figure 3. Abbreviations: m, meter; m/s, meter per second; mm, millimeter; °C, degrees Celsius; mg/L, milligram per liter; µS/ cm, microsiemens per centimeter; NTU, nephelometric turbidity unit; –, not available; N/A, not applicable]

Hydrologic, Physical, and Water-Quality Characteristics of Side Channels 29
Point identifier Map No. Date Description Depth
(m)Velocity
(m/s)
Median substrate diameter
(mm)
Temperature (°C)
Dissolved oxygen (mg/L)
Specific conductance
(µS/cm)pH Turbidity
(NTU)
RiverBendSK19082807 SC19(a) 08-28-2007 Sockeye salmon redd 0.27 0.08 25 7.9 10.2 312 7.9 2.3RiverBendSK2082807 SC19(a) 08-28-2007 Sockeye salmon redd .17 .26 25 7.6 10.4 311 7.9 1.5RiverBendSK25082807 SC19(a) 08-28-2007 Sockeye salmon redd .26 .05 25 7.9 10.3 311 7.9 –RiverBendSK3082807 SC19(a) 08-28-2007 Sockeye salmon redd .18 .41 20 7.2 10.4 310 7.9 2.0RiverBendSK4082807 SC19(a) 08-28-2007 Sockeye salmon redd .20 .16 20 8.0 10.2 287 7.9 2.1RiverBendCH10082307 SC19(b) 08-23-2007 Chum salmon redd .12 .22 30 6.8 12.8 334 8.0 <1.0RiverBendCH11082307 SC19(b) 08-23-2007 Chum salmon redd .27 .10 10 6.5 12.5 333 7.9 <1.0RiverBendCH12082307 SC19(b) 08-23-2007 Chum salmon redd .27 .07 10 6.7 12.6 334 7.9 <1.0RiverBendCH14082307 SC19(b) 08-23-2007 Chum salmon redd .15 <.015 25 5.8 12.2 329 7.9 <1.0RiverBendCH2082307 SC19(b) 08-23-2007 Chum salmon redd .21 <.015 35 6.2 12.1 328 7.9 <1.0RiverBendCH3082307 SC19(b) 08-23-2007 Chum salmon redd .32 <.015 50 6.5 12.4 332 7.9 <1.0RiverBendCH4082307 SC19(b) 08-23-2007 Chum salmon redd .34 <.015 50 6.6 12.6 332 7.9 <1.0RiverBendCH5082307 SC19(b) 08-23-2007 Chum salmon redd .38 <.015 60 6.3 12.4 332 7.9 <1.0RiverBendCH6082307 SC19(b) 08-23-2007 Chum salmon redd .30 <.015 35 7.5 12.3 329 8.0 <1.0RiverBendCH7082307 SC19(b) 08-23-2007 Chum salmon redd .24 .17 25 7.7 12.7 331 8.1 <1.0RiverBendCH8082307 SC19(b) 08-23-2007 Chum salmon redd .17 .11 25 6.6 12.5 334 7.9 <1.0RiverBendCH9082307 SC19(b) 08-23-2007 Chum salmon redd .23 .12 10 6.8 12.7 334 7.8 <1.0RiverBendG10082307 SC19(b) 08-23-2007 Grid point .16 .17 5 6.9 12.9 333 8.0 <1.0RiverBendG1082307 SC19(b) 08-23-2007 Grid point .14 .21 20 7.5 13.0 331 8.1 <1.0RiverBendG11082307 SC19(b) 08-23-2007 Grid point .15 .20 10 7.5 12.9 331 8.1 <1.0RiverBendG12082307 SC19(b) 08-23-2007 Grid point .16 .22 2 7.5 13.0 332 8.1 <1.0RiverBendG13082307 SC19(b) 08-23-2007 Grid point .15 .26 5 6.9 12.9 333 8.0 <1.0RiverBendG14082307 SC19(b) 08-23-2007 Grid point .14 .17 2 6.7 12.6 334 7.9 <1.0RiverBendG15082307 SC19(b) 08-23-2007 Grid point .12 .28 25 6.7 12.6 334 7.9 <1.0RiverBendG16082307 SC19(b) 08-23-2007 Grid point .07 .27 30 7.0 12.9 332 8.0 <1.0RiverBendG17082307 SC19(b) 08-23-2007 Grid point .13 .34 20 7.5 12.9 332 8.1 <1.0RiverBendG2082307 SC19(b) 08-23-2007 Grid point .20 .26 2 7.2 13.0 332 8.0 <1.0RiverBendG3082307 SC19(b) 08-23-2007 Grid point .21 .13 2 6.7 12.7 333 7.8 <1.0RiverBendG4082307 SC19(b) 08-23-2007 Grid point .20 .07 2 6.7 12.7 333 7.9 <1.0RiverBendG5082307 SC19(b) 08-23-2007 Grid point .21 .17 2 7.2 13.0 332 8.0 <1.0RiverBendG6082307 SC19(b) 08-23-2007 Grid point .18 .11 2 7.6 12.7 331 8.1 <1.0RiverBendG7082307 SC19(b) 08-23-2007 Grid point .18 .03 2 7.7 12.5 330 8.1 <1.0RiverBendG8082307 SC19(b) 08-23-2007 Grid point .37 .21 2 7.2 12.9 332 8.0 <1.0RiverBendG9082307 SC19(b) 08-23-2007 Grid point .52 .02 2 6.8 12.7 334 8.0 <1.0RiverBendSK1082307 SC19(b) 08-23-2007 Sockeye salmon redd .16 .23 25 7.2 13.0 332 8.0 <1.0RiverBendSK13082307 SC19(b) 08-23-2007 Sockeye salmon redd .23 .24 25 6.9 12.9 333 8.0 <1.0MooseCreekCH1082907 T4 08-29-2007 Chum salmon redd .27 .55 35 9.6 11.5 99 7.6 1.0MooseCreekCH2082907 T4 08-29-2007 Chum salmon redd .27 .67 30 9.7 11.4 100 7.6 1.9MooseCreekCH3082907 T4 08-29-2007 Chum salmon redd .21 .46 30 9.7 11.4 100 7.6 1.3MooseCreekCH4082907 T4 08-29-2007 Chum salmon redd .32 .94 50 9.8 11.4 100 7.6 <1.0MooseCreekCH6082907 T4 08-29-2007 Chum salmon redd .24 .37 60 9.9 11.5 100 7.7 1.3MooseCreekCH7082907 T4 08-29-2007 Chum salmon redd .73 .41 25 9.9 11.4 100 7.7 1.3MooseCreekG10082907 T4 08-29-2007 Grid point .82 .43 100 9.8 11.4 100 7.6 1.3MooseCreekG1082907 T4 08-29-2007 Grid point .46 1.10 200 9.5 11.6 102 – 1.5MooseCreekG11082907 T4 08-29-2007 Grid point .21 .40 75 9.8 11.4 100 7.6 3.2MooseCreekG12082907 T4 08-29-2007 Grid point .15 .84 100 9.8 11.4 100 7.6 1.2MooseCreekG13082907 T4 08-29-2007 Grid point .18 .83 70 9.8 11.5 100 7.6 1.0MooseCreekG14082907 T4 08-29-2007 Grid point .30 1.12 500 9.9 11.5 100 7.6 1.0MooseCreekG15082907 T4 08-29-2007 Grid point .30 .65 500 9.9 11.4 99 7.7 1.0MooseCreekG16082907 T4 08-29-2007 Grid point .12 .19 200 9.9 11.4 100 7.7 1.2
Table 8. Surface water and channel characteristic intensive survey data for a Matanuska River clearwater side channel (site SC19) near Palmer and Moose Creek (site T4), Alaska.—Continued
[Locations of sites are shown in figure 3. Abbreviations: m, meter; m/s, meter per second; mm, millimeter; °C, degrees Celsius; mg/L, milligram per liter; µS/ cm, microsiemens per centimeter; NTU, nephelometric turbidity unit; –, not available; N/A, not applicable]

30 Salmon Spawning Habitats in Clearwater Side Channels, Matanuska River, Southcentral Alaska
Point identifier Map No. Date Description Depth
(m)Velocity
(m/s)
Median substrate diameter
(mm)
Temperature (°C)
Dissolved oxygen (mg/L)
Specific conductance
(µS/cm)pH Turbidity
(NTU)
MooseCreekG2082907 T4 08-29-2007 Grid point 0.24 0.63 100 9.5 11.6 101 – 1.3MooseCreekG3082907 T4 08-29-2007 Grid point .12 .42 75 9.5 11.6 100 – 1.6MooseCreekG4082907 T4 08-29-2007 Grid point .61 .90 200 9.6 11.6 100 – <1.0MooseCreekG5082907 T4 08-29-2007 Grid point .37 1.06 150 9.6 11.5 100 – <1.0MooseCreekG6082907 T4 08-29-2007 Grid point .27 .51 25 9.7 11.5 101 7.6 <1.0MooseCreekG7082907 T4 08-29-2007 Grid point .56 1.10 100 9.7 11.5 100 7.6 1.1MooseCreekG8082907 T4 08-29-2007 Grid point .29 .97 75 9.8 11.4 100 7.6 1.3MooseCreekG9082907 T4 08-29-2007 Grid point .34 1.01 200 9.8 11.4 100 7.6 <1.0MooseCreekSK5082907 T4 08-29-2007 Sockeye salmon redd .62 .59 15 9.7 11.4 100 7.6 2.3
Table 8. Surface water and channel characteristic intensive survey data for a Matanuska River clearwater side channel (site SC19) near Palmer and Moose Creek (site T4), Alaska.—Continued
[Locations of sites are shown in figure 3. Abbreviations: m, meter; m/s, meter per second; mm, millimeter; °C, degrees Celsius; mg/L, milligram per liter; µS/ cm, microsiemens per centimeter; NTU, nephelometric turbidity unit; –, not available; N/A, not applicable]
Table 9. Descriptive statistics for surface water and channel characteristic intensive survey data for Matanuska River side channel sites SC19(a) and SC19(b) and Moose Creek tributary site T4, Alaska.
[Abbreviations: m, meter; m/s, meter per second; °C, degrees Celsius; µS/cm, microsiemens per centimeter; mg/L, milligram per liter; NTU, nephelometric turbidity unit; mm, millimeter]
Type of pointNumber
of measurements
Mean depth
(m)
Mean velocity
(m/s)
Mean temperature
(°C)
Mean specific
conductance (µS/cm)
Mean dissolved
oxygen (mg/L)
Median pH
Median turbidity
(NTU)
Median substrate diameter
(mm)
Grid point 64 0.21 0.33 8.1 264 11.3 7.9 1.4 20Chum salmon redd 38 .24 .18 7.8 285 11.2 7.9 1.3 30Sockeye salmon redd 10 .25 .23 7.8 292 11.0 7.9 1.9 23
Intergravel Water Temperature
Intergravel water temperature varied within and among selected side channels and tributaries of the Matanuska River. For most of the October–April monitoring period, intergravel water temperatures associated with redds were warmer and displayed less short-term fluctuation that did the temperatures in the overlying surface waters (fig. 14). On average, intergravel water temperatures in side channels were warmer than temperatures in tributaries, possibly because of the greater component of groundwater in the side channels.
Intergravel water temperature adjacent to redds at side channel sites SC5, SC18, and SC19 (fig. 4) varied among the sites and over time at the sites (fig. 14). In side channel study sites, intergravel water temperatures ranged from 0.2 to 10.0 °C (table 10). At-site variation of intergravel water temperature was low (that is, less than 2 °C), indicating only minor spatial variability within spawning sites when measured along 100-m transects (fig. 15).
Values for ATUs varied among all side channel locations, and were higher than those calculated from data recorded at locations on Moose Creek and on an unnamed tributary to Wolverine Creek (table 10). In all cases, intergravel ATU was greater than surface water ATU (table 10). Differences among sites, however, may reflect differences in the amount of time that loggers were in place, which is due to differences in spawning dates among locations (table 10). In spite of this variability in duration of data collection, our estimates of ATU roughly correspond to the period between spawning at a site and presence of emerging fry as determined by visual observation when thermistors were recovered. Relative to tributaries, side channel spawning habitats have higher ATU available for egg development, and thus would provide a higher quality habitat for spawning salmon, especially late spawning species such as chum salmon and coho salmon. All side channels monitored had ATU within the desired range needed to facilitate incubation and emergence of salmon. Chum salmon, for example, require 600–800 ATU to complete incubation and emergence (Wangaard and Burger, 1983). These values were achieved in all intergravel sites adjacent to redds but not in surface waters (table 10).
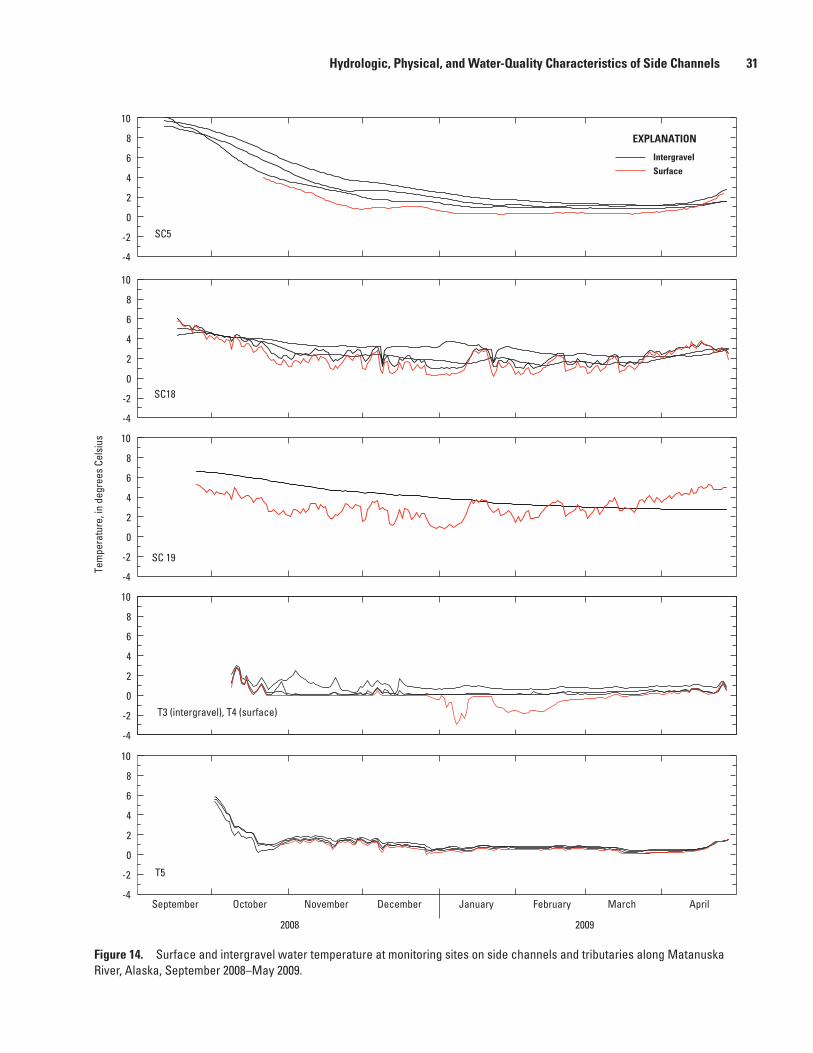
Hydrologic, Physical, and Water-Quality Characteristics of Side Channels 31
tac11-5175_fig14
SC5
Tem
pera
ture
, in
degr
ees
Cels
ius
-4
-2
0
2
4
6
8
10
IntergravelSurface
-4
-2
0
2
4
6
8
10
SC18
-4
-2
0
2
4
6
8
10
T5
September October November December January February March April-4
-2
0
2
4
6
8
10
T3 (intergravel), T4 (surface)
-4
-2
0
2
4
6
8
10
SC 19
2008 2009
EXPLANATION
Figure 14. Surface and intergravel water temperature at monitoring sites on side channels and tributaries along Matanuska River, Alaska, September 2008–May 2009.

32 Salmon Spawning Habitats in Clearwater Side Channels, Matanuska River, Southcentral Alaska
Table 10. Summary of intergravel and surface water temperature data and accumulated thermal units from monitoring sites at three clearwater side channels and two tributaries of the Matanuska River, Alaska.
[Abbreviations: °C, degrees Celsius; ATU, accumulated thermal unit; –, no data]
Location of temperature
sensorDate range Days logged
Minimum temperature
(°C)
Maximum temperature
(°C)
Mean temperature (standard deviation
of mean temperature) (°C)
ATU
SC5
Intergravel #1 09-12-08 – 04-27-09 228 0.9 10 2.7 (2.4) 616Intergravel #2 09-12-08 – 04-27-09 228 .8 9.1 2.9 (2.5) 668Intergravel #3 09-12-08 – 04-27-09 228 1.2 9.7 3.6 (2.7) 811Surface 10-23-08 – 04-27-09 187 .3 4 1.0 (0.9) 182
SC18
Intergravel #1 09-17-08 – 04-28-09 224 1.4 4.6 3.1 (0.7) 691Intergravel #2 09-17-08 – 04-28-09 224 1.3 5 2.4 (1.0) 543Intergravel #3 09-17-08 – 04-28-09 224 1 6 2.5 (1.1) 553Surface 09-17-08 – 04-28-09 224 .2 5.9 2.0 (1.3) 451
SC19
Intergravel #1 Logger disturbed – – – – –Intergravel #2 09-25-08 – 04-27-09 215 2.7 6.6 4.0 (1.2) 865Intergravel #3 Logger disturbed – – – – –Surface 09-25-08 – 04-27-09 215 .8 5.3 3.0 (1.1) 656
T3 (intergravel) and T4 (surface) (Moose Creek)
Intergravel #1 10-09-08 – 04-27-09 201 0 2.8 0.3 (0.4) 51Intergravel #2 10-09-08 – 04-27-09 201 -.1 2.8 .3 (0.4) 66Intergravel #3 10-09-08 – 04-27-09 201 .1 3 1.0 (0.4) 193Surface 10-09-08 – 04-27-09 201 -3 2.9 -.2 (0.8) 29
T5 (tributary to Wolverine Creek)
Intergravel #1 10-02-08 – 04-28-09 209 0.1 5.3 0.9 (0.8) 190Intergravel #2 10-02-08 – 04-28-09 209 .4 5.8 1.2 (0.9) 251Intergravel #3 10-20-08 – 04-28-09 209 .3 5.6 1.1 (0.9) 226Surface 10-29-08 – 04-28-09 182 0 1.5 .6 (0.4) 115
Intergravel water temperature adjacent to redds at Matanuska River tributaries Moose Creek (T3) and an unnamed tributary to Wolverine Creek (T5) (fig. 4) was variable between and within sites (fig. 14). At T3, intergravel water temperature was colder than at all other sampling locations (table 10). ATU varied between T3 and T5 and was the lowest recorded for all sites sampled along the Matanuska River (table 10). Temperatures approached freezing in all intergravel measurement sites, which indicates possible mortality associated with freezing (Reiser and Wesche, 1979). ATU at tributary sites was low relative to expected values needed to achieve emergence of salmon, suggesting that fish would have to spawn prior to the beginning of our monitoring date, when water
temperatures were warmer, to achieve the required thermal units for optimal spring emergence. Additionally, the early embryonic stage of juvenile salmon is highly susceptible to environmentally induced mortality until early epiboly (a stage of development) is reached (Bailey and Evans, 1971); this suggests that late spawning salmon may experience high levels of mortality and deformities as a result of incubation temperature near and below their thermal threshold (Bailey and Evans, 1971). Further work is needed to determine how salmon that spawn in Matanuska River tributaries respond to low intergravel water temperatures. It is possible that salmon at these sites are adapted to incubation in colder temperatures, but this would need to be evaluated with controlled laboratory experiments.

Hydrologic, Physical, and Water-Quality Characteristics of Side Channels 33
tac11-5175_fig15
Tem
pera
ture
, in
degr
ees
Cels
ius
4
5
6
7
8
9
10
11
T5, 10-02-08 SC17, 09-24-08
SC5, 09-12-08
4
5
6
7
8
9
10
11
Centerline temperatureMaximum temperatureMinimum temperature
SC18, 09-17-08
0 10 20 30 40 50 60 70 80 90 100 0 10 20 30 40 50 60 70 80 90 1004
5
6
7
8
9
10
11
Distance downstream, in meters
SC19, 09-25-08
SC2, 09-30-08EXPLANATION
Figure 15. Longitudinal distribution of intergravel temperature within 100-m reaches at intensive survey sites on clearwater side channels and a tributary along Matanuska River, Alaska, September–October 2008.

34 Salmon Spawning Habitats in Clearwater Side Channels, Matanuska River, Southcentral Alaska
Summary and ConclusionsSystematic mapping of clearwater side channels in the
braid plain of the Matanuska River and collection of data on their hydrologic and water-quality characteristics provided new evidence to support prior, mostly anecdotal observations of clearwater habitats for spawning salmon in this turbid glacial river. Analysis of 2006 orthophotography resulted in delineation of 105.8 km of clearwater side channels in the Matanuska River and documented their distribution from the Matanuska Glacier to the river’s mouth. Side channels occurred as individual channels or as a network of channels contained within broad abandoned river bar complexes at the margin of the river’s braid plain; islands within the braid plain supported only a few clearwater channels. Side channel abundance correlated to braid plain width, especially in areas such as those downstream from Palmer, where the wide braid plain supported a large number of channels, and near Chickaloon, where side channels were nearly absent in the narrow braid plain.
Channel patterns identified on historical imagery and the presence of young vegetation surrounding many sites indicates that these channels persist, on average, for a period of from years to decades before the actively migrating channels of the mainstem re-occupy and re-work them. Small tributaries provided a direct water source for some side channels, but springs originating in the braid plain formed a more common water source. The distribution, age, and water source of the channels show that conditions favorable for clearwater side channels—a pre-existing channel form and a source of clear water—are relatively abundant under the present-day actively braiding conditions of the Matanuska River. Densities of side channels vary locally with braid plain width and availability of a water source. The extent to which springs feeding side channels originate in a local or regional alluvial aquifer, or an upland aquifer, was not investigated for this report, but many springs were observed to provide year-round flow in locations from tens to hundreds of meters from mainstem channels.
Wide, shallow, and gravel-bedded, these small side channels formed a common habitat for spawning salmon during the course of this study. Although the total length of delineated side channels that were used by salmon was not determined, spawning salmon or carcasses were observed at 19 sites spanning 65 braid plain kilometers that were selected for measurement of channel and water characteristics. Recent tracking of radio-tagged salmon indicated that more than 90 percent of chum salmon, 98 percent of sockeye salmon, and 44 percent of coho salmon spawning in the Matanuska River watershed selected spawning locations in clearwater side channels within the mainstem braid plain. On the basis of field measurements of surface water and channel characteristics and intergravel water temperatures, it is apparent that these habitats are viable salmon spawning (and likely rearing)
habitats. Given the dynamic nature of the Matanuska River braid plain, these habitats are likely to change, move, disappear, and reappear over time, and these natural cycles of disturbance are an important component of healthy habitats for Pacific salmon (Reeves and others, 1995). Previously virtually ignored as fish habitat, the Matanuska River is part of the focus of the Matanuska-Susitna Basin Salmon Habitat Partnership, and the results of this study will aid in defining the distribution of salmon habitats to aid land use and fisheries planning and management.
AcknowledgmentsNumerous property owners graciously permitted access
across their land to the Matanuska River. The Chickaloon Village Traditional Council Environmental Stewardship Department staff, particularly Brian Winnestaffer, assisted with field data collection, side-channel delineation, and logistics. U.S. Fish and Wildlife Service fishery biologists Jeff Anderson, Theresa Tanner, and field crew generously shared data and resources from their concurrent fish-tracking studies.
References Cited
Anderson, J.L., and Bromaghin, J.F., 2009, Estimating the spawning distribution of Pacific salmon in the Matanuska River watershed, Southcentral Alaska, 2008: U.S. Fish and Wildlife Service Alaska Fisheries Data Series Number 2009-12, 43 p.
Bailey, J.E., and Evans, D.E., 1971, The low-temperature threshold for pink salmon eggs in relation to a proposed hydroelectric installation: Fishery Bulletin, v. 69, p. 587-593.
Barnes, F.F., 1962, Geologic map of the Lower Matanuska Valley, Alaska: U.S. Geological Survey Miscellaneous Geological Investigations Map I-359.
Bjornn, T.C., and Reiser, D.W., 1991, Habitat requirements of salmonids in streams: American Fisheries Society Special Publication 19, p. 83-138.
Buffington, J.J., Montgomery, D.R., and Greenberg, H.M., 2004, Basin-scale availability of salmonid spawning gravel as influenced by channel type and hydraulic roughness in mountain catchments: Canadian Journal of Fisheries and Aquatic Sciences, v. 61, p. 2085-2096.
Chapman, D.W., 1988, Critical review of variables used to define effects of fins in redds of large salmonids: Transactions of the American Fisheries Society, v. 117, p. 1-21.

References Cited 35
Crisp, D.T., 1988, Prediction, from temperature, of eyeing, hatching and ‘swim-up’ times for salmonid embryos: Freshwater Biology, v. 19, p. 41-48.
Crisp, D.T., 1990, Water temperature in a stream gravel bed and implications for salmonid incubation: Freshwater Biology, v. 23, p. 601-612.
Curran, J.H., Meyer, D.F., and Tasker, G.D., 2003, Estimating the magnitude and frequency of peak streamflows for ungaged sites on streams in Alaska and conterminous basins in Canada: U.S. Geological Survey Water-Resources Investigations Report 03-4188, 101 p.
DeVries, P., 1997, Riverine salmonid egg burial depths—Review of published data and implications for scour studies: Canadian Journal of Fisheries and Aquatic Sciences, v. 54, p. 1685-1698.
Eiler, J.H., Nelson, B.D., and Bradshaw, R.F., 1992, Riverine spawning by sockeye salmon in the Taku River, Alaska and British Columbia: Transactions—American Fisheries Society, v. 121, no. 6, p. 701-708.
Kogl, D.R., 1965, Springs and ground-water as factors affecting survival of chum salmon spawn in a sub-arctic stream: Fairbanks, University of Alaska, Master’s thesis, 59 p.
Lloyd, D.S., Koenings, J.P., and La Perriere, J.D., 1987, Effects of turbidity in fresh waters of Alaska: North American Journal of Fisheries Management, v.7, p. 18-33.
Lorenz, J.M., and Eiler, J.H., 1989, Spawning habitat and redd characteristics of sockeye salmon in the glacial Taku River, British Columbia and Alaska: Transactions of the American Fisheries Society, v. 118, p. 495-502.
Maclean, S.H., 2003, Influences of hydrological processes on the spatial and temporal variation in spawning habitat quality for two chum salmon stocks in interior Alaska: Fairbanks, University of Alaska, Master’s thesis, 93 p.
Mat-Su Basin Salmon Habitat Partnership, 2008, Conserving salmon habitat in the Mat-Su basin—The strategic action plan of the Mat-Su Basin Salmon Habitat Partnership: ConserveOnline web site, accessed April 26, 2011, at http://conserveonline.org/workspaces/MatSuSalmon/documents/strategic-action-plan-0/view.html.
McPhee, M.V., Tappenbeck, T.H., Whited, D.C., and Stanford, J.A., 2009, Genetic diversity and population structure in the Kuskokwim River drainage support the recurrent evolution hypothesis for sockeye salmon life histories: Transactions of the American Fisheries Society, v. 138, p. 1481-1489.
Montgomery, D.R., Buffington, J.M., Peterson, N.P., Schuett-Hames, D., and Quinn, T.P., 1996, Stream-bed scour, egg burial depths, and the influence of salmonid spawning on bed surface mobility and embryo survival: Canadian Journal of Fisheries and Aquatic Sciences, v. 53, p. 1061-1070.
Platts, W.S., Megahan, W.F., and Minshall, G.W., 1983, Methods for evaluating stream, riparian, and biotic conditions.: U.S. Forest Service INT-138, 70 p.
Quinn, T.P., 2005, The behavior and ecology of Pacific salmon and trout: University of Washington Press, Seattle, 320 p.
Reeves. G.H., Benda, L.E., Burnett, K.M., Bisson, P.A., and Sedell, J.R., 1995, A disturbance-based ecosystem approach to maintaining and restoring freshwater habitats of evolutionarily significant units of anadromous salmonids in the Pacific Northwest, in Nielsen, J.L., ed., Evolution and the aquatic ecosystem—Defining unique units in population conservation: American Fisheries Society Symposium 17, Bethesda, Md., p. 334-349.
Reger, R.D., Pinney, D.S., Burke, R.M., and Wiltse, M.A., 1996, Catalog and initial analyses of geologic data related to Middle to Late Quaternary deposits, Cook Inlet region, Alaska: Alaska Division of Geological & Geophysical Surveys Report of Investigation 95-6, 188 p., 6 sheets.
Reiser, D.W., and Wesche, T.A., 1979, In situ freezing as a cause of mortality in brown trout eggs: The Progressive Fish Culturalist, v. 41, p. 58-60.
Stanford, J.A., Ward, J.V., Liss, W.J., Frissell, C.A., Williams, R.N., Lichatowich, J.A., and Coutant, C.C., 1996, A general protocol for restoration of regulated rivers: Regulated Rivers Research and Management, v. 12, p. 391-413.
U.S. Census Bureau, 2008, 2008 population estimates: U.S. Census Bureau database, accessed March 25, 2010, at http://www.census.gov.
U.S. Department of Agriculture Natural Resources Conservation Service, 1998, Soil survey of Matanuska-Susitna Valley area, Alaska: U.S. Department of Agriculture Soil Survey Report, accessed November 25, 2009, at http://soildatamart.nrcs.usda.gov/Manuscripts/AK600/0/MatanuskaSusitna.pdf.
U.S. Geological Survey, 2006, 1-ft pixel orthoimagery derived from 1:24,000 true color aerial imagery.
U.S. Geological Survey, 2008, Water-resources data for the United States, water year 2008: U.S. Geological Survey database, accessed August 11, 2009, at http://wdr.water.usgs.gov/.

36 Salmon Spawning Habitats in Clearwater Side Channels, Matanuska River, Southcentral Alaska
Wagner, R.J., Boulger, R.W., Jr., Oblinger, C.J., and Smith, B.A., 2006, Guidelines and standard procedures for continuous water-quality monitors—Station operation, record computation, and data reporting: U.S. Geological Survey Techniques and Methods 1–D3, 51 p. plus attachments, accessed September 23, 2009, at http://pubs.usgs.gov/tm/2006/tm1D3/.
Wangaard, D.B., and Burger, C.V., 1983, Effects of various water temperature regimes on the egg and alevin incubation of Susitna River chum and Sockeye Salmon: U.S. Fish and Wildlife Service, National Fisheries Research Center, Anchorage, Alaska, 43 p.
Western Regional Climate Center, 2000, PRISM precipitation maps—1961–90, Mean annual precipitation, Alaska-Yukon: Western Regional Climate Center map, accessed March 9, 2010, at http://www.wrcc.dri.edu/pcpn/ak.gif.
Western Regional Climate Center, 2009, Western U.S. climate historical summaries: Western Regional Climate Center database, accessed November 25, 2009, at http://www.wrcc.dri.edu/summary/Climsmak.html.
Wilde, F.D., ed., variously dated, Field measurements: U.S. Geological Survey Techniques of Water-Resources Investigations, book 9, chap. A6, accessed September 23, 2009, at http://pubs.water.usgs.gov/twri9A6/.
Wilson, F.H., Hults, C.P., Schmoll, H.R., Haeussler, P.J., Schmidt, J.M., Yehle, L.A., and Labay, K.A., compilers; Digital files prepared by Wilson, F.H., Hults, C.P., Labay, K.A., and Shew, N., 2009, Preliminary geologic map of the Cook Inlet region, Alaska—Including parts of the Talkeetna, Talkeetna Mountains, Tyonek, Anchorage, Lake Clark, Kenai, Seward, Iliamna, Seldovia, Mount Katmai, and Afognak 1:250,000-scale quadrangles: U.S. Geological Survey Open-File Report 2009-1108, scale 1:250,000. (Also available at http://pubs.usgs.gov/of/2009/1108/.)
Winkler, G.R., 1992, Geologic map and summary geochronology of the Anchorage 1° x 3° Quadrangle, Southern Alaska: U.S. Geological Survey Miscellaneous Investigations Series Map I-2283.
Wood, C.C., Riddel, B.E., and Rutherford, D.T., 1987, Alternative juvenile life histories of sockeye salmon (Oncorhynchus nerka) and their contribution to production in the Stikine River, northern British Columbia: Canadian Special Publication of Fisheries and Aquatic Science, v. 96, p. 12-24.
Young, D.B., and Woody, C.A., 2007, Spawning distribution of sockeye salmon in a glacially influenced watershed—The importance of glacial habitats: Transactions of the American Fisheries Society, v. 136, p. 452-459.

Appendix A 37
Appendix A. Description of Matanuska River Clearwater Side Channel Geographic Information System Products
Table A1. Clearwater side channel Geographic Information System products from Matanuska River, Alaska.
[Shapefiles produced for this report are described below and are available for download at http://pubs.usgs.gov/sir/2011/5102/]
Shapefile name Description
2006_sidechannels.shp Arcs representing all clearwater side channels within the project boundary present in October 2006 orthoimagery, attributed with side channel water source, qualitative turbidity, type of surface occupied, position within the braid plain, field verification data, and fish observations from September 13, 2007, aerial survey.
Bndry.shp Polygon defining the extent of the U.S. Geological Survey Matanuska River clearwater side channels project. The primary use of this boundary was for delineation of clearwater side channels and computation of side channel density.
FieldSites.shp Points representing the 34 field sites used in the report. Actvities at each site are summarized in table 2.IntensiveChannelSurvey.shp Points representing surveyed grid points, salmon redds, edges of water, and survey markers at three
intensively surveyed reaches of the Matanuska River and its tributary, Moose Creek.ReconData.shp Points representing all measurement locations used in this report, attributed with water quality field
parameter data, physical channel characteristics, side channel water source, and fish observations from ground surveys.

38 Salmon Spawning Habitats in Clearwater Side Channels, Matanuska River, Southcentral Alaska
This page intentionally left blank

Publishing support provided by the U.S. Geological SurveyPublishing Network, Tacoma and Rolla Publishing Service Center
For more information concerning the research in this report, contact the Director, Alaska Science Center
U.S. Geological Survey 4210 University Dr. Anchorage, Alaska 99508-4560 http://alaska.usgs.gov

Curran and others—Salm
on Spawning Habitats in Clearw
ater Side Channels, Matanuska River, Southcentral Alaska—
Scientific Investigations Report 2011–5102