Distribution of pteropods (Mollusca: Gastropoda ... · Revista de Biología Marina y ......
16
Revista de Biología Marina y Oceanografía 44(3): 647-662, diciembre de 2009 Distribution of pteropods (Mollusca: Gastropoda: Thecosomata) in surface waters (0-100 m) of the Western Caribbean Sea (winter, 2007) Distribución de pterópodos (Mollusca: Gastropoda: Thecosomata) en aguas superficiales (0-100 m) del Mar Caribe Occidental (invierno, 2007) Ana Parra-Flores 1 and Rebeca Gasca 1 1 El Colegio de la Frontera Sur (ECOSUR), Unidad Chetumal. Av. Centenario Km 5.5 Chetumal, Quintana Roo 77014, México [email protected] Resumen.- El principal objetivo de este estudio fue conocer la distribución vertical y horizontal de los pterópodos tecosomados en la capa superior de los 100 m del Mar Caribe occidental. El zooplancton fue recolectado en 60 estaciones durante enero 2007 en intervalos de profundidad de 25 m desde la superficie a 100 m. La comunidad fue analizada en términos de diversidad, equidad, riqueza y similitud. Encontramos 36 taxa de los que 12 son nuevos registros para el Caribe occidental. Los taxa más abundantes fueron Limacina inflata, L. trochiformis, Creseis acicula f. clava, Cuvierina columnella atlantica y Hyalocylis striata. En general, mostraron un mismo patrón, sus mayores abundancias ocurrieron consistentemente en el estrato 0-25 m de día y noche; la abundancia decrece con la profundidad. Se encontraron diferencias significativas día/ noche en composición y abundancia, no así entre estratos. El estrato de 0-25 m contiene los mayores valores de riqueza, diversidad y abundancia de pterópodos, lo que representa un hallazgo sin precedente respecto a estudios previos. La estructura de la comunidad local está determinada en gran medida por las migraciones verticales día/noche. Los pterópodos tendieron a ser más abundantes en los sectores norte y sur del área, pero su mayor diversidad y riqueza se registró en el sector central. La baja variabilidad de las condiciones hidrográficas y la mezcla horizontal de los grupos generados por el análisis de similitud sugieren que los patrones migratorios día/noche explican la variabilidad observada en la comunidad de pterópodos. Palabras clave: Moluscos tecosomados, zooplancton marino, migración vertical, abundancia, diversidad Abstract.- The main goal of this survey was to study the vertical and horizontal distribution of the thecosome pteropods in the upper 100 m of the western Caribbean Sea. Zooplankton was collected at 60 stations in January 2007 at stratified depth intervals of 25 m from the surface to 100 m. The community was analyzed for diversity, evenness, species richness, and similarity. We recorded 36 taxa 12 of which are new records for the western Caribbean. The most abundant taxa were Limacina inflata, L. trochiformis, Creseis acicula f. clava, Cuvierina columnella atlantica, and Hyalocylis striata. In general, these taxa showed a similar pattern, their highest abundances occurred consistently in 0-25 m layer in both night and day samples; abundance decreased with depth. Significant day/night differences were found in the composition and abundance of pteropods, differences among depth intervals were non-significant. Our results showed that the upper 25 m harbored the highest species richness, diversity, and vertical abundance of pteropods, thus providing unprecedented detail with respect to previous surveys. The local community structure of the pteropods is determined largely by vertical day/night migrations. Pteropods tended to be most abundant in the southern and northern sectors of the area, but highest diversity and species richness were recorded in the central sector. Overall, the low variability of the hydrographic conditions and the mixed horizontal distribution of the clusters from the similarity analysis suggest that day/night migratory patterns of the most abundant taxa are determinant of the observed variability of the pteropod community. Key words: Thecosome molluscs, marine zooplankton, vertical migration, abundance, diversity Introduction Pteropods represent a lineage of the Mollusca that have successfully colonized the water column. They are among the most frequent and abundant groups in the oceanic zooplankton communities (Van der Spoel 1967, 1996, Van der Spoel & Dadón 1999). This relatively small group of holoplanktic molluscs includes two orders of the Gastropoda. In this study we deal only with those belonging to the order Thecosomata, which includes the suborders Euthecosomata and Pseudothecosomata (Van der Spoel & Boltovskoy 1981, Van der Spoel & Dadón 1999). As a group, the thecosome pteropods are widely distributed in the world ocean, including cold, temperate,
Transcript of Distribution of pteropods (Mollusca: Gastropoda ... · Revista de Biología Marina y ......

Revista de Biología Marina y Oceanografía 44(3): 647-662, diciembre de 2009
Distribution of pteropods (Mollusca: Gastropoda: Thecosomata) insurface waters (0-100 m) of the Western Caribbean Sea (winter, 2007)
Distribución de pterópodos (Mollusca: Gastropoda: Thecosomata) en aguassuperficiales (0-100 m) del Mar Caribe Occidental (invierno, 2007)
Ana Parra-Flores1 and Rebeca Gasca1
1El Colegio de la Frontera Sur (ECOSUR), Unidad Chetumal. Av. Centenario Km 5.5 Chetumal,Quintana Roo 77014, México
Resumen.- El principal objetivo de este estudio fue conocerla distribución vertical y horizontal de los pterópodostecosomados en la capa superior de los 100 m del Mar Caribeoccidental. El zooplancton fue recolectado en 60 estacionesdurante enero 2007 en intervalos de profundidad de 25 m desdela superficie a 100 m. La comunidad fue analizada en términosde diversidad, equidad, riqueza y similitud. Encontramos 36taxa de los que 12 son nuevos registros para el Caribeoccidental. Los taxa más abundantes fueron Limacina inflata,L. trochiformis, Creseis acicula f. clava, Cuvierina columnellaatlantica y Hyalocylis striata. En general, mostraron un mismopatrón, sus mayores abundancias ocurrieron consistentementeen el estrato 0-25 m de día y noche; la abundancia decrece conla profundidad. Se encontraron diferencias significativas día/noche en composición y abundancia, no así entre estratos. Elestrato de 0-25 m contiene los mayores valores de riqueza,diversidad y abundancia de pterópodos, lo que representa unhallazgo sin precedente respecto a estudios previos. Laestructura de la comunidad local está determinada en granmedida por las migraciones verticales día/noche. Lospterópodos tendieron a ser más abundantes en los sectores nortey sur del área, pero su mayor diversidad y riqueza se registróen el sector central. La baja variabilidad de las condicioneshidrográficas y la mezcla horizontal de los grupos generadospor el análisis de similitud sugieren que los patrones migratoriosdía/noche explican la variabilidad observada en la comunidadde pterópodos.
Palabras clave: Moluscos tecosomados, zooplancton marino,migración vertical, abundancia, diversidad
Abstract.- The main goal of this survey was to study thevertical and horizontal distribution of the thecosome pteropodsin the upper 100 m of the western Caribbean Sea. Zooplanktonwas collected at 60 stations in January 2007 at stratified depthintervals of 25 m from the surface to 100 m. The communitywas analyzed for diversity, evenness, species richness, andsimilarity. We recorded 36 taxa 12 of which are new recordsfor the western Caribbean. The most abundant taxa wereLimacina inflata, L. trochiformis, Creseis acicula f. clava,Cuvierina columnella atlantica, and Hyalocylis striata. Ingeneral, these taxa showed a similar pattern, their highestabundances occurred consistently in 0-25 m layer in both nightand day samples; abundance decreased with depth. Significantday/night differences were found in the composition andabundance of pteropods, differences among depth intervals werenon-significant. Our results showed that the upper 25 mharbored the highest species richness, diversity, and verticalabundance of pteropods, thus providing unprecedented detailwith respect to previous surveys. The local community structureof the pteropods is determined largely by vertical day/nightmigrations. Pteropods tended to be most abundant in thesouthern and northern sectors of the area, but highest diversityand species richness were recorded in the central sector. Overall,the low variability of the hydrographic conditions and the mixedhorizontal distribution of the clusters from the similarityanalysis suggest that day/night migratory patterns of the mostabundant taxa are determinant of the observed variability ofthe pteropod community.
Key words: Thecosome molluscs, marine zooplankton, verticalmigration, abundance, diversity
IntroductionPteropods represent a lineage of the Mollusca that havesuccessfully colonized the water column. They are amongthe most frequent and abundant groups in the oceaniczooplankton communities (Van der Spoel 1967, 1996,Van der Spoel & Dadón 1999). This relatively small groupof holoplanktic molluscs includes two orders of the
Gastropoda. In this study we deal only with thosebelonging to the order Thecosomata, which includes thesuborders Euthecosomata and Pseudothecosomata (Vander Spoel & Boltovskoy 1981, Van der Spoel & Dadón1999).
As a group, the thecosome pteropods are widelydistributed in the world ocean, including cold, temperate,

and tropical latitudes. Their vertical distribution is broad,stretching from the surface layers to the bathypelagiczone. Many euthecosomatous forms are restricted to theupper 200 m but members of the Pseudothecosomatadwell mainly in deeper layers (Van der Spoel 1996). Mostthecosome pteropods exhibit relatively short diurnalvertical migrations along the 0-100 m depth range; duringthe day they tend to move to deeper layers and thenmigrate to the surface at night (Angel & Pugh 2000).The different species have variable patterns of verticaldistribution and day/night migrations (Hays 2003); inmany geographical regions, but particularly in the tropics,these patterns remain unknown for most of these species.
In the Caribbean Sea, previous research on this grouphas focused on its general species composition, horizontaldistribution, and abundance (Gasca & Suárez-Morales1992, Suárez-Morales & Gasca 1998). Only the earlywork by Haagensen (1976) included information aboutthe vertical distribution of the pteropods from the centraland eastern Caribbean. There are no previous studiesinvolving stratified samplings to describe the verticaldistribution of this group in the western sector of theCaribbean Sea. Furthermore, this survey provides anunprecedented vertical stratification (each 25 m) of the0-100 m layer. Based on a set of stratified samples fromthe upper 100 m of the water column, we describe thecomposition, abundance, and vertical and horizontaldistributional patterns of the thecosome pteropods from
Figure 1
Sampling stations in the western Caribbean Sea off Mexico and Belize visited during January 2007. Circled stations weresampled at night; stations within a square represent daytime samplings
Estaciones de muestreo en el Mar Caribe Occidental de México y Belice visitadas durante enero 2007. Las estaciones encerradas enun círculo fueron muestreadas en la noche; las que están en cuadros representan muestreos diurnos
oceanic waters of the westernmost sector of the CaribbeanSea during January 2007.
Study area
The surveyed area lies between 16º14' and 21º30’N and86º59’ and 88º22’W off the eastern coast of the Yucatanpeninsula (Fig. 1). The area is influenced by the northwardflow of the Yucatan Current on its way to the Gulf ofMexico through the Yucatan Channel (Merino 1986).Water circulation is part of the North Atlantic SubtropicalGyre, forced by wind stress over the North Atlantic, thisprocess sheds eddies into the Caribbean Sea Basin. Inaddition to large-scale processes, local small andmesoscale features change the hydrographical profile ofthe western Caribbean. Advective processes transportoceanic water onto the coastline; hence, the oceanicinfluence is detectable very near the coast and tends tofavor a generalized oceanic profile in the area (Merino1986). The northeast portion of the Yucatan peninsula ischaracterized by a large upwelling system (Merino 1997).The water masses in the area have been described fromT-S profiles and correspond to surface tropical AtlanticOcean water (28ºC, 36 psu), subtropical subsurface water(22ºC, 36.7 psu), the Western North Atlantic CentralWater mass below 500 m (20ºC, 34.8 psu), and theuniform deep waters of the Atlantic below 1000 m depth(4ºC, 35 psu). Salinity varies little throughout the year,between 35.8 and 36.2 psu. The sea-surface temperature
648 Revista de Biología Marina y Oceanografía Vol. 44, Nº3, 2009

varies seasonally between 26ºC in the winter and 31ºCin the summer (Mooers & Maul 1998). A generaldescription of the oceanographic conditions of theCaribbean Sea was provided by Gallegos & Czitrom(1997).
Material and methodsSamples were collected during a joint project of theNational Oceanic and Atmospheric Administration(NOAA) and El Colegio de la Frontera Sur (ECOSUR)to survey the plankton and the physical oceanography ofthe western Caribbean. A total of 240 zooplanktonsamples were obtained at 60 stations visited duringJanuary 2007 on board the R/V Gordon-Gunter (GU0701,NOAA). Samples were collected using a MOCNESS-1net system, with 1 m2 mouth, 335-µm mesh nets, andequipped with a digital flowmeter. The amount of waterfiltered by the net was 593 ± 115 m3. Sampling stations
were visited at daytime (6:00 a.m.-18:00 p.m.) ornighttime (after 18:00 p.m.), approximately 1 h after dawnand after sunset. Samples were collected at four differentdepth intervals: 0-25, 25-50, 50-75, and 75-100 m.Temperature and salinity were measured simultaneouslyat each station/depth layer with a SeaBird CTD. Sampleswere fixed and preserved in 70% ethanol. The thecosomepteropods were sorted from the original samples and thenidentified following Van der Spoel & Boltovskoy (1981),Van der Spoel (1996), Van der Spoel et al. (1997), andVan der Spoel & Dadón (1999).
Diversity (Shannon index), evenness (Pielou´sevenness index), and species richness (Margalef index)were estimated. Log-transformed [log (x+1)] abundancedata and similarity percentages (SIMPER) were used toestimate the relative contribution of each species to theaverage dissimilarity between day and night samples anddepth strata paired combinations. A one-way analysis of
Figure 2Latitudinal variation of temperature (°C) in the study area including all 60 sampling sites at each of the
four interval depths sampled
Variación latitudinal de temperatura (°C) en el área de estudio incluyendo los 60 sitios de muestreo en cadauno de los cuatro intervalos de profundidad
Parra-Flores & Gasca Pteropods of the Western Caribbean Sea 649

similarity (ANOSIM) was used to estimate thesignificance of the variability among the verticaldistributional patterns of the species. Based on a Bray-Curtis rank similarity matrix as a distance measure witha group average linkage, clustering was performed toexplore the similarities among sample groups using (1)the entire set of samples with the vertical stratificationand (2) the integrated abundance data of nighttimesamples, the latter in order to reveal patterns of thehorizontal distribution of pteropods in the area. Theseanalyses were performed using the software PRIMER(Clarke & Warwick 2001).
ResultsTemperature and salinity showed a generalized uniformpattern at all four depth intervals surveyed in the samplingarea (Figs. 2 and 3). The surface (0-25 m) and the deepest
Figure 3
Latitudinal variation of salinity (PSU) in the study area including all 60 sampling sites at each ofthe four interval depths sampled
Variación latitudinal de salinidad (PSU) en el área de estudio incluyendo los 60 sitios de muestreo encada uno de los cuatro intervalos de profundidad
(75-100 m) layers showed a similar temperature range(23.8-27.4ºC and 23.9-27.4 ºC, respectively) (Fig. 2). Themaximum temperature occurred at 25-50 m (27.4ºC) onthe southernmost sector of the surveyed area; lowestvalues (23.9ºC) were recorded at the maximum depthsampled (75-100 m), off the northern sector of thesurveyed area. Salinity ranged from 34.2 and 36.9 psu inthe surveyed area, mainly in the surface layer; among theother three layers sampled, the variation range was verylow (35.5-36.3) (Fig. 3). Highest values were recordedat the 75-100 m layer south of Belize and the minimumin the surface layer (0-25 m) north of the Yucatanpeninsula.
A total of 87,472 thecosome pteropods collected fromthe studied area were taxonomically examined. This groupwas represented by 12 genera and 36 species includingsix subspecies and seven forms. The number of taxa found
650 Revista de Biología Marina y Oceanografía Vol. 44, Nº3, 2009

Table 1
Thecosome pteropod species recorded in the surveyed area during January 2007. The asterisk (*) indicatesspecies that have not been previously recorded in the Western Caribbean
Especies de pterópodos tecosomados registradas en el área de estudio durante enero 2007. El asterisco (*)indica especies que no han sido encontradas previamente en el Caribe occidental
in day samples was 26, whereas 34 were recorded fromnighttime samples; only two species occurred exclusivelyin day samples and eight at night (Table 1).
Ten species were the most abundant in the surveyedarea. Limacina inflata (52.5%) and L. trochiformis(18.1%) together constituted almost 71% of the totalthecosome numerical abundance, both species occurredat 90% of the stations. Several other taxa had overall
relative abundances over 0.25% and were considered ascommon in the area: C. acicula f. clava (14.9%),Hyalocylis striata (1.12%), Creseis acicula f. acicula(0.78%), Diacavolinia constricta (0.70%), C. inflexa f.inflexa (0.39%), Cuvierina columnella atlantica (0.35%),and L. helicina (0.50%), and Cavolinia uncinata f.uncinata (0.28%). The remaining species were consideredrare (Table 2).
Parra-Flores & Gasca Pteropods of the Western Caribbean Sea 651

Table 2
Relative abundance (RA) and average abundance (AA) of pteropods recorded during January 2007 in the study area. (*) Dominant species
Abundancia relativa (RA) y promedio (AA) de los pterópodos registrados durante enero 2007 en el área de estudio. (*) Especies dominantes
Day/Night abundance
The overall average abundance of thecosome pteropodsshowed a significant day/night variation; the day average(340 ± 35 org. 1000 m-3) was almost three-times lowerthan at night (961 ± 112 org. 1000 m-3). The highest night(2,381 org. 1000 m-3) and daytime (697 org. 1000 m-3)abundances were recorded at the surface layer (0-25 m).
In general, the overall thecosome abundance wasconsistently higher at night and decreased with depth (Fig.4).
Diversity and species richness
The highest number of species was recorded in the 50-75 m layer at night (29 species), followed by 21 species
652 Revista de Biología Marina y Oceanografía Vol. 44, Nº3, 2009

found at the deeper (75-100 m) and intermediate (50-75m) layers during the day. Species richness increasedgradually with depth in both nighttime and daytimesamples; the maximum value (4.35) was observed at the50-75 m layer at night (Fig. 5A). The highest verticaldiversity was recorded at the surface layer (0-25 m) inthe three sectors; the same pattern was observed for thespecies richness except for a relatively high value at 50-75 m in the northern sector. The highest integrated (0-100 m) diversity and species richness were recorded atthe central sector of the surveyed area (roughly between18 and 20°N), with average values of 0.83 and 0.93,respectively; the southern sector (16°30’-18°) showedthe lowest species richness (0.65) and diversity (0.69).
Shannon Diversity (H’) ranged from 0.63 to 1.26 andPielou’s evenness varied between 0.20 and 0.42; themaximum occurred at daytime at 0-25 m and the minimumduring the night at 75-100 m. In daytime samples the H’value decreased and the number of species increased withdepth, from 0-25 m (19 species, H’ = 1.26) to 75-100 m(21 species, H’ = 0.79) (Fig. 5B).
Vertical and horizontal distribution of species
The most abundant pteropod species showed similarpatterns in their vertical and horizontal distribution,whereas the rare species had irregular patterns in both
Figure 4
Total abundance (org. 1000 m-3) of pteropods collectedduring this survey at the different depth ranges
sampled. Black bars represent nighttimesamples, white bars indicate
daytime samples
Abundancia total (org. 1000 m-3) de pterópodos recolectadosdurante este estudio en los diferentes intervalos de
profundidad muestreados. Las barras negrasrepresentan muestras nocturnas, las
blancas son muestras diurnasFigure 5
(A) Variation of Shannon-Wiener Diversity (H’) (squares)and evenness (J’) (triangles) of pteropods collected at
different depth ranges during this survey.(B) Variation of species richness at the different
depth ranges sampled. Black lines representnighttime samples and light gray
lines daytime samples
(A) Variación de la diversidad de Shannon (H’) (cuadros) yequidad (J’) (triángulos) de los pterópodos recolectados
en diferentes intervalos de profundidad durante esteestudio. (B) Variación de la riqueza de especies
en los diferentes intervalos de profundidad.Las líneas negras representanmuestras nocturnas, las líneas
grises muestras diurnas
nocturnal and diurnal samples. The highest numericalabundance of the 10 commonest species were consistentlyrecorded in the surface layer (0-25 m) in both night andday samples; exceptions of this pattern were Hyalocylisstriata, Limacina helicina, Cavolinia inflexa formainflexa, and C. uncinata forma uncinata, whose maximumabundance occurred at 50-75 m at night and in the 75-100 m during the day.
Limacina inflata was the most abundant species atall depth intervals in night samples, its highest density(1,504 org. 1000 m-3) occurred at 0-25 m and the lowest(199 org. 1000 m-3) was recorded at 75-100 m. A similar
Parra-Flores & Gasca Pteropods of the Western Caribbean Sea 653

Figure 6
Vertical distribution of the abundance (org. 1000 m-3) of the 10 dominant species of pteropods in thesurveyed area during daytime (white bars) and nighttime (black bars)
Distribución vertical de la abundancia (org. 1000 m-3) de las 10 especies de pterópodos dominantes en el áreade estudio durante el día (barras blancas) y la noche (barras negras)
654 Revista de Biología Marina y Oceanografía Vol. 44, Nº3, 2009

pattern was observed during daytime, but with lowernumerical abundances; the maximum was recorded at 0-25 m (155 org. 1000 m-3) and the minimum at 25-50 m(74 org. 1000 m-3) (Fig. 6A).
Limacina trochiformis occurred at all depth intervals.This species was more abundant at night (552 org. 1000m-3) than during the day (265 org. 1000 m-3) in the surfacelayer (0-25 m); during daytime L. trochiformis was themost abundant species (Fig. 6B).
Creseis acicula forma clava was most abundant atthe 0-25 m layer at night (278 org. 1000 m-3) and it wasslightly less abundant during the day at the same depthinterval (252 org. 1000 m-3). Its density decreased athigher depths (Fig. 6C).
Hyalocylis striata was common, but it had lowabundances; its highest density (104 org. 1000 m-3) wasrecorded at night in the 50-75 m layer. Overall, thisspecies showed an irregular vertical distribution (Fig.6D). The same pattern was observed for L. helicina andCavolinia uncinata f. uncinata; their maximumabundances (4 org. 1000 m-3 and 1 org. 1000 m-3,respectively), occurred at the same depth interval (Figs.6E, F).
Cuvierina columnella atlantica showed a uniformpattern of vertical distribution, it was particularlyabundant at night; during daytime it was distributedmostly within the 25-75 m range (Fig. 6G). The maximumabundance of Cavolinia inflexa f. inflexa (4 org. 1000m-3) was recorded at night in the 0-25 m layer anddecreased with depth; during the day it was distributedmainly at the 50-75 m layer (Fig. 6H).
Both Diacavolinia constricta and Creseis acicula f.acicula had similar distributional patterns, their highestabundance was observed at the surface layer both duringthe nighttime and during the day, but daytime abundancedecreased with depth (Figs. 6I, J).
The integrated (0-100 m) numerical abundance ofpteropods was highest in the southern sector of thesurveyed area, up to 41.2% (average 826 org. 1000 m-3)of the total catch of pteropods occurred in this area,whereas 36.3 (average: 730 org. 1000 m-3) and 22.5%(average: 450 org. 1000 m-3) were collected in thenorthern and central sectors, respectively.
The distribution of the integrated horizontalabundances of the dominant species is shown in Fig. 7following a division of the surveyed area into threesectors: northern, central, and southern. Most of thecommonest thecosome species recorded in this surveyshowed a dominant pattern on their horizontal
distribution. In general, the highest abundances of thesespecies were recorded in the northern sector of thepeninsula and off the Belizean coast, in the southernsector. Hence, the central part showed intermediate valuesof numerical abundance during day and nighttimesamplings (Fig. 7).
Statistical analysis
The similarity analysis (SIMPER) indicated whichspecies contributed most to the differences detectedbetween samples (day/night and depth intervals) (Table3). These species were: Limacina inflata at nighttime atall depth intervals, particularly at the deepest layer 75-100 m (50.7%); L. trochiformis at daytime, mostly in the50-75 m layer, followed by Creseis acicula f. clava at 0-25 m.
The general cluster analysis revealed four groups.These are characterized by the species composition andabundance, depth intervals, and day/night variation. Thereis no consistent relation with the location of the samplingstations (Fig. 8). Group I clustered daytime samples fromthe 0-75 m depth range, with the highest abundance ofLimacina trochiformis and Creseis acicula f. clava.Group II included night samples from the same depthlayers as in Group I, but with the highest abundances ofL. inflata. Group III comprised nighttime samples inwhich L. inflata, L. trochiformis, and Cuvierinacolumnella atlantica occurred as the most abundantspecies. Group IV clustered daytime samples from thedeepest layers (50-75, 75-100 m), also with L. inflata, L.trochiformis, and C. acicula f. clava as the most abundantspecies. The horizontal distribution of these groups inthe surveyed area is presented in Fig. 8. The clusteranalysis of the integrated nighttime abundance in the threesectors of the surveyed area (northern, central, southern)revealed three groups (Fig. 9). Group 1 clustered sampleswith the highest abundance of Limacina trochiformis.Group 2 with the highest abundances of L. inflata, L.trochiformis, and Creseis acicula f. clava. In Group 3 L.inflata and L. trochiformis occurred as the most abundantspecies. No consistent pattern was detected in thehorizontal distribution of these clusters
The ANOSIM test showed that the day/night speciescomposition differed significantly (global R = 0.32; P <0.01%). The major difference was found between nightand daytime groups of samples at the extreme depthintervals sampled: 75-100 and 0-25 m. No significantdifferences were found between intermediate depthintervals of the same type of samples (day or night),except between 50-75 m and the surface (0-25 m) (Table4).
Parra-Flores & Gasca Pteropods of the Western Caribbean Sea 655

Figure 7
Horizontal distribution of the abundance (org. 1000 m-3) of the dominant species of thecosome pteropods at 0-50, 25-75 and0-75 m depth ranges; empty circles are daytime samples, black circles are nighttime samples. A) Cuvierina columnellaatlantica; B) Hyalocylis striata; C) Cavolinia uncinata f. uncinata D) Limacina helicina; E) Cavolinia inflexa f. inflexa;
F) Creseis acicula f. clava; G) Diacavolinia constricta; H) Creseis acicula f. acicula; I) Limacina inflata; J) Limacinatrochiformis. In figures I and J the group of stations on the southern sector of the surveyed area
was enlarged to show the abundance of these species with more detail
Distribución horizontal de la abundancia (org. 1000 m-3) de las especies dominantes de petrópodos tecosomados a intervalos de 0-50, 25-75 y 0-75 m de profundidad; los círculos vacíos son muestras diurnas, los círculos negros son muestras nocturnas.
A) Cuvierina columnella atlantica; B) Hyalocylis striata; C) Cavolinia uncinata f. uncinata; D) Limacina helicina;E) Cavolinia inflexa f. inflexa; F) Creseis acicula f. clava; G) Diacavolinia constricta; H) Creseis acicula f. acicula;
I) Limacina inflata; J) Limacina trochiformis. En las figuras I y J, el grupo de estaciones en el sector sur delárea de estudio fue ampliado para mostrar la abundancia de estas especies con mayor detalle
656 Revista de Biología Marina y Oceanografía Vol. 44, Nº3, 2009

Table 3
SIMPER analysis between groups in day and night time samples at each depth interval. Only the speciesthat contribute significantly to the community structure are shown
Análisis SIMPER entre grupos en muestras diurnas y nocturnas en cada intervalo de profundidad. Sólo semuestran las especies que contribuyen de manera significativa a la estructura de la comunidad
Figure 8
Horizontal distribution of clusters (I-IV) resulting fromthe ANOSIM (Bray-Curtis). The groups of stations onthe central and southern sectors of the surveyed areawere enlarged to show these data with more detail.Group I: daytime and nithttime samples in 50-75
and 75-100 m. Group II: daytime samples in 25-50and 50-75 m. Group III: Nighttime and daytimesamples in the four depth intervals, and Group
IV, daytime samples at 50-75 and 75-100 m
Distribución horizontal de los grupos (I-IV) resultantes delANOSIM (Bray-Curtis). El grupo de estaciones de lossectores central y sur se ampliaron para mostrar estosdatos con mayor detalle. Grupo I: muestras diurnas y
nocturnas a 50-75 y 75-100 m. Grupo II: muestrasdiurnas a 25-50 y 50-75 m. Grupo III: muestrasdiurnas y nocturnas de los cuatro intervalos de
profundidad, y Grupo IV, muestrasdiurnas a 50-75 y 75-100 m
Parra-Flores & Gasca Pteropods of the Western Caribbean Sea 657

Figure 9
NMDS showing horizontal distribution of clusters (northern, central, southern sectors) resulting from the ANOSIM(Bray-Curtis) analysis using the integrated vertical abundance data of nighttime samples
NMDS que muestra la distribución horizontal de los grupos (sectores norte, central y sur) a partir del análisis de ANOSIM(Bray-Curtis) usando los datos integrados de abundancia vertical en muestras nocturnas
DiscussionThe number of taxa of thecosome pteropods hithertorecorded from the entire Northwestern Atlantic is closeto 52 (Suárez-Morales 1994, Suárez-Morales & Gasca1998 and references therein). In the two largest basins ofthis region, the Gulf of Mexico and the Caribbean,Suárez-Morales (1994) listed 40 species. Haagensen(1976) recorded 46 taxa from the central and easternsectors of the Caribbean Basin and Suárez-Morales &Gasca (1998) recorded 17 in surface waters of the westernCaribbean. The 36 taxa recorded in this survey representan important addition to the knowledge of the group inthis zone of the Caribbean Basin. Several speciesrepresent new records in the western Caribbean (Table1); some species of Diacavolinia listed in Table 1 werepreviously reported generically as Cavolinia longirostris(Van der Spoel et al. 1993, Van der Spoel et al. 1997).Overall, these new records increase from 17 to 36 thenumber of species of pteropods recorded in the westernCaribbean.
The group of the most abundant pteropod taxa in thearea included Limacina inflata, L. trochiformis, Creseisacicula f. clava, Hyalocylis striata, Cuvierina columnella
atlantica, and Cavolinia uncinata f. uncinata; theseresults largely agree with those by Haagensen (1976) fromother areas of the Caribbean Sea. During February 1991,Suárez-Morales & Gasca (1998) recorded both speciesof Limacina as the most abundant in the same area,followed by C. longirostris and C. acicula f. acicula. Inthe Gulf of Mexico Suárez-Morales & Gasca (1992)found C. acicula f. acicula, L. inflata, and L. trochiformisas the commonest species. These data confirm the generalaffinity between the zooplankton of the Gulf of Mexicoand the Caribbean Sea, but the abundance and dominanceof these species is different in each basin, as reportedalso in other zooplankton taxa (Gasca 1997).
Creseis acicula, L. trochiformis, and L. inflata havebeen recorded also with high winter densities in othergeographic areas; local increases of their abundance havebeen related to tropical conditions (Chen & Hillman 1970,Suárez-Morales & Gasca 1998, Mohan et al. 2006, Zhaoli& Chunju 2006). Most of the pteropod taxa locallyrecorded as abundant are warm water forms (McGowan1960, Van der Spoel & Boltovskoy 1981, Resgalia &Montú 1994, Batistic 2004). Limacina helicina isregarded as a temperate-cold water species (Chen & Bé1964), it probably occurs in deeper waters of the tropics.
658 Revista de Biología Marina y Oceanografía Vol. 44, Nº3, 2009
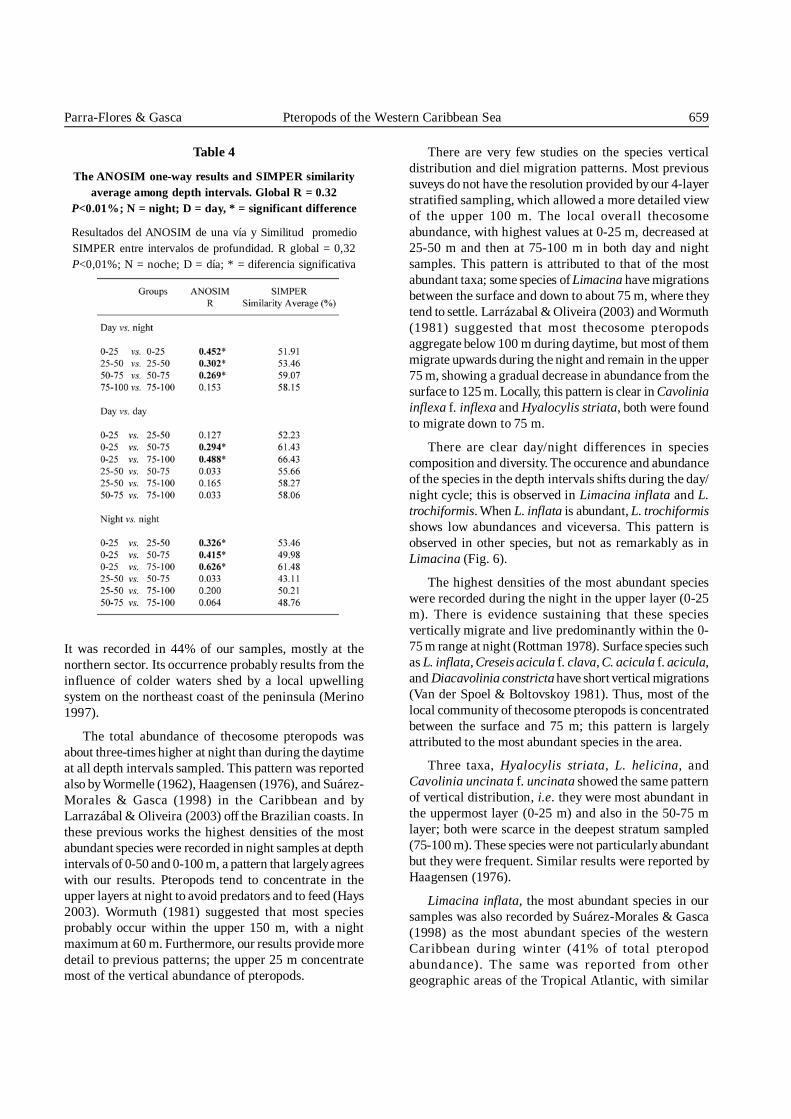
Table 4
The ANOSIM one-way results and SIMPER similarityaverage among depth intervals. Global R = 0.32
P<0.01%; N = night; D = day, * = significant difference
Resultados del ANOSIM de una vía y Similitud promedioSIMPER entre intervalos de profundidad. R global = 0,32P<0,01%; N = noche; D = día; * = diferencia significativa
It was recorded in 44% of our samples, mostly at thenorthern sector. Its occurrence probably results from theinfluence of colder waters shed by a local upwellingsystem on the northeast coast of the peninsula (Merino1997).
The total abundance of thecosome pteropods wasabout three-times higher at night than during the daytimeat all depth intervals sampled. This pattern was reportedalso by Wormelle (1962), Haagensen (1976), and Suárez-Morales & Gasca (1998) in the Caribbean and byLarrazábal & Oliveira (2003) off the Brazilian coasts. Inthese previous works the highest densities of the mostabundant species were recorded in night samples at depthintervals of 0-50 and 0-100 m, a pattern that largely agreeswith our results. Pteropods tend to concentrate in theupper layers at night to avoid predators and to feed (Hays2003). Wormuth (1981) suggested that most speciesprobably occur within the upper 150 m, with a nightmaximum at 60 m. Furthermore, our results provide moredetail to previous patterns; the upper 25 m concentratemost of the vertical abundance of pteropods.
There are very few studies on the species verticaldistribution and diel migration patterns. Most previoussuveys do not have the resolution provided by our 4-layerstratified sampling, which allowed a more detailed viewof the upper 100 m. The local overall thecosomeabundance, with highest values at 0-25 m, decreased at25-50 m and then at 75-100 m in both day and nightsamples. This pattern is attributed to that of the mostabundant taxa; some species of Limacina have migrationsbetween the surface and down to about 75 m, where theytend to settle. Larrázabal & Oliveira (2003) and Wormuth(1981) suggested that most thecosome pteropodsaggregate below 100 m during daytime, but most of themmigrate upwards during the night and remain in the upper75 m, showing a gradual decrease in abundance from thesurface to 125 m. Locally, this pattern is clear in Cavoliniainflexa f. inflexa and Hyalocylis striata, both were foundto migrate down to 75 m.
There are clear day/night differences in speciescomposition and diversity. The occurence and abundanceof the species in the depth intervals shifts during the day/night cycle; this is observed in Limacina inflata and L.trochiformis. When L. inflata is abundant, L. trochiformisshows low abundances and viceversa. This pattern isobserved in other species, but not as remarkably as inLimacina (Fig. 6).
The highest densities of the most abundant specieswere recorded during the night in the upper layer (0-25m). There is evidence sustaining that these speciesvertically migrate and live predominantly within the 0-75 m range at night (Rottman 1978). Surface species suchas L. inflata, Creseis acicula f. clava, C. acicula f. acicula,and Diacavolinia constricta have short vertical migrations(Van der Spoel & Boltovskoy 1981). Thus, most of thelocal community of thecosome pteropods is concentratedbetween the surface and 75 m; this pattern is largelyattributed to the most abundant species in the area.
Three taxa, Hyalocylis striata, L. helicina, andCavolinia uncinata f. uncinata showed the same patternof vertical distribution, i.e. they were most abundant inthe uppermost layer (0-25 m) and also in the 50-75 mlayer; both were scarce in the deepest stratum sampled(75-100 m). These species were not particularly abundantbut they were frequent. Similar results were reported byHaagensen (1976).
Limacina inflata, the most abundant species in oursamples was also recorded by Suárez-Morales & Gasca(1998) as the most abundant species of the westernCaribbean during winter (41% of total pteropodabundance). The same was reported from othergeographic areas of the Tropical Atlantic, with similar
Parra-Flores & Gasca Pteropods of the Western Caribbean Sea 659

relative abundances (Bé & Gilmer 1977, Wormuth 1981).In a Caribbean embayment, L. inflata is regarded as rare(Gasca & Suárez-Morales 1992), showing that it candwell in inner coastal environments.
Van der Spoel & Boltovskoy (1981) reportedCuvierina columnella atlantica as rare; in this study ithas a moderate frequency. It was most abundant at nightand its vertical distribution was homogeneous, thusagreeing with the results by Chen and Bé (1964) in theNorth Atlantic. Both Creseis acicula f. clava and C.acicula f. acicula are regarded as dominant in theCaribbean Sea in the 0-100 m layer. Haagensen (1976)recorded up to 90% of the adults of these species above65 m in the Caribbean. In this study 90% of the specimensof these species occurred above 75 m. Tesh (1946),Wormelle (1962), and Chan & Hsueh (2005) reportedsimilar observations from other geographical areas.Locally, Creseis virgula f. conica showed the samepattern.
A contrasting general pattern was found in species ofthe Pseudothecosomata, in general larger, strongerswimmers, such as Gleba cordata, Desmopterus papilio,and Corolla ovata. These forms are known to dwell indeeper layers (> 200 m) during the day and migrate tothe surface at night. In our samples these species wereconsistently recorded with a higher frequency andabundance at nighttime. Data in reference topseudothecosome pteropods could be incomplete in someinstances because they can evade the plankton nets; thus,their abundance may be underestimated by conventionalsampling (Lalli & Gilmer 1989, Cummings & Seapy2003).
Multivariate analysis detected day/night differencesin the local community of thecosome pteropods. Groupswere sorted mainly on diversity, depth, and day/nightsampling. The results from this analysis is consistent withthe values from the R dissimilarity (ANOSIM), whichindicated a significant difference between the samplescollected during the day at 75-100 m with respect to thesurface samples (0-25 m), these stations correspond toclusters I and III, respectively. The largest R differencewas detected between night samples at 75-100 m (groupI and III) and night samples at 0-25 m (group III). Theseresults suggest that the abundance of species variesdepending on day or night and might be related to thevertical migration that characterized this group ofzooplankton.
The failure to find significant differences among thedepth intervals is probably an effect of many pteropodspecies migrating to depths below 100 m. It is likely thatsamples from deeper layers will bring up species whose
lowest migratory range ends below the 100 m and alsothose dwelling in mesopelagic depths. The results ofmigration studies are difficult to compare because of theuse of different types of collecting gear in differentlocalities and seasons. However, some species show areduced vertical range over a 24-hour period, whereasothers, such as L. inflata, may migrate several hundredmeters each day (Haagensen 1976).
According to Wormuth (1981), the variability in thevertical structure of the thecosome pteropods is probablyrelated to environmental conditions. In this survey wefound little structure in both the temperature and salinityvertical profiles, thus suggesting that this hydrographicfactor is not the most important in determining the verticaldistribution of the pteropod species. Also, the mixedpattern shown by the horizontal distribution of thedifferent clusters resulting from our analysis (Fig. 8)suggests that the local community of thecosome pteropodsis largely homogeneous. We found no evidence ofhydrographic variation that suggests a consistenthorizontal distribution pattern.
Distributional studies had recognized that certainspecies are restricted to a narrow range of environmentalconditions that can be defined in terms of combinationsof temperature salinity, depth, or biotic factors. Ourresults show the influence of both the vertical migrationand day/night cycles in the structure of the local pteropodcommunity; however, a detailed hydrographic analysisof the water column at greater depths is needed to fullyexplain these processes. Also, other environmentalparameters such as chlorophyll, nutrients, oxygenconcentration, and phytoplankton cell counts couldprovide additional data to explain the processes involvedin the patterns of vertical and horizontal distribution ofthe pteropods in this tropical area.
AcknowledgmentsWe thank the captain and crew of the research vessel'Gordon Gunter' (NOAA-SEFSC) for assistance duringthe collection of samples. Lourdes Vásquez-Yeomans andJohn Lamkin kindly allowed us to participate in theproject ‘Larval fish and physical oceanography surveyof the Mesoamerican reef system’, supported by theNOAA-SEFSC. This contribution is part of the thesisrequirements of the first author in the ECOSUR post-graduate program. Additional support was received fromCONACYT through a scholarship granted to one of us(AP-F). We also acknowledge the comments from E.Suárez-Morales (ECOSUR) and the anonymousreviewers on an earlier version of this contribution. IvánCastellanos helped in editing the figures.
660 Revista de Biología Marina y Oceanografía Vol. 44, Nº3, 2009
Literature citedAngel MV & PR Pugh. 2000. Quantification of diel vertical
migration by micronektonic taxa in the northeast Atlantic.Hydrobiologia 440: 161-179.
Batistic M, F Krsinic, N Jasprica, M Caric, D Vilicic & DLucic. 2004. Gelatinous invertebrate zooplankton of theSouth Adriatic: species composition and verticaldistribution. Journal of Plankton Research 26: 459-474.
Bé AW & WA Gilmer. 1977. A zoogeographic and taxonomicreview of Euthecosomatous Pteropoda. En: Ramsay AT (ed).Oceanic micropaleontology, pp. 733-808. Academic Press,London.
Chan CY & PW Hsueh. 2005. Species composition andseasonal abundance of pteropods (Mollusca: Gastropoda)in nearshore shallow waters of Northwestern Taiwan.Journal of the Fisheries Society of Taiwan 32: 311-316.
Chen C & AW Bé. 1964 . A seasonal distribution ofthecosomatous pteropods in the surface water of fivestations in western north Atlantic. Bulletin of MarineScience of the Gulf and Caribbean 14: 185-220.
Chen C & N Hillman. 1970. Shell-bearing pteropods asindicators of water masses off cape Hatteras, NorthCarolina. Bulletin of Marine Science of the Gulf andCaribbean 20: 350-367.
Clarke KR & RM Warwick. 2001 . Change in marinecommunities: an approach to statistical analysis andinterpretation, 141 pp. PRIMER-E, Plymouth.
Cummings FA & RR Seapy. 2003. Seasonal abundances ofeuthecosomatous pteropods and heteropods from watersoverlying San Pedro Basin, California. The Veliger 46: 305-313.
Gallegos A & S Czitrom. 1997. Aspectos de la oceanografíaregional del Mar Caribe. In: Lavín M (ed). Contribucionesa la Oceanografía Física en México, Monografía 3, pp. 225-242. Unión Geofísica Mexicana, México.
Gasca R. 1997. Sifonóforos (Cnidaria: Hydrozoa) del MarCaribe mexicano. Hidrobiológica 7: 51-57.
Gasca R & E Suárez-Morales. 1992. Pterópodos (Mollusca:Gastropoda; Thecosomata) de la Bahía de la Ascensión,Reserva de la Biosfera de Sian Ka’an, Quintana Roo,México. En: Navarro D & E Suárez-Morales (eds).Diversidad biológica en la Reserva de la Biosfera de SianKa’an Quintana Roo, pp. 115-121. CIQRO/ SEDESOL,México.
Haagensen DA. 1976. Part II. The Thecosomata. In: MichelHB & M Foyo (eds). Caribbean zooplankton, pp. 551-712.Office of Naval Research, Department of the Navy,Washington.
Hays GC. 2003. A review of the adaptive significance andecosystem consequences of zooplankton diel verticalmigrations. Hydrobiologia 503: 163-170.
Lalli MC & RW Gilmer. 1989. Pelagic snails: The biology ofholoplanktonic gastropod mollusks, 259 pp. Stanford
University Press, California.Larrazábal ME & VS Oliveira. 2003 . Thecosomata e
Gymnosomata (Mollusca, Gastropoda) da cadeina Fernandode Noronha, Brasil. Revista Brasileira de Zoología 20: 351-360.
Merino M. 1986. Aspectos de la circulación costera superficialdel Caribe Mexicano con base en observaciones utilizandotarjetas de deriva. Anales del Instituto de Ciencias del Mary Limnología, Universidad Nacional Autónoma de México13: 31-46.
Merino M. 1997 . Upwelling on the Yucatan Shelf:hydrographic evidence. Journal of Marine Systems 13: 101-121.
Mohan R, K Verma, LP Mergulhao, DK Sinha, S Shanvas& MV Guptha. 2006. Seasonal variation of pteropods fromthe Western Arabian Sea sediment trap. Geo-Mar 26: 265-273.
Mooers CNK & G Maul. 1998. Intra-Americas sea circulation.In: Robinson AR & KH Brink (eds). The Sea 11: 183-208,John Wiley & Sons, New York.
Resgalia C & M Montú. 1994. Distribuçao espacial e temporalde Pteropoda Euthecosomata (Mollusca, Gastropoda) naplataforma do Sul do Brasil. Atlântica 16: 99-123.
Rottman ML. 1978. Ecology of recurrent groups of pteropods,euphausiids, and chaetognaths in the Gulf of Thailand andthe South China Sea. Marine Biology 48: 63-78.
Suárez-Morales E. 1994. Distribución de los pterópodos(Gastropoda: Thecosomata y Pseudothecosomata) en elGolfo de México y zonas adyacentes. Revista de BiologíaTropical 42: 523-530.
Suárez-Morales E & R Gasca. 1992. Pterópodos (Gastropoda:Thecosomata y Pseudothecosomata) de aguas superficiales(0-50m) del sur del Golfo de México. Anales del Institutode Ciencias del Mar y Limnología, Universidad NacionalAutónoma de México 19: 201-209.
Suárez-Morales E & R Gasca. 1998. Thecosome pteropod(Gastropoda) assemblages of the Mexican Caribbean Sea(1991). Nautilus 112: 43-51.
Tesh JJ. 1946. The Thecosomatous Pteropods: I. The Atlantic.Dana Report 28: 1-82.
Van der Spoel S. 1967 . Euthecosomata, a group withremarkable developmental stages (Gastropoda, Pteropoda),375 pp. J. Noorduijn.en Zoon NV, Gorinchem. [Ph.D.Thesis, University of Amsterdam]
Van der Spoel S. 1996. Pteropoda. In: Gasca R & E Suárez-Morales (eds). Introducción al estudio del zooplanctonmarino, pp. 459-528. ECOSUR/CONACYT, México.
Van der Spoel S & D Boltovskoy. 1981 . Pteropoda. In:Boltovskoy D (ed). Atlas del zooplancton del Atlánticosudoccidental y métodos de trabajo con el zooplanctonmarino, pp. 493-531. Publicación Especial, InstitutoNacional de Investigación y Desarrollo Pesquero, Mar delPlata.
Parra-Flores & Gasca Pteropods of the Western Caribbean Sea 661

Van der Spoel S & JR Dadon. 1999. Pteropoda. In: BoltovskoyD (ed). South Atlantic zooplankton, pp. 649-706. BackhuysPublishers, Leiden.
Van der Spoel S, J Bleeker & H Kobayashi. 1993. FromCavolinia longirostris to twenty-four Diacavolinia taxa,with a phylogenetic discussion (Mollusca, Gastropoda).Bijdragen tot de Dierkunde 62: 127-166.
Van der Spoel S, L Newman & KW Estep. 1997. Pelagicmolluscs of the world. World Biodiversity Database, CD-ROM Series. Amsterdam: Expert Center for TaxonornicIdentification (ETI). [CD-ROM].
Wormelle RL 1962. A study of distribution of the pteropodsof the Florida Current. Bulletin of Marine Science of theGulf and Caribbean 12: 95-136.
Wormuth JH. 1981. Vertical distributions and diel migrationsof Euthecosomata in the northwest Sargasso Sea. Deep-Sea Research A 28: 1493-1515.
Zhaoli X & L Chunju. 2006. Study on abundance variation ofpteropods in the East China Sea. Acta Oceanologica Sinica25: 100-107.
Recibido el 24 de junio de 2009 y aceptado el 7 de septiembre de 2009
662 Revista de Biología Marina y Oceanografía Vol. 44, Nº3, 2009