Distribution of PAHs among Sediment Size Fractions...
24
1 Distribution of PAHs among Sediment Size Fractions Determined by Thermal Desorption Gas Chromatography Mass Spectrometry Jejal Reddy Bathi 1 , Robert Pitt 1 , Robert Findlay 2 , Shirley E. Clark 3 1 Department of Civil, Construction and Environmental Engineering University of Alabama, Tuscaloosa, AL 35487 2 Department of Biological Sciences, University of Alabama Tuscaloosa, AL 35487 3 Penn State - Harrisburg, School of Science, Engineering and Technology, Middleton, PA - 17507
Transcript of Distribution of PAHs among Sediment Size Fractions...

1
Distribution of PAHs among Sediment Size
Fractions Determined by Thermal Desorption
Gas Chromatography Mass Spectrometry
Jejal Reddy Bathi1, Robert Pitt1, Robert Findlay2,
Shirley E. Clark3
1Department of Civil, Construction and Environmental Engineering
University of Alabama, Tuscaloosa, AL 35487 2Department of Biological Sciences, University of Alabama
Tuscaloosa, AL 35487 3Penn State - Harrisburg, School of Science, Engineering and
Technology, Middleton, PA - 17507

2
Overview of Presentation
Introduction
Thermal Desorption (TD) Method
Development
Sample Collection and Analyses
Conclusions
Question and Answers

3
Introduction
Steps for PAH analyses
Sample preparation
Extraction and Concentration
Detection and Quantification
Liquid-liquid extraction by separatory funnel and Solid Phase Extraction (SPE) are the most common PAH extraction methods for liquid samples.
SPE method is ineffective for liquid samples with high concentrations of solids.
4
Introduction
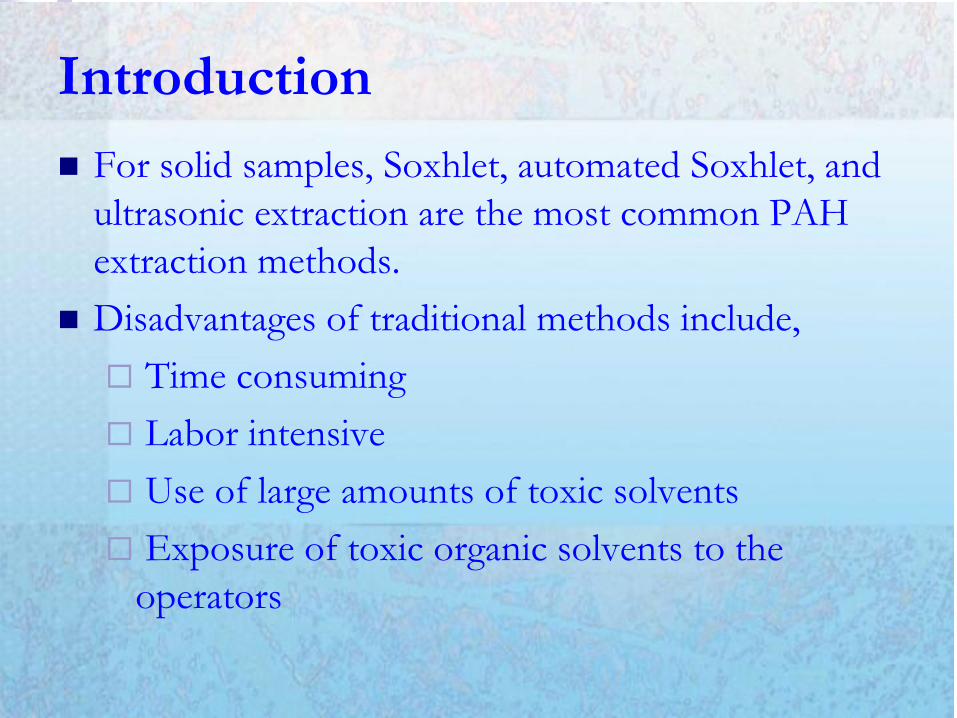
For solid samples, Soxhlet, automated Soxhlet, and
ultrasonic extraction are the most common PAH
extraction methods.
Disadvantages of traditional methods include,
Time consuming
Labor intensive
Use of large amounts of toxic solvents
Exposure of toxic organic solvents to the
operators

5
Introduction - Fugacity Modeling Contaminant partition constants (KOW, KOC, Henry’s constant) are
key factors in their fate.
Fugacity Level I equilibrium model (Mackay et al. 1992) was used for predicting the phase partitioning of PAHs. The following graph illustrates the effect of KOW and KOC on partitioning onto solids.
0
20
40
60
80
100
2 2.5 3 3.5 4 4.5 5 5.5 6 6.5 7 7.5
Log (Kow), Log (Koc)
% o
f P
AH
wit
h S
olid
s
Log (Kow) Log (Koc)

6
After Hurricane Katrina, and other
devastating hurricanes of the 2005 season,
EPA reviewed several monitoring and
cleanup programs in the days following the
events. The selection of the right analytical
and sampling methods for water and
sediment were all found to be very critical
in reducing the risk to the cleanup crews,
emergency workers, and residents.
Katrina oil refinery damage (EPA photo) Waste sorting area with field labs (EPA photo)
Fuel and other material leakage from damaged boats. Hurricane Katrina (NOAA photo)

7
Analytical Method Development
The main transport mechanisms and fate of PAHs in the aquatic environment are closely related to their major associations with particles. Therefore, it is essential that rapid and sensitive analytical tools be used that can measure PAHs in samples having large amounts of suspended sediment.
During the aftermath of natural disasters, homeland security incidents, and accidental releases of hazardous and toxic materials, the rapid analyses of samples is needed to identify areas for priority cleanup and in preventing dangerous exposures to cleanup personnel and residents.
Analytical tools need to be developed and tested on a variety of samples to ensure their applicability to a wide range of emergency situations.
With these objectives in mind, a TD-based GC/MSD method was developed and tested using urban stream sediments for PAH contamination.
8
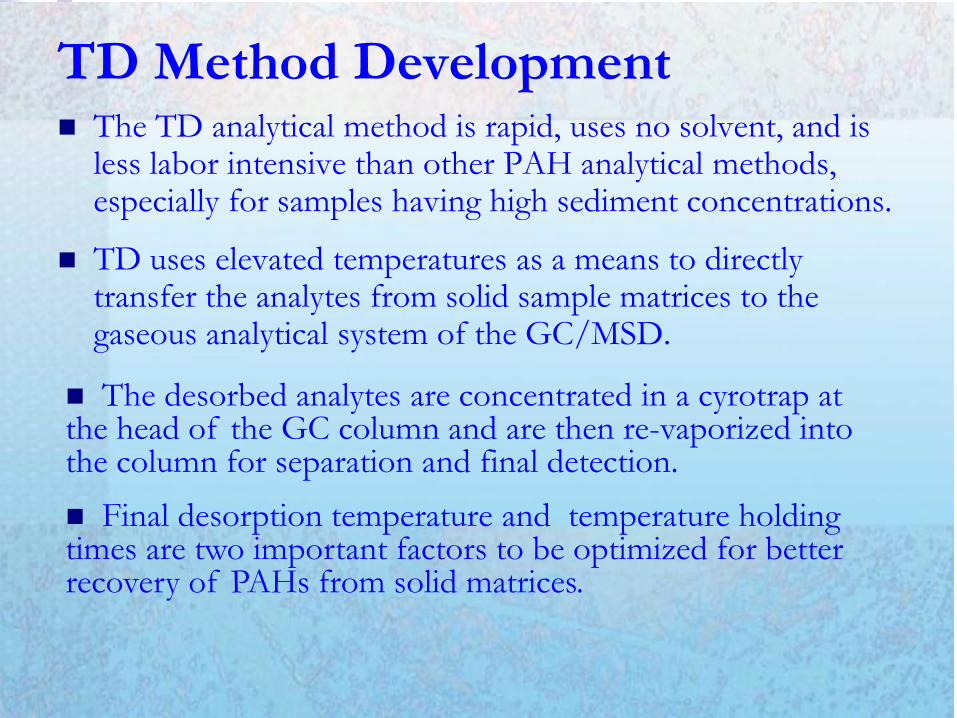
TD Method Development The TD analytical method is rapid, uses no solvent, and is
less labor intensive than other PAH analytical methods, especially for samples having high sediment concentrations.
TD uses elevated temperatures as a means to directly transfer the analytes from solid sample matrices to the gaseous analytical system of the GC/MSD.
The desorbed analytes are concentrated in a cyrotrap at the head of the GC column and are then re-vaporized into the column for separation and final detection.
Final desorption temperature and temperature holding times are two important factors to be optimized for better recovery of PAHs from solid matrices.

9
Direct thermal extraction and
analysis technique
SIS Thermal desorption unit

10
TD Method Development A desorption temperature of 350oC produced the largest
peak areas for the individual PAHs, for the tested range of
temperatures 250oC to 375oC with 25°C step changes.
A final temperature holding time of 15 min produced
maximum peak areas for the individual PAHs in the
resulting chromatograms.
11
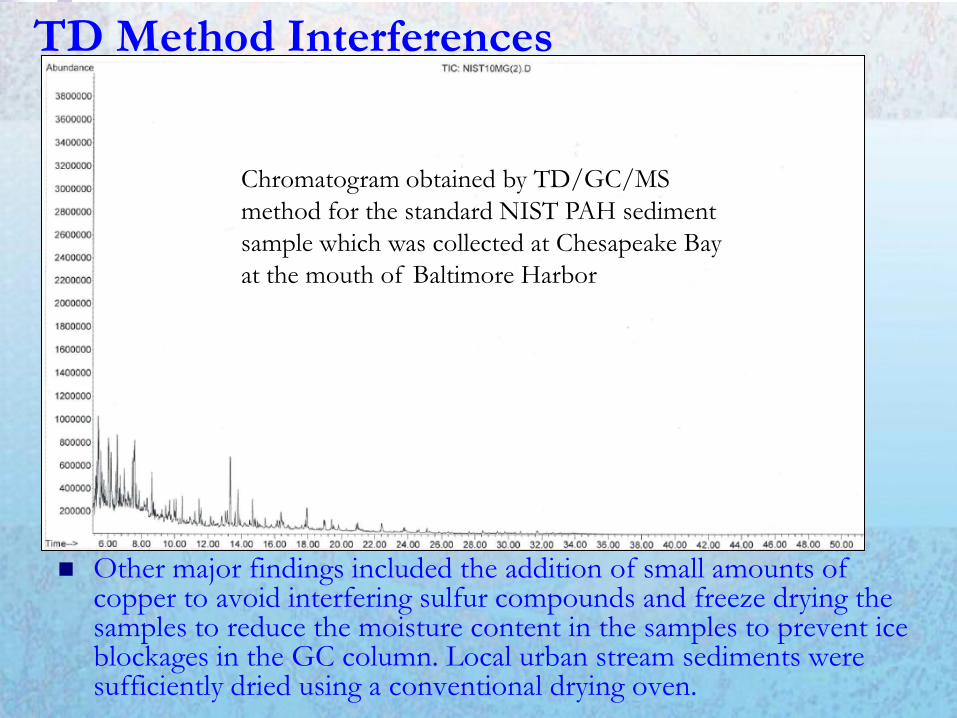
TD Method Interferences
Other major findings included the addition of small amounts of copper to avoid interfering sulfur compounds and freeze drying the samples to reduce the moisture content in the samples to prevent ice blockages in the GC column. Local urban stream sediments were sufficiently dried using a conventional drying oven.
Chromatogram obtained by TD/GC/MS
method for the standard NIST PAH sediment
sample which was collected at Chesapeake Bay
at the mouth of Baltimore Harbor
12
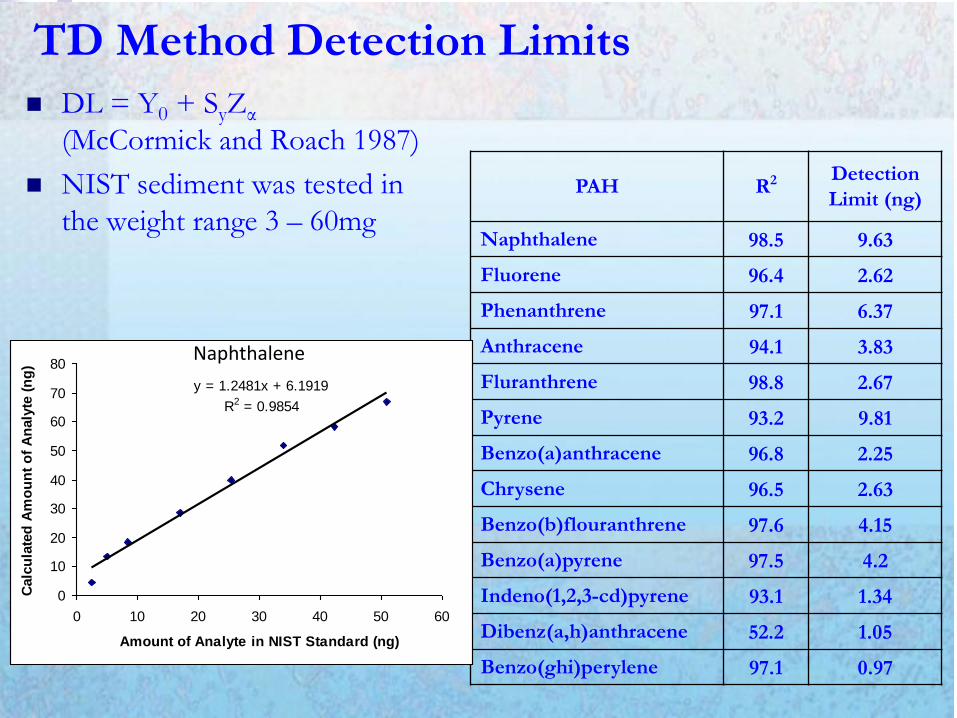
TD Method Detection Limits
DL = Y0 + SyZα
(McCormick and Roach 1987)
NIST sediment was tested in
the weight range 3 – 60mg
PAH R2 Detection
Limit (ng)
Naphthalene 98.5 9.63
Fluorene 96.4 2.62
Phenanthrene 97.1 6.37
Anthracene 94.1 3.83
Fluranthrene 98.8 2.67
Pyrene 93.2 9.81
Benzo(a)anthracene 96.8 2.25
Chrysene 96.5 2.63
Benzo(b)flouranthrene 97.6 4.15
Benzo(a)pyrene 97.5 4.2
Indeno(1,2,3-cd)pyrene 93.1 1.34
Dibenz(a,h)anthracene 52.2 1.05
Benzo(ghi)perylene 97.1 0.97
y = 1.2481x + 6.1919
R2 = 0.9854
0
10
20
30
40
50
60
70
80
0 10 20 30 40 50 60
Amount of Analyte in NIST Standard (ng)
Calc
ula
ted
Am
ou
nt
of
An
aly
te (
ng
)
Naphthalene

13
TD Method Recovery Calculations
PAH
% Recovery
from Solid
Samples
Acceptable Range of %
Recovery from EPA
Methods (Aqueous
Samples)
Acceptable Range of %
Recovery from Standard
Methods (Aqueous
Samples)
Naphthalene 125 D – 122 21 – 133
Fluorene 142 D – 142 59 – 121
Phenanthrene 110 D – 155 54 -120
Anthracene 104 NG NG
Fluranthrene 62 14 – 123 26 – 137
Pyrene 33 D – 140 52 – 115
Benzo(a)anthracene 109 33 – 143 33 – 143
Chrysene 140 17 – 168 17 – 168
Benzo(b)flouranthrene 35 24 – 159 24 – 159
Benzo(a)pyrene 41 17 – 163 17 – 163
Indeno(1,2,3-cd)pyrene 34
NG NG
Dibenz(a,h)anthracene 46 NG NG
Benzo(ghi)perylene 43 NG NG
14
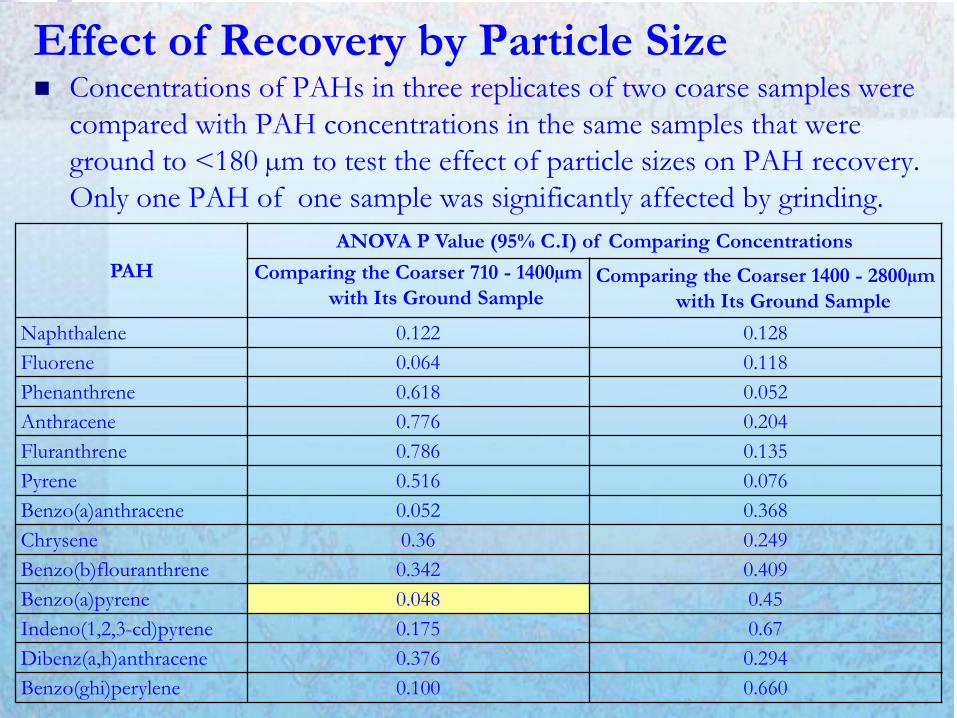
Effect of Recovery by Particle Size Concentrations of PAHs in three replicates of two coarse samples were
compared with PAH concentrations in the same samples that were
ground to <180 µm to test the effect of particle sizes on PAH recovery.
Only one PAH of one sample was significantly affected by grinding.
PAH
ANOVA P Value (95% C.I) of Comparing Concentrations
Comparing the Coarser 710 - 1400µm
with Its Ground Sample Comparing the Coarser 1400 - 2800µm
with Its Ground Sample
Naphthalene 0.122 0.128
Fluorene 0.064 0.118
Phenanthrene 0.618 0.052
Anthracene 0.776 0.204
Fluranthrene 0.786 0.135
Pyrene 0.516 0.076
Benzo(a)anthracene 0.052 0.368
Chrysene 0.36 0.249
Benzo(b)flouranthrene 0.342 0.409
Benzo(a)pyrene 0.048 0.45
Indeno(1,2,3-cd)pyrene 0.175 0.67
Dibenz(a,h)anthracene 0.376 0.294
Benzo(ghi)perylene 0.100 0.660
15
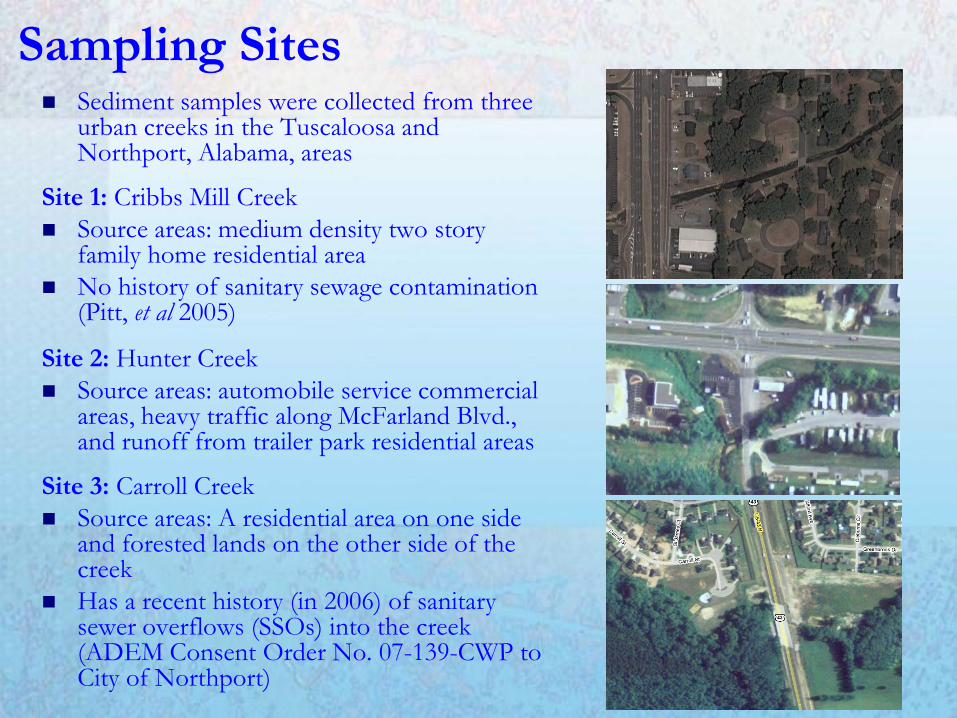
Sampling Sites
Sediment samples were collected from three urban creeks in the Tuscaloosa and Northport, Alabama, areas
Site 1: Cribbs Mill Creek
Source areas: medium density two story family home residential area
No history of sanitary sewage contamination (Pitt, et al 2005)
Site 2: Hunter Creek
Source areas: automobile service commercial areas, heavy traffic along McFarland Blvd., and runoff from trailer park residential areas
Site 3: Carroll Creek
Source areas: A residential area on one side and forested lands on the other side of the creek
Has a recent history (in 2006) of sanitary sewer overflows (SSOs) into the creek (ADEM Consent Order No. 07-139-CWP to City of Northport)

16
Sample Particle Size Distributions Five sediment samples were collected from each of the three
creeks.
All sediments were fractionated into nine size (µm) ranges <45,
45-90, 90-180, 180-355, 355-710, 710-1400, 1400-2800,
>2800(w/o large organic matter (LOM)) and > 2800 (LOM only).
0
10
20
30
40
50
60
70
80
90
100
10 100 1000 10000Size (um)
% L
ess t
han
Hunter Creek Cribbs Mill Creek Carroll's Creek
17
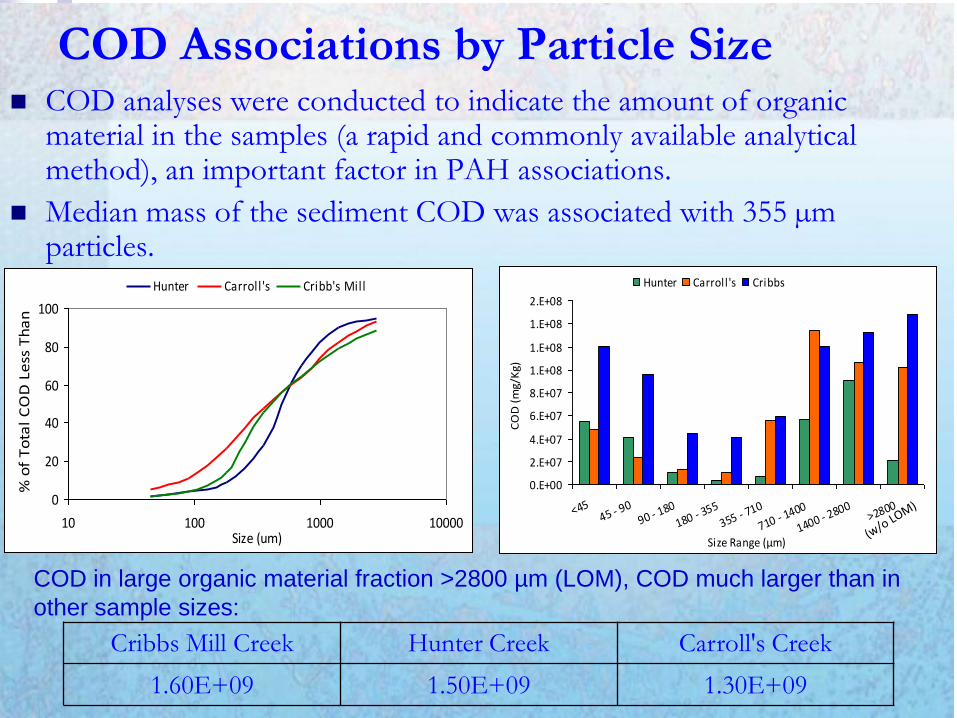
COD Associations by Particle Size COD analyses were conducted to indicate the amount of organic
material in the samples (a rapid and commonly available analytical method), an important factor in PAH associations.
Median mass of the sediment COD was associated with 355 µm particles.
0.E+00
2.E+07
4.E+07
6.E+07
8.E+07
1.E+08
1.E+08
1.E+08
2.E+08
<4545 - 9
090 - 1
80
180 - 355
355 - 710
710 - 1400
1400 - 2800
>2800
Size Range (µm)
CO
D (
mg/
Kg)
Hunter Carroll's Cribbs
0
20
40
60
80
100
10 100 1000 10000Size (um)
% o
f T
ota
l C
OD
Le
ss T
ha
n
Hunter Carroll 's Cribb's Mill
Cribbs Mill Creek Hunter Creek Carroll's Creek
1.60E+09 1.50E+09 1.30E+09
COD in large organic material fraction >2800 µm (LOM), COD much larger than in
other sample sizes:
18
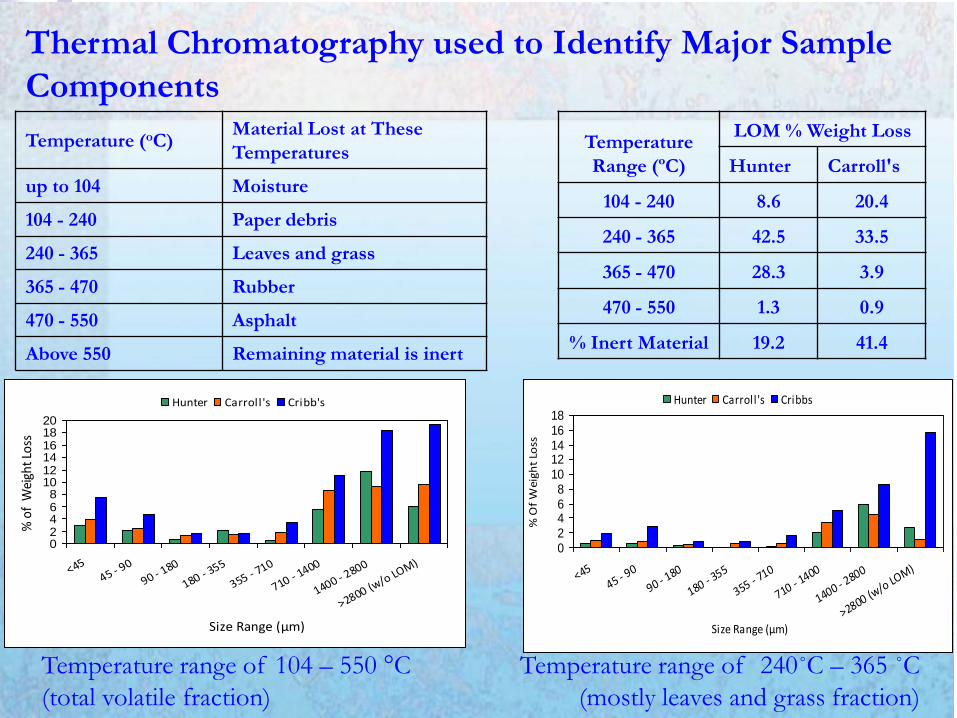
Thermal Chromatography used to Identify Major Sample
Components
Temperature range of 104 – 550 °C
(total volatile fraction)
Temperature range of 240˚C – 365 ˚C
(mostly leaves and grass fraction)
Temperature (oC) Material Lost at These
Temperatures
up to 104 Moisture
104 - 240 Paper debris
240 - 365 Leaves and grass
365 - 470 Rubber
470 - 550 Asphalt
Above 550 Remaining material is inert
Temperature
Range (ºC)
LOM % Weight Loss
Hunter Carroll's
104 - 240 8.6 20.4
240 - 365 42.5 33.5
365 - 470 28.3 3.9
470 - 550 1.3 0.9
% Inert Material 19.2 41.4
02468
101214161820
<4545 - 9
0
90 - 180
180 - 355
355 - 710
710 - 1400
1400 - 2800
>2800 (w/o LO
M)
Size Range (µm)
% o
f W
eigh
t Lo
ss
Hunter Carroll's Cribb's
02468
1012141618
<4545 - 9
0
90 - 180
180 - 355
355 - 710
710 - 1400
1400 - 2800
>2800 (w/o LO
M)
Size Range (µm)
% O
f W
eig
ht
Loss
Hunter Carroll's Cribbs
19
Log(y) = 1.1694Log(x) + 6.9732
R2 = 0.9393
3
5
7
9
0 0.5 1 1.5 2
Log(% Total Weight Loss)
Log(
COD
)
Log(y) = 1.0739Log(x) + 6.9425
R2 = 0.805
3
5
7
9
-0.5 0 0.5 1 1.5 2 2.5
Log(% Total Weight Loss)
Log(
COD
)
y = 5E+06x + 5E+07
R2 = 0.808
0.E+00
2.E+07
4.E+07
6.E+07
8.E+07
1.E+08
1.E+08
1.E+08
2.E+08
0 4 8 12 16 20 24
% Total Weight Loss
CO
D (
mg/
Kg)
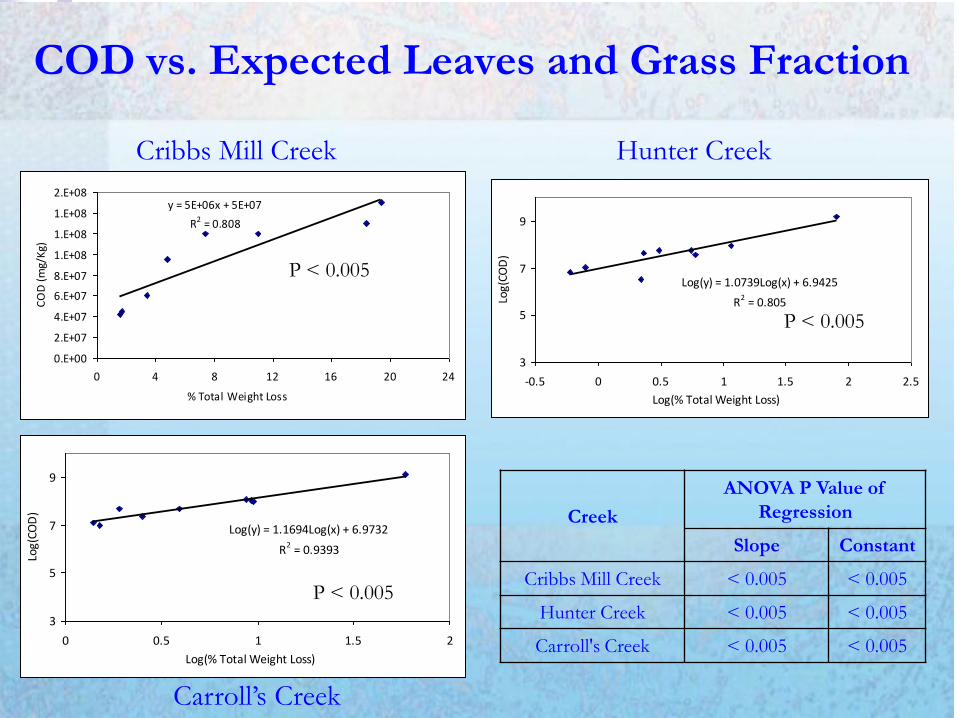
COD vs. Expected Leaves and Grass Fraction
Cribbs Mill Creek Hunter Creek
Carroll’s Creek
P < 0.005
P < 0.005
P < 0.005
Creek
ANOVA P Value of
Regression
Slope Constant
Cribbs Mill Creek < 0.005 < 0.005
Hunter Creek < 0.005 < 0.005
Carroll's Creek < 0.005 < 0.005
20
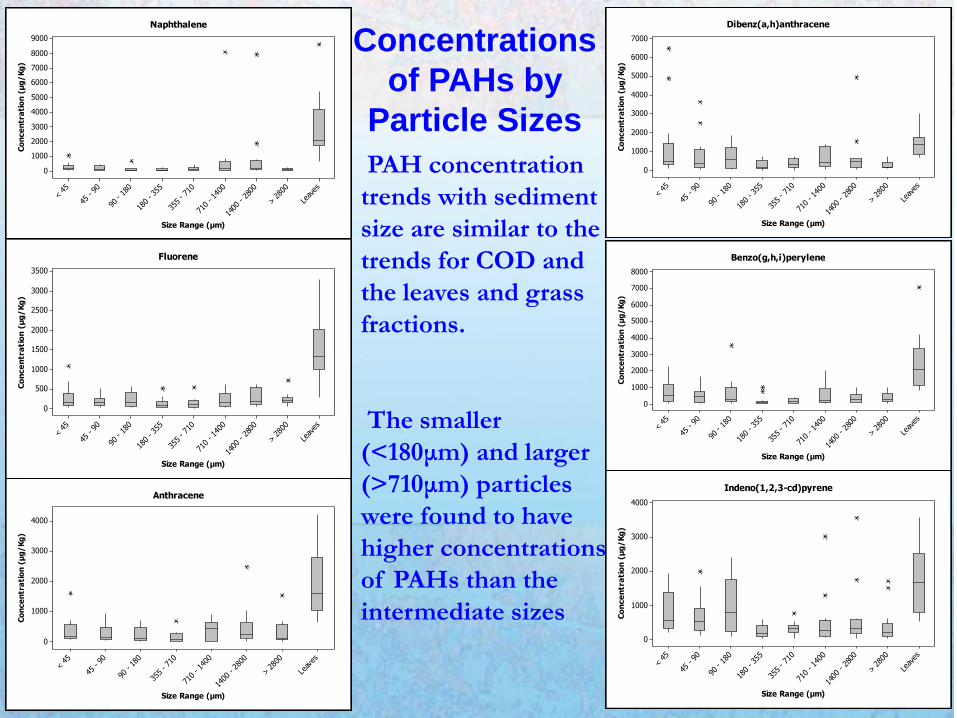
PAH concentration
trends with sediment
size are similar to the
trends for COD and
the leaves and grass
fractions.
The smaller
(<180μm) and larger
(>710μm) particles
were found to have
higher concentrations
of PAHs than the
intermediate sizes
Concentrations
of PAHs by
Particle Sizes
Leav
es
> 28
00
1400
- 28
00
710 - 1
400
355 - 7
10
180 - 3
55
90 -
180
45 -
90<
45
9000
8000
7000
6000
5000
4000
3000
2000
1000
0
Size Range (µm)
Co
nce
ntr
ati
on
(µ
g/
Kg
)Naphthalene
Leav
es
> 28
00
1400
- 28
00
710 - 1
400
355 - 7
10
180 - 3
55
90 -
180
45 -
90<
45
3500
3000
2500
2000
1500
1000
500
0
Size Range (µm)
Co
nce
ntr
ati
on
(µ
g/
Kg
)
Fluorene
Leav
es
> 28
00
1400
- 28
00
710 - 1
400
355 - 7
10
90 -
180
45 -
90<
45
4000
3000
2000
1000
0
Size Range (µm)
Co
nce
ntr
ati
on
(µ
g/
Kg
)
Anthracene
Leav
es
> 28
00
1400
- 28
00
710 - 1
400
355 - 7
10
180 - 3
55
90 -
180
45 -
90<
45
7000
6000
5000
4000
3000
2000
1000
0
Size Range (µm)
Co
nce
ntr
ati
on
(µ
g/
Kg
)
Dibenz(a,h)anthracene
Leav
es
> 28
00
1400
- 28
00
710 - 1
400
355 - 7
10
180 - 3
55
90 -
180
45 -
90<
45
8000
7000
6000
5000
4000
3000
2000
1000
0
Size Range (µm)
Co
nce
ntr
ati
on
(µ
g/
Kg
)
Benzo(g,h,i)perylene
Leav
es
> 28
00
1400
- 28
00
710 - 1
400
355 - 7
10
180 - 3
55
90 -
180
45 -
90<
45
4000
3000
2000
1000
0
Size Range (µm)
Co
nce
ntr
ati
on
(µ
g/
Kg
)
Indeno(1,2,3-cd)pyrene
21
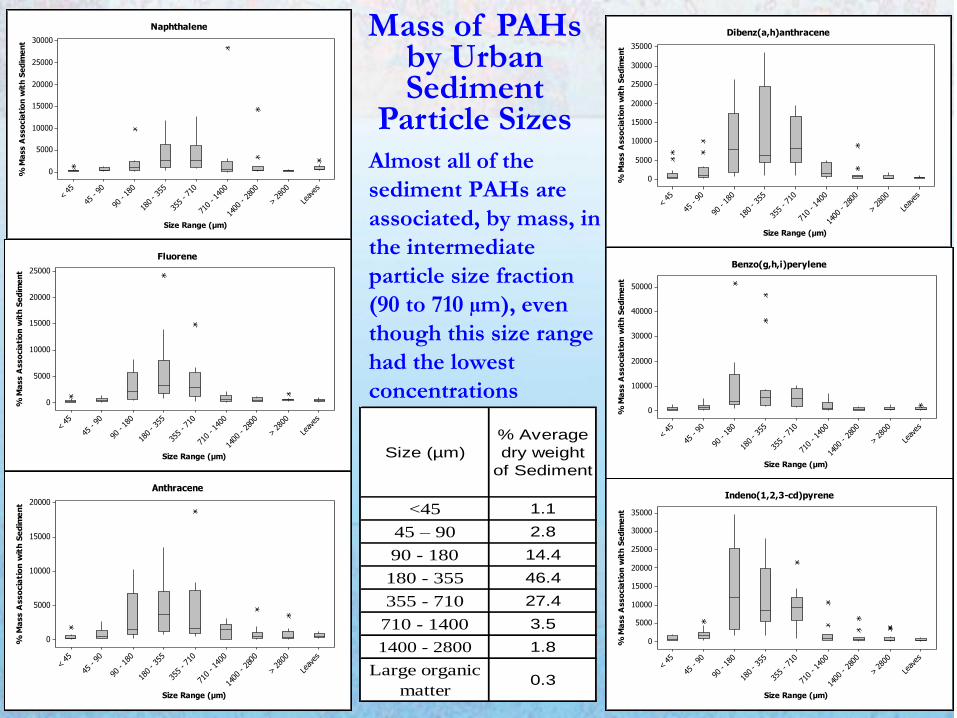
Almost all of the
sediment PAHs are
associated, by mass, in
the intermediate
particle size fraction
(90 to 710 µm), even
though this size range
had the lowest
concentrations
Size (µm)
% Average
dry weight
of Sediment
<45 1.1
45 – 90 2.8
90 - 180 14.4
180 - 355 46.4
355 - 710 27.4
710 - 1400 3.5
1400 - 2800 1.8
Large organic
matter0.3
Leav
es
> 28
00
1400
- 28
00
710 - 1
400
355 - 7
10
180 - 3
55
90 -
180
45 -
90<
45
30000
25000
20000
15000
10000
5000
0
Size Range (µm)
% M
ass A
sso
cia
tio
n w
ith
Se
dim
en
tNaphthalene
Leav
es
> 28
00
1400
- 28
00
710 - 1
400
355 - 7
10
180 - 3
55
90 -
180
45 -
90<
45
50000
40000
30000
20000
10000
0
Size Range (µm)
% M
ass A
sso
cia
tio
n w
ith
Se
dim
en
t
Benzo(g,h,i)perylene
Leav
es
> 28
00
1400
- 28
00
710 - 1
400
355 - 7
10
180 - 3
55
90 -
180
45 -
90<
45
35000
30000
25000
20000
15000
10000
5000
0
Size Range (µm)
% M
ass A
sso
cia
tio
n w
ith
Se
dim
en
t
Dibenz(a,h)anthracene
Leav
es
> 28
00
1400
- 28
00
710 - 1
400
355 - 7
10
180 - 3
55
90 -
180
45 -
90<
45
20000
15000
10000
5000
0
Size Range (µm)
% M
ass A
sso
cia
tio
n w
ith
Se
dim
en
t
Anthracene
Leav
es
> 28
00
1400
- 28
00
710 - 1
400
355 - 7
10
180 - 3
55
90 -
180
45 -
90<
45
25000
20000
15000
10000
5000
0
Size Range (µm)
% M
ass A
sso
cia
tio
n w
ith
Se
dim
en
t
Fluorene
Leav
es
> 28
00
1400
- 28
00
710 - 1
400
355 - 7
10
180 - 3
55
90 -
180
45 -
90<
45
35000
30000
25000
20000
15000
10000
5000
0
Size Range (µm)
% M
ass A
sso
cia
tio
n w
ith
Se
dim
en
t
Indeno(1,2,3-cd)pyrene
Mass of PAHs by Urban Sediment
Particle Sizes

22
Conclusions
When discharged into the aquatic environment, PAHs are mostly associated with particulate matter, rather than in the dissolved form.
Thermal desorption (TD) is rapid, minimizes the likelihood for human errors and contamination, and uses no solvents.
The leaf and grass content, COD and PAH concentrations in the urban creek sediments showed similar trends: smaller and larger sized particles were associated with higher concentrations compared to the intermediate sized particles.
However, most of the mass of the PAHs were associated with the intermediate particle sizes (90 – 710 µm) in the stream sediments which were in the greatest abundance, even though their PAH concentrations were the lowest.
23
Acknowledgments
NSF EPSCoR, COSS research center for funding this research work
Fellow graduate students in the department of civil engineering at The University of Alabama
Disclaimer:
This material is based upon work supported by the National Science Foundation under Grant No. EPS-0447675. Any opinions, findings, and conclusions or recommendations expressed in this material are those of the author(s) and do not necessarily reflect the views of the National Science Foundation.

24
Thank you
Questions?