
A marine electromagnetic survey to detect gas hydrate at Hydrate ...

Distribution of Hydrate Inhibitors in Processing of Gas-Condensate
Anette Hartveit Jonassen
Petroleum Geoscience and Engineering
Supervisor: Jon Steinar Gudmundsson, IPT
Department of Petroleum Engineering and Applied Geophysics
Submission date: June 2013
Norwegian University of Science and Technology


i
ACKNOWLEDGEMENT
Great thanks go to my supervisor Professor Jon Steinar Gudmundsson for assisting and
guiding me through the work process leading to completion of this thesis. I would also
like to thank my family and fellow graduates for their input, suggestions and
discussions.
Trondheim
June 2013
Anette Hartveit Jonassen

ii

iii
“Knowledge is the food of the soul”.
- Plato

iv

v
ABSTRACT
The formation of gas hydrates have been known to cause serious problems with
blockages in natural gas pipelines, wellbore and natural gas processing units. The
offshore sector of the North Sea comes into focus owing to factors such as low
temperature, high pressure because of deep water fields, great depth of the subsea
environment and remote locations that are factors underlying the increased hydrate
formation. Hydrates are formed in multiphase transport comprising gas, condensate
and water. Produced water must be cleaned if it is to be re-injected into the formation,
or discharged into the sea or other water bodies, hence due to potential recycling of the
inhibitor. One of the main purposes of water treatment is to distinguish the previously
injected thermodynamic hydrate inhibitor in Gas-Condensate production.
The aim of the thesis is to conduct a simulation study to determine the distribution of
various thermodynamic hydrate inhibitors and H2O, in water treatment, using a
Distillation Column. The distribution of thermodynamic hydrate inhibitors between the
three phases, Vapour, Liquid and Aqueous Phase was also studied. The software used
to complete this task was Aspen Tech HYSYS. The data used are respectively from
the Shell operated gas field Ormen Lange at the Norwegian Continental Shelf and the
corresponding land-based processing facility; Nyhamna. Three cases have been
studied in this thesis; the use of Methanol, Ethanol and Mono-Ethylene Glycol as
hydrate inhibitor.
The results show that the use of Distillation Column alone in HYSYS is not suitable
for the process of separate water and Methanol due to the dispersed distribution in the
column. Distillation process gives a perfect distribution of Ethanol with 100% lean
Ethanol leaving the Distillation Column as vapour, but indicates only a small amount
of Ethanol left after transportation. The results refer to a perfect distribution of Mono-
Ethylene Glycol leading to a simplified process for recycling. The bottom product
stream contains pure quantity of Mono-Ethylene Glycol and the process is optimal for
the use of Mono-Ethylene Glycol as a thermodynamic hydrate inhibitor.

vi
vii
SAMMENDRAG
Dannelse av gasshydrater har lenge vært kjent for å forårsake alvorlige problemer med
blokkering i rørledning, brønnbane og prosesseringsenheter. Offshoresektoren i
Nordsjøen kommer i fokus på grunn av faktorer som lav temperatur, høyt trykk på
grunn av dypvannsfelt, undervannsmiljø på dypt vann og store avstander, som alle er
faktorer bak økt hydrat dannelse. Hydrater dannes i flerfasestrømning som består av
gass, kondensat og vann. Produsert vann må renses hvis det skal injiseres tilbake til
formasjonen eller slippes ut i sjøen, men også på grunn av eventuell resirkulering av
inhibitoren. Et av de viktigste formålene med vannbehandling er å skille ut tidligere
injisert termodynamiske hydrat-inhibitor.
Formålet med denne oppgaven er å gjennomføre simuleringer for å kartlegge fordeling
av ulike termodynamiske hydratinhibitorer og H2O, i vannbehandlingen, ved hjelp av
en destillasjonskolonne. Fordelingen av termodynamiske hydratinhibitorer mellom de
tre fasene, gass, flytende og vannholdigfase vil også bli studert. Programvaren som
brukes til å fullføre denne oppgaven er Aspen Tech HYSYS. Dataene som brukes er
henholdsvis fra det Shell-opererte gassfeltet Ormen Lange på den Norske
kontinentalsokkelen og tilsvarende landbaser prosessanlegg; Nyhamna. Tre tilfeller
har blitt studert i denne avhandlingen; bruk av Metanol, Etanol og Mono-etylen Glykol
som hydratinhibitor i gass-kondensat produksjon.
Resultatene viser at bruken av destillasjonskolonnen alene i HYSYS ikke er egnet for
å separere vann og Metanol på grunn av den dispergerte fordeling i kolonnen.
Destillasjonsprosessen gir en perfekt fordeling av Etanol. 100% ren Etanol forlater
destillasjonskolonnen som damp, men viser bare en liten mengde Etanol som er igjen
etter transport. Resultatene refererer til en perfekt fordeling av Mono-etylen Glykol
som fører til en videre forenklet prosess for gjenvinning. Den nederste
produktstrømmen inneholder ren mengde Mono-etylen Glykol og prosessen er optimal
for bruk av Mono-etylen Glykol som termodynamisk hydrat-inhibitor.

viii

ix
TABLE OF CONTENTS
ACKNOWLEDGEMENT .......................................................................................................... i
ABSTRACT ............................................................................................................................... v
SAMMENDRAG ..................................................................................................................... vii
LIST OF FIGURES ................................................................................................................. xiii
LIST OF TABLES ................................................................................................................... xv
Chapter 1 ................................................................................................................................ - 1 -
INTRODUCTION .................................................................................................................. - 1 -
Chapter 2 ................................................................................................................................ - 5 -
FLOW ASSURANCE ............................................................................................................ - 5 -
2.1 Hydrates in Natural Gas and Crude Oil ...................................................................... - 6 -
2.2 Paraffin Wax ............................................................................................................... - 9 -
2.3 Scale .......................................................................................................................... - 11 -
2.4 Corrosion ................................................................................................................... - 12 -
2.5 Asphaltenes ............................................................................................................... - 13 -
Chapter 3 .............................................................................................................................. - 17 -
TRANSPORTING OF OIL AND GAS ............................................................................... - 17 -
3.1 Transportation ........................................................................................................... - 17 -
3.2 Piping & Pipelines ..................................................................................................... - 18 -
3.2.1 Environmental Impact ......................................................................................... - 19 -
3.2.2 Risk and Safety .................................................................................................... - 20 -
3.3 Gas Transportation and Storage Facilities ................................................................ - 21 -
Chapter 4 .............................................................................................................................. - 23 -
HYDRATE PREVENTION ................................................................................................. - 23 -
4.1 An Introduction To Hydrate Prevention .................................................................... - 23 -
4.2 Hydrate Prevention Techniques ................................................................................ - 24 -
4.2.1 Chemical Inhibition ............................................................................................. - 25 -
4.3 Health, Safety and Environmental Aspects ............................................................... - 26 -
4.4 Chemical Properties of Glycols and Alcohols .......................................................... - 29 -

x
4.4.1 Mono-Ethylene Glycol (MEG) ............................................................................ - 29 -
4.4.2 Methanol .............................................................................................................. - 30 -
4.4.3 Ethanol ................................................................................................................ - 31 -
4.5 Solubility and Phase Diagram ................................................................................... - 32 -
Chapter 5 .............................................................................................................................. - 33 -
THEORY ABOUT THE DEHYDRATION AND REGENERATION PROCESS ............ - 33 -
5.1 Dehydration Method ................................................................................................. - 34 -
5.1.1 Water Absorption in Gas Dehydration Process .................................................. - 35 -
5.2 Water Treatment ........................................................................................................ - 37 -
5.2.1 Regeneration ....................................................................................................... - 39 -
5.2.1.1 Trays .............................................................................................................. - 40 -
5.2.2 Salt Removal ........................................................................................................ - 40 -
5.2.3 Sand Removal ...................................................................................................... - 41 -
5.2.4 Glycol and Alcohol Storage Tank ....................................................................... - 42 -
Chapter 6 .............................................................................................................................. - 43 -
PROCESS SIMULATION ................................................................................................... - 43 -
6.1 Simulation Software .................................................................................................. - 43 -
6.1.2 The Simulation Software HYSYS ............................................................................ - 44 -
6.2 Simulation Model ...................................................................................................... - 44 -
6.2.1 The Regeneration Process ................................................................................... - 47 -
6.2.2 The Dehydration Process .................................................................................... - 58 -
Chapter 7 .............................................................................................................................. - 61 -
SIMULATION RESULTS ................................................................................................... - 61 -
7.1 Distribution of THI, H2O and CO2 ............................................................................ - 62 -
7.2 Case 1: Methanol ....................................................................................................... - 63 -
7.3 Case 2: Ethanol .......................................................................................................... - 64 -
7.4 Case 3: MEG ............................................................................................................. - 65 -
Chapter 8 .............................................................................................................................. - 67 -
DISCUSSION ...................................................................................................................... - 67 -
8.1 Basis of Comparison ................................................................................................. - 68 -

xi
8.2 Evaluation Of Case 1: Methanol ............................................................................... - 69 -
8.3 Evaluation Of Case 2: Ethanol .................................................................................. - 71 -
8.4 Evaluation Of Case 3: MEG ...................................................................................... - 73 -
8.5 Weaknesses and Limitations ..................................................................................... - 74 -
8.6 Potential Improvements and Suggestions for Further Work ................................... - 75 -
Chapter 9 .............................................................................................................................. - 77 -
CONCLUSION .................................................................................................................... - 77 -
REFERENCES ..................................................................................................................... - 79 -
Abbreviations ....................................................................................................................... - 85 -
APPENDIX – A ................................................................................................................... - 86 -
A1 - Process simulations HYSYS ........................................................................................ - 86 -
A2 - Loss of Thermodynamic Hydrate Inhibitor During Transportation ............................. - 88 -
APPENDIX – B ................................................................................................................... - 93 -
FLAG SYSTEM ................................................................................................................... - 93 -
APPENDIX – C ................................................................................................................... - 96 -
Calculations .......................................................................................................................... - 96 -

xii

xiii
LIST OF FIGURES
FIGURE 1 DEEP WATER DEVELOPMENT (U.S. MINERALS MANAGEMENT SERVICE 1999). ..... - 1 -
FIGURE 2 THE GAS FILED ORMEN LANGE AND PIPELINES TO LAND-BASED PROCESING
FACILITY; NYHAMNA (A/S NORSKE SHELL, 2013). ......................................................... - 3 -
FIGURE 3 MULTIPHASE FLOW (G. OWREN 2012). .................................................................... - 5 -
FIGURE 4 EXAMPLE OF THE MOLECULAR STRUCTURE OF METHANE CLATHRATE HYDRATE (TIME
2011). .............................................................................................................................. - 6 -
FIGURE 5 CONCEPTUAL ILLUSTRATION OF HYDRATE DEPOSITION ON THE PIPE WALL (SUM
2012). .............................................................................................................................. - 8 -
FIGURE 6 EXAMPLE OF WAX PRECIPITATION CURVE FROM NORNE CRUDE AT 1 BAR
(GUDMUNDSSON 2009). ................................................................................................... - 9 -
FIGURE 7 EXAMPLES OF HEAVY SCALE PRECIPITATION (STATOIL 2013). .............................. - 11 -
FIGURE 8 PIPELINE CORRODED (MERUS 2013). ..................................................................... - 12 -
FIGURE 9 EXAMPLES OF HEAVY SCALE PRECIPITATION (STATOIL 2013). ............................. - 13 -
FIGURE 10 STRUCTURE OF ASPHALTENE (BAKER HUGHES 2013). ......................................... - 14 -
FIGURE 11 ASPHALTENE - PRECIPITATION ENVELOPE (AKBARZADEH ET.AL 2007). ............... - 15 -
FIGURE 12 TO LEFT: PIPELINES, TO RIGHT: PIPING (TREND NEW AGENCY 2013). ................ - 18 -
FIGURE 13 LACK OF SAFETY AND SECURITY IN BAHRAIN 2013 ............................................. - 20 -
FIGURE 14 HYDRATE CONTROL METHODS (STEINBAKK 2012). ............................................. - 24 -
FIGURE 15 HYDRATE PREVENTION BY CHEMICAL INHIBITION (SLOAN 2000). ....................... - 25 -
FIGURE 16 PHASE DIAGRAM FOR WATER SOLUTIONS (MARTINEZ 1995). .............................. - 32 -
FIGURE 17 SCHEMATIC OF TYPICAL GLYCOL DEHYDRATION UNIT (KIDNAY AND PARRISH 2006). -
34 -
FIGURE 18: MAJOR CRUDE OIL AND WATER PRODUCTION AREAS IN THE PACIFIC/ASIA REGION
(DITRA & HOYACK 1994). ............................................................................................. - 38 -
FIGURE 19 MEG REGENERATION SYSTEM DESIGN (SØRLI 2008). ........................................ - 39 -
FIGURE 20 TRAYS INSIDE A TOWER ILLUSTRATE VAPOUR BUBBLES DISPERSED IN LIQUID
(PILLING AND HOLDEN 2009) ........................................................................................ - 40 -
FIGURE 21 CLOSED MEG - LOOP (SØRLI 2010). ................................................................... - 41 -
FIGURE 22 STANDARD DISTILLATION COLUMN (HYSYS OPERATIONS GUIDE, 2003). ......... - 47 -
FIGURE 23 “PRINT SCREEN” FROM THE FIRST STAGE OF THE REGENERATOR PROCESS IN
ASPEN TECH. HYSYS ...................................................................................................... - 49 -
FIGURE 24 “PRINT SCREEN” OF THE GRAPH; PRESSURE VS. TRAY POSITION FROM TOP TO
BOTTOM OF THE COLUMN, IN THE CASE WITH METHANOL AS THI ................................. - 50 -
FIGURE 25 STREAM SPECIFICATIONS FOR DISTILLATION COLUMN WITH A CONDENSER AND RE-
BOILER (HYSYS OPERATIONS GUIDE) .......................................................................... - 51 -
FIGURE 26 PARTIAL CONDENSER IN THE DISTILLATION COLUMN ......................................... - 51 -
FIGURE 27 RE-BOILER IN THE DISTILLATION COLUMN .......................................................... - 52 -
FIGURE 28 “PRINT SCREEN” OF THE PLOT; TEMPERATURE VS. TRAY POSITION FROM TOP TO THE
BOTTOM OF THE COLUMN, IN THE CASE WITH METHANOL AS THI ................................ - 53 -
FIGURE 29 “PRINT SCREEN” OF THE UNCONVERGED PROCESS IN THE REGENERATOR PROCESS IN
ASPEN TECH. HYSYS ....................................................................................................... - 54 -

xiv
FIGURE 30 “PRINT SCREEN” OF THE SECOND STAGE IN THE REGENERATOR PROCESS IN THE
CASE WITH METHANOL AS THI ..................................................................................... - 56 -
FIGURE 31 HYSYS’S DESCRIPTION OF THE REGENERATOR CONTROL SCREEN FROM THE USER
GUIDE (HYSYS OPERATIONAL GUIDE, 2012) ............................................................... - 57 -
FIGURE 32 OVERVIEW OF THE GAS DEHYDRATION PROCESS (KIDNAY & PARISH, 2003) ..... - 58 -
FIGURE 33 STANDARD ABSORBER COLUMN (HYSYS OPERATIONS GUIDE) ........................... - 59 -
FIGURE 34 SCHEMATIC OF A DISTILLATION COLUMN (ASPEN TECH HYSYS 2006) ............... - 68 -
FIGURE 35 “PRINT SCREEN” OF THE GAS PLANT SIMULATION DONE IN HYSYS .................... - 87 -
FIGURE 36 “PRINT SCREEN” OF THE ENTIRE SIMULATION PROCESS, FOR CASE 1: METHANOL
USED AS THI .................................................................................................................. - 90 -
FIGURE 37 “PRINT SCREEN” OF THE ENTIRE SIMULATION PROCESS, FOR CASE 2: ETHANOL
USED AS THI .................................................................................................................. - 91 -
FIGURE 38 “PRINT SCREEN” OF THE ENTIRE SIMULATION PROCESS, FOR CASE 3: MEG USED AS
THI ................................................................................................................................. - 92 -

xv
LIST OF TABLES
TABLE 1INDEPENDENT ENVIRONMENTAL IMPACT CLASSIFICATION NORWAY ...................... - 27 -
TABLE 2 ENVIRONMENTAL CLASSIFICATION OF MEOH AND TEG (MARATHON PETROLEUM
2012). ............................................................................................................................ - 28 -
TABLE 3 CHEMICAL PROPERTIES OF METHANOL, ETHANOL, MEG AND WATER (KIDNAY &
PARISH 2006), (AYLWARD & FINDLAY 2007 ). .............................................................. - 29 -
TABLE 4 COMPOSITION OF THE FEED .................................................................................... - 46 -
TABLE 5 OVERVIEW OF TEMPERATURE IN THE REGENERATION PROCESS ............................. - 53 -
TABLE 6 DISTRIBUTION OF H20, THI AND CO2 IN THE INLET AND THE THREE OUTLET STREAMS
IN A DISTILLATION COLUMN (ASPEN TECH HYSYS 2006) .............................................. - 62 -
TABLE 7 MATERIAL BALANCE IN CASE 1: METHANOL (ASPEN TECH HYSYS 2006) ............. - 63 -
TABLE 8 HYSYS RESULTS FOR CASE 1: METHANOL (ASPEN TECH HYSYS 2006) ................ - 63 -
TABLE 9 MATERIAL BALANCE FOR THI IN CASE 1: METHANOL (ASPEN TECH HYSYS 2006)- 63
-
TABLE 10 DISTRIBUTION OF METHANOL IN THE DISTILLATION COLUMN (ASPEN TECH HYSYS
2006) ............................................................................................................................. - 63 -
TABLE 11 MATERIAL BALANCE FOR CASE 2: ETHANOL (ASPEN TECH HYSYS 2006) ........... - 64 -
TABLE 12 HYSYS RESULTS FOR ETHANOL (ASPEN TECH HYSYS 2006) .............................. - 64 -
TABLE 13 MATERIAL BALANCE FOR THI IN CASE 2: ETHANOL (ASPEN TECH HYSYS 2006) - 64 -
TABLE 14 DISTRIBUTION OF ETHANOL IN THE DISTILLATION COLUMN (ASPEN TECH HYSYS
2006) ............................................................................................................................. - 64 -
TABLE 15 MATERIAL BALANCE FOR CASE 3: MEG (ASPEN TECH HYSYS 2006) .................. - 65 -
TABLE 16 HYSYS RESULTS FOR MEG (ASPEN TECH HYSYS 2006) ..................................... - 65 -
TABLE 17 MATERIAL BALANCE FOR THI IN CASE 3: MEG (ASPEN TECH HYSYS 2006) ...... - 65 -
TABLE 18 DISTRIBUTION OF MEG IN THE DISTILLATION COLUMN (ASPEN TECH HYSYS 2006) - 65
-
TABELE 19 HI LOST FROM THE SYSTEM DURING TRANSPORTATION FROM WELLHEAD TO THE
THREE-PHASE SEPARATOR AT THE LAND-BASED TERMINAL ....................................... - 88 -
TABLE 20 SPECIFICATIONS GIVEN FOR FLAGS (SHELL, 2012) ............................................. - 95 -

xvi

- 1 -
CHAPTER 1
INTRODUCTION
The oil and gas industry is facing vast number of field development
challenges due to its ever changing offshore sector. With the advancement of
the technology knowledge comes a higher possibility to operate in deeper
waters, more complex reservoirs and harsh environment with longer distance
from well to process facilities (Aker Solutions 2013).
Flow assurance, also known as multiphase transport, describes the transport of
a mixture of oil, gas, condensate and water in a pipeline (Statoil 2007). The
term describes the technology that covers the whole range of design tools,
methods, equipment as well as knowledge. All of these factors are needed to
ensure safe, uninterrupted and simultaneous transport of oil, gas and water
mixtures through wells and pipelines from the reservoir all the way to an
offshore or a land-based processing facility. Multiphase flow transfer has
become the rule rather than the exception for new offshore developments
(Statoil 2007).
FIGURE 1 DEEP WATER DEVELOPMENT (U.S. MINERALS MANAGEMENT SERVICE 1999).

- 2 -
The flow assurance problems challenged in oil and gas production have
become more onerous, leading to an increased overall industry-wide
consciousness. This is especially case in the offshore sector. The North Sea
sector in particular has come into focus owing to factors such as low
temperature, high pressure due to deep water fields, great depth of subsea
environment and remote locations that are factors underlying the increased
hydrate formation (Watson 2003).
The increase in deep water activities over the years and their potential to
expand over the coming years puts a new scope on hydrate inhibitions.
Essentially, it increases the importance of lost inhibitors during the processing
and the need to further understand the environmental and economic impact
relevant thereof. These economics provide the initial motivation to investigate
hydrate prevention (Sloan 2000).
Thermodynamic hydrate inhibitors are the most common technique to prevent
the formation of natural gas hydrate in oil and gas production. Methanol and
Mono Ethylene Glycol (MEG) are the most common hydrate inhibitors and
Ethanol used in rare and special cases.
The complexity of water treatment increases, due to increasing environmental
standard and increased requirements of commitment to development work.
One of the main purposes of the regeneration process in water treatment is to
separate off the injected thermodynamic hydrate inhibitor. The reason for this
process is to clean the water for further re-injection and potential recycling of
the inhibitor.
The inhibitors used in large offshore development are usually recycled and
the recycling depends on separation, fractionation, distillation and solids
settling. In relation to environmental standards, it will be convenient to
recycle all forms of injected hydrate inhibitor. Earlier literature and
experiments show that the recycling facilities are expensive, both in CAPEX

- 3 -
and OPEX. The recycling process of alcohol is not economical because the
process is advanced and very costly in comparison with the process of glycol.
The aim of the thesis is to conduct a simulation study to determine the
distribution of various thermodynamic hydrate inhibitors and H2O, in the
water treatment process, by using a distillation column. The distribution of
thermodynamic hydrate inhibitors between the three phases; Vapour, Liquid
and Aqueous will also be studied. The thermodynamic hydrate inhibitors are
limited to be Methanol, Ethanol and MEG. The software used to complete the
task is Aspen Tech HYSYS. The data used are respectively from the Shell
operated gas-condensate field Ormen Lange at the Norwegian Continental
Shelf and the corresponding land-based processing facility; Nyhamna. The
data are modified by the author to test the various simulation parameters for
the purpose of this work.
FIGURE 2 THE GAS FILED ORMEN LANGE AND PIPELINES TO LAND-BASED PROCESING FACILITY;
NYHAMNA (A/S NORSKE SHELL 2013).

- 4 -

- 5 -
CHAPTER 2
FLOW ASSURANCE
The term “flow assurance” encompasses a range of factors such as fluid flow,
heat transfer and production chemistry issues that have important
consequences for the transportation of hydrocarbons from reservoir to
processing facilities (Pickering 2009). The term was coined by Petrobas in the
early 1990s translated from the Portuguese phrase “garantia de fluxo” to
“Guarantee the flow”, which later became the well-known term “flow
assurance” (Watson 2003). Formation of solid deposits in oil and gas
constructions such as pipelines and wellbore processing units have been well
documented to cause severe problems, such as blockages.
In this chapter, information about the most common issues in flow assurance
is studied. The section focuses primarily on hydrate formation but also
addresses the issues pertaining to corrosion, scale, paraffin wax and
asphaltenes. This is to provide a deeper understanding of the changes of
hydrate formation conditions that may act to promote other solid deposits.
FIGURE 3 MULTIPHASE FLOW (G. OWREN 2012).

- 6 -
2.1 HYDRATES IN NATURAL GAS AND CRUDE OIL
Hydrates may occur in multiphase flow when water molecules crystallize
around so-called guest molecules. Those guest molecules are the light
hydrocarbon components such as methane, ethane, propane and butane, and
non-hydrocarbons like CO2, N2, and H2S. The structure of hydrates is very
similar to the structure of ice occurred by frozen water molecules. Whereas
ice is crystalline frozen water that only occurs at temperature at 0°C or below,
hydrates often occur at temperature above the freezing point of water and high
pressure (usually 0-25°C and 100 bara).
Gas hydrates are composed of clathrate compounds. Where each water
molecule forms hydrogen bonds with its four nearest water molecules to build
a solid crystalline lattice structure, this encages gas molecules into interstitial
cavities. This study is based on Hammerschmidt’s determination from 1934;
“Solid gas hydrates form during transportation of natural gas and cause
severe problems of blockage in pipelines”.
FIGURE 4 EXAMPLE OF THE MOLECULAR STRUCTURE OF
METHANE CLATHRATE HYDRATE (TIME 2011).

- 7 -
The word clathrate comes from the Latin clathratus, which means lattice bars
and is the reason for hydrates often being called clathrate hydrates (Mokhatab
et al. 2006).
The formation of hydrates is also reliant on the composition of the gas in the
feed stream. As documented by Katz (1945), the hydrate dissociation curve is
displaced towards lower pressure and higher temperatures as the gas gravity
or molecular weight increases (Pickering 1998). The two most common
conditions are due to temperature and pressure (gas being at or below the
water dew point and gas being at the appropriate temperature and pressure).
(Mokhatab et al. 2006).
When the temperature and pressure conditions favour the formation of
hydrates, the water molecules align in a certain pattern. The host molecule
stabilizes the water molecules and hence causes crystallisation. The crystals
effectively form a cage, held together by hydrogen bonding, trapping the host
molecules. A hydrogen bond is the attractive intermolecular force between the
polar water molecules. The two positively charged hydrogen atoms of water
molecules attract the negative oxygen atoms from other molecules, forming
an intermolecular bond.
In a pipeline, as soon as hydrate crystals are formed, they may continue to
travel along with the flow depending on the nucleation site. This is not
problematic, so long as the crystals are small. Obviously, larger crystal can
damage pipeline equipment such as valves and pumps and need to be
accounted for. Irregularities and equipment installed within the pipeline make
for good nucleation and can cause the hydrates to deposit (Gudmundsson
2009).
Such conditions, like high pressure and low temperature are common in deep
water oil and gas fields. When multiphase flow produced at wellhead flows
into pipelines, it cools, which means most subsea pipelines will experience
hydrate formation at some point within their operating envelope. The risk of

- 8 -
hydrate formation is highest during shut-in and start-up, when the temperature
at shut-in drops to the temperature of the ocean floor so the system is almost
always in the hydrate region. At this condition, multiple hydrate plugs can
form.
FIGURE 5 CONCEPTUAL ILLUSTRATION OF HYDRATE DEPOSITION ON THE PIPE WALL (SUM 2012).
In case of a hydrate plug, the pressure levels in the pipeline may cause a
dangerous situation. The pressure builds up on the one side of the hydrate
plug while it remains low on the other side. If the plug detaches from the wall,
the pressure will cause the plug to run wild in the low-pressure direction. In
areas like pipeline elbows, valves and pumps are especially exposed to such
plugs and could result in ruptures or production shutdown (Mokhatab et al.
2006).

- 9 -
2.2 PARAFFIN WAX
Wax depositions and dissociation are important issues in oil and gas
transportations and production. Paraffin wax is predominately heavy
hydrocarbons, and is prevalent in natural condensate. It may contain
following components: Hydrogen sulfide (H2S), mercaptans, carbondioxid
(CO2), long-chain alkanes (from C2-C12), cyclohexane and other napthenes,
aromatics (benzene, toluene, xylene and ethylbenzene). Paraffin wax
crystallises from crude oil and condensate when the temperature is
sufficiently low (Gudmundsson 2009).
The first point at which wax formation can be identified is called Wax
Appearance Temperature (WAT) as illustrated in Figure 6. The term “cloud
point” is also used to determine the first temperature of wax formation. Cloud
point occurs typically at 30-40°C. As the temperature is cooled further below
the “cloud point”, higher amount of paraffin wax is precipitated. The
substance is a very thick and gel-like fluid; this is a result of the paraffin wax
mixture being cooled down (Gudmundsson 2009).
FIGURE 6 EXAMPLE OF WAX PRECIPITATION CURVE FROM NORNE CRUDE AT 1 BAR (GUDMUNDSSON
2009).

- 10 -
Similar to hydrates and scale, the deposits grow as long as the conditions
favour continued wax formation. The deposits may well block the pipeline
and could also be very hard to remove. Mechanical scraping also called
pigging, heating, pipeline insulation and chemical additives are the most
common preventive against wax formation (Stokkenes 2012).
The heaviest alkanes are the first to crystallize, followed by lighter and lighter
components, during paraffin wax formation. As a result of his process, the
hardest waxes are the ones to crystallize first because the molecular weight is
closely related to the density of the deposits. If the hard wax has a high
molecular weight the alkanes are also less soluble. Hence, the nature of wax
deposits will change with distance from the pipeline inlet, as the fluid flow
will cause lighter wax to form further downstream.

- 11 -
2.3 SCALE
Oilfield scale is a solid, stone-like substance that can deposit inside pipelines
if the conditions are right. Scale is often a derivative of inorganic salts such as
carbonates and sulphates of barium which crystallize during petroleum
production (Time 2011). When hydrates and wax formations occur as
temperature decreases, it is not as “simple” when it comes to scale formation.
When sulphates deposit, (as the temperature drops because the liquid is
unable to hold in solution) the solubility of calcium carbonate decreases as the
temperature increases. Hence, the lower the temperature the more calcium
carbonate is kept in solution and prevented from crystallization.
Oilfield scale – formed by brine such as formation water – undergoes PVT
changes. This situation generally gives rise to carbonate scale. Another
situation where oilfield scale may occur is if incompatible waters mix. For
example; formation water rich in calcium, strontium and barium and sea water
rich in sulphate generally gives rise to sulphate scale (Time 2011).
Akin to hydrate and paraffin wax, scale is formed by crystallization. Different
from hydrate and paraffin wax formation, scale tends to deposit where it first
crystallized, known as local deposition.
FIGURE 7 EXAMPLES OF HEAVY SCALE PRECIPITATION (STATOIL 2013).

- 12 -
2.4 CORROSION
Corrosion is the primary means by which metals deteriorate. Most metals
corrode on contact with water and moisture in the air, acids, bases, salts, oils,
and other solid and liquid chemicals. Corrosion takes place when positive ions
break loose from the metal lattice into the surrounds and the term specifically
refers to any process involving the deterioration or degradation of metal
components. In the case of carbon steel, the iron-alloy surface undergoes an
oxidation where it releases electrons and positive Fe2+
-ions break loose from
the metal surface (Corrosion Doctors 2012).
The net reaction is composed of an anode oxidation and cathode reduction
(Ramstad 2012). When electrons transfer to the anode which in this case is the
pipe wall, it results in directly reducing of the carbonic acid. This process
leads to Fe2+
-ions being corroded from the pipeline. The negative carbonate
ion can react with Fe2+
-ions and cause iron (II) carbonate (FeCO3)
precipitation. This substance is a protection film against corrosion, but it is
important to take in account that other mechanisms that determine the rate of
formation are hard to predict. CO2 partial pressure, pH and temperature are
factors that play an important role when it comes to corrosion formation. If
the conditions are not sufficient, the corrosion film may be porous, which
does not yield any further protection against corrosion (Daugstad 1998).
FIGURE 8 PIPELINE CORRODED (MERUS 2013).

- 13 -
2.5 ASPHALTENES
Asphaltenes deposition is another well know problem that may block the
pipeline and generates a large cost increase in the petroleum industry.
Unstable asphaltenes can form a separate phase that might plug the oil-
bearing rock formation near a well. The first step toward avoiding any of
these problems is the understanding of how to evaluate asphaltene stability
(Bukley 2005). It is reported that the substance resin adsorbs on asphaltene
particle and then stabilizing the large polar molecule, and it is important to
mention the high uncertainty and large discussion regarding the topic.
FIGURE 9 EXAMPLES OF HEAVY SCALE PRECIPITATION (STATOIL 2013).
Asphaltenes have high molecular weight and the structure contains of
polycyclic organic compounds with nitrogen, oxygen and sulphur, in addition
to carbon and hydrogen. They are among the heaviest molecules in the crude
oil with molecular weight that range from 300-1400 g/mole, with an average
molecular weight of 750 g/mole. Material in the asphaltene fraction forms
aggregates. That is why standard measurements of molecular weight seldom
provides an accurate value and produces very high estimates of molecular
weight.

- 14 -
FIGURE 10 STRUCTURE OF ASPHALTENE (BAKER HUGHES 2013).
The important factor about asphaltenes is not the amount of asphaltene in the
crude oil but the stability of asphaltenes. Stability depends not only on the
properties of the asphaltene fraction, but also on how asphaltenes are affected
by the remaining oil as a solvent. It is important to remember that the extent
of how well the oil is as a solvent varies from sample to sample.
Paradoxically, the asphaltene precipitation is often observed in petroleum
fluids that contain very low asphaltene content. Light oils with small amounts
of asphaltenes will more likely cause problems than heavy oil with larger
amounts of asphaltenes (Goual & Firoozabadi 2002).
Figure 11 illustrates the asphaltene-precipitation envelope that defines the
stability zones for asphaltenes in solution. When pressure reaches the upper
asphaltene-precipitation envelope, also known as the asphaltene-precipitation
onset pressure, the least-soluble asphaltene will precipitate. As pressure
continues to decrease, more asphaltenes will precipitate, until the bubble point
pressure is reached, and gas is released from solution (Akbarzadeh et al.
2007). With continued pressure decrease, solution gas has been removed from
the system; the oil becomes denser and may begin to redissolve asphaltenes at
the lower asphaltenes-precipitation envelope (Akbarzadeh et al. 2007).

- 15 -
FIGURE 11 ASPHALTENE - PRECIPITATION ENVELOPE (AKBARZADEH ET.AL 2007).

- 16 -

- 17 -
CHAPTER 3
TRANSPORTING OF OIL AND GAS
The following sections will provide an overview of various methods of oil
and gas transportation and storage facilities in the petroleum industry. Risk,
safety and the environmental impact will be presented as well as these factors
are of great importance when it comes to transportation of oil and gas.
3.1 TRANSPORTATION
Safety, security and respect of the environment are important factors weather
oil and gas are transported from production sites to refinery by land or by sea.
When oil and gas are transported by sea, one of the main issues is to avoid
pollution. Pollution may occur not only by accidental oil spill and gas leaks,
but also by slowly discharging of polluting products such as residue from tank
and bilge cleaning. When oil and gas are transported by land it is important
that damage equipment will be replaced and the state of pipelines must be
kept under observation (Offshore Centre Denmark 2010: Ch. 6).
Not only oil and gas that is transported over a long distance needs to be
stored, also once it is produced it may be stored in tanks and later transported
by ship to where it will be sold or enter the transportation system. In some
cases and more commonly, produced oil and gas goes from wellhead and
direct into a small pipeline and from there into a larger pipeline or a pipeline
network (Offshore Centre Denmark 2010: Ch. 6).

- 18 -
3.2 PIPING & PIPELINES
Within the petroleum industry, the definition of piping is a system of pipes
used to convey media from one location to another. While the word “piping”
generally refers to in-plant piping such as process piping, which is used inside
a plant facility, the word “pipe-line” refers to a pipe running over a long
distance and transporting liquids or gases. Downstream pipelines most often
extend into process facilities such as refineries and process plants. See Figure
12.
FIGURE 12 TO LEFT: PIPELINES, TO RIGHT: PIPING (TREND NEW AGENCY 2013).
Pipelines are used to transfer production from offshore wells to shore as well
as to transfer production from a production field to a tanker loading area for
shipping. In addition, pipelines may also transfer oil from a production field
to a tanker loading area for shipping or from a port area to a refinery to be
processed into petrol, diesel fuel, jet fuel, and many other products (Offshore
Centre Denmark 2010: Ch. 6).
Natural gas, on the other hand, is almost always transported through pipeline,
either it is onshore or offshore. Due to difficulties in transferring the gas from
where it is found to where the potential consumers are located, not all gas
deposits are produced. Years ago, the gas would have been wasted, also
known as “flared”, as an unwanted by-product of oil production. However,
the industry is now using the clean-burning natural gas and is working on

- 19 -
improved technologies for the transportation from the reservoir to the
consumer (Offshore Centre Denmark 2010: Ch. 6).
In Norway, the state-owned company Gassco is responsible for the natural gas
pipeline network as well as managing the system “Gassled” which is the
network of international pipeline. The system also contains receiving
terminals that exports Norway’s natural gas production to the United
Kingdom and continental Europe (Offshore Centre Denmark, Ch.6, 2010).
The Far North Liquids and Associated Gas System, FLAGS (UK), is linking
Norwegian and UK gas line network as explained in more detail in Appendix
B.
3.2.1 ENVIRONMENTAL IMPACT
Marine pipeline projects are governed by national authority regulations
requiring Environmental Impact Assessment (EIA). The system is not
mandatory for offshore pipelines and is most often case for pipelines located
close to shore. To carry out a full EIA is time consuming and may take
approximately two years, for which reason time scheduling is important. This
is especially case in the northern European countries (Offshore Centre
Denmark 2010).
A frequent criterion used by authorities for weather EIA is required or not
will be regarding the pipeline route and weather it lays within the country’s
national territorial waters, which is 12 nautical miles. The second criterion
will be weather the pipeline project includes landfall, in which case an EIA
will normally be required. However, no general guidelines exist, and the
evaluation therefore varies from country to (Offshore Centre Denmark 2010).

- 20 -
3.2.2 RISK AND SAFETY
When it comes to the overall safety concern for pipelines located offshore the
main focus is to ensure that there is a low probability of damage to the
pipeline and of harmful effects on third parties, including the environment.
This has to be valid both during operation and construction.
Of this reason, risk and safety activities in relation to offshore pipeline
projects includes the main objectives; security of supply, personnel safety and
environmental safety (Offshore Centre Denmark 2010).
Of the above mentioned objectives the specific focus depends on the medium
to be transported in the pipeline system. In transporting natural gas the
environment impact may be less severe compared to system transporting oil,
but the safety of the personnel may be more critical due to the potential
explosive nature of gas (Offshore Centre Denmark 2010).
Figure 13 shows the gas line from field to refinery in Bahrain, Middle East
located uncovered and close to the highway. The location close to the
highway leads to reduced safety and the reason why the pipeline is uncovered
is assumed to be for easier access in case of maintenance and construction.
FIGURE 13 LACK OF SAFETY AND SECURITY IN BAHRAIN 2013

- 21 -
3.3 GAS TRANSPORTATION AND STORAGE FACILITIES
Since enormous quantities of transported oil and gas are not used
immediately, storage facilities ensuring total safety and security have to be
available to accommodate both for refinery end products and for produced oil
and gas (Offshore Centre Denmark 2010: Ch. 9).
By the large picture, challengers of transporting and storage of gas are the
same as for oil. Consumer and producer are far apart, and gas has to be
transferred from one to the other. However, when it comes to details, things
are quite different. Pipelines are preferred whether over land or under water.
At normal pressure and temperatures gas is in a gaseous state and occupies a
volume 600 times greater than of oil for the same quantity of energy. From
this reason, gas is always transported through pipelines in the gaseous state
and the gas is conveyed under high pressure (Offshore Centre Denmark 2010:
Ch. 9).
Some pipelines are underwater pipelines, such as those that link the
Norwegian gas field to the European terminal, and other pipelines are
overland pipelines like those that bring Russian gas to the European Union.
The pipelines overland in European area are buried underground and not
visible, for reasons of safety and security and due to strict regulations in over
mentioned area. On the other hand, maintenance and construction will be
more difficult in this case, as briefly mentioned in the section above (Offshore
Centre Denmark 2010: Ch. 9).

- 22 -

- 23 -
CHAPTER 4
HYDRATE PREVENTION
The following sections will provide an overview of hydrate control methods.
The health, safety and environmental aspects will be presented, as well as
chemical properties of glycols and alcohols of interest in this thesis.
4.1 AN INTRODUCTION TO HYDRATE PREVENTION
Gas hydrates represent a severe operational problem as the hydrate crystals
deposited on pipe walls accumulate as large plugs. As mentioned earlier this
may result in blocked pipes, over-pressuring and eventually shut down on
production facilities.
The removal of hydrate plugs in subsea production or transmission systems
poses safety concerns and can be time-consuming and costly. For this reason,
the hydrate formation in subsea gas transmission pipelines should be
prevented effectively and economically to guarantee operational normality
(Mokhatab et al. 2006).
When we talk about hydrate formation as a concern, one of the key factors
relates to economics. Even concerns of higher value (e.g., safety or
environmentally) relate directly to economics because these concerns can
prevent process operations. Most oil and gas companies take earned pride in
the number of accident-free days. Safety is related to cost, but company
policy invariably is “safety at all costs” or “If we can’t operate safely, we
can’t operate” (Sloan 2000).

- 24 -
The oil and gas production industry in the U.S 1996 used an estimated 400
million lbm of methanol (MeOH). Shell’s usage of MeOH was at the same
time 500 million lbm. Conventional methods of hydrate control typically cost
50 million USD for one field. Use of conventional inhibitors requires large
storage tanks on the platforms and costly system for injection and possible
regeneration (Aker Solutions 2012).
FIGURE 14 HYDRATE CONTROL METHODS (STEINBAKK 2012).
4.2 HYDRATE PREVENTION TECHNIQUES
The permanent solution to prevent hydrate formation is removal of water
prior to pipeline transportation, such as using an offshore dehydration plant or
subsea separation, which is not often the most cost efficient solution.
Another way to prevent hydrate plugs is to change the pressure and
temperature conditions outside the hydrate formation region. By this it means
preventing the hydrate envelope (HE), pressure (P) and temperature (T)

- 25 -
production facilities profile from crossing each other during normal
production. This can be done by forcing HE to the left using inhibitors such as
alcohols and glycol, or by shrinking the P and T production facilities profile
to the right by insulation and heating the flow line. As illustrated in Figure 15
below. The figure represents a hydrate formation diagram in the pressure-
temperature plane. The region on the right side “No hydrate” covers pressure
and temperature at which hydrates are thermodynamically unstable.
FIGURE 15 HYDRATE PREVENTION BY CHEMICAL INHIBITION (SLOAN 2000).
4.2.1 CHEMICAL INHIBITION
The most common technique in deep water environments is adding chemical
compounds that change the behaviour of the mixture. This is to keep pressure
and temperature away from hydrate formation region, as briefly explained in
the section above. In deep water environments both oil and gas flow lines
require hydrate inhibitors. Since typical gas pipelines do not have insulation,
chemical inhibition for hydrate formation is continuously required. Oil flow
lines are more likely to be insulated but require hydrate inhibitors for start-up
and shut-in restarts. Chemical inhibitors are usually injected at the wellhead

- 26 -
and prevent the hydrate formation by decreasing the hydrate temperature
below the pipeline operating temperature. If the water production is
significant this method is expensive.
For most oil production systems, this cost is prohibitively expensive whereas
it can be the least expensive alternative for a gas system. Hydrate inhibition
by using chemical inhibitors is still the most widely used method. The
development of alternative methods due to cost-effective and environmentally
acceptable hydrate inhibitors is a technological challenge for the oil and gas
industry (Lederhos et al. 1996).
Thermodynamic inhibitors are chemicals such as methanol, ethanol, ethylene,
glycol and triethylene glycol. These have the effect of shifting the hydrate
formation area to the left, which causes the hydrate formation point to be
displaced to a lower temperature and a higher pressure.
4.3 HEALTH, SAFETY AND ENVIRONMENTAL ASPECTS
The various Health, Safety and Environment (HSE) and technical aspects are
important factors to discuss when we talk about chemical inhibition. As well
as potential solutions that could improve the possibility of making glycols our
preferred hydrate inhibitor when it comes to HSE. However, with increasing
focus on HSE in the oil and gas industry, the safety concern of MeOH
become more fore frontal.
After the product has been assessed under the HOCNF (Harmonised Offshore
Chemical Notification Format), the component level evaluation is undertaken
when it is created on the CEMS database and given a colour classification
appropriate to its environmental footprint. Table 1 shows an example of the
requirement given by HOCNF.

- 27 -
TABLE 1INDEPENDENT ENVIRONMENTAL IMPACT CLASSIFICATION NORWAY
All chemicals on the PLONOR list are classified as green substances.
Methane, ethane and MEG respectively are all classified as green (OSPAR
2008).
An example of Marathon Petroleum’s emulsion application for the field
“Alvheim” is shown in Table 2. The yearly amount of methanol loss to the
ocean is 53 509 kg which contains 0.085 % of total amount. Yearly amount of
pH adjusted TEG is calculated to be 0.084% of total.

- 28 -
TABLE 2 ENVIRONMENTAL CLASSIFICATION OF MEOH AND TEG (MARATHON PETROLEUM 2012).
In terms of safety, the presence of hydrates can cause serious implications for
drilling operations. At the conditions which prevail during drilling, hydrates
can form in drilling risers, chokes, kill lines and blowout preventers
(Pickering et al. 2001).
In addition, the occurrence of naturally occurring hydrates close to the surface
can also present a serious hazard during drilling by releasing gas into the
borehole leading to well control difficulties and the potential for blowouts.
Furthermore, operations such as fraccing can also suffer from hydrate
formation requiring special fluid and inhibitor formulations to prevent
blockages (Pickering 1996).

- 29 -
4.4 CHEMICAL PROPERTIES OF GLYCOLS AND ALCOHOLS
TABLE 3 CHEMICAL PROPERTIES OF METHANOL, ETHANOL, MEG AND WATER (KIDNAY & PARISH
2006), (AYLWARD & FINDLAY 2007 ).
Methanol Ethanol MEG Water
Empirical formula CH4O C2H6O C2H6O2 H2O
Molecular weight, g/mol 32.042 46.07 62.07 18.02
Boiling point, °C 64.7 78.4 198 100
Vapor press. (at 20°C), kPa 12.5 5.7 0.011 2.3
Melting/Freezing point, °C -98 -112 -13 0
Density (at 20°C), kg/m3 792 789 1,116 998
Viscosity (at 20°C), cP 0.59 1.2 21 1.002
Surface tension, dynes/cm (at
25°C)
22.07 22.39 48 72
Maximum Recommended
Regeneration Temp. [°C]
- - 163 -
4.4.1 MONO-ETHYLENE GLYCOL (MEG)
Mono-ethylene glycol (HOCH2CH2OH) is the simplest of the glycols. It is
often referred to as just EG or MEG. Common for all glycols is that they
contain two hydroxyl (OH) functional groups. MEG is the most widely used
glycol, due to its availability, cost and technical efficiency. MEG has a flash
point of 116°C and is significantly less flammable than Methanol and
Ethanol. Similar to the alcohols MEG has a distinct alcoholic odor and is
soluble in water. Referred to Table 3 MEG has a boiling point at 198°C at
atmospheric pressure, liquid density of 1116 kg/m3 and a molecular weight of
62 g/mol. At 20°C MEG has a viscosity of 21 cP. The high viscosity is one of
the bigger obstacles related to the use of MEG in flow assurance. MEG is
moderate toxic to humans. The biggest risks are related to coming in contact
with large quantities, as the skin quickly absorbs it. The effect of being
exposed to harmful amounts of MEG can be deep and rapidly induced sleep,
breathing difficulties and kidney failure (Store Norske Leksikon 2012).

- 30 -
MEG is in environmental classification sector “green” (Marathon Petroleum
2009).
4.4.2 METHANOL
Methanol (CH3OH) has the simplest alcoholic molecular structure. Due to the
availability and price Methanol became one of the most common
thermodynamically hydrate inhibitor, compared to other inhibitors, in the oil
and gas industry. It is a colourless, toxic and highly flammable substance with
a flash point of 11°C. Furthermore, methanol burns with an invisible flame,
making fire detection a more difficult problem, combined with the
flammability, makes it a very tricky material to handle safely. Similar to
ethanol, methanol has a distinct smell of what humans associate with an
alcoholic substance.
Methanol has a boiling point of 64.7°C at atmospheric pressure, liquid density
of 792 kg/m3 and a molecular weight of 32 g/mol. At 20°C Methanol has a
viscosity of 0, 59 cP. Methanol represents a serious risk to consumers, a dose
a small as 7-8 grams and lethal as dose of 30 grams or more are damaging to
human beings. It allows less oxygen to be absorbed in the bloodstream and
can as a result of this cause permanent blindness, as the retina is one of the
first things to suffer from the lack of oxygen (Store Norske Leksikon 2012).
MeOH is toxic and should be prevented from entering the water, and
subsequently, the food chain. Such concerns currently are very important in
the Norwegian sector of the North Sea and may take precedence over
economics. It is assumed that MeOH in the nearest future will be prohibited
by environmental concerns (Sloan 2000: p.60). However, methanol is
classified as “green” due to HOCNF’s environmental classification system
(Marathon Petroleum 2009).

- 31 -
4.4.3 ETHANOL
Ethanol (C2H5OH) has the second simplest alcoholic molecular structure. It is
a colourless substance with a flash point at 14°C. Ethanol has a boiling point
at 78, 5°C at atmospheric pressure, liquid density of 789 kg/m3 and a
molecular weight of 46, 07 g/mol. (Shakasiri 2009) Ethanol has been made
since ancient time by the fermentation of sugar. Simple sugar is the raw
material. The fermentation process is presented by the equation.
C6H12O6 → 2CH3CH2OH + 2CO2
Ethanol is toxic to human beings in a small extend compared to Methanol.
Ethanol is common as a hydrate preventing inhibitor in South-America,
Brazil. Without further information, it is assuming that ethanol is more easily
available because of the sugar production in the region, which is the substance
ethanol is made from.

- 32 -
4.5 SOLUBILITY AND PHASE DIAGRAM
Generally, inhibitors are more efficient with decreasing molecular weights.
Hence, Methanol is more efficient than Ethanol, which is more efficient than
MEG. As a general rule, the anti-microbial activity of alcohols increases with
molecular weight and chain length to about C10 (Chandraguptan 2011).
Alcohols have a lower viscosity and their lower surface tension makes
effective separation easy at cryogenic conditions. Alcohols with small
molecules are volatile, colourless, flammable liquids which are soluble in
water. As the molar mass increases, the boiling point, melting point and
viscosity also increase, while solubility in water decreases. The boiling point
and solubility in water increases by adding hydroxyl groups (OH). These are
bonded to a carbon atom and part of the structure for both alcohols and
glycols (Martinez 1995).
Methanol, Ethanol and MEG are miscible with water which means they mix
in all proportions, forming a homogeneous solution. The term also applies to
solids and gases, but the main focus is the solubility of one liquid in another
(Martinez 1995).
The figure below illustrates a phase diagram for methanol, ethanol and MEG
water solutions.
FIGURE 16 PHASE DIAGRAM FOR WATER SOLUTIONS (MARTINEZ 1995).

- 33 -
CHAPTER 5
THEORY ABOUT THE DEHYDRATION AND
REGENERATION PROCESS
In the gas dehydration process water is removed from the gas using glycol as
a solvent. In the regeneration process water is treated to make it as clean as
possible, which is a part of the process called Water Treatment. In the over
mentioned process sand, salt and other unwanted chemicals such as THI are
removed from the water stream. THI is removed for the reason of recycling if
the process is possible or the amount is left for further treatment, which will
be discussed in more detail in chapter 6.
The main focus of this chapter will be directed towards regeneration of the
water separation system, which also includes methods for sand removal, salt
cleaning and hydro cyclones. These processes are included to provide a better
understanding of the general process of water separation. The above processes
are only included in the regeneration process according to the water treatment
and not included in gas drying. Gas dehydration method will be briefly
discussed in the first section, because this process is related to the
regeneration process in the gas drying situation.

- 34 -
5.1 DEHYDRATION METHOD
The glycol dehydration process can be divided into two parts. First lean
glycol dries the wet gas, thereby making the glycol rich. In the second part of
the process water is removed from the rich glycol making it lean once again.
This process is illustrated in Figure 17.
FIGURE 17 SCHEMATIC OF TYPICAL GLYCOL DEHYDRATION UNIT (KIDNAY AND PARRISH 2006).
The most common methods for gas dehydration are absorption, adsorption,
membrane processes and refrigeration. Depending on the water content the
methods may be combined or be used by themselves (Kidnay and Parrish
2006).
Refrigeration does in many cases not remove enough water from the gas; it is
however often used in combination with the other dehydration methods. The

- 35 -
adsorption process yields the lowest water content in the gas, dependent on
the adsorbent. Even though the absorption process cannot remove as much
water as adsorption process it is still preferable. This is because it removes
enough water from the gas that requires for the criteria for the dry gas, as well
as it gives a better cost-benefit result than the adsorption process. In some
cases where low temperature gas treatment is involved adsorption dehydration
is required. In those cases the cost is often reduced by combining adsorption
plant with an absorption plant (Christensen 2009).
The efficiency of the dehydration process is evaluated by the water contents
in the gas after the dehydration. The water content after dehydration is often
given as the water dew-point; this is to ensure that no water will condense in
the pipeline. The water dew-point is therefore more practicable because it is
directly comparable with the pipeline operating conditions (Christensen
2009).
5.1.1 WATER ABSORPTION IN GAS DEHYDRATION PROCESS
In dehydration by absorption water is removed by a liquid with strong affinity
for water, glycols being the most common. The wet gas passes through an
inlet scrubber to remove solids and free liquids, and then enters the bottom of
the glycol contactor. Dry gas flows upward in the contractor while lean glycol
solutions which is glycol with little or no water flows down over the trays.
Sometime it might be preferable to lower the gas inlet temperature before the
dehydration, so an inlet cooler might also be used. The process is illustrated in
Figure 17.
There are certain requirements for absorbents used for gas dehydration, the
book Fundamentals of natural gas processing; mentions some of the
requirements;

- 36 -
A high affinity for water
A low affinity for hydrocarbons
A low volatility at the absorption temperature to reduce vaporization losses
A low viscosity for ease pumping and good contact between the gas and
liquid phases
A good thermal stability to prevent decomposition during regeneration
A low potential for corrosion
The most critical property for a good dehydrator is the first point; a high
affinity for water. The other criteria are used to evaluate potential absorbents
practical applicability in the industry. In practice glycols are the most
commonly used absorbents for dehydration.
Referred to Table 3, the most important values are the boiling point, vapour
pressure, viscosity and maximum recommended regeneration temperature.
The boiling point and the vapour pressure have an influence on the distillation
process. The greater the difference for these properties between the top and
the bottom product, the easier it is to separate the components. The separation
between glycol and water is important because the water contents in the lean
glycol determine the amount of water the glycol can remove from the gas.

- 37 -
5.2 WATER TREATMENT
Water is one of the most handled and well used fluids in the petroleum
industry. Large volumes of water are used in injection operations, and even
larger volumes are a major waste by-product from the production of oil and
gas (Ditra and Hoyack 1994). Before produced water can be reused or
disposed, the water must be treated to remove the unwanted compounds due
to environmental regulations (Ospar Comission 2009).
Displacement water and produced water are the main contributors to the oil
discharges from the offshore oil and gas activities in the North Sea,
representing 96% of the total amount of oil discharges to the sea in 2009
(Ospar Comission 2009). There is an aim for zero harmful discharge and
continuous improvement of water cleaning technology (Ramstad 2013).
The overall reason for water treatment is to be able to either inject produced
water back into the reservoir or discharge produced water to the sea or other
water bodies. This is done by removing particles and heavy metals and
reduces oil in water and bacterial activity and toxic compounds. The reason
for water treatment is also to reduce risk of infectivity losses, mechanical
failure, environmental impact and reservoir souring (Ramstad 2013).
Figure 18 show the total crude oil and water production by country, in the
Asia/Pacific region in 1994. This figure emphasis the large impact water has
on oil and gas producers, and the importance of increased focus.

- 38 -
FIGURE 18: MAJOR CRUDE OIL AND WATER PRODUCTION AREAS IN THE PACIFIC/ASIA REGION
(DITRA & HOYACK 1994).
Water is always presence in the production of oil and may contain dissolved
and dispersed hydrocarbons, dissolved organic and inorganic compounds
(Seureau et. al 1994). In addition, produced water may also contain a
significant amount of suspended solids of various origins such as
precipitation, formation, hydrate inhibitors, corrosion, etc., thus, solids of
nature such as clay, sand, sulphates, carbonates, etc.
When water is separated off in the three-phase separator the water stream still
contains a small amount of hydrocarbon as well as the over mentioned
material. Regardless of the hydrate inhibitor used we want to separate it off
the water (Kidnay and Parish 2006).

- 39 -
FIGURE 19 MEG REGENERATION SYSTEM DESIGN (SØRLI 2008).
5.2.1 REGENERATION
The regenerator is a distillation column, where glycol/alcohol and water is
separated. At the top of the column it is a partly condenser, this provide reflux
thus improving the separation between water and glycol/alcohol. The
condenser also minimizes glycol loss from the regenerator. The remaining
water vapour leaves the condenser and is vented to the atmosphere.
The energy required to separate glycol/alcohol and water is supplied by the
re-boiler at the regenerator column. The recommended maximum temperature
in the re-boiler is shown in table 1. In the case where glycol is used as THI the
lean glycol is taken from the re-boiler and is transferred to a storage tank
before it is recycled or in some cases it is recycled directly from the re-boiler.
In the case where alcohol is used as THI the alcohol is transferred to a storage
tank from the condenser, but is not going through a recycling process since
this is a more advanced and costly process. This is explained in more detail in
chapter 6.

- 40 -
The pressure in the regeneration system is just above atmospheric pressure,
this is to insure that no air can enter the system from the atmospheric vent. A
simple way to increase the lean glycol purity is to add a stripping gas to the
regenerator or regenerate by vacuum distillation. Stripping gas can be added
to the regenerator boiler or in a stripping column after the regenerator column.
5.2.1.1 TRAYS
Tower internals are arguably the most important piece of process equipment
since they are hard to maintain because of access after start-up. The
technology about trays and the distillations columns internal is complicated
and will not be discussed in further detail.
FIGURE 20 TRAYS INSIDE A TOWER ILLUSTRATE VAPOUR BUBBLES DISPERSED IN LIQUID (PILLING
AND HOLDEN 2009)
5.2.2 SALT REMOVAL
Salt removal in the regeneration system is a challenge and can be achieved
through good chemistry control and proper separation equipment. A closed
MEG loop will become contaminated with salt/particles from the gas
production. When it comes to chemistry control, low soluble salts like Ca2+
,
Mg2+
, Fe2+
, CO32-
and HCO3- must be removed from the phase. Divalent
cations will easily precipitate thus forming scale and undesired locations at

- 41 -
low concentrations. The precipitation will be done by alkalinity and
temperature control (Seereeram 2008).
FIGURE 21 CLOSED MEG - LOOP (SØRLI 2010).
Some level of high soluble salts can be tolerated, such as Na+, K
+ and Cl
-. The
precipitation will be done by evaporation and monovalent cations may
accumulate up to > 75000 mg/l without precipitation (Seereeram 2008).
Other chemicals: acetat and corrosion inhibitor will not precipitate but
accumulates in the Reclaimer.
5.2.3 SAND REMOVAL
The crude and/or water may contain an amount of sand particles when it
enters the processing plant. The amount is dependent of the reservoir
formation and other factors such as distance from field to shore. As same as
salt and THI, sand needs to be removed before water can be reinjected or
discharged to the sea.
In a solid-liquid separation the hydrocyclone will be defined as a “desander”
and the separation of produced sand from crude and/or water will be defined
as “desanding”. The dehydration, also called liquid-liquid separation of water

- 42 -
from crude, will be defined as “dewatering” and the hydrocycone will be
defined as “dewaterer” (Ditra & Hoyack 1994).
5.2.4 GLYCOL AND ALCOHOL STORAGE TANK
A storage tank is an optimal instalment that ensures a constant glycol flow to
the contactor column. Because there will be a loss of glycol in the dehydration
system, a storage tank can act as a buffer to prevent insufficient glycol flow,
and also be used to measure the glycol contents in the system.
- 43 -
CHAPTER 6
PROCESS SIMULATION
This chapter introduces the process of interest; the separation of water and
THI in the regeneration process. Gas dehydration is briefly mentioned
because the regeneration process is involved in this operation as well. The rest
of the operations in the processing plant are mentioned in appendix B.
To make a basis for comparison for the three cases it is important that the data
and procedure are the same for the different cases. To avoid repeating the
same procedure three times, this chapter is only explaining the procedure for
the case with Methanol as a Thermodynamic Hydrate Inhibitor.
6.1 SIMULATION SOFTWARE
The Software Developer “Lanner” describes a Simulation Software in a
following manner:
“Simulation, through the use of simulation software, is the science of
creating statistically accurate models to represent the behaviour of real life
systems in order to subject them to predictive experimentation. These
experiments or scenarios can then enable 'what if?' questions to be answered
without risk or disturbance to the real life system.” (Lanner 2013).
When using a process simulation program to simulate a process plant there
are several things that must be taken into consideration. These considerations
include the settings for the simulation program, setting and design for the
process plant. When the simulation starts to run additional problems might

- 44 -
arise, because variables need to be defined or values estimated before the
simulations converge (Christensen 2009).
6.1.2 THE SIMULATION SOFTWARE HYSYS
Aspen Tech HYSYS is a process modelling software developed by Aspen
technologies Inc. AspenTech is a company that develops software exclusively
for the process industry that uses thermodynamic models to represent the
phase equilibrium behaviour and energy level of pure compound and mixture
systems. AspenTech is the world's leading supplier of software that optimizes
process manufacturing (Guerra 2006).
“Aspen HYSYS is a market-leading process modelling tool for conceptual
design, optimization, business planning, asset management, and performance
monitoring for oil and gas production, gas processing, petroleum refining and
air separation industries” (AspenTech 2012)
The software HYSYS offer several thermodynamic packages for the
calculations involved in the processing plant. A package contains all the
thermodynamic equations required to calculate the system. The packages
available are the commonly used Equation of State (EOS) like Peng-
Robinson, but also more seldom or special packages depending on the
components simulated.
6.2 SIMULATION MODEL
The first step using HYSYS is to select a fluid package. Peng-Robinson is
selected for the HYSYS simulations, as this is a preferred fluid package for
hydrocarbon mixtures. Peng-Robinson is recommended for oil and gas
systems because it handles the properties of single-phase, two-phase and
three-phase systems with a high amount of accuracy (Aspen HYSYS
Simulation Basis Manual 2012). The fluid package contains information

- 45 -
about the physical and flash properties of components, as well as it
determines the relation between each component and how they react.
The next step is to input the necessary component needed for the simulation.
The Gas Condensate components list from Pedersen o.a (1989) Properties of
Oils and Natural Gases, Gulf Publishing Company with some modifications is
used in this work. In addition, the components Methanol, Ethanol, EGlycol
and H2O are added to the list. See Table 4.
The input data can be given in several measuring unit sets, depending on the
user’s choice. In these simulations the units are consistently set to be SI units.

- 46 -
SPECIFICATION
The specifications consist of composition, flow, temperature and pressure for
the wet gas and the required purity of the THI. The operation conditions are
given in Appendix A. The Gas Condensate component list is illustrated in
Table 4. The molar composition is equal in the entire system.
TABLE 4 COMPOSITION OF THE FEED
Molar composition Molar Mass
Methane 0.7086
Ethane 0.0853
Propane 0.0495
i-n-Butane 0.0200
i-n-Pentane 0.0081
n-Hexane 0.0046
n-Heptane 0.0061
n-Octane 0.0071
n-Nonane 0.0039
n-Decane 0.0028
C11 0.0020
C12 0.0015
C13 0.0011
C14 0.0010
C15 0.0007
C16 0.0005
C17+ 0.0037
Water 0.0009
Nitrogen 0.0071
Carbon dioxide 0.0865

- 47 -
6.2.1 THE REGENERATION PROCESS
The distillation column used in this case is a special type of sub-flowsheet in
HYSYS. The operational guide describes a sub-flowsheet to contain
equipment and streams, and is used to exchange information with the parent
flowsheet through the connected internal and external streams.
The column appears as a single, multi-feed multi-product operation that is ran
from the main simulation environment (HYSYS Operational Guide 2003).
The most complex unit operations that HYSYS simulates are the multi-stage
fractionation towers, such as re-boiled de-methanizer, vacuum and crude
distillation units, and extractive distillation columns.
Each one of these towers consists of a series of equilibrium or non-
equilibrium flash steps. This process is dependent on the system being
simulated. A stage may include one or more feed streams flowing on it, liquid
or vapor products withdrawn from it, and can be heated or cooled in a side
exchanger.
FIGURE 22 STANDARD DISTILLATION COLUMN (HYSYS OPERATIONS GUIDE, 2003).

- 48 -
In this case only one feed stream is entering the tower and no side exchanger
involves in the process. A standard distillation column as shown in Figure 22
is used in the process plant.
After the correct tower is chosen, Partial Condenser is set for the case, to give
values for vapour flow and water flow that contains salts, solids, alcohol and
unwanted chemicals. The next step is to specifying the inlet and the three exit
streams which are attached to the main tray section. The number of both inlet
and exit streams are depending on the condenser configuration. When used
alone, the distillation column has three or four boundary steams but requires
four or five pressure-flow specifications; generally one pressure and three or
four flow specifications. The extra pressure –flow specification is required
due to the reflux stream. The inlet stream is entering the column on the
middle tray (HYSYS Operational Guide 2003).
When the streams are defined, HYSYS asks to determine pressure for both
condenser and re-boiler.

- 49 -
PRESSURE
Pressure in the column is lower than the pressure in the inlet stream, to make
the stream boil quicker when it first enters the column. The pressure profile in
a Column Tray Section is calculated based on the added specifications.
FIGURE 23 “PRINT SCREEN” FROM THE FIRST STAGE OF THE REGENERATOR PROCESS IN ASPEN
TECH. HYSYS
The pressure is measured by define the top and bottom tray pressure in an
early stage of the simulation. As shown in Figure 23, HYSYS requires pressure
at top and bottom of the tower; pressure in the condenser (P cond) and
pressure in the re-boiler (P reb). Pressure at the condenser is required to be
lower than pressure at the re-boiler to make the stream flow to the top.
HYSYS will then interpolate between the specified values to determine the
pressure profile. Simple linear interpolation is used to calculate the pressure
on stage which is not explicitly specified Figure 24 illustrates the pressure
profile for the case with Methanol as a THI. As shown in Figure 24 pressure in
tray at the top (tray number 1) and bottom (tray number 10) of the column is

- 50 -
constant and increases linear from 101.3 kPa to 120kPa from top to bottom
(HYSYS Operational Guide 2003).
FIGURE 24 “PRINT SCREEN” OF THE GRAPH; PRESSURE VS. TRAY POSITION FROM TOP TO BOTTOM
OF THE COLUMN, IN THE CASE WITH METHANOL AS THI
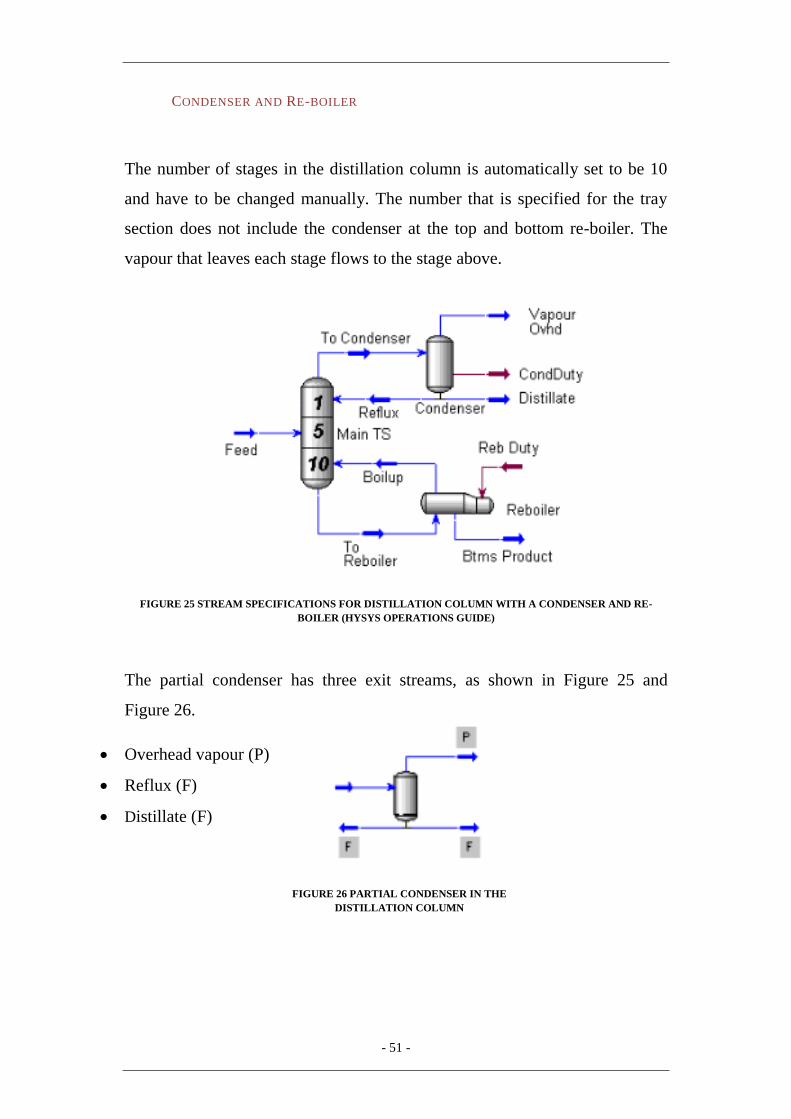
- 51 -
CONDENSER AND RE-BOILER
The number of stages in the distillation column is automatically set to be 10
and have to be changed manually. The number that is specified for the tray
section does not include the condenser at the top and bottom re-boiler. The
vapour that leaves each stage flows to the stage above.
FIGURE 25 STREAM SPECIFICATIONS FOR DISTILLATION COLUMN WITH A CONDENSER AND RE-
BOILER (HYSYS OPERATIONS GUIDE)
The partial condenser has three exit streams, as shown in Figure 25 and
Figure 26.
Overhead vapour (P)
Reflux (F)
Distillate (F)
FIGURE 26 PARTIAL CONDENSER IN THE
DISTILLATION COLUMN

- 52 -
HYSYS recommends one pressure specification for the Overhead vapour
stream, and one flow specification for either of the liquid product streams;
reflux flow and Distillate.
The re-boiler has two exit streams:
Boil-up vapour
Bottom liquid (F)
In the re-boiler only one exit stream can be specified; the stream of the heavy
product. In this process will the exit stream from the re-boiler contain water or
a mixture of water and glycol depending of the selected THI used in the
particular case. If a pressure constraint is specified elsewhere in the column,
this exit stream must be specified with a flow rate. The heavy product is
dependent on the products involved in the specific mixture. In the mixture of
glycol and water, glycol will be the heavy product, in the mixture of water
and alcohol; water will be the heavy product (HYSYS Operational Guide
2003). Refers to Table 3.
TEMPERATURE
The Profile page in the Parameters tab of the Column Property view can also
be used for temperature changes in the system. Temperature estimates can be
given for any stages in the column, including the re-boiler and the condenser.
Another way to change temperatures in the system is by adding specifications
in the Monitor tab. The specified temperature for both the condenser and the
re-boiler are defined by the thermodynamic inhibitor used in the specified
system. See Table 5. If the overhead product is a subcooled liquid, it is best to
FIGURE 27 RE-BOILER IN THE DISTILLATION COLUMN

- 53 -
specify an estimated bubble-point temperature for the condenser rather than
the subcooled temperature (HYSYS Operational Guide 2003).
TABLE 5 OVERVIEW OF TEMPERATURE IN THE REGENERATION PROCESS
Case 1: Methanol 2: Ethanol 3: MEG
Inlet Temp [°C] 20 20 20
Temp. Condenser [°C] 82 83.5 98
Temp. Re-boiler [°C] 115 101 150
In this case, the overhead product is water, and therefore not a subcooled
liquid. The estimated temperature is set to just above the bubble point for
water; 102 °C. Temperature for the inlet stream is just below the boiling
temperature for the overhead product. The temperature in the condenser
should be at or slightly above boiling temperature for the overhead product.
The temperature in the re-boiler should be below boiling point for the heavy
components. In this case, the heavy components are either water or MEG in
the three cases. The various temperatures for the case with Methanol are
shown in Figure 28. Temperature increases from 82°C to 115°C from top of
the column to the bottom as shown in Table 5 and Figure 28 (HYSYS Operational
Guide 2003).
FIGURE 28 “PRINT SCREEN” OF THE PLOT; TEMPERATURE VS. TRAY POSITION FROM TOP TO THE
BOTTOM OF THE COLUMN, IN THE CASE WITH METHANOL AS THI

- 54 -
DEGREES OF FREEDOM & ESTIMATES
After the input data are given HYSYS requires two variables that need to be
defined in this particular case. This is illustrated in the Monitor tab and the
picture of Degrees of Freedom. HYSYS is able to run when the Degrees of
Freedom is equal to zero. When one specification is made active, the degree
of freedom is decreasing by one. Conversely, when you deactivate a
specification, the degrees of freedom are increased by one. You can start
column calculations when there are zero degrees of freedom. Since two
design criteria are given namely to the condenser and re-boiler temperature
these are set to be Active. When these criteria are entered into HYSYS the
column control screen is shown in Figure 29 (HYSYS Operational Guide 2003).
FIGURE 29 “PRINT SCREEN” OF THE UNCONVERGED PROCESS IN THE REGENERATOR PROCESS IN
ASPEN TECH. HYSYS
As shown in Figure 29 the simulations are unable to converge with only the
condenser and the re-boiler temperature given. More information about the
process is required and the design parameters can be supplemented by
estimated start values that help to solve the calculations. To make HYSYS

- 55 -
converge quicker, the estimates should be chosen as suitable to the system as
possible (HYSYS Operational Guide 2003).
There are three ways to provide the column with initial estimates:
Provide the estimate values when first build the column.
Go to the profiles or Estimates page on the Parameters tab to provide the
estimate values.
Go to the Monitor or Spec on the Design tab to provide values for the default
specifications or add your own specifications.
In this system, the last option is chosen. Values for the default specifications
are provided in the Monitor tab. Obvious estimates are data that are already
known or can be easily estimated by the situation. The first estimate is the
Bottom Product Rate (Btms Prod Rate) which is calculated by HYSYS to be
107 kgmole/h.
A second estimate is Vent Rate which is calculated by HYSYS to be 83.20
kgmole/h.
A third estimate is in this case set to be Temperature Reboiler (TRe). HYSYS
does not require the Re-Boiler temperature to be active and works well with
the specified value for Distillation Rate (HYSYS Operational Guide 2003).
The information required to make the simulation converge varies from case to
case. The column of Wt. Error gives an indication of the values used. With
the added values shown in Figure 30, the column now converges.

- 56 -
FIGURE 30 “PRINT SCREEN” OF THE SECOND STAGE IN THE REGENERATOR PROCESS IN THE CASE
WITH METHANOL AS THI
When the distillation column starts to run the simulations for the first time or
after the reset function has been used, it is important to take into consideration
the specification values are still estimates. If one of the original default
specifications (side liquid draw, overhead vapour flow or reflux ratio) has
been replaced with a new active specification, the new specification value is
used as initial estimates. For this reason HYSYS recommends to provide
reasonable specification values initially (HYSYS Operational Guide 2003).
The HYSYS Operational Guide 2006 describes the Regeneration Control
Screen in Figure 31. Each specification, along with its specified value, current
value, weighted error, and status is shown in the Specifications Group. A
specified value can be changed by typing directly in the associated Specified
Value cell. Any changes made in one place are reflected in the total system.

- 57 -
FIGURE 31 HYSYS’S DESCRIPTION OF THE REGENERATOR CONTROL SCREEN FROM THE USER GUIDE
(HYSYS OPERATIONAL GUIDE, 2012)

- 58 -
6.2.2 THE DEHYDRATION PROCESS
FIGURE 32 OVERVIEW OF THE GAS DEHYDRATION PROCESS (KIDNAY & PARISH, 2003)
Figure 33 shows the recommended flow specifications for an absorber
column. The same kind of Absorber is used in the dehydration process and
has two inlet and two exit streams. The absorber has four boundary streams
and then requires four Pressure Flow specifications. A pressure specification
is always required for the liquid product stream leaving the bottom of the
column. A second pressure specification should be added to the vapour
product of the top of the column, in this case set to be 2000 kPa, and the
bottom pressure in this case is set to be 7000 kPa (HYSYS Operational Guide
2003).

- 59 -
FIGURE 33 STANDARD ABSORBER COLUMN (HYSYS OPERATIONS GUIDE)
The contactor is a column with five trays. TEG is used as an absorbent
in the three different cases. The TEG inlet (LeanTEG) and gas outlet
(Dry Gas) are placed at the top of the column and the gas inlet (Wet
Gas) and the TEG outlet (Rich TEG) are placed at the bottom of the
column. The entire process is described in Appendix A.

- 60 -

- 61 -
CHAPTER 7
SIMULATION RESULTS
The HYSYS simulation model developed in section 6.2 has been done in
three cases. The simulation model is equal in the different cases and the
results differ in the way THI is selected. In this chapter the simulation results
from the three cases with Methanol, Ethanol and MEG as THI are presented.
The results given in this chapter are limited to the results of interest. All
values are taken directly from simulations with an exception of some
calculations which are explained in appendix C.
First, the distribution of THI, CO2 and Water in the four streams that are
attached to the Distillation Column is presented.
Second, results from each of the three cases are respectively presented. Four
different tables in each case indicate:
1. The total material balance in the Distillation Column; qin = qout
2. How the stream is distributed between Vapour, Liquid and
Aqueous Phase. The total mass flow [kg/h] in the system and mass
flow of THI is also presented.
3. Material balance for THI in the same system.
4. How the total flow is distributed in the system compared to the
distribution of THI.

- 62 -
7.1 DISTRIBUTION OF THI, H2O AND CO2
Table 6 illustrates only the distribution of water (H2O), THI and carbon
dioxide (CO2), isolated in each of the four streams that are attached to the
distillation column. The results only give an indication of the distribution and
not the amount of material in the system. To give an understanding of the
distributed material in the system the flow rate has to be included. This is
illustrated in the next section.
TABLE 6 DISTRIBUTION OF H20, THI AND CO2 IN THE INLET AND THE THREE OUTLET STREAMS IN A
DISTILLATION COLUMN (ASPEN TECH HYSYS 2006)
Methanol
[%]
Ethanol
[%]
MEG
[%]
Water, Inlet:
H2O 83.13 99.98 71.60
THI 16.83 0.01 28.35
CO2 0.04 0.01 0.06
Bottom Product:
H2O 98.93 100 22.55
THI 1.07 0.00 77.45
Distillate:
H2O 67.43 3.99 100
THI 32.57 95.37 0.00
CO2 0.00 0.64 0.00
Vapour:
H2O 39.68 3.06 93.28
THI 60.07 30.30 0.00
CO2 0.24 65.37 6.64

- 63 -
7.2 CASE 1: METHANOL
TABLE 7 MATERIAL BALANCE IN CASE 1: METHANOL (ASPEN TECH HYSYS 2006)
1. Stream Flow [kg/h] Total [kg/h]
In : Water2 4804 4804
Out : Vapour 1029
Distillate 1021 4805
Bottom Product 2755
TABLE 8 HYSYS RESULTS FOR CASE 1: METHANOL (ASPEN TECH HYSYS 2006)
2. Stream 1:
Inlet
Stream 2:
Vapour
Stream 3:
Distillate
Stream 4:
Bottom Product
Mass Fraction MeOH
[wt%]
0.1683 0.6007 0.3257 0.0106
Mole Flow [kgmole/h] 35.7 38.82 45.20 151.7
Mass Flow [kg/h] 4804 1029 1021 2755
Mass Flow, MeOH
[kg/h]
808.5 618.1 332.5 29.2
Mass Fraction, Vapour
Phase [wt%]
- 0.6007 - -
Mass Fraction, Liquid
Phase [wt%]
- - - -
Mass Fraction, Aqueous
Phase [wt%]
0.1683 - 0.3257 0.0106
TABLE 9 MATERIAL BALANCE FOR THI IN CASE 1: METHANOL (ASPEN TECH HYSYS 2006)
3. Stream Flow [kg/h] Total [kg/h]
In : Water2 808.5 808.5 Out : Vapour 618.1 Distillate 332.5 Bottom Product 29.2 979.8 Difference 171.3 (= 17.5%)
TABLE 10 DISTRIBUTION OF METHANOL IN THE DISTILLATION COLUMN (ASPEN TECH HYSYS 2006)
4. Stream 2:
Vapour
Stream 3:
Distillate
Stream 4:
Bottom Product
Distribution of Total Flow Rate
[%]
21.4 21.3 57.3
Distribution of Methanol [%] 63 33.9 2.9

- 64 -
7.3 CASE 2: ETHANOL
TABLE 11 MATERIAL BALANCE FOR CASE 2: ETHANOL (ASPEN TECH HYSYS 2006)
1. Stream Flow [kg/h] Total [kg/h]
In : Water2 3280 3280 Out : Vapour 1.436 Distillate 8.799E-5 3280.436 Bottom Product 3279
TABLE 12 HYSYS RESULTS FOR ETHANOL (ASPEN TECH HYSYS 2006)
2. Stream 1:
Inlet
Stream 2:
Vapour
Stream 3:
Distillate
Stream 4:
Bottom Product
Mass Fraction EtOH
[wt%]
0.0001 0.3030 0.9537 0.000
Mole Flow [kgmole/h] 182 0.03291 1.958E-6 182
Mass Flow [kg/h] 3280 1.436 8.799E-5 3279
Mass Flow, EtOH [kg/h] 0.328 0.435 8.391E-5 -
Mass Fraction, Vapour
Phase [wt%]
- 0.3030 - -
Mass Fraction, Liquid
Phase [wt%]
- - 0.9537 -
Mass Fraction, Aqueous
Phase [wt%]
0.0001 - - -
TABLE 13 MATERIAL BALANCE FOR THI IN CASE 2: ETHANOL (ASPEN TECH HYSYS 2006)
3. Stream Flow [kg/h] Total [kg/h]
In : Water2 0.328 0.328 Out : Vapour 0.435 Distillate 8.391E-5 Bottom Product 0.000 0.435
Difference 0.107 (= 24.6%)
TABLE 14 DISTRIBUTION OF ETHANOL IN THE DISTILLATION COLUMN (ASPEN TECH HYSYS 2006)
4. Stream 2:
Vapour
Stream 3:
Distillate
Stream 4:
Bottom Product
Distribution of Flow Rate [%] 0.1 0 99.9
Distribution of Ethanol [%] 100 0 0

- 65 -
7.4 CASE 3: MEG
TABLE 15 MATERIAL BALANCE FOR CASE 3: MEG (ASPEN TECH HYSYS 2006)
1. Stream Flow [kg/h] Total [kg/h]
In : Water2 2906 2906 Out : Vapour 15.89
Distillate 1073 2905.89
Bottom Product 1817
TABLE 16 HYSYS RESULTS FOR MEG (ASPEN TECH HYSYS 2006)
2. Stream 1:
Inlet
Stream 2:
Vapour
Stream 3:
Distillate
Stream 4:
Bottom Product
Mass Fraction MEG
[wt%]
0.3414 - - 0.7745
Mole Flow [kgmole/h] 95.23 0.8049 59.57 34.85
Mass Flow [kg/h] 2906 15.89 1073 1817
Mass Flow, MEG [kg/h] 992.11 - - 1407.27
Mass Fraction, Vapour
Phase [wt%]
0.0143 - - -
Mass Fraction, Liquid
Phase [wt%]
- - - 0.7745
Mass Fraction, Aqueous
Phase [wt%]
0.3271 - - -
TABLE 17 MATERIAL BALANCE FOR THI IN CASE 3: MEG (ASPEN TECH HYSYS 2006)
3. Stream Flow [kg/h] Total [kg/h]
In : Water2 992.11 992.11 Out : Vapour Distillate Bottom Product 1407.27 1407.27
Difference 415.16 (= 29.5%)
TABLE 18 DISTRIBUTION OF MEG IN THE DISTILLATION COLUMN (ASPEN TECH HYSYS 2006)
4. Stream 2:
Vapour
Stream 3:
Distillate
Stream 4:
Bottom Product
Distribution of Total Flow Rate
[%]
0.55 36.9 62.5
Distribution of MEG [%] 0 0 100

- 66 -

- 67 -
CHAPTER 8
DISCUSSION
Information about the processes involved in water treatment has been
presented in the three preceding chapters. The main objective has been the
study of regeneration process when injected THI such as Ethanol, Methanol
and MEG were used and the analysis of the distribution of the mentioned
chemicals.
In this chapter a direct analysis of the three simulated cases will be made.
Next, weaknesses and limitations of data and the model used will be
discussed. Finally, suggestions to improve the system will be presented.

- 68 -
8.1 BASIS OF COMPARISON
If alcohols are used as THI, the Distillation Column will distil off the alcohol
because of their lower vapour pressure compared to water. If glycols are used,
then water will be distilled off because water has a lower vapour pressure than
glycols. Simulations done in this thesis show how the distillation column
works in relation to which products that dissociate either at the top of the
column; in the distillation stream or as vapour, or at the bottom of the column;
in the bottom product stream.
Table 6 verifies the statement of distribution of alcohols and glycols in the
Distillation Column; heavy products dissociate in the bottom of the column
and light products at the top of the column as vapour and/or distillate. In a
mixture with water, alcohols act as the light product while glycols act as the
heavy product.
FIGURE 34 SCHEMATIC OF A DISTILLATION COLUMN (ASPEN TECH HYSYS 2006)
In case 1 and 2 the condenser temperatures are much higher than boiling point
for both methanol and ethanol and the reason for the high amount of THI in
Vapour Stream at the top of the condenser. HYSYS recommends this high
temperature in the regeneration process to make the system converge.

- 69 -
8.2 EVALUATION OF CASE 1: METHANOL
Methanol has a lower vapour pressure compared to water and will for this
reason be distilled off. See Table 3. The boiling temperature for Methanol, as
illustrated in Table 3 is 64.7°C, and temperature for Condenser used in the
distillation column is recommended of HYSYS to be slightly above boiling
point. See Table 5.
Table 7 illustrates the total Material Balance in the case with Methanol used
as THI. The calculations indicate a flow rate higher out of the system than in
to the system, with an error of 1 kg/h. An increase of flow rate in a closed
system where there is no access to other materials is unrealistic and this error
is due to a weakness in the operation. HYSYS calculates the flow rate without
decimals, so this may be a reasonable assumption in relation to the error in the
case.
The distribution of flow rate in the distillation column is as follow; 21.4%
leaves as vapour, 21.3% leaves as distillate and 57.3% leaves as bottom
product. The distribution of methanol is as follow; 63% leaves as vapour,
33.9% leaves as distillate and only 2.9% leaves as bottom product. The
process does not act properly in terms of distribution since the flow is
dispersed and needs to be separated once more before the loop is complete.
This leads to a more advanced and costly process.
When methanol is used as thermodynamic hydrate inhibitor the methanol will
distribute only in the aqueous phase and gas phase and nothing will be
dispersed into liquid phase. This is illustrated in Table 8.
Table 9; Material Balance for THI in Case 1: Methanol indicates a difference
in the material balance calculations to be +17.5% which means the amount of
methanol increases inside the column. In a closed system where no other
material is added and there is no room for chemical reaction to occur in terms

- 70 -
of increase the amount of methanol, the situation is assumed to occur because
of weaknesses due to the model and data provided.
Because of the low boiling temperature for methanol, the chemical properties
compared to water and the distribution of methanol in the process it is
assumed that the use of Distillation Column alone in HYSYS is not suitable
for the process of separate water and methanol.

- 71 -
8.3 EVALUATION OF CASE 2: ETHANOL
Similar to Methanol, Ethanol has a lower vapour pressure compared to water
and will react in the same manner as Methanol, as described in section 8.2.
The boiling temperature for Ethanol, as illustrated in Table 3 is 78.4°C, and
temperature for Condenser used in the distillation column is recommended of
HYSYS to be slightly above boiling point. See Table 5.
Table 13 illustrates the total Material Balance in the case with Ethanol used as
THI. Similar to Case 1: Methanol, the calculations indicate a flow rate higher
out of the system than in to the system, with an error of 0.564 kg/h. An
increase of flow rate in a closed system where there is no access to other
materials is unrealistic and this error is due to a weakness in the operation.
HYSYS calculates the flow rate without decimals, so this may be a reasonable
assumption in relation to the error in case 2.
The distillation process gives a perfect distribution of ethanol as 100% lean
ethanol leaves the Distillation Column as vapour. All amount of ethanol is
evaporated to the vapour phase through the condenser because the high
temperature in the condenser. However, the Distillation Column works
properly in terms of perfect distribution, but the amount of ethanol left after
transportation is minimal. As illustrated in Table 13 only 0.328 kg/h out of 2000
kg/h is left when the water stream enters the Distillation Column. In this case
I would recommend a simplified method which is less costly.
Differently to case 1, ethanol will distribute mainly in the liquid phase and gas
phase and just a small amount will be dispersed into aqueous phase. This is
illustrated in Table 12.
Because of the low boiling temperature for ethanol, the chemical properties
compared to water and the over mention reason it is assumed, similar to case
1, that the Distillation Column used in HYSYS is not suitable for the process

- 72 -
of separate water and ethanol. Alcohols have different properties than glycols
and are usually not preferred as THI in the petroleum industry. Methanol is a
better choice than ethanol due to chemical properties.
Table 13; Material Balance for THI in Case 2: Ethanol indicates a difference
in the material Balance calculations to be + 24.6%. The reason for the
increased amount of ethanol is assumed to be similar to that in Case 1.
Compared to Case 1 is the increase of THI slightly higher in Case 2. This is
due to the chemical properties of methanol and ethanol and their different
solubility in water.

- 73 -
8.4 EVALUATION OF CASE 3: MEG
Table 6 and Table 16 illustrate the distribution of THI in the system and
confirm that the distillation column works properly in the situation with MEG
as inhibitor, with 100% of MEG dissociates as bottom product.
Compared to case 1 and 2, case 3 works best in terms of the amount THI left
after transportation. Table 17 shows the amount of MEG when entering the
processing plant; 979.8 kg/h out of 2000 kg/h.
The results refer to a perfect distribution of THI leading to a simplified
process for recycling. Since the bottom product stream containing pure
quantity of MEG, I will further conclude that the process is optimal for the
use of MEG as a THI
Boiling point for MEG is 198°C and Maximum Recommended Regeneration
Temperature is 163°C, as illustrated in Table 3. HYSYS recommends the
temperature in the Re-Boiler to be 150°C, see Table 5, which is lower than
both Boiling Point and Maximum Recommended Regeneration Temperature.
The low temperature of the Re-Boiler is the reason for the perfect distribution
and no amount of MEG left to the Vapour or Distillation stream.
Table 17; Material Balance for THI in case 3: MEG indicates a difference in
material balance calculations to be +29.5%. The value is higher than
Methanol and Ethanol respectively and is due to the different chemical
properties of alcohols compared to glycols. Refers to Table 3.

- 74 -
8.5 WEAKNESSES AND LIMITATIONS
The simulations done are simplified models designed to obtain a clear view of
the processes involved, comparison of the three different cases and an
overview of produced fluid composition, flow rates, temperatures and
pressures. The simulations do not represent the actual and completed process
flow diagram. This error is due to limited data available and data that might
not be up to date. In addition to this weakness due to previous work that is not
up to date is also a consideration.
The regeneration process involved in the gas dehydration would have given a
better understanding of the entire process and should have been included to
give a complete overview of the situation. The processes included in water
treatment, such as sand and salt removal as explained in section 5.2, should
also been included in the simulation. In addition to this, circulation pump,
heat exchangers and glycol storage tanks would have given a better
understanding of the processes involved. Alcohol will not be recirculated due
to economics and the storage process of alcohol is not included in this report.
Due to limitations when it comes to time and guidance this part is left out and
left for future improvement.

- 75 -
8.6 POTENTIAL IMPROVEMENTS AND SUGGESTIONS FOR
FURTHER WORK
The oil and gas industry is still under increasing researching about alternative
methods and other hydrate inhibitors that are cost-effective and
environmentally acceptable when it comes to multiphase flow to be
transported over long distances.
More comprehensive analysis of data from producing fields is required to
evaluate conservatism in design producers. This analysis should be performed
over a wide range of field types that are possible and should include both
successful development and plagued by Flow Assurance issues. By such a
methodical approach, it will be possible to accurately quantify the levels of
Flow Assurance risk and environmental consequences due to lost inhibitor in
the entire system (Watson 2003).
If the produced water is to be re-injected into the formation, it is important
that suspended solids are reduced to prevent potential blockage of the
receiving medium (Seureau et. al 1994). In this case de-sanding hydro
cyclones are commonly used for the separation of two phases. The process
can be used to separate solids or liquid from gases, to separate a lighter
dispersed liquid from and heavier continuous liquid or as in this case to
separate solids from liquid.
The over mentioned process is suggested as the next step in terms of separate
water from potential solids. There are some additional features that should be
considered and left for future improvements when designing a regeneration
plant:
Installing a flash separator before the regeneration column. This
separator removes the majority of the hydrocarbon that is dissolved in

- 76 -
the glycol.
Integrating heat exchangers, so the lean glycol is cooled by heating the
rich glycol, thus minimizing the energy consumption.
Glycol/alcohol make-up to replace the glycol/alcohol loss, stored in a
storage tank.
Because of these considerations the design of the regeneration process varies
with the design of the plant. The integration of heat exchangers is especially
important, because this reduces the overall energy consumption of the plant
(Christensen 2009).
An important question for further work is what is going to happen with the
amount of alcohol that leaves the Distillation Column if the process is too
expensive for recirculation.

- 77 -
CHAPTER 9
CONCLUSION
Based on data available and some modifications done it was possible to
simulate the regeneration unit in HYSYS. The following conclusions are
drawn:
Case 1 Methanol: The process does not act properly in terms of distribution;
the flow is dispersed and needs to be separated once more before the loop is
complete. This leads to a more advanced and costly process. It is assuming
that the use of Distillation Column alone in HYSYS is not suitable for the
process of separate water and methanol.
Case 2 Ethanol: The distillation process gives a perfect distribution of ethanol
with 100% lean ethanol leaving the Distillation Column as vapour. All
amount of ethanol is evaporated to the vapour phase because of the high
temperature in the condenser. The amount of ethanol left after transportation
is minimal which means a simplified and less costly unit would be
recommended in terms of separating ethanol and water.
Case 3 MEG: A perfect distribution of MEG as THI leading to a simplified
process for recycling. Since the bottom product stream containing pure
quantity of MEG the process is optimal for the use of MEG as a THI.
The HYSYS results verify the theory about a Distillation Column carried out
in earlier part of the report; in a mixture with water, alcohol act as the light
product and dissociate at the top of the column while glycol act as the heavy
product and dissociates at the bottom of the column.

- 78 -

- 79 -
REFERENCES
Akbarzadeh, K., Hammami, A., Kharrat, A. et al. 2007. Asphaltenes –
Problematic but Rich in Potential. Oilfield Review. Edmonton, Alberta,
Cananda.
Aker Solutions. 2013. Best of Both worlds.
http://www.akersolutions.com/en/Global-menu/Media/Feature-
stories/Engineering/Best-of-both-worlds/
Aspen Technology Inc. HYSYS. Version 2006.
Aylward G.H and Findlay T.J.V. 2007. SI Chemical Data. London: John
Wiley and Sons Ltd.
Baker Hughes. Asphaltene, Paraffin Control, PPDs,
http://www.bakerhughes.com/products-and-services/production/upstream-
chemicals/flow-assurance-services/asphaltene-paraffin-control-ppds (accessed
2 June 2013).
Bukey, J.S. 2005. Introduction to Asphaltene. Petrophysics and Surface
Chemistry. New Mexico Tech. Petroleum Recovery Research Centre.
Socorro, USA.
Chandraguptan, B. 2003. An Insight to Inhibitors. PetroMin Pipeliner, July-
Sept 2011
Christensen, D.L. 2009. Gas Dehydration: Thermodynamic Simulation of the
Water/Glycol Mixture. MS thesis, Aalborg University, Esbjerg, Denmark
(February 2009).
Corrosion Doctors. 2012. Corrosion Theory. http://corrosion-
doctors.org/Principles/Theory.htm (accessed 9 November 2012).

- 80 -
C&I: Engineering, Procurement and Total Project Management. (2013).
Webpage. (accessed 1 May 2013). www.cieng.com
Ditria, J.C. and Hayack, M.E. 1994. The Separation of Solids and Liquid with
Hydrocyclone-Based Technology for Water Treatment and Crude Processing.
691-706. Paper SPE 28815 presented at the SPE Asia Pacific Oil & Gas
Conference, Melbourne, Australia, 7-10 November.
Dow Chemical Company. (unknown date). Viewed 11.2012:
http://www.dow.com/ethyleneglycol/prod/teg.htm
Dugstad, A. 1998. Mechanismn of Protective Film Formation During CO2
Corrosion Carbon Steel. Paper No. 31. NACE International.
Far North Liquids And Associated Gas System (FLAGS) Pipeline. (Unknown
date). (Accessed 7 December 2012). http://abarrelfull.wikidot.com/far-north-
liquids-and-associated-gas-system-flags-pipeline.
Goual, L., Firoozabadi, A. 2002. Measuring Asphaltenes and Resins, and
Dipole Moment in petroleum Fluids. AIChE Journal.
Guerra, M.J. 2006. Aspen Process Engineering Webinar. Aspen HYSYS
Property Packages – Overview and Best Practices for Optimum Simulations.
Barcelona, Spain.
Gudmundsson, J.S. 2009. Compendium in TPG 4135 – Processing of
Petroleum. Department of Petroleum Engineering and Applied Geophysics.
NTNU:Trondheim.
Gupta, N. (November 2012). Overview of Ormen Lange Project. Shell.
NTNU.
HYSYS 2004.2 Simulation Basis, Version 2004 Basis Manual. (2005).
Cambridge, USA.

- 81 -
HYSYS 3.2 Operations Guide, Version 2003 User Guide. (2003). Cambridge,
USA.
Independent Environmental Impact Classification Norway. Hunting.
(Unknown date). (Accessed 20 October 2012). www.huntingclearrun.com
Kidnay, A.J. andParish, W.R. 2006. Fundamentals of Natural Gas
Processing. CRC Press Taylor & Francis Group.
Lanner. 2013. Simulation and Simulation Software Explained. United
Kingdom. www.lanner.com (accessed 4 May 2013).
Lederhos et al. 1996. Effective Kinetic Inhibitors for Natural Gas
Hydrates.Chemical Engineering Sciece, Volume 51. Elsevier.
http://dx.doi.org/10.1016/0009-2509(95)00370-3
Manning, F.S. and Thompson, R.E. 1991. Oilfield Processing of Petroleum –
Natural Gas. Oklahoma: Pennwell Publishing Company.
Marathon Petroleum Company (Norway) LLC. (January 2009). Søknad om
utslippstilatelse for Alvheimfeltet inkludert Volund og Vinje.
Martinez, I. 1995. Properties of some particular solutions. Professor of
Thermodynamics. Spain:Madrid
Maslin, R., Milburn, F.H., Sutton, J.N., 1987. Flags Pipeline: Two-Phase
Flow Modelling and Validation of Predictions. Offshore Technology
Conference. Texas:Houston.
Merus. 2013. Pitting – Corrosion. http://www.merusonline.com/in-
general/pitting
Mokhatab, S.,Wilkens, R.J, Leontaritis, K.J. (December 2006). A review of
Strategies for Solving Gas-Hydrate Problems in Subsea Pipelines. Energy
Sources, Part A: Recovery, Utilization and Environmental Effects.

- 82 -
Offshore Centre Danmark. (January 2008). Offshore Book – An introduction
to the offshore industry. Denmark.
Optimize Glycol Circulation And Install Flash Tank Separators In Glycol
Dehydrators. (October 2006). Lessons Learned from Natural Gas STAR
Partners. Washington.
OSPAR Comission. 2008. Convention for the protection of the marine
environment on the north-east atlantic. Preparations used and discharged
offshore which are considered to pose little or no risk to the environment.
London, United Kingdom.
OSPAR Comission. 2012. Discharges, Spill and Emissions from Offshore Oil
and Gas Installation in 2009, including the assessment of data reported in
2008 and 2009. London, United Kingdom. ISBN 978-1-907390-83-8.
Owren, G. (February 2012). Multiphase and flow assurance technology.
Statoil. Trondheim.
Pickering, P.E., Edmonds, B., Moorwood, R.A.S. et al. (Unknown date).
Evaluation new chemicals and alternatives for mitigating hydrates in oil and
gas production. FEESA, Enabling truly integrated decision making.
Pilling, M. and Holden, B.S. 2009. Choosing Trays and Packing for
Distillation. CEP Magazine September 2009. AiChE, USA.
Ramstad, K. 2012. Water Production and related Challenges. Statoil, Flow
Assurance guest lecture. Trondheim: NTNU.
Sandengen, K. (October 2012). Hydrates and Glycols. Trondheim:NTNU.
Seureau, J.J and Hoyack, M.E. 1994). A Three-Phase Separator for the
Removal of Oil and Solids from Produced Water. 193-202. Paper SPE 28535
Presented at the SPE 89th
Annual Technical Conference and Exhibition, New
Orleans, LA, U.S.A, 25-28 September.

- 83 -
Shakhasiri. (Feb 2009). Chemical of the Week: Ethanol. General Chemistry.
(Accessed 23 November 2012). www.scifun.org
Statoil. 2007. About Flow Assurance. (accessed 6 June 2013).
http://www.statoil.com/en/technologyinnovation/fielddevelopment/flowassura
nce/pages/default.aspx
Statoil. 2009. Avleiring. (accessed 6 June 2013).
http://www.statoil.com/no/TechnologyInnovation/FieldDevelopment/FlowAs
surance/Scale/Pages/default.aspx
Steinbakk, C.H. 2012. Hydrate Inhibition – and the environmental impact.
Student Project, TPG4140 Natural Gas. NTNU. Trondheim, Norway.
Stokkenes, A. (March 2012). Wax Control. Flow Assurance guest lecturer.
Trondheim:NTNU.
Sloan Jr., E.D. 2000. Hydrate Engineering. Monograph volume 21. SPE.
(p.59-62).
Shell international, Flags Pipeline, oil&Gas UK. (Unknown date). High level
capacity information & infrastructure specific information for prospective
users. (Accessed October 2012). http://www-
static.shell.com/static/gbr/downloads/upstream/segal_icop_ullage_2012.pdf
Shell UK Limited website. (Unknown date). Access to upstream oil and gas
infrastructure. (Accessed 23 October 2012). http://www-
static.shell.com/static/gbr/downloads/upstream/segal_icop_ullage_2012.pdf
A/S Norske Shell. 2013. (Accessed 28 May 2013).
http://www.shell.no/products-services/ep/ormenlange/en/facts.html
Sum, K.A., Koh, C.A., Sloan, E.D. 2012. Developing a Comprehensive
Understanding and Model of Hydrate in Multiphase Flow: From Laboratory
Measurements to Field Applications. Centre for Hydrate Research. Chemical

- 84 -
and Biological Engineering Department. Colorado School of Mines. Golden.
United States.
Sørli, J.G.H. 2010. MEG Regeneration for Floating Production Units. Aker
Process Systems A. FPSO Seminar. Holmen Fjordhotell, Nesbru, Norway.
Time, R.W. 2011. Flow Assurance and Mulitple Flow Part 2. Department of
Petroleum Engineering, University of Stavanger.
Trend News Agency. 2013. SOCAR: Decision to select gas pipeline for
Azerbaijani gas transportation to be made in May 2013. Baku, Azerbaijan.
Undergroundsolution.com. (Accessed May 2013).
U.S. Minerals Management Service. (March 1999).Gulf of Mexico Region.
Offshore Information.
Watson, M., Pickering, P., Hawkes, N. 2003. The Flow Assurance dilemma:
Risk Vs. Cost?. FEESA.

- 85 -
ABBREVIATIONS
CAPEX Capital Expenditure
EOS Equation of State
EtOH Ethanol
FLAGS The Far North Liquids and Associated Gas System
HE Hydrate Envelope
HOCNF Harmonised Offshore Chemical Notification Format
HSE Health, Safety and Environment
MEG Mono-ethylene Glycol
MeOH Methanol
OPEX Operational Expenditure
P Pressure
PLONOR Pose Little Or No Risk
T Temperature
THI Thermodynamic Hydrate Inhibitor

- 86 -
APPENDIX – A
A1 - PROCESS SIMULATIONS HYSYS
Reservoir conditions:
Temperature TRes = 90°C
Pressure PRes = 290 bar
Gas Flow Rate qg = 1.133 x 10⁶ kg/h
Water Flow Rate qw = 3000 kg/h
Wellhead conditions are assumed to be 80% of reservoir conditions:
Temperature TWH = 72°C
Pressure PWH = 230 bar
Flow Rate qg = 1.131 x 10⁶ kg/h
Gas Stream to three-Phase separator:
Flow = 1.133e6 kg/h
Temperature = - 13.08 C
Pressure = 21.26 bar
Injected THI:
P = 200 bar
T = 60 C
Flow Rate = 2000 kg/h
Glycol
MEG
Lean MEG flow = 1817 kg/h
Lean MEG temperature = 150 °C
Lean MEG pressure = 1.1 bar

- 87 -
Alcohol, Vapour stream out of Distillation Column
Type: Methanol
Mass Flow = 1021 kg/h
Temperature, TMeOH = 82 °C
Pressure = 0.8 bar
Type: Ethanol
Mass Flow = 8.799 e(-5) kg/h
Temperature TEtOH = 51.54 °C
Pressure =1.1 bar
FIGURE 35 “PRINT SCREEN” OF THE GAS PLANT SIMULATION DONE IN HYSYS
The fluid at wellhead is further mixed with hydrate prevention inhibitor with a
flow rate at 2000 kg/h (qInhibitor = 2000 kg/h). The flow rate is equal for
injected alcohol and glycol, and the temperature and pressure conditions are
equal to fluids at the wellhead. The rate is equal for MeOH, EtOH and MEG
related to comparison of the different situations. It should be noted that this is
a simplified system. To get accurate values of the needed amount the rate
should be calculated from Hammerschimd’s equation. This part is left for
future improvement. It is in this case assuming 100% lean THI. This is not a

- 88 -
realistic case only a simplified assumption, and will in this report not be
studied any further.
The stream is transported to the terminal through a pipeline at the seabed.
Specifications for the pipe are given as:
Length = 100 km
Elevation = 900 m
Outer diameter OD = 30”
Roughness = 4.572 x 10⁻⁵
Ambient Temperature = 2.5°C
Overall Heat Transfer Coefficient, U = 11 W/Km2
The pipeline is kept as one segment, which is a simplified view of the
topography. The pressure at the terminal is specified to be 120.8 – 90.02 =
30.78 bar and temperature equals to -11.25°C for the gas stream with
Methanol as a hydrate prevention inhibitor. The temperature varies with
different inhibitor used in the system. It should be noted that this figure does
not represent the actual and completed process flow diagram, but is a
simplified version designs to obtain correct information about the produced
fluid composition, phase envelope, flow rates, temperatures and pressures.
A2 - LOSS OF THERMODYNAMIC HYDRATE INHIBITOR DURING
TRANSPORTATION
TABELE 19 HI LOST FROM THE SYSTEM DURING TRANSPORTATION FROM WELLHEAD TO THE
THREE-PHASE SEPARATOR AT THE LAND-BASED TERMINAL
1: Methanol 2: Ethanol 3:MEG
Loss of THI during Transportation
Amount of lost THI [kg/h] 1433.5 1206.9 1206.9
Lost THI [%] 71.68 60.35 60.35

- 89 -
Table 19 indicates the loss of THI during transportation from wellhead to
three-phase separator. THI is injected at the wellhead and mixed with the feed
before the mixed stream passes through a 100 km long pipeline to the land-
based terminal. At the land based terminal the stream enters a three-phase
separator.

- 90 -
FIGURE 36 “PRINT SCREEN” OF THE ENTIRE SIMULATION PROCESS, FOR CASE 1: METHANOL USED AS
THI

- 91 -
FIGURE 37 “PRINT SCREEN” OF THE ENTIRE SIMULATION PROCESS, FOR CASE 2: ETHANOL USED AS
THI

- 92 -
FIGURE 38 “PRINT SCREEN” OF THE ENTIRE SIMULATION PROCESS, FOR CASE 3: MEG USED AS THI

- 93 -
APPENDIX – B
FLAG SYSTEM
The Far North Liquids and Associated Gas System, FLAGS (UK), was
developed for the utilisation of associated gas from oil fields located in the
northern sector of the North Sea (Maslin et al., 1987). There are four main
pipeline systems in the U.K that are transporting natural gas from offshore
platforms to coastal landing terminals. Shell operates the 283-mile FLAGS
that transports associated gas deposits from the Brent oil system to the
receiving terminal at St. Fergus in Scotland.
Once brought onshore, the responsibility for transporting natural gas
throughout the country belongs to the utilities operating in the U.K. In 2003, it
was reported that the 283-mile, 36-inch FLAGS transported 760 million cubic
feet per day (Mmcf/d) of associated gas.
Natural gas from the Norwegian Statfjord Oil and Gas Field is transported
through the Tampen pipeline and Gjoa/Vega through the Gjoa pipeline,
linking Norwegian and UK gas trunk line networks. Tampen Link runs for
23.1 kilometers from the Statfjord Oil and Gas Field to a Flags tie-in, as
illustrated in figure 7 and 8.

- 94 -
FIGURE 9: FLAG SYSTEM NORTH SEA. (SHELL INTERNATIONAL 2012)
Entry specification made from FLAGS indicates that Shipper gas should be
technically free from any objectionable odours and dust or other matters, in a
solid, liquid or gaseous state.
It specifies that waxes, gums, gum forming constituent which cause injury to
or interference with the operation of the lines, meters, regulator or other
appliances through which it flows (Shell, 2012 ). Table 20 gives an overview
of the specifications given for FLAGS.

- 95 -
TABLE 20 SPECIFICATIONS GIVEN FOR FLAGS (SHELL 2012)
Components: Maximum allowance:
CO2 1.6 %vol
H2S 2.5 ppmv
Total Sulphur 15 ppmv
H2O 35 ppmv
Cricondenbar 105 bar
O2 10 ppmv
Mercury 0.01 μg/m3
Non-hydrocarbon content 5.5 mol%
C3+ (propane and heavier) 5.5 mol%
Nominal wet gas capacity 30 million Sm3/d

- 96 -
APPENDIX – C
CALCULATIONS
Calculation from table no. 2 in chapter 7.2, 7.3 and 7.4:
Calculations for Mass Balance THI, table no. 3 in chapter 7.2, 7.3 and 7.4
Case1; Methanol:
Case 2; Ethanol:
Case 3; MEG:


