Distribution of Competences in relation to Regional...
270
Contract No. 2008.CE.16.0.AT.040 / 2008.CE.16.CAT.014 Distribution of Competences in relation to Regional Development Policies in the Member States of the European Union FINAL REPORT SUBMITTED BY: FEBRUARY 2010
Transcript of Distribution of Competences in relation to Regional...

Contract No.
2008.CE.16.0.AT.040 / 2008.CE.16.CAT.014
Distribution of Competences in relation to Regional Development Policies in the Member States of the
European Union
FINAL REPORT
SUBMITTED BY:
FEBRUARY 2010

ISMERI EUROPA – APPLICA
2
TABLE OF CONTENTS
EXECUTIVE SUMMARY................................................................................................................4
GLOSSARY......................................................................................................................................14
INTRODUCTION............................................................................................................................17
CHAPTER 1. LITERATURE REVIEW: FORMS THAT THE DISTRIBUTION OF COMPETENCES BETWEEN CENTRAL AND SUB-NATIONAL LEVELS MAY TAKE..20
1.1. FORMS OF DECENTRALISATION .................................................................................................20 1.2. FORMS OF INTERGOVERNMENTAL RELATIONSHIPS....................................................................21 1.3. GOVERNMENT SYSTEMS............................................................................................................22 1.4. GLOBAL FACTORS DRIVING DECENTRALISATION IN EUROPE ....................................................25 1.5. SUB-NATIONAL TAX AND FISCAL FEDERALISM..........................................................................27 1.6. FINAL CONSIDERATIONS ON CHAPTER 1 ...................................................................................32
CHAPTER 2. MAIN FEATURES OF THE TRENDS IN DECENTRALISATION OBSERVED IN EUROPE OVER THE PAST FIFTEEN YEARS ............................................34
2.1. INTRODUCTION .........................................................................................................................34 2.2. TRENDS OF DECENTRALISATION IN EUROPE..............................................................................34 2.3. MAIN FEATURES OF THE DECENTRALISATION PROCESS IN THE EUROPEAN COUNTRIES .............35 2.4. CONSULTATION MECHANISMS BETWEEN SUB-NATIONAL GOVERNMENTS.................................42
2.4.1. General overview ..............................................................................................................42 2.4.2. Examples of institutional arrangement for coordination ..................................................44
2.5. THE EUROPEAN OUTLOOK: EXPENDITURE AND REVENUE OF DIFFERENT ADMINISTRATIVE LEVELS ............................................................................................................................................53
2.5.1. Expenditure .......................................................................................................................53 2.5.2. Revenue .............................................................................................................................69
2.6. FINAL CONSIDERATIONS ON CHAPTER 2....................................................................................77
CHAPTER 3. THE EVOLUTION OF COMPETENCES IN THE AREAS RELEVANT FOR REGIONAL DEVELOPMENT .....................................................................................................79
3.1. COMPETENCES ON DEVELOPMENT POLICIES IN DIFFERENT GROUPS OF EU MEMBER STATES ...79 3.1.1. Federalised States .............................................................................................................79 3.1.2. Regionalised states ............................................................................................................81 3.1.3. States with ‘Northern systems’ ..........................................................................................83 3.1.4. Other Unitary States..........................................................................................................84
3.2. AN ANALYSIS OF EXPENDITURE IN THE SECTORS MOST RELEVANT FOR REGIONAL DEVELOPMENT.................................................................................................................................90
3.2.1. The definition of public expenditure for development.......................................................90 3.2.2. The scale of expenditure for development.........................................................................92 3.2.3. Expenditure for development: a focus on its composition ..............................................104
3.3. FINAL CONSIDERATIONS ON CHAPTER 3 .................................................................................110
CHAPTER 4. TERRITORIAL DISTRIBUTION OF COMPETENCES................................112 4.1. INTRODUCTION .......................................................................................................................112 4.2. MAIN RESULTS FROM THE COUNTRY STUDIES.......................................................................114

ISMERI EUROPA – APPLICA
3
4.2.1. Austria .............................................................................................................................114 4.2.2. Germany ..........................................................................................................................121 4.2.3. Spain................................................................................................................................129 4.2.4. Italy..................................................................................................................................136 4.2.5. France .............................................................................................................................145 4.2.6. The UK ............................................................................................................................150 4.2.7. Sweden.............................................................................................................................159 4.2.8. Portugal...........................................................................................................................162 4.2.9. Poland .............................................................................................................................166 4.2.10. Hungary.........................................................................................................................170 4.2.11. Czech Republic ..............................................................................................................174
4.3. FINAL CONSIDERATIONS ON CHAPTER 4 ..................................................................................176
CHAPTER 5. CONCLUSIONS AND POLICY IMPLICATIONS ..........................................181
6. REFERENCES...........................................................................................................................191
7. ANNEX 1 – COUNTRY NOTES (MS NOT COVERED IN THE CASE STUDIES).........194 7.1. BELGIUM.................................................................................................................................194 7.2. LUXEMBOURG.........................................................................................................................199 7.3. DENMARK...............................................................................................................................203 7.4. FINLAND .................................................................................................................................207 7.5. THE NETHERLANDS ................................................................................................................211 7.6. SLOVENIA ...............................................................................................................................215 7.7. IRELAND .................................................................................................................................218 7.8. GREECE...................................................................................................................................222 7.9. SLOVAKIA...............................................................................................................................226 7.10. MALTA..................................................................................................................................229 7.11. LATVIA .................................................................................................................................232 7.12. LITHUANIA............................................................................................................................236 7.13. ESTONIA ...............................................................................................................................240 7.14. BULGARIA.............................................................................................................................243 7.15. ROMANIA..............................................................................................................................247 7.16. CYPRUS.................................................................................................................................251 7.17. CZECH REPUBLIC ..................................................................................................................254
8. ANNEX 2 - METHODOLOGICAL APPROACH: FINAL CLASSIFICATIONS AND TEMPLATES.................................................................................................................................258
8.1. INTRODUCTION .......................................................................................................................258 8.2. MAIN IMPROVEMENTS TO THE METHODOLOGICAL APPROACH SPECIFIED IN THE INCEPTION PHASE ............................................................................................................................................258 8.3. DEFINITION OF MAIN CLASSIFICATIONS ...................................................................................259 8.4. FINAL TEMPLATE FOR IN DEPTH COUNTRY ANALYSIS..............................................................264
9. ANNEX 3 - NOTE ON ACCOUNTING CONSIDERATIONS WITH SPECIAL REFERENCE TO THE UK BUT OF GENERAL APPLICABILITY ....................................268

ISMERI EUROPA – APPLICA
4
EXECUTIVE SUMMARY Introduction The present report is the final output of a study, launched by the DG REGIO in the fall of 2008, to obtain a thorough picture of the distribution of competences between the different administrative levels1 in the Member States of the European Union. The study concentrates on competences in relation to regional development, in the areas supported by the EU Cohesion Policy, with a particular focus on the budgetary aspects. In order to pursue such objective, the study team has first carried out a literature review on forms that the distribution of competences may take and on definitions of categories of expenditure as well as functions of government. A methodological framework was set up to cross-analyse Member States. Eurostat data was then collected, processed and examined to identify main trends on expenditure and revenues in Europe during the last 15 years. Moreover, eleven country analyses were carried out in collaboration with national experts to collect detailed regional data from national sources and information on distribution of competences, its evolution and the role of EU Cohesion Policy in development across different regions. Forms that the distribution of competences between levels of government may take Europe has experienced a trend redistribution of competences from central towards sub central levels of government over the past decades. Globalisation, European enlargement, the revival of concern with local identity, subsidiarity, Cohesion Policy and the
1 Central government, regions, provinces, and municipalities.
crisis of welfare state all contributed to this process. Decentralisation has three main components: political, fiscal and administrative. Administrative decentralisation may take, and has actually taken in the EU, different forms ranging from de-concentration (assignment of responsibility from one level of the central government to another), to delegation (redistribution of authority to a government agency or local unit) and devolution (authority and resources are assigned to a fully independent public authority). Moreover, different forms of intergovernmental relationships between levels of government exist both in theory and reality: dependence, separation, cooperation or competition for attracting resources. The combination of the different forms of decentralisation and of intergovernmental relationships are constitutive parts of different types of government systems. These can be confederal, federal and unitary. In the last case, the central government holds the entire sovereignty even though there are examples of unitary systems characterised by a strong tradition of local autonomy (e.g. the Nordic Countries). The literature also refers sometimes to regionalised systems in relation to European countries that have established an intermediate level of government. Empirical observations demonstrate that there is no strong correlation between the degree of institutional decentralisation and the level of fiscal autonomy of sub-national authorities. The relevance of the historical and political roots of the way in which institutions are organised and operate give rise to significant differences between institutional and fiscal systems. As regards the distribution of competences between different level of government, the theory of fiscal federalism sets out a general framework for the assignment of functions. In principle, the basic responsibility for stabilisation and redistribution policies, together with some non-local functions such

ISMERI EUROPA – APPLICA
5
as defence, should bee allocated to the central government. Decentralised levels of government, on the other hand, should provide those public goods and services for which consumption patterns differ across regions, therefore tailoring the supply of these to local preferences. There is a considerable degree of uncertainty in some cases in relation to specific allocation of functions between administrations, type of taxes, levies and grants to be used. This is one of the reason for the variety of patterns of central and sub-national provision in respect to the same goods and services which is examined in the analysis of European MS carried out as part of the study. Main features of the trends observed in Europe over the past fifteen years To analyse the trends in redistribution of competences in the EU, the study distinguishes between four typologies of organisation of state: “federal states”, “regionalised states”, countries with “Northern systems” and “other unitary” states. Federal States (Germany, Austria and Belgium) are characterised by a central government and regional authorities both with own legislative and administrative competences. These are exercised independently and recognised by the Constitution. Countries such as Italy and Spain can be considered regionalised. They have established an intermediate level of government with a wide set of competences. At the moment despite a push towards increasing importance of regions also in traditionally unitary states such as the UK, Sweden and some of the EU12 countries, no other European case matches the degree of regionalisation that characterises Italy and Spain.
States with northern systems (Sweden, Finland and Denmark), typically Scandinavian, are unitary countries where local governments have a wide range of responsibilities in relation to regional development. Unitary States, where the central government is predominant, can be found among both the EU15 (France, Portugal, the UK, Greece, Ireland, The Netherlands and Luxembourg) and the EU12 (Czech Republic, Hungary, Poland, Bulgaria, Cyprus, Estonia, Latvia, Lithuania, Malta, Romania, Slovakia and Slovenia). These countries are very heterogeneous in terms of history, size and so on and some of their specific features determine the degree of decentralisation which is relatively high in some cases (e.g. the Netherlands, Slovenia and Lithuania) and very limited in others (e.g. Ireland, Greece, Bulgaria, Romania and Malta). On average, the share of sub-national government in general government expenditure is nowadays highest in countries with a “Northern system”, in the federal and in the regionalised countries.
Sub-national government expenditure as a % of General Government Expenditure
20
30
40
50
1990
1991
1992
1993
1994
1995
1996
1997
1998
1999
2000
2001
2002
2003
2004
2005
2006
2007
% o
f gen
eral
gov
ernm
ent e
xpen
ditu
re
Federal states "Regionalised" states "Northern systems"
Other Unitary states Total
Source: Eurostat Since the 1990s, the share of sub-national government spending in GDP has been fairly stable for Europe on average. A significant increase can however be observed in some cases (e.g. Belgium, Denmark and Spain) while the opposite occurred in others (e.g. Ireland, the Netherlands, and Austria).

ISMERI EUROPA – APPLICA
6
Current expenditure absorb in most countries the major part of total sub-national expenditure and is particularly high in countries where sub-national governments manage education, healthcare and social protection (in the Nordic countries current expenditure absorb 94% of total sub-national government expenditure). On average, during the past 15 years the weight of current sub-national expenditure in total expenditure has increased in almost all countries. Sub-national governments play an important role in relation to capital expenditure particularly in federal and regionalised states where more than 2/3 of capital expenditure are undertaken at the sub-national level. The disaggregation of capital formation by economic function shows that sub-national governments mainly carry out expenditure on economic affairs, housing and community amenities, education and recreation and culture. In most EU15 countries, economic affairs account for the largest share. Gross capital formation in economic affairs is higher at the sub-national level than at central level in most EU15 countries. There are relatively clear signs of increased decentralisation of Gross Capital Formation in Belgium, Spain, Sweden, the UK and Lithuania, insofar as this category of expenditure at the sub-national level has risen relative to GDP, while it has fallen relative to GDP at the central government level. The figures on revenue raised at the sub-national level in EU countries correspond very closely to the respective figures for sub-national government expenditure. This suggests that local and regional authorities are responsible for raising the funds to finance their expenditure. In around half the EU countries, both sub-national government revenue and sub-national government expenditure have increased relative to GDP. In some of them, the increase in revenue has exceeded the increase of expenditure, so that there has been a potential expansion of financial means available at the sub-national level. This is the case in Slovakia
and Poland as well as in Belgium, Sweden, Portugal, France and to a lesser extent, Spain and Italy. In the other countries sub-national government revenues relative to GDP have decreased, possibly giving rise to increased pressure on sub-national budgets. This is the case in Austria, Finland and the Netherlands as well as in Hungary, Lithuania and Bulgaria. Regarding the structure of sub-national government revenue it varies markedly between countries. In Sweden, Finland, Germany and Romania, the predominant part (more than 70%) are direct revenues, mainly tax revenues. The proportions of direct and indirect revenues are the opposite in the UK, Ireland, the Netherlands, Malta and Bulgaria. In these countries, revenue at the sub-national level come predominantly from transfers. The evolution of competences in the areas relevant for regional development The distribution of competences in relation to development is in line with the more general distribution of competences for public expenditure. As expected, more decentralised countries assign larger responsibility to regional and local authorities. However, there are also many less obvious features: - Federal and regionalised states do not
show major differences in the distribution of competences. Clearly, competences, allocation of funds and related policy decision-making processes have not the same legal status in the two types of state but the basic “division of labour” between central and decentralised administrations, in development policy, is not so different;
- Similar observations can be made for States with northern systems, where not only local administrations, but also intermediate levels of administration experience an increasing role in development policy;
- In unitary States very different national models of competence distribution coexist but there are many cases characterised by local administrations with a significant

ISMERI EUROPA – APPLICA
7
role in all, or many, policy areas relevant for development;
- In many cases, cutting across all the typologies of states, competences are shared between different administrative levels, and hence in many policy areas relevant for development, co-decision or coordination between different administrative levels is necessary;
- In general, the analysis shows that decentralised governments have more power in competences linked to territorial management (the environment, urban policy, culture, etc.) and in some important public services (housing, social services, public utilities, etc.). Instead, the central level has more power in infrastructure (energy, transport, etc.) and national standardised services (education, public safety) or in policy which is not territorialised (R&D).
In relation to budgetary aspects, the expenditure for development has been analysed in the Member States of the EU. The expenditure for development (EfD) is an aggregate of public expenditure which embraces the eligible expenditure under EU Cohesion Policy and is directly comparable with it. On the basis of an estimation characterised by a certain degree of approximation, the EfD amounted to EUR 645 per capita in the period 2002-2007 in the EU27, equivalent to 2.9% of GDP and 14.4% of gross fixed capital formation. There were significant differences in EfD in recent years between EU countries, both in value and as a % of GDP. In general, countries included in the Objective Convergence had a high level of EfD, in large part thanks to EU Cohesion Policy, even if per capita expenditure is still lower than in richer areas. At EU level, decentralised governments undertake 65% of total EfD. Over the period 2000-2007, EfD is estimated to have increased in real terms by more than GDP, the
main growth elements being central government and ‘economic affairs’.
EfD per head in different types of states by administrative level (2000-2007; EUR)
0
200
400
600
800
1,000
1,200
Federal Regionalised Northernsystems
Unitary(EU15)
Unitary(EU12)
EU27
Local gov.State gov.Central gov.
Source: Eurostat ‘Economic affairs’ is also the major element in EfD and involves around 50% of total expenditure (this function includes enterprise environment support, transport, telecommunications and other relevant policy fields). The remaining 50% is shared between environmental protection, housing and community amenities, health, recreation & culture, education.
EfD by function of government (General Government EfD=100; 2000-2007)
0%
20%
40%
60%
80%
100%
Federal Regionalised Northernsystems
Unitary(EU15)
Unitary(EU12)
EU27
Economic affairs Environment protectionHousing and community amenities HealthRecreation, culture and religion Education
Source: Eurostat Economic affairs and health are the least decentralised policy areas, 52% and 38% of their total expenditure, respectively, being decentralised.

ISMERI EUROPA – APPLICA
8
EU Cohesion Policy accounted for 11% of total EfD in the EU25 in the period 2000-2006 (2004-2006 for New Member States). In the countries of the Objective Convergence it is more important (up to 82% of total EfD in specific cases), but it also significant in other states: 7% of the total in Italy, 5% in Germany and 4% in UK. Only in 5 countries is contribution less than 3% of EfD (Austria, Belgium, Denmark, the Netherlands and Luxembourg).
EU Cohesion Policy support as % of EfD (annual average 2000-2006 and 2004-2006)
Slovakia
EstoniaPortugal
Poland
GreeceEU10
HungarySlovenia
Spain
Czech Rep.Malta
EU25
CyprusEU15
Ireland
Finland
SwedenAustria
Belgium
DenmarkNetherlands
Luxembourg
France
UK
Italy
Germany
Latvia
Lithuania
0 20 40 60 80 Source: Eurostat and DG Regio data In countries where data allow a very detailed functional analysis, the EU contribution proved to be more important in the enterprise environment, R&D and environmental protection.
Territorial distribution of competences An analysis of regional distribution of expenditure for development has been carried out in the countries covered in the case studies, based on data collected from national sources. The trends in public investment have been very different across Member States both at national and regional level. National choices, more than a common cycle, underlie these trends. As a consequence, EU Cohesion Policy co-existed with very different national contexts in terms of public investment growth. In recent years, development expenditure has tended to grow by less in Objective 1 regions than elsewhere in the countries examined. EfD has declined in Portugal, Germany and Italy and has been lower than in Objective 2 regions in Spain. Growth in the Objective 1 region in Austria were not particularly relevant. In Poland and Hungary, public expenditure expanded and this tend to favour less developed regions where public infrastructure endowment was deficient. The role of regional and local governments in managing development policies is significant (in general they account for over 50% of total expenditure), but can differ markedly not only across Member States (as stressed previously) but also within them and between regions. The share of local and state expenditure in total development spending ranges from 31% in London to more than 80% in Wales and to 96% in Bolzano (Italy). The large variation depends on institutional and policy arrangements which affect the distribution of competences between government levels and policy areas; the mix of these two factors can produce very different national and regional regimes. This is particularly true in countries with differing degrees of autonomy attributed to the regions (Italy, the UK), but it is also significant in other countries.

ISMERI EUROPA – APPLICA
9
Capital regions (or large metropolitan regions) often have special arrangements as regards the distribution of responsibility for development policy; the cases of Vienna, London, Stockholm and Lisbon are evidence of this. For these regions, the mix between national and local expenditure is different from the mix prevalent in other regions. The regional distribution of the EfD is only to a limited extent in line with cohesion and equality objectives. In general, the level of this expenditure relative to GDP is higher in less developed regions, but in these regions per capita expenditure is often lower than the national average. This means that the people living in these regions often benefit less from public investment than those in more developed regions and this in the long run can widen disparities in terms of the endowment of public goods and services. In general expenditure for development is oriented towards correcting territorial imbalances. The detailed regional analysis carried out for 10 Member States confirms that expenditure for development relative to GDP is normally higher in the less developed regions. However, the analysis also highlighted the fact that per capita expenditure is normally lower in these regions and, hence, its “propensity” to improve cohesion, or to contribute to convergence, more limited. The results of the analysis suggest the following points. The propensity towards cohesion of public investment is the product of a combination of different forces, which act in a different way according to the distribution of competences and the national institutional and budgetary arrangements. It is difficult to identify general models as regards the pursuit of the objective of equalising resources, but in federal and regionalised countries, local governments seem to manage resources according to GDP and central or state governments provide some rebalancing in cohesion terms. In centralised countries, this commitment seems to be more related to the local government level.
GDP and EfD per head
in selected countries and regions
National average per head= 100
Poorest and richest region
GDP per capita ranking
GDP Government Expenditure*
Burgenland min 66.6 84.3Austria
Wien max 139.0 95.9
Mecklenburg-W. Pomerania min 68.0 145.2Germany Hamburg max 171.7 109.6
Extremadura min 65.7 130.6Spain Comunidad de
Madrid max 132.6 95.2
Calabria min 69.1 141.6Italy
PA Bolzano max 141.2 379.2
Départements. d'outre-mer min 58.9 113.7France Île-de-France max 155.3 83.8
Wales min 75.8 86.1UK
London max 162.9 158.7
Östra Mellansverigen min 85.8 91.5
Sweden Stockholm max 137.3 117.7
Norte min 79.7 92.6Portugal Lisboa max 140.7 78.4
Podkarpackie min 69.4 82.6Poland
Mazowieckie max 155.2 143.4
Strední Morava min 78.0 93.4Czech Republic Prague max 208.0 174.2
Northern Great Plain min 63.6 78.3Hungary Central Hungary max 162.5 109.6
* General gov. in the case of Austria, Italy, UK, Sweden and Poland; State gov. in the case of Germany and Spain; Local gov. in the case of France, Portugal and Hungary. Source: National data collected by Ismeri Europa and Applica. The concentration of resources in the strongest regions is high in both cases, and the effort to equalise per capita investment in the different regions would require a large increase in investment expenditure. This point is crucial, because it underlines how difficult it is for the less developed areas to catch up in the context of the concentration of public investment in agglomerations to varying degrees, and, at the same time, how important it is to shift resources to the poorest regions to

ISMERI EUROPA – APPLICA
10
avoid a widening of disparities in GDP. This aspect has to be contextualised in relation to the level of economic development (in particular, agglomeration push is understandable in former communist countries, in which market economies have been built up in the recent years), but in any case it requires policy measures to bring about territorial spillover effects and to exploit the potential resources of the less developed areas.
Annual average change in real terms in EfD in selected countries by level of government
Level of government
Community Obj.
2000-2006 Central State Local General
obj.1 2.9 0.4 2.3 0.2Austria obj.2 8.2 -0.8 -2.3 -0.2obj.1 -6 n.a. n.a.Germany obj.2
4.3-1.1 n.a.
obj.1 n.a. 5.9 1 n.a.Spain obj.2 n.a. 8.7 11.1 n.a.obj.1 -4.9 2.1 -0.8Italy obj.2 -3.8 1.4 0
UK obj.2 3.9 12 9.4obj.1 14.2 -1 6.9Sweden obj.2 1.8 2.5 2.1
Portugal obj.1 -16.5 n.a. n.a.Poland obj.1 2.5 7.7 4.9Hungary obj.1 n.a. 1.8 n.a.
UK is considered entirely obj.2 because obj.1 regions are not distinguishable. Source: National data collected by Ismeri Europa and Applica. In conclusion, very rarely are the differences in GDP per capita completely balanced by differences in development expenditure, but in general a positive effort towards convergence prevails. Concluding remarks and policy implications A redistribution of competences towards sub-central levels of government took place in Europe in the last two decades. Autonomy and revenues of local government have also increased. However, financial devolution is particularly significant only in regionalised countries and
the need to respond through policy initiatives to the challenges posed by globalisation slowed down the devolution trend. The analysis of the distribution of competences in relation to development policies indicates the significant role of municipalities, both in unitary and decentralised States. On average, this level manages around 30% of public expenditure for development. How this expenditure can be included in broader development strategies, to support the whole region effectively without fragmentation of intervention, and the extent of involvement of local actors remain persistent questions for national and Cohesion Policy. Answering those questions is beyond the scope of this study. However, the results of the analysis underline the relevance of local development actions and the necessity of well defined governance at the municipal level in regional and national operational programmes. The possibility for Cohesion Policy to have in many countries a government level coinciding with the territorial level at which it is implemented (NUTS 2) does not seem to be feasible in the near future. At the moment, this is the case in only a relatively few countries (Italy, Spain and France and the small “single-region” states (Latvia, Lithuania, Estonia, Cyprus, Malta and Luxemburg), but in the remaining countries, it is not the case (in Germany, Austria, Belgium and in some degree the UK and the Netherlands, the relevant administrative level is NUTS 1)2. The development of “intermediate” institutions, which in the beginning was an implicit objective of the Cohesion Policy, has not been achieved. In countries supported to a large extent by EU Cohesion Policy, the economic rationale behind this aim clashed
2 UK has an intermediate situation with Nuts 1 regional level – Scotland, Wales, North Ireland – plus Regional Development Agencies in England.

ISMERI EUROPA – APPLICA
11
with resistance of the national context. In addition, other events (the enlargement, the single currency, as well as constitutional reforms) overcrowded the EU agenda. All this suggests that coordination between the central and local level remains fundamental for a successful EU Cohesion Policy. Sub-national governments as a whole are very important for public investment and for regional development. In total capital expenditure and in gross capital formation the share of sub-national government expenditure is larger than the share of central government and, in recent years, the EU27 average has reached 61% of total capital expenditure and 69% of gross capital formation. The role of sub-national governments is smaller as regards capital transfers. The role of sub-national level in public investment is largest in economic affairs, housing and community amenities, education and recreation, and culture because of increasing responsibility in these functions. Not surprisingly, the role of sub-national governments is most important in relation to territorial assets, while central governments maintain competence in relation to infrastructure, R&D and general aid-schemes. This division tends to vary according to the overall institutional arrangements3, but in general it corresponds with functional criteria and subsidiarity. On average, sub-central governments account for two-thirds of total development spending, approximately EUR 425 per head. In regionalised States, sub-central expenditure per head was higher than for the central level (e.g. in Spain EUR 560 versus. EUR 260 per head). In some northern systems as well as unitary States, there is an imbalance in favour of the central level (e.g. Greece, Slovakia and Slovenia). In many other unitary States, there is a prevalence of local government
3 Sub-national governments support 75% of the total GFCF in Federal states and states with “northern system”, 60% in unitary states and 65% in the new member states (not consolidated data).
expenditure (e.g. France and the Netherlands in the EU15, Poland in the EU12). Main competences of local governments for expenditure for development differ in relation to the country typology. In federalised countries, local authorities have competence in regulating issues of territorial importance such as traffic management and local public transport, building regulations and urban planning as well as some social services. In regionalised countries, central and intermediate levels of government tend to have shared competences in all areas relevant to economic development such as infrastructure, human resources, productive environment. In most sectors, the Central Government sets the basic legislation to guide the Regions. Countries with northern systems have an old tradition of decentralisation, especially with respect to the provision of services relevant to development. More recently, as mentioned above, efforts have been concentrated on increasing the efficiency of the spatial organisation of administrations, combining counties and municipalities into larger entities. Even though in recent years unitary states experienced to varying degrees, as stressed before, a process of increasing devolution of regional development policy, they remain very centralised. Competences in relation to infrastructure for development, human resources and business support schemes are either fully in the hands of central governments or the administration alone has been transferred to sub-national levels while decision-making remains a prerogative of the centre. The importance of EU Cohesion Policy for public investment is evident, as well as its capacity to balance territorial disequilibria and to favour a widespread distribution of growth potential. In this respect, Cohesion Policy has been fundamental to increasing the public investment capacity of Central and
ISMERI EUROPA – APPLICA
12
Eastern European countries, which have been engaged in a major effort to update infrastructure, as well as of Italy and Portugal, where budgetary policy was restrictive. The significant role of local governments in public investment policy derives from the distribution of competences and from the wide powers over territorial policy of local governments. In general, among development policy initiatives, central government manages business support schemes, R&D, higher education, labour market measures and large infrastructure projects. Consequently, Cohesion Policy is an important support to sub-national government expenditure, especially in Objective 1 countries where funding was largest. If we examine recent trends, expenditure for development increased by 4% per year in Europe since 2001. However, national variations did not follow a common trend, but mainly reacted to national budget policy. The growth was substantial in some cases (Austria, Belgium, the UK) and in most of the EU12, rather limited in the large countries of the EU15, and negative in other states (e.g. Portugal, Greece). As a consequence, it can be argued that the macroeconomic influence of Cohesion Policy has been diverse across the EU: in some cases it counterbalanced restrictive policies while in other cases it supported expansionary policies. Therefore the effects of Cohesion Policy, especially in Objective 1 regions where its impact was greatest, have been strongly influenced by the public finance context and varied according to overall expenditure for development. The growth of expenditure for development in EU after 2000 pointed also to an increasing role of central government as compared to sub-national governments. This was evident in the more decentralised States and could be regarded as a consequence of the will to increase only the most flexible and easiest to modify component of the expenditure. Moreover the growth trend shows a general penalisation of the weakest areas: in dualistic countries (Spain, Italy and Germany),
expenditure in Objective 1 regions decreased - or increased less than in other regions - and in Objective 1 countries (Portugal, Greece and the EU12) the increase in expenditure favoured the most advanced regions. Despite such penalisation of weak areas, the importance of the Structural Funds in avoiding an even more unbalanced distribution of public investment is evident (especially in Italy, Portugal and in many EU12 countries). The study also suggests some important directions for future research aimed at developing the analysis of expenditure for development further. The adopted definition of expenditure for development can support a clearer and more effective analysis of additionality in accordance with Structural Fund regulation. The possibility of linking the verification of additionality to data from national accounts (COFOG definition) was not an aim of the study, but it is its by-product. Additional work should be done to better fine-tune public expenditure and Structural Fund definitions and to develop a more practical and effective verification of additionality, as well as a territorialisation methodology for all the countries. The study confirms also the importance of having good data on public expenditure in order to understand the role of EU Cohesion Policy. Data and indicators of public expenditure should be connected to the monitoring systems of the EU NSRFs and of the Operational Programmes in order to assess the real contribution of the Structural Funds to the different policies. The world economic crisis, whose impacts are still uncertain in terms of size and duration, constrains public and private investment. Statistics can only capture these developments with a certain degree of delay and hence the effect of the crisis on investment will be shown in the years to come. Public intervention undertaken to mitigate the consequences of the crisis also led to a

ISMERI EUROPA – APPLICA
13
loosening of the effort to keep public debt under control. In the future, the needs to reduce public debt and comply with the parameters of the Stability Pact are likely to be a priority in the public agenda. In such context, keeping a high level of attention on investments for regional development, as in the present study, is of uttermost importance.

ISMERI EUROPA – APPLICA
14
GLOSSARY Capital Expenditure measures the value of purchases of fixed assets, i.e. those assets that are used repeatedly in production processes for more than a year. Common examples of a capital expenditure include the purchase of a new building, or the cost of significant upgrades to an existing facility. A capital expenditure is amortized over the length of the life of the investment. A capital expenditure is also sometimes referred to as capital spending or a capital expense. Capital expenditure includes gross capital formation and capital transfers. Capital transfers consist of the transfer of ownership of an asset (other than inventories and cash), or the cancellation of a liability by a creditor, without any counterpart being received in return. A capital transfer in cash consists of the transfer of cash that the first party has raised by disposing of an asset, or assets (other than inventories), or that the second party is expected, or required, to use for the acquisition of an asset, or assets (other than inventories). The second party, the recipient, is often obliged to use the cash to acquire an asset, or assets, as a condition on which the transfer is made. Capital transfers cover capital taxes, investment grants and other capital transfers (see ESA 95). Classification of Functions of Government (COFOG): the Classification of the Functions of Government is an international classification of public expenditure according to purpose, used to identify the socio-economic objectives of current transactions, capital outlays and acquisition of financial assets by general government and its sub-sectors. The COFOG was developed by the Organization for Economic Co-operation and Development and published by the United Nations Statistical Division. It can be applied to government expense and the net acquisition of nonfinancial assets. COFOG has three levels of detail: Divisions (1-digit level), Groups (2-digit level), and Classes (3-digit level). The Divisions could be seen as the broad objectives of government, while the Groups and Classes detail the means by which these broad objectives are achieved. Only divisions and groups have been used in the analysis carried out in this paper4. Current expenditure is expenditure on goods and services consumed within the current year, which needs to be made recurrently to sustain the production. Minor expenditure on items of equipment, below a certain cost threshold, is also reported as current spending. European System of Accounts 1995 (ESA95): the system of national and regional accounts used by the Members States of the European Union, updated in 1995. ESA 95 is the result of several years’ work and draws on the experience acquired by the European statistical system during its work on harmonising gross national product (GNP) and is fully consistent with the revised world-wide guidelines on national accounting, the System of National Accounts (1993 SNA, or simply SNA)5. Expenditure for development (EfD) is a measure of public capital spending on functions relevant to development plus current expenditure for training. This concept has been developed by the study 4 For further information on COFOG, see Classifications of Expenditure According to Purpose (United Nations, Department of Economic and Social Affairs, Statistics Division, Statistical Papers, Series M, No. 84, New York, 2000) and Manual on sources and methods for the compilation of COFOG Statistics (Eurostat, 2007 Edition). 5 See COUNCIL REGULATION (EC) No 2223/96 of 25 June 1996 and on the European system of national and regional accounts in the Community and following upgrading versions.

ISMERI EUROPA – APPLICA
15
team of the present project in order to obtain an aggregate of public expenditure which is as much consistent as possible with the spending eligible under the EU Cohesion Policy. The EfD definition includes thematic areas as defined by COFOG divisions: public gross fixed capital formation in economic affairs, environmental protection, housing and community amenities, health, recreation, culture and religion, and education; capital transfer to the private sectors in economic affairs, environmental protection, housing and community amenities as well as recreation, culture and religion; plus public current expenditure on training (for more information see chapter 3 and Annex 2). General government (GG) - ESA95 defines the general government sector as all resident institutional units that are other non-market producers whose output is intended for individual and collective consumption, and are mainly financed by compulsory payments made by units belonging to other sectors, and/or all institutional units principally engaged in the redistribution of national income and wealth. A resident unit is regarded as constituting an institutional unit if it has decision-making autonomy in respect of its principal function, and either keeps a complete set of accounts or it would be possible and meaningful, from both an economic and legal viewpoint, to compile a complete set of accounts if they were required. The definition of the general government sector excludes institutional units that are market producers. These are units that derive their income from sales of goods and services rather than transfers. Such units are classified to the corporations’ sectors. These sectors include government owned and controlled market units, known as public corporations, such as government-owned postal and transport services. However, the general government sector can include institutional units that have market sales as a secondary activity (for example a government statistical office might sell books of statistics) or receive partial payments for services provided (for example there might be nominal charges for certain health services supplied by government units). The general government sector comprises four sub-sectors:
a) Central government (CG) This includes government departments, agencies, parliamentary bodies, military forces, and non-budgetary institutions serving households that are controlled by central government. The “State” is sometimes used to describe a subset of central government units that are under the direct day-to-day control of government ministers.
b) State government (SG) This applies to countries such as Spain, Germany, Austria and Belgium that have a federal level of Government. It does not apply in the majority of EU member states.
c) Local government (LG) This is the level of government applying at the level of cities and towns and other geographically limited entities below the level of regions.
d) Social security funds (SS) This includes autonomous pension funds if they are obligatory by law or by regulation and if general government is responsible for the management of the institution in respect of the settlement or approval of the contributions and benefits. It also includes schemes established by government to fund health care and social benefits where there are separate institutional units administering the contributions and benefits.
Gross Capital Formation (GCF) consists of gross fixed capital formation (see below), changes in inventories (i.e. all commodities held in stock with the intention of using them as intermediate inputs in production and output produced that is not yet finished such as uncompleted structures), acquisitions less disposals of valuables (i.e. non-financial goods that are not used primarily for production or consumption, do not deteriorate physically over time under normal conditions and that are acquired and held primarily as stores of value; for instance, precious metals). Gross (Capital Formation) means that consumption of fixed capital is not deducted. Gross Fixed Capital Formation (CFGF): consists of acquisitions, less disposals, of fixed assets during a given period plus certain additions to the value of non-produced assets realised by the

ISMERI EUROPA – APPLICA
16
productive activity of producer or institutional units. Fixed assets are tangible or intangible assets produced as outputs from processes of production that are themselves used repeatedly, or continuously, in processes of production for more than one year. GFCF mainly include: acquisitions, less disposals, of tangible fixed assets such as other buildings and structures, machinery and equipment etc.; acquisitions, less disposals, of intangible fixed assets such as computer software; entertainment, literary or artistic works etc.

ISMERI EUROPA – APPLICA
17
INTRODUCTION The present study aims at analysing the distribution of competences in relation to development policies between the different administrative levels in the Member States of the European Union and at assessing the contribution of EU Cohesion Policy at national and regional level. The study provides an analysis of the powers of the different levels of government and of the trends in the decentralisation processes that have taken place during the last fifteen years. The analysis is both quantitative and qualitative. The latter concerns mainly institutional organisation of a state; the former is focused on the distribution of resources and the actual expenditure of each government level in the main policy fields related to development policy. Eurostat provides information on these topics at national level and for the main expenditure functions. However, the availability of detailed data on the expenditure of the different government levels is limited and heterogeneous among countries, especially in relation to the regional level. This required the study team to use several national sources and carry out estimates in a number of MS which were analyses in detail (Austria, Germany, Spain, Italy, France, the UK, Sweden, Portugal, Hungary and Czech Republic). These cases represent some interesting examples of the main typologies of organisation of state in Europe: Federal states; ‘Regionalised’ states; states with a ‘Northern System’ and other Unitary states. Comparisons between the expenditure for development of the different government levels and EU Cohesion Policy support are provided at national and regional level. The report is the outcome of the last phase of the study. In this phase the study team has revised part I and II which were submitted with the Interim Report and developed part III of the study. Part I of the study (see Chapter 1) provides a literature review of the forms that the distribution of responsibility and competences between the central level and the sub-national levels may take from a theoretical point of view. This part includes a definition of the different denominations that have been given to processes of transfer of powers to the sub-national levels (decentralisation, devolution, regionalisation) underlining the main differences between them. Moreover, the review summarizes the main factors driving decentralisation in Europe as well as the main traits of the theory of fiscal federalism. According to the literature, Europe has experienced a trend redistribution of competences from central towards sub central levels of government over the past decades. Globalisation, European enlargement, the revival of concern with local identity, subsidiarity, Cohesion Policy and the crisis of welfare state all contributed to this process. The intensity of trend varies greatly from country to country in relation to their history, their institutional settings as regards forms of decentralisation and intergovernmental relationships etc. In some Member States the increasing competences of sub-national governments translates into de-concentration, in others it means devolution, and in yet others, it has meant various intermediate situations. Part II of the study (see Chapter 2) describes the main features of the trends observed in the different Member States during the last fifteen years. The study presents the evolution of the distribution of powers between the different administrative levels; a description of the institutional arrangements, if any, set up to ensure permanent dialogue and co-ordination between the different administrative levels; and the budgetary arrangements established to fulfil those functions.

ISMERI EUROPA – APPLICA
18
To carry out this part the study team has collected and re-organized the Eurostat public sector accounts data available in order to determine the division of responsibility for relevant expenditure and for raising revenue in each Member State and how this has changed since 1990. Government Finance Statistics compiled by Eurostat on expenditure and revenue supplement the literature review and enable the main features of the trends observed during the last fifteen years at different administrative levels in Member States to be explored in quantitative terms. In particular they can be used to shed light on the role of different levels of government as regards expenditure of various kinds on different economic functions. Disaggregation of capital formation by economic function, for example, indicates that sub-national levels of government mainly carry out expenditure on economic affairs, housing and community amenities, education and recreation and culture, as defined by COFOG. It is clear that sub-national governments play an important role in relation to capital expenditure, particularly in federal and regionalised states. However, the data show that the share of resources raised and spent by these in relation to both general government expenditure and GDP has tended to remain relative stable in most countries over recent years. Only in a few cases was there a significant increase in their share. This is also evident in relation to revenue. Accordingly, it seems that the shift in institutional arrangements towards more decentralisation has not always been accompanied by a corresponding change in the budget. Part III of the study (see Chapter 3 –national level– and Chapter 4 –regional breakdown) provides an analysis of the evolution in the last fifteen years of competencies, and in particular of budgetary competences, in the areas relevant for regional development. For this part, in order to achieve a higher level of detail than that possible from more readily accessible statistics provided by Eurostat, the study team has collected detailed information in selected countries with the help of national experts. Consideration of the appropriate definitions and classifications to be adopted has emphasised the complexity of the methodological framework of the study and the need for close coordination. The analysis focuses on three main aspects and on the methodological issues which arise in each of these: administrative levels, budgetary indicators for development and territorial breakdown. The appropriate definitions to adopt in each of these areas can vary from country to country. A pragmatic approach has been adopted to designing a template for the collection of data and to determining the specific data to be collected, recognising the differing systems of government which exists across the countries and the differing availability of data. The overriding aim has been to compile the most detailed data which are available in each country, to try to achieve as much comparability across countries as possible while accepting that full comparability given the present state of affairs is likely to be impossible and that placing too much emphasis on it might mean not collecting the most relevant data which exist. The most problematic task has been to break down spending by region. Inevitably, a varying amount of estimation has been required to produce a reasonable indication of the actual situation. According to the analysis, the expenditure for development in Europe is concentrated on economic affairs that account for approximately half of the total. Within this, transport, manufacturing and construction are by far the most important areas of spending. The role of the different administrative levels in development, as reflected in the expenditure figures for the period 2000-2006 reflect by and large the analysis carried out in the previous parts. For instance, the importance of the regional level is evident in regionalised states; there is a balance between central and local government expenditure in EU15 unitary states, with less spending at intermediate level (e.g. regions, counties) and more spending by municipalities; In the EU 12 unitary states covered, the sub-national administrations are responsible for a smaller share of general government expenditure even though

ISMERI EUROPA – APPLICA
19
the analysis of the formal distribution of competences indicated for this group a stronger devolution towards the local level. The trends in public investment have been very different across Member States both at national and regional level. In recent years, development expenditure has tended to grow by less in Objective 1 regions than elsewhere in the countries examined. The role of regional and local governments in managing development policies is significant (in general they account for over 50% of total expenditure), but can differ markedly not only across Member States but also within them and between regions. The large variation depends on institutional and policy arrangements which affect the distribution of competences between government levels and policy areas; the mix of these two factors can produce very different national and regional regimes. The pursuit of the objective of equalising resources is distributed between different government levels according to the national institutional system in place. In federal and regionalised countries, local governments seem to manage resources according to GDP and central or state governments provide some rebalancing in cohesion terms. In unitary states, this commitment seems to be more related to the local government level. The report is structured into five main chapters plus references and annexes. Chapter 1 deals with the literature review. The second chapter presents the main features of the trends observed in Europe over the past fifteen years in relation to distribution of competences. The third chapter deals with the evolution of competences in the areas relevant for regional development and the fourth chapter analyses the territorial distribution of competences in Europe. Chapter 5 provides conclusions. Annex 1 includes notes which deal with the distribution of competences in countries not covered in the case studies. The second annex summarises the methodological approach. Annex 3 is a note on accounting consideration relevant to the study.
ISMERI EUROPA – APPLICA
20
CHAPTER 1. LITERATURE REVIEW: FORMS THAT THE DISTRIBUTION OF COMPETENCES BETWEEN CENTRAL AND SUB-NATIONAL LEVELS MAY TAKE EU countries differ in their structure of government. Some countries are characterised by a high degree of concentration of fiscal, administrative, judicial, executive and lawmaking powers, whereas in others, many of these functions and responsibilities of government are devolved. The differences between EU countries in the organisation of government are also not static but have tended to change significantly over time in many countries. This chapter presents a short review of the theories of the distribution of competences between different levels of government and summarises the situation in EU Member States.
1.1. FORMS OF DECENTRALISATION Decentralisation is typically viewed as having three components: political, fiscal and administrative. Political decentralisation involves the transfer of political authority from central to locally elected state bodies. The underlying argument that can be found in the related literature in favour of political decentralisation is that it increases opportunities for participation and accountability, thereby deepening democracy and increasing democratic legitimacy. This is especially so where a country’s population is diverse, and needs and preferences vary between regions. Decentralisation increases the possibilities for participation and access to decision-making by otherwise excluded groups, as well as transparency and accountability through physical proximity of decision-makers to citizens. In what follows, the political form of decentralisation will not be subject to investigation. Fiscal decentralisation consists to provide local governments with the capacity and authority to define and collect taxes and revenues, to manage public resources and to provide public goods and services. Fiscal decentralisation is argued in the economic literature to bring about improved allocation of resources as decisions about the use of resource better reflect citizens’ needs, priorities and willingness to pay. As a result, service delivery should improve and so should cost recovery and resource mobilisation, as local tax and charge payers will be more willing to pay for services that benefit them. In addition, fiscal decentralisation is argued to lead to experimentation and innovation in public policy and the delivery of public goods and services, as individual jurisdictions have both the incentive and freedom to develop and implement new approaches. Administrative decentralisation may take three forms:
1) De-concentration is generally viewed as the most limited approach to decentralisation and involves assigning responsibility from one level of the central government to another, usually geographically located at the sub-national level, while maintaining the same level of accountability to the de-concentrating central government ministry or agency;
2) Delegation redistributes authority and responsibility to a government agency or a local unit of government to carry out a particular function on behalf of the central government in return for a payment, but accountability remains essentially to the delegating central unit;

ISMERI EUROPA – APPLICA
21
3) Devolution is recognised as the most comprehensive approach to decentralisation whereby authority, responsibilities, resources and revenue generation are assigned to a local-level public authority that is autonomous and fully independent of the devolving authority. Units that are devolved are ideally elected and accountability is mainly to the local electorate.
1.2. FORMS OF INTERGOVERNMENTAL RELATIONSHIPS Besides the different forms of decentralisation, the theoretical literature distinguishes different forms of intergovernmental relationships (Bobbio, 2002): dependence, separation, cooperation and competition. These forms can operate at different administrative levels, as well as in different institutional models. It is worth noting that the different models can operate at the same time in the same country, because local or regional government can cooperate or compete between each other. Dependence: Under this form, lower levels of government depend on their upper levels (usually the national level, but it could be also the regional one). Schematically, lower level governments have lower autonomies, competences and powers than upper levels. The central level controls the financial resources, holds the tax rising and transfer power and controls the legal resources. The central government can decide to assign or to remove competences at the sub-national level. Separation: In this model, the relationships between different levels of government are based on mutual independence, and the system works because there is a strict separation of competencies, defined by the Constitution or by the law. This model is based on the principle of non-interference: each level of government has its own competences that are strictly defined and non-shared with the others. The autonomy of each level of government is ensured by law and therefore in this model the interactions between different levels of government are reduced to the minimum. Cooperation: In this model the central, state and local governments interact cooperatively and collectively to solve common problems, rather than making policies separately. Competences are shared to a very high degree by both federal and state levels and states may directly be involved in federal decision making. Although the attributed functions to the government levels are different and in principle distinctive, there is no strict separation as in the “separation” model. Policies are implemented with and supported by different levels of government. Concertation and negotiation are the backbones of the cooperative model. Competition: This model is characterised by competition between sub-national governments for the attraction of resources (Brennan & Buchanan, 1980). It is argued in the related literature that intergovernmental competition can strengthen the allocative function of governments mainly in two ways: it forces governments to become more efficient in their allocative activities, providing better services at lower costs, and it forces government to be more responsive to citizens’ preferences than a “monopoly” government. Trough intergovernmental competition, greater overall citizen satisfaction can be achieved with multiple governments offering different packages of public services at different prices.

ISMERI EUROPA – APPLICA
22
1.3. GOVERNMENT SYSTEMS In practice, the forms of decentralisation and the intergovernmental relationships are constitutive parts of different types of government systems. From the “constitutional” viewpoint, three different government systems are generally distinguished: confederal, federal and unitary systems6. However, as emphasised by Oates (1972), depending on the degree of decentralisation, there is a continuum of possible government systems between the extreme cases of the unitary state and a collection of entirely independent states. According to Oates, in practice, the systems of governments differ more as regards to the division of powers than the kind of system adopted (Dafflon, 2008). Exhibit 1 – Continuum systems of government (W. E. Oates, 1972) A confederation is a system that associates different member-states. Each of them preserves its sovereignty. This system is mentioned for memory only and will not be developed in what follows since it does not apply in the EU-27. A federal state is an ‘autonomous and shared system of government, voluntary chosen’ (Kincaid, 2002) in which both the central government and the local authorities have their own legislative and administrative competences and which are exercised separately. The independence of each level of government is ensured by the constitution. Thus, federal states are characterised by a constitutional division of power between the centre and the constituent units, which cannot be changed unilaterally. Germany, Austria and Belgium are the most representative examples of federalised states in Europe7. In Germany, the Länder are the main regional entities: they are not local authorities in a legal sense but they have internal sovereignty, their own constitution and institutions, and they share state sovereignty with the federal state. In Germany, the right of local self-government is defended in the constitution and in the basic law. As a result of this, though the municipalities enjoy all the same legal standing and administrative autonomy, there is a great diversity in their status depending on the Länder. As in Germany, in Austria the distribution of the competences respects the principle of subsidiarity. The Bundesländer are the main sub-federal entities which possess certain attributes of sovereignty. Belgium was formerly a traditional unitary state which, between 1970 and 1993, was gradually transformed into a complex federal State. In Belgium there are six federated entities, three regions and three communities, whose territories and certain competences overlap.
6 These types correspond to standard terms used in comparative studies on government systems in Europe. However, it is worth noting that this terminology does not necessarily correspond to the denomination of a country’s government system in its legislation or constitution (if any). It can also be the case that there is no clear consensus in the literature on the type of government system for a given country. This is for instance the case for Portugal which is described in the literature as federal and as unitary state. 7 Given these common characteristics, in the quantitative part of chapter 2 these three countries are aggregated into a group labelled “Federal states” although individual country data are also presented.
Unitary system Confederal system Independent states Federal system
Degree of decentralisation

ISMERI EUROPA – APPLICA
23
In a unitary state, the central government holds the entire sovereignty. At the sub-national level there may be administrative self-governance8 or not. Once it was common to distinguish between “Napoleonic Systems”, and “Northern European Systems”. In the former, local government was weak and often fragmented and subject to close control by the central government. A central government official was responsible for administration at the provincial level and had the power to disallow acts of municipal councils. Nowadays, there is a tendency for these controls to be less intrusive, and in recent years many countries modified their administrative structures, as well as the methods of supervision of local authorities. Historically, the main example of a unitary state is France, where the prefect was a centrally appointed official, whose task included administering central government activities at the territorial level, exercising oversight over regional and local government, and liaising with central government. Since the beginning of the 80s, France experienced significant changes in its territorial administration, which have strengthened the autonomy of local governments and have reduced the traditional control power. Until recently, also the United Kingdom has been one of the most centralised European countries, and now, after relevant changes, it has been labelled a unitary state with certain characteristics of a more central state. Nowadays in the United Kingdom there is a complex system of regional authorities (‘devolved administrations’) and local executive structures, which have grown in autonomy and competences, reducing the power of the central government. Despite the decentralisation process, in Ireland, Cyprus and Malta local and regional authorities did not enjoy a great autonomy: in these countries competences of sub-national governments are still limited and they have only limited institutional opportunities to influence the legislative part which relates to their interests. In the Netherlands the powers and competences of the municipalities derive from the state level. At the same time, autonomous competences at the local and provincial levels are assured by the local and political framework of Dutch society. The two spheres of local government have twofold competences: a general competence in all local and provincial affairs, so long as there is no conflict with national legislation, and specific competences, derived from specific national laws. The decentralisation process does not necessarily imply the devolution of national tasks, but it has been achieved through the extension of competences or by broadening the scope of municipalities. At this point, it is worth emphasising that for some countries it is relatively unclear whether the features of the government system are closest to that of a federal state or a unitary one. This is in particular the case for two countries: Portugal and Greece. Historically, Greece has been a strongly centralised country, but over the past two decades there has been a process of reform towards decentralisation. This process has led to the creation of departments at the local level – which still do not have the status of local authorities -, and of 13 regions, which are the local representatives of the central authority. In some studies, Greece is even considered as a regionalised unitary state or a federal state (Council of European Municipalities and Regions, 2005, p. 22) while in most it is regarded as a unitary one.
8 Administrative self-government means that the local government only has administrative competences. Self-government means that there is at least an elected council. Administrative self-government has to be distinguished from the organization of territorial divisions of state administration (European Commission for Democracy through Law, 1997).

ISMERI EUROPA – APPLICA
24
The Portuguese government system is also difficult to classify. It has a pronounced unitary character, and even though the constitution provides for the creation of regions, a proposal to set them up was defeated in a referendum in 1998. At the regional level, there are five Regional Coordination Commissions, whose members are appointed by the Government and which carry out measures relating to regional development. The EU12 countries (i.e. those which have entered the EU since 2004) are all unitary states. For most of them, the creation of sub-national government levels has taken place only recently (after the fall of the communist regime). In most also, sub-national governments have only administrative competences, such as in Bulgaria, Slovakia, Estonia, Lithuania, Latvia, Cyprus and Malta. In other countries (Romania and in Slovenia and Poland), there is no constitutional division of competences between different levels government but only a division determined under ordinary legislation. Against this backdrop, the decentralisation of central powers to the regional level has taken place only in Hungary, the Czech Republic and, most especially, in Poland, where a genuine policy of regionalisation has been implemented. The Nordic countries and in particular Finland, Sweden and Denmark, have always been characterised by a strong tradition of local autonomy and self-government. Sub-national governments in these countries enjoy a significant degree of fiscal autonomy. They are normally considered to be decentralised unitary states where local governments exercise a considerable degree of responsibility for managing revenue and expenditure. In addition, they are also characterised by a well functioning mechanism for consultation between the different sub-national government levels9. Besides federalised states and unitary states, the literature refers sometimes to regionalised states. In recent years, several European countries have established an intermediate or regional level of government10 and there are many forms of regionalised states. Functional regionalism is limited to one task, usually planning and economic development (European University Institute, 2009). The need to administer European regional policies has been one reason for the emergence of this. Even if Bulgaria and Romania are unitary states, the recent creation in these countries of regional levels11 can be considered as an expression of this particular type of regionalism. Also in Sweden since 1999, two county councils – one type of local administration - were given responsibility for regional development activities, evolving in this way in the two pilot regions of this country. Multifunctional regionalism is broader in scope, covering a number of fields or constituting a tier of general purpose government (European University Institute, 2009). Some regions have legislative power and others are limited to administration – although this distinction is not always clear. Some tasks covered by administrative action in one country require legislation in another. Regions may also have powers of secondary legislation, allowing them to change the detail of state-wide laws. Given the large
9 Given these common characteristics, in the quantitative part of chapter 2 these three countries are aggregated together into a “Northern system” country group although individual country data are also presented. 10 The main motivations for the creation of this sub-national level is not only the recognition of the regional level for economic development and planning but also to respond to the demands of national minorities (as in Belgium, Spain and the UK) and to better implement the subsidiary principle which, since its introduction in 1991 into the Treaty on the European Union, has greatly enhanced the trends towards decentralisation (Bloomfield, 2006). 11 In Bulgaria there are six planning regions which constitute the level which deals with the implementation of policies of regional development. In Hungary, seven statistical regions were created in 1999. Their competences are limited to regional development policies and the administration of community funds. In Romania ‘development regions’ were established in 2000. These are not administrative bodies, but rather a level of coordination. Their councils are responsible for drafting and implementing regional development strategies and programmes.

ISMERI EUROPA – APPLICA
25
legislative and administrative competences of regional authorities in Spain and in Italy, these two countries are typically considered to be regionalised states12.
1.4. GLOBAL FACTORS DRIVING DECENTRALISATION IN EUROPE13 Over the recent past, the general trend in Europe has been towards increased decentralisation. This section briefly describes the main global factors driving the decentralisation process. Globalisation is one of the factors that have contributed to increased decentralisation in Europe during recent years. The mobility of capital and increased flows of goods and services have led to greater competitive pressure on regional economies. In order to respond to this and to be able to compete on the global market, the capacity to adapt quickly has come to be regarded as a major competitive advantage (Scott, 1998; Storper, 1995). Flexibility, institutional proximity and collective action, the capacity to absorb and learn have become important parts of endogenous development policies based on making the most of the specific features of the regions concerned14. This new vision of territorial economic development has to a large extent displaced the old vision of integrated national spatial management. Once regions became involved in global market competition without the protective umbrella of the nation-state, it was increasingly recognised that regional development should be a matter for regions themselves (J. Loughlin, Keating, & Deschouwer, 2003). This new thinking had an important impact on regional development policies in Europe, and in the EU itself, and encouraged the re-territorialisation of functions, identity and social issues (Bachtler, 1993; Yuill, Allen, Bachtler, Clement, & Wishlade, 1993). Policy has been decentralised to the local and regional level and spatial redistribution has given way to the idea that regions need to fend for themselves (Stöhr, 1989). The revival of local identities and culture has also served to further decentralisation. New interest in local culture, languages and regions has been part of a broader process of social change which has coincided with the rediscovery of local and regional endogenous development based on a territorial basis (J. Loughlin, et al., 2003). Minority languages have been revived and traditional cultures rediscovered. In Belgium in particular the language issue has contributed to dividing the country. Linked to territorial and political aspects, the issue has generated strong pressures for dividing the country. In Spain, the rise of nationalism in Cataluña, the Basque country and to a lesser extent in Galicia, has become a major political feature. Scottish, Welsh and Irish nationalism has revived strongly in the UK since the 1990s. There are fewer signs of this in France, though there is a continuing strong movement for independence in Corsica. In all these cases the driving political movements combined elements of culture, identity and territory to demand and achieve devolution and even the right to obtain self-determination.
12 In the quantitative part of chapter 2, these two countries are aggregated together into a group labelled “Regionalised states” although individual country data are also presented. 13 Different, country specific aspects of the decentralisation process are developed in chapter 2. 14 Beyond these common features, there are many distinct schools contributing to the “new economic paradigm”: transaction cost approach and flexible specialisation (Scott, 1996, 1998; Scott, Soja, & Storper, 2001; Scott & Storper, 1992; Storper, 1995, 1997), industrial districts approach and Third Italy (Bagnasco & Trigilia, 1993; Garfoli, 1991; Pyke & Sengenberger, 1992), the “innovative milieu” approach (Aydalot, 1986), the learning region approach (Florida, 1998; Morgan, 1997etc.).

ISMERI EUROPA – APPLICA
26
The end of dictatorship in the Central and Eastern European countries was another factor affecting the decentralisation process in these countries. During the communist period governing systems in Eastern Europe were characterised by a considerable degree of authoritarian uniformity. Regional and local governance was subject to strong political controls from the centre and was mainly driven by functionalist goals, with sub-national units acting as an organisational pillar of the one-party stat and central planning. In the post-communist period, two contradictory trends can be observed: decentralisation followed by recentralisation. In a first stage, as a means of overcoming the authoritarian legacy of communism a strong decentralisation process was evident (particularly in Hungary, the Czech Republic and Slovenia) leading to a proliferation of local governance units. This reaction resulted in the abolition or diminution of the role of regional government, which under communism had been a critical link in the chain of authority between central and local rulers. This process was followed afterwards by a trend towards re-centralisation and re-concentration of power because sovereignty was perceived to be threatened by territorialised minorities and/or by authoritarian reaction (J. Hughes, G. Sasse, & Gordon, 2004). EU enlargement was another factor driving decentralisation. On account of the link to accession negotiations and the basic starting conditions of democratic and economic transition, EU Policy demands directed at the Central and Eastern European countries to an important extent included requirements to change national political, administrative and judicial structures (Schimmelfennig & Sedelmeier, 2005). The adoption of the “acquis communautaire” as a precondition for accession, EU conditionality and “Europeanisation15” supported democratic consolidation, the building of institutional structures and expertise and encouraged the process of regionalisation and decentralisation16. In particular, in the countries concerned, regional-development policy is argued to have contributed significantly to regionalisation. The degree of decentralisation however varies between Member States. (Bache, 1998; Benz & Eberlein, 1999; Börzel, 1999; Börzel, 2002; Jeffery, 1997). In this regard, it should also be mentioned that the subsidiarity principle (i.e. that EU actions should be handled at the lowest, competent administrative level) contributed, and contributes, to the greater involvement (and, in many cases, to the creation) of sub-national authorities, working in partnership with the Commission, in the programming and implementation of EU financial interventions at the regional level. A further factor that has driven decentralisation was the crisis of the welfare stare during the economic recession of the early 1980s (Bobbio, 2002). The development of Keynesian policies, the welfare state and tripartite agreements favoured the centralisation of government. Macroeconomic policies to sustain demand were centrally decided and managed. Most agreements between government and unions were signed at national level. All this required centralisation. However, with the economic crisis of the 1980s and the demographic changes (and in particular the ageing population) the expansion of the welfare state came to an end in a number of countries, governments were obliged to implement cost containment policies in order to balance public budgets under pressure from financial markets and the threat of inflation. Decentralisation was regarded as a way of implementing flexible adjustment measures and of achieving greater efficiency by devolving responsibilities to sub-national governments (Loughlin 2004b). 15 Adopting the definition of Héritier (2001), we define “Europeanisation” as the process of influence deriving from European decisions and impacting member states’ policies and political and administrative structures. It comprises the following elements: the European decisions, process triggered by these decisions as well as the impacts of theses processes on national policies, decision processes and institutional structures. 16 For the interested reader, a critical investigation of causality related to this topic see Hughes J., Sasse G. and Gordon C. (2004). The debate in this contribution however exceeds the scope of this study.

ISMERI EUROPA – APPLICA
27
The crisis of the social state induced by the economic slowdown together with the construction of the European Monetary Union lead to tighter fiscal disciplines in Member States, put downward pressure on government spending and, in particular on transfers to the local level and reinforced the trend towards decentralisation. For countries in the Eurozone the necessity of meeting monetary obligations and abiding by the budgetary constraints of the Growth and Stability Pact has imposed a new emphasis on the need for strict control of government finances. This has affected local and regional authorities and their capacity to provide public services (Bloomfield, 2006).
1.5. SUB-NATIONAL TAX AND FISCAL FEDERALISM Fiscal decentralisation and fiscal federalism have been addressed extensively by scholars, and the unanimous view which emerges is that it is not possible to rely on a theory of taxation which can provide a model of tax assignment between the different levels of government to support institutional decentralisation. Moreover, empirical observations demonstrate that there is no strong correlation between the degree of institutional decentralisation and the level of fiscal autonomy of sub-national authorities. There are, therefore, unitary States with a high degree of fiscal decentralisation and Federal States where fiscal powers remain relatively centralised. The reason for this extreme heterogeneity lies in the historical “determinism” of the process by which each national state was created. Musgrave, the founder of modern fiscal policy analysis, says that “economic criteria may be applied to the design of a regionally efficient fiscal structure”. However, he observes that “existing national institutions reflect historical patterns of political development”. According to Musgrave, “the fiscal structure of a country is decentralised or centralised, depending on whether the political constitution is federalist or unitary and not the reverse”. The relevance of the historical and political roots of the way in which institutions are organised and operate give rise to significant differences between institutional and fiscal systems; at the same time, “the regional pattern of the fiscal structure, as determined by political forces, may be expected to bear significantly on the functioning of the fiscal systems” (Musgrave, 1969, chapter 14). It is therefore relevant to know whether a state was created through a spontaneous merging of different regions or by the forced aggregation to a core; the extent of religious or ethnic homogeneity, the distances between and the accessibility of the different regions. Geographical as well as political factors, accordingly, condition the process by which an institution has been created and its outcome in terms of how and to what extent it is decentralised. This approach leaves a space open for applied comparative analysis across countries, as Musgrave seems to suggest, in order to explain how the different national systems work and the allocation of fiscal responsibility and competences between authorities in the different countries (quite independently from the abstract definitions provided by political analysis).

ISMERI EUROPA – APPLICA
28
Box: indicators for measuring fiscal autonomy and the impact of fiscal rules
Fiscal autonomy is multi-faceted and several indicators are needed in order to assess it. An indicator set developed by OECD (Blöchliger & King, 2006) aims at capturing fiscal autonomy from different angles. The set includes the following: • Sub-central government tax revenue as share of total tax revenue • Discretion on rates and relief over total sub-central government tax revenue • Total grants as share of total tax revenue • Non earmarked grants as share of total grants • Budget and deficit autonomy • Borrowing autonomy • Sub-central government autonomous tax revenue as share of total tax revenue The last indicator is the product of sub-central tax revenue share and the autonomy over those taxes. It can be considered as a proxy for a composite indicator of fiscal autonomy.
Fiscal rules constrain the discretionary power of sub-central budget policy makers and are widespread among OECD economies. Indicators for fiscal rule stringency can be also calculated (Sutherland, Price, & Joumard, 2005).
In general the relationship between different fiscal autonomy indicators must be handled with care. Fiscal design and its outcome need to be observed over several time periods for this purpose. The analysis of fiscal autonomy indicators reveal that fiscal federal design is to a certain extent country specific and its evolution path-dependent. The theory of fiscal federalism and its implications The theory of fiscal federalism sets out a general normative framework for the assignment of functions to the different levels of government. It, therefore, deals with the issue of the desirable degree of vertical distribution of competences between different levels of government and of the corresponding relationships between them. A relevant part of this theory is concerned with the issue of financing government functions at a sub-national level to give them an adequate degree of autonomy and in the same time to ensure “equity” across areas and communities. The theory’s starting point is Musgrave’s approach to tax assignment and its distinction between the three main government functions: stabilisation, redistribution and allocation. In very general terms, the theory allocates to the central government the basic responsibility for stabilisation and redistribution policies, together with some more national functions such as defence. The assignment of counter-cyclical policies is based on the traditional Keynesian model (Bernardi, 2000) by which in an open economy sub-national governments cannot use monetary or exchange rate instruments and therefore cannot support the impact of expansionary fiscal policies. However in large federal states there are examples in which this limitation does not hold and some kind of stabilisation policies can be carried out locally. Similarly, local governments in countries with a high mobility of people between regions are discouraged from fiscal redistribution policies since they create distortions by favouring the influx of poor people and the exodus of more wealthy people. This general principle has also been questioned by the allocation of responsibility for assisting the poor to local and urban institutions and by Pauly (1973) who argues that equity can be considered as a public good for all citizens and that the richest section of the population will benefit if the poor are better off. However a study by Feldstein et al. (1998) on the US supports Musgrave’s contention that state redistribution policies are inefficient. Decentralised levels of government should instead concentrate on providing those public goods and services for which consumption patterns differ across regions and therefore tailoring the supply of those goods and services to local preferences can increase economic welfare as compared with centralised and undifferentiated provision.

ISMERI EUROPA – APPLICA
29
The above principle is summarised in the “Oates theorem”17 (1972), which lies at the root of the theory of fiscal federalism. The theorem contends that functional decentralisation gives rise to higher social welfare when the national communities (regions or constituencies) have different preferences with respect to the provision of a specific public good or service. The theory is subject to a set of constraints, namely an absence of returns to scale or spillovers, the lack of perfect information on the part of the central government which could otherwise discriminate among regions, and that preferences differ among regions but are homogeneous within regions18. The “Oates theorem” and the Musgravian tripartition of government functions enable the traditional fiscal theory to allocate competences and taxes between levels of government. However all authors agree that this allocation only provides a “general guideline rather than a fixed principle” (W. E. Oates, 1999), and that there can be scope for sub-national governments to carry out some forms of macro stabilisation as well as some redistribution activity. Once the allocation of general functions and its guiding principles are established, the second step of the theory is to focus on the specific activities to be carried out and to determine the corresponding public goods and services which can be assigned to the different levels of government. In some cases there is a high degree of uncertainty as regards this allocation, as functions considered as local in some countries can be considered central in others. This uncertainty is one of the reasons for the variety of patterns of central and sub-national provision in respect of the same goods and services. For example, health and education may be considered local if local preferences differ across regions; on the other hand, a national government may prefer a common standard provision of these services for a number of valid reasons – as a way of enhancing social cohesion and unity across the country or of ensuring that minimum standards are met. Finding a solution to such problems is particularly difficult since they rely on making choices which are influenced by political and social considerations as well as economic. Moreover, a solution which involves sharing competences between levels of government may give rise to overlapping activities and inefficiencies if effective coordination is not achieved. Tax assignment in the theory of fiscal federalism If the theory does not provide a sole and undisputed answer to the degree of fiscal decentralisation which is desirable, the theory’s prescriptions on assigning tax raising powers to the different levels of government constitute an important step towards solving the problem of how to finance sub-national governments. The theory is aimed at providing an answer to the question of which taxes are best suited to the different levels of government given the functions and competences they have been allocated. The different forms which can be used to finance sub-national government and their features – whether they are taxes, levies, grants (transfers) or sales of goods and services – are examined below.
17 Oates W. E. (1972), Fiscal Federalism, NY: Harcourt Brace Jovanovich. 18 The theory establishes, on ground of welfare efficiency the hypothesis that a decentralised provision of goods and services with local effect is more efficient. “The magnitude of these welfare gains depends on the extent of the differences among preferences between regions and to differences in costs (varying inversely with the price-elasticity of demand, which in several econometric studies results to be low within local areas), making therefore quite high the potential gains of such an assignment.

ISMERI EUROPA – APPLICA
30
Taxes and levies Taxes in favour of sub-national governments can be divided into two main types; own taxes and shared taxes. Own taxes potentially give sub-national governments the maximum degree of autonomy. These taxes are consistent with the principle of differentiating sources of revenue between central and sub-national governments. However, they give rise to various problems concerning the choice of tax sources, the distribution among tiers of government and covering operational costs, which may be prohibitive for small regions. On the other hand, they give sub-national governments the potential freedom to determine their own resources and to spend them without constraints imposed by the centre. The importance of this for implementing economic development policy is open to debate and there is no clear evidence that fiscal decentralisation favours or tends to limit economic development at regional level. In practice, there have been periods of development in which there was a highly centralised fiscal system, as in the 1950s and 1960s, and others in which the system was relatively decentralised. Within own taxes, according to the Musgrave-Oates theory, the types of tax that best suit sub-national governments are those based on the benefit-principle, which states that taxes should correspond to a clear and distinguishable good or service and, consequently, to the benefit that the local taxpayer receives in exchange. Benefit-based taxes, however, can create “equity” problems since they tend to be uniform across income brackets and therefore “regressive since they are determined on the hypothesis that each citizen pays in correspondence to what he gets in exchange” rather than in terms of each paying what they can afford. Additional problems arise when taxes give rise to externalities, when some groups or areas benefit more than others, so that the correspondence between the cost and the benefit for the taxpayer is altered. Despite these shortcomings, benefit-based taxation has increasingly been used over the past two decades on efficiency grounds, since it conveys to the public that they have to pay for the services provided by local governments in order to ensure an efficient pattern of consumption of public goods. By the same token it gives local governments a clear responsibility on the way money is spent and services are provided. The second criteria to levy taxes is the “ability to pay” principle under which taxes are imposed in relation to the income of the taxpayer. The aim of the theory here is to determine tax sources which avoid distorting the working of the market. This implies imposing taxes on immobile goods and assets. The theoretical analysis suggest that non-benefit taxes can also give rise to distortions, such as unforeseeable effects on the fiscal systems of other regions, tax wars and revenue erosion in the face of fiscally induced location distortions. Fiscal theory, therefore, opts for the use of resident-based taxes rather than source-based taxes, since the former are less likely to be exported and to generate distortions. In sum, the best candidates for sub-national taxes are those imposed on a relative immobile base, where the base is evenly distributed across the region and where yields are likely to be relatively stable (W. E. Oates, 2002). Shared taxes are portions of central government taxes imposed nationally which can be allocated to different regions according to a pre-defined criteria or percentage. They provide a response to the problem that a fear of losing business and jobs has led local authorities to limit the production of public goods and services because of fiscal competition with other authorities and, accordingly, “a race to the bottom”. Sharing taxes in this way overcomes the concern of local governments to avoid

ISMERI EUROPA – APPLICA
31
deterring businesses from locating locally and can ensure minimum standards of provision of public goods and services. It is matter of debate as how far tax sharing is in line with local government autonomy, which depends among other factors on how the sharing criteria are determined and how far local governments can influence the rates set. The difference between tax sharing and intergovernmental grants is sometimes difficult to define, since the link between the region and the resources of each sub-national government is often extremely loose or non-existent. The same arrangements in some countries appear as tax sharing and in others as grants. The OECD gives a definition according to three criteria: the revenue risk of sub-national governments, the rules and formulas defining the amount of resources and the institutional decision mechanism to decide the amount. It is tax sharing when sub-national governments lave the maximum of autonomy with respect to those criteria and when the revenue raised is allocated according to objective and predefined criteria which minimise the discretion of the central government (Blöchliger & King, 2006). Intergovernmental grants As Bird (1999) states, the conventional model of tax assignment outlined above has an overwhelmingly practical consequence, namely that invariably most, if not all, sub-national governments end up with less own revenue than the expenditure which they are responsible for. “The resulting vertical fiscal imbalance is in practice almost invariably resolved with transfers” (Bird, 1993). Other authors analysing the impact of grants in terms of individual behaviour consider intergovernmental grants as equivalent to a tax rebate for the citizens of the community in question (Bradford & Oates, 1971). Intergovernmental grants constitute an important instrument of fiscal federalism and are widely used. They can have three different functions: compensation for spillover effects from the sub-national level in favour of the national community (Pigouvian effect); redistribution between sub-national levels and support for the provision of specific public goods or services which would improve the overall efficiency of the system19. The first relevant aspect of grants in relation to sub-national government autonomy is their legal basis, namely whether they are earmarked or not; in other words if they are transferred on the basis of a law which compels the central government to do so or if they are instead a result of an autonomous decision by the central authority. Both types of intergovernmental grants can have a constrained or unconstrained nature, which is relevant since it determines the degree of autonomy of the recipient sub-national authority. Conditional grants are more or less tied to a specific use for which the central government can also impose common standards and detailed procedures. In this case, the autonomy of sub-national governments remains limited. Conditional grants may only “partly” finance (matching grant) a good or a service, the remaining part being a charge on the sub-national governments’ own resources, which might be considered to be compensation for the positive spillovers to which the expenditure concerned gives rise. Unconditional grants, more than other instruments, can serve a function of compensating poorer sub-national governments for their lower income level and smaller tax capacity. The optimal size of these grants used for compensation is difficult to assess. When the compensation is substantial, it can damage fiscal responsibility at local level; if it is too small, on the other hand, it can lead to a marked disparity in the level of service provision across sub-national governments. 19 See Oates op. cit.

ISMERI EUROPA – APPLICA
32
Grants to local governments tended to expand rapidly during the early post-war period, but since the 1980s, there has been some tendency to increase local governments’ own taxes as a corollary of increasing institutional decentralisation. Many authors over the past two decades, in which theories of reducing the role of the State and its expenditure have prevailed, have emphasised that an excess of unconditional grants may give rise to various problems linked with the lack of correspondence between the authority which imposes taxes and those which spend the resources; political responsibility, lack of correspondence between cost and benefits may be the unwanted result of such a tendency. Following this line Weingast (1995) foresees the need for decentralised governments to face “hard budget constraints” especially in cases in which they possess a strong power to regulate the national economy. Paradoxically therefore, the more local governments have responsibility for the provision of goods and services, the more is there a need for tight budgetary constraints over them.
1.6. FINAL CONSIDERATIONS ON CHAPTER 1 The literature review carried out in the present chapter points out that Europe has experienced a trend redistribution of competences from central towards sub central levels of government over the past decades. Globalisation, European enlargement, the revival of concern with local identity, subsidiarity, Cohesion Policy and the crisis of welfare state all contributed to this process. According to the review, decentralisation has three main components: political (involves the transfer of authority from central to locally elected state bodies); fiscal (local governments have the authority to collect taxes and revenues); administrative. Administrative decentralisation may take the form of : - de-concentration (assignment of responsibility from one level of the central government to
another); - delegation (redistribution of authority and responsibility to a government agency or local unit); - devolution (authority, responsibility and resources are assigned to a fully independent public
authority). Moreover, different forms of intergovernmental relationships can be distinguished: dependence (lower levels of government depend on their upper levels); separation (mutual independence of different levels); cooperation (central, state and local government interact cooperatively); competition for attracting resources. Both the forms of decentralisation and of intergovernmental relationships are constitutive parts of different types of government systems. Three different systems are generally distinguished from a “constitutional” point of view: confederal (a system that associates different member states), federal and unitary systems. In the last case, the central government holds the entire sovereignty, however, there are examples of unitary systems such as the Nordic Countries characterised by a strong tradition of local autonomy. In these countries, local governments exercise a considerable degree of responsibility for managing revenues and expenditure. The literature also refers sometimes to regionalised states in relation to European countries that have established an intermediate level of government. There are different forms of regionalism such as functional (limited to a single task as

ISMERI EUROPA – APPLICA
33
planning and development) or multifunctional (covering a number of fields). Moreover, some intermediate levels or regions have legislative power, others are limited to administration. Beside typologies of government systems, the literature review also explores the issue of fiscal decentralisation. Empirical observations demonstrate that there is no strong correlation between the degree of institutional decentralisation and the level of fiscal autonomy of sub-national authorities. The relevance of the historical and political roots of the way in which institutions are organised and operate give rise to significant differences between institutional and fiscal systems. The theory of fiscal federalism sets out a general framework for the assignment of functions to the different levels of government. In principle, the basic responsibility for stabilisation and redistribution policies, together with some non-local functions such as defence, should bee allocated to the central government. Decentralised levels of government, on the other hand, should provide those public goods and services for which consumption patterns differ across regions, therefore tailoring the supply of these to local preferences. This approach can increase welfare as compared with centralised and undifferentiated provision. The Oates theorem is a known principle in this respect and contends that functional decentralisation gives rise to higher social welfare when regions or different constituencies have different preferences with respect to specific public goods. The theorem, with the Musgravaian tripartition of government functions (stabilisation, redistribution and allocation) are at the basis of the allocation of competences and taxes between level of government in the traditional fiscal theory of decentralisation. The theory of fiscal decentralisation also deals with the specific activities to be carried out by the different levels of government, the taxes which are best suited to these levels, the different forms which can be used to finance sub-national government and their features. There is a considerable degree of uncertainty in some cases in relation to specific allocation of functions, type of taxes, levies and grants to be used. Certain functions, for example, can be considered as local in some countries and central in others. This is one of the reasons for the variety of patterns of central and sub-national provision in respect to the same goods and services which is examined in the following chapters.

34
CHAPTER 2. MAIN FEATURES OF THE TRENDS IN DECENTRALISATION OBSERVED IN EUROPE OVER THE PAST FIFTEEN YEARS
2.1. INTRODUCTION The European Union is composed of countries with different institutional structures. Following the review carried out in the previous chapter, it is possible to distinguish between federal States (Germany, Austria and Belgium), “regionalised” or “quasi-federal States (Spain and Italy) and “unitary” states. The last group includes very different systems, consisting of countries with “semi-autonomous” regions with legislative responsibilities, countries with a high degree of decentralisation as is the case for most Nordic countries etc. Despite their institutional structure, almost all countries in the European Union are to varying degrees engaged in a process of decentralisation which has led over the past few decades to transfers of responsibility and resources from the central to sub-national governments. The aim of this section is threefold. The first part is aimed at highlighting the overall trends of decentralisation in Europe as well as at assessing for each Member State the current situation as regards decentralisation and the process involved. The second part of this chapter is devoted to a brief assessment of the quality of the consultation mechanism adopted in each country in order to support continuous dialogue and coordination between the different levels of administration. The third part considers decentralisation of responsibilities and financial resources in quantitative terms, based on harmonised data available at the EU level – specifically, Government Finance Statistics compiled by Eurostat, which are defined according to ESA 1995.
2.2. TRENDS OF DECENTRALISATION IN EUROPE Decentralisation has taken place in almost all EU Member States over the past 40 years or so. However, the paths taken by the different countries and the speed at which the process has evolved differ, reflecting differences in country characteristics, economic conditions and history among other factors. In several EU15 Member States, decentralisation dates back to the late 1970s–early 1980s when the first major pieces of legislation in this regard were implemented and proceeded even further over the following decade, with changes to the Constitution in 1978 in Spain, legislation in France in 1982 and 1983; in Belgium in 1988, in Italy in 1990 and so on. The process of decentralisation was pursed further during the following decades. These initial reforms formed the background to the European Charter of Local Self-Government, adopted in 1985 which came into effect in 1988 and which became a reference, for the new Eastern and Central European democracies that were in the process of implementing their own decentralisation reforms. While the second wave of decentralisation launched in the 1990s particularly concerned the Central and Eastern European countries, far-reaching reforms were also introduced in several EU15

35
countries, among them federalisation in Belgium in 1993, the creation of departments in Greece in 1994, the “Bassanini” reform in Italy in 1997 and the devolution Acts in the UK in 1998. These tendencies have continued in the 2000s. Governments in several European countries, especially among the EU12, are either initiating decentralisation such as Bulgaria and Romania or pursing decentralisation by setting up a regional level of governance such as in Slovakia and in the Czech Republic. In the EU15, some countries have moved a step forward in the decentralisation process via the transfer of new responsibilities, as in France (Act II of the decentralisation process), Spain (reform of autonomous communities), Italy (constitutional reform) and Germany (reforming federalism). In other countries, the reforms implemented have been aimed at consolidating and/or revamping the existing system, such as in Portugal, Ireland, Finland, the Baltic States and Poland. In some countries the reforms have led to significant institutional changes such as in Belgium (2001, Lambermont agreement) or Denmark (2007). While there is no denying that decentralisation and regionalisation processes are continuing at present, there are difference in terms of approach, pace and content. Whereas regionalisation seems to be a priority in some unitary States, especially in the north of Europe, even if only on an experimental basis, in seems to be at standstill in other countries. In the Nordic countries, consideration is being given to the possibility of creating regions or regions have recently been created. In Denmark therefore five regions were established in 2007 in place of 13 counties. In Sweden and Finland, regions have been created on an experimental basis in parts of the country. In none of these cases, however, have tax-raising powers been given to regions. In Greece, as well, the creation of regions seems to be on the agenda again. On the other hand, there are some European countries where regionalisation has largely come to a halt. This is the case in Portugal where during the 1990s administrative regions were created but have not been transformed into political regions as a result of the 1999 referendum. The decentralisation process has also come to halt in the UK. After the devolution of powers to Wales and Scotland, Regional Development Agencies were created, but there are no longer any plans to establish Regional Assemblies with political powers. It is also worth noting that in some European countries there has been a drive to reform equalisation mechanisms in respect of fiscal transfers in the sense of reducing the amount of funds redistributed. This is particularly the case in Italy, but to a lesser extent also in Spain, Belgium and Germany.
2.3. MAIN FEATURES OF THE DECENTRALISATION PROCESS IN THE EUROPEAN COUNTRIES This section describes the current state of decentralisation in each Member State and the main legislative and historical features of the underlying process. Federal States: • Austria (federal state; two tiers sub-national government structure): The federal organisation
of the country dates back a long way. State governments were first established in 1848 and gained full legislative power in 1918. Today, the States have a good deal of autonomy since each has its own administrative body as well as its own executive and legislative powers. All judicial power, however, is centralised at the national level. Between 2003 and 2005, the Austrian Convention was supposed to carry out a wide-reaching reform of the Constitution.

36
Among other items, it was requested to consolidate fiscal decentralisation and more specifically the connectivity principle that is intended to harmonise responsibilities and revenue and ensure that sub-national authorities have the means to carry out their responsibilities. A simplification of the complex federal system was also envisaged as well as a redistribution of sub-national competences. However no significant agreement could be reached.
• Belgium (federal state; three tiers sub-national government structure): In Belgium the
federalisation process begun in 1970 and went through several successive stages in 1980, 1988-1989 and 1993. It was completed in 2001 by the revision of the Constitution included in the Lambermont agreements. These successive institutional reforms have given responsibility for the organisation of local authorities fully to the regions. The Special Act of 13 July 2001 gives regions the responsibility for the composition, organisation and operation of the provincial and municipal institutions in their area as long as local autonomy guaranties are respected. Belgium is currently on the threshold of a new in-depth institutional reform, following the deep divisions that came to light during the 2007 federal elections.
• Germany (federal state; three levels of sub-national government structure): Federalism has a
long tradition in Germany. As early as the Middle Ages, the German Empire consisted of a loose confederation of kingdoms, duchies and free imperial cities. After the Second World War, West Germany opted for federalism – in part as a reaction to the extreme centralisation experienced under national-socialism. A process of decentralisation then followed, strengthening the powers of the Länder and municipalities through the reforms of 1965 and 1977, as well as with reforms concerning the internal organisation of local government that certain Länder undertook. More recently, reunification in 1990 engendered another in-depth transformation of the territorial landscape. It involved the reconstitution of five new Länder and their incorporation into the existing constitution. East Germany did not have a system comparable to the West and re-organisation of East German districts and towns had to be undertaken. Despite the advances made, a large number of very small municipalities still exist and the process of merging municipalities is still ongoing.
Regionalised states: • Italy (unitary state, three tiers of sub-national government structure): The Constitution which
went into force on 1 January 1948 established a major decentralisation process, giving significant prerogatives to the regions recognising them as political bodies with legislative and administrative powers. However, the measures were only immediately effective for five regions with special status, and the other 15 regions had to wait until 1970. After a period of consolidation, in the 1990s, strong political pressure towards federalism emerged. With the 1997, “Bassanini Reform” a significant decentralisation of administrative functions occurred, with around 40% transferred to the regions, provinces and municipalities. The regions received new competences and the transfer was combined with a profound restructuring of the sub-national government resources in order to increase their autonomy. The 2001 constitutional reform changed the administrative architecture of the country by placing the state, regions, provinces, metropolitan cities and municipalities on the same level and implied new competences and more financial autonomy for sub-national governments. In 2005, the government proposed another major reform (total transfer to the regions of responsibility for health and education) but the proposal which was seen by some as leading to a federal state was rejected in a referendum.

37
• Spain (unitary state; three levels of sub-national government structure): Spain has a very decentralised government structure. Although to date Spain remains a unitary State, the process of devolution has gone in the direction of creating a federal structure of Autonomous Regions. The notion of local self-government was included in the Constitution in 1978 when Spain was still a very centralised country. To ensure that separatism would not lead to instability, the devolution of competences to the regions has proceeded steadily since then. In a first wave of decentralisation in 2000 and 2002, political responsibilities and functions were transferred from central state to the regions, which today have extensive legislative and executive autonomy. The process was carried out via a “two-speed” system with seven fast track (Catalonia, the Basque Country, Navarre, Galicia, Andalusia, Valencia and the Balearic Isles) and ten slow track regions. The fast track regions were given a broad range of devolved responsibilities immediately, while the slow track regions had to wait five years and hold referenda to demonstrate popular support for “autonomous” regional status. The decentralisation process is ongoing, with some regions wishing to extend their autonomy even further.
States with “Northern systems”: • Finland (unitary state; one level of sub-national government structure): Finland is a
traditionally decentralised country. Local self-government has its roots in legislations which dates back over 140 years and which remains the basis for the current system. Universal direct suffrage was introduced at the municipal level in 1917. The delivery of public services is decentralised to municipalities to a greater extent than almost anywhere else in the EU. This is sometimes difficult to achieve because of the low population density of many municipalities. This led to the adoption in 2007 of the Act on Restructuring of Local Government and Services which establishes required municipalities to take measures to increase their population through redrawing of boundaries or through partnership with others.
• Sweden (unitary state; two tier sub-national government structure): The administrative
divisions of Sweden are today characterised by strong decentralisation and local and regional governments have a lot of autonomy. Over the past 60 years, the responsibilities of local and regional government have increased through various reforms. From 1952 to 1974, the number of municipalities was reduced by a factor of nine. In parallel, they were given more financial autonomy. Following legislation in 1991, the number of country councils was reduced to 20 in 1999 as a result of amalgamations which created the county councils of Skåne and Västra Götaland, established as a part of a pilot regionalisation programme, giving them temporary regional status and their own elected regional councils. The experiment has been extended up until 2010.
• Denmark (unitary state; two tiers of sub-national self government structure): A structural
reform implemented in January 2007 has completely changed the institutional organisation of the country, abolishing the 15 counties (statsamter) and creating five regional administrations as well reducing the number of municipalities by a third from 271 to 98.
Other Unitary States: • France (unitary; three tiers of sub-national self government structure): Recently, France has
enacted a process of decentralisation in two phases. The 1982 and 1983 Decentralisation Acts constitute the first stage of decentralisation and cancelled the oversight of the State representative on local governments replacing this with the principle of free administration. These Acts set up a transfer of state responsibility to municipalities, departments and regions,

38
accompanied by a transfer of executive powers and financial compensation in the form of transfer of state taxes and the so called “general decentralisation grant”. The second stage of decentralisation was implemented from 2003 onwards with the revision of the Constitution, the 2003 Act on the decentralised organisation of the Republic and the 2004 Act on local public freedoms and responsibilities. Financial compensation is in the form of sharing of fiscal receipts between the state and local governments. Current discussion is focused on the functioning of the process of decentralisation such as the election by direct universal suffrage of presidents of inter-municipal cooperation structures with their own tax revenue, the simplification and clarification of the breakdown of responsibilities between the different tiers and the re-organisation of state services at territorial level.
• Greece (unitary state; two tiers of sub-national government structure): The Greek state has
been highly centralised since its founding in 1832. The situation changed gradually after the country joined the European Union in 1981 and over the past two decades the country has been undergoing reforms strengthening the powers and financial means of the local levels. This process began in 1986 with a constitutional reform defining the devolution of state power as the new means of national administration. The creation of 13 development regions in 1987 was a direct result of this reform. The process of decentralisation was fundamentally reinforced as of 1994 with the creation of departments as local authorities, and the growth of tax-based income and competences of the municipalities. The process continued with the transfer of new competences toward the local level in 2001 and 2003. However, in spite of the increase in subsidies from the central fund for self-government, the financial autonomy of local authorities remains restricted, particularly due to the very low level of resources at this level.
• Ireland (unitary state, two tiers of sub-national government structure): Ireland has traditionally
had a highly centralised political and territorial organisation. Local and regional authorities only have very limited competences. However, significant changes have occurred in the structure of Irish local administration since 1990: the general place for local government’s competences was recognised in 1991, and in 1999 the first provisions on local government were included in the Constitution. In 2001, legislation was passed to simplify local structures and strengthen their role and efficiency. In parallel, coordination structures of local government were created at the regional level in 1994. Following in the path of rationalisation, two regional assemblies were established in 1999 with the goal of coordinating regional development policies. Despite this decentralisation process, local self-government remains limited as ministries retain significant supervisory powers. Despite institutional moves towards greater democracy at local government level, local governments in Ireland are still subject to state control over their fiscal decisions. Different measures enacted over the past decades have considerably curtailed local government financial autonomy. All local investment projects are determined by the central government and set out in the national financing programme along with expenditure for Government Departments and other public bodies.
• The Netherlands (unitary state; two tier sub-national government structure): Until the end of
the 18th century, the Netherlands was a confederation of more or less autonomous provinces. As a result of the occupation of the Netherlands during the French empire, much of the administrative system of the Netherlands resembles the French administrative system. With the adoption of the constitution of 1848, however, the principle and practice of decentralisation and the constitutional recognition of autonomous competences of municipalities and provinces became a significant characteristic of the system. Another relevant characteristic of the Dutch political and administrative culture is the continuous

39
search for consensus by consultation. This characteristic applies to the players on the national level as well as to the relations between central government, provinces and municipalities. The number of municipalities in the Netherlands is evolving continuously. Over the past 40 years it gradually has been reduced by more than half and municipal mergers are still going on.
• Luxembourg (unitary state; one tier sub-national government structure): Most communes of
Luxembourg have existed in their current form since the French Revolution of 1789. Following the country’s independence in 1839, the administrative structure was based upon the organic law of 1843. The administrative organisation of communes and their institutional framework have not changed significantly since then. Today, however, there is a consensus on the national political scene concerning the necessity of reforming the existing territorial structures in order to better prepare communes to respond to their citizens’ expectations regarding public services. A special commission, set up in 2006 within the Chamber of Deputies, was thus charged with drafting proposals for an administrative and territorial reform.
• Portugal (unitary state; two levels of sub-national government structure): Following the fall of
the authoritarian Salazar regime, the importance of the local level was recognised by the new political regime in 1974, and the principle of local self-government was included in the new Constitution of 1976. Decentralisation has since advanced, particularly in 1999 with the adoption of several laws on competences. However, a project to create a new decentralised regional level by transforming the existing administrative regions – authorised by the Constitution – was rejected by the population, consulted in 1998 by referendum. Various measures have since been taken to strengthen the devolution of central power and the forms of cooperation between local authorities and State services. Unlike the Portuguese local governments, the autonomous regions (Azores and Madeira) enjoy a high and ever-expanding degree of tax autonomy.
• United Kingdom (unitary state, four constituent countries – England, Wales, Scotland and
Northern Ireland – with different sub-national government organisations): Until recently, the United Kingdom was one the most centralised European countries. Only in recent years has there been a move towards devolution and regional government. From the 1970s onwards, the state’s control over spending and income grew, while the competences of local authorities were reduced to be replaced by both semi-public, non-elected bodies, and private companies following privatisation (e.g. water). The system has undergone a process of change and there has been some growth of local autonomy. The devolution process initiated in 1998 transferred significant powers and autonomy to Scotland, Wales and Northern Ireland. The adoption of the Devolution Acts in 1998 established a regional government level (called Parliament in Scotland, National Assembly in Wales and Assembly in Northern Ireland) and gradually set up elected executive regional bodies. These three constituent countries are responsible for all local matters within their territory. In England it was also planned to establish elected regional governments but this has been suspended indefinitely following the failure to approve the Regional Assembly of the North-East of England in 2004. Currently reforms are undertaken to increase the role of local authorities and other sub-regional partners in delivering economic development programmes. While the Regional Development Agencies (RDAs) will take more strategic and coordination functions in the future, the Regional Assemblies will be abolished by 2010.
• Bulgaria (unitary state; one level of sub-national government structure): The current sub-
national self-government organisation was put in place after the fall of the communist regime. The new Constitution ratified in 1991 guaranteed legal independence to sub-national self-

40
governments and defined the significance and role of municipalities. The Local Self-Government and Local Administration Act were adopted in the same year, providing the modern legislative framework for municipalities. The decentralisation process continued in the following years with the adoption of several laws on the administrative organisation (1995) of sub-national governments and their finances (1996). Between 2002 and 2005, the fiscal decentralisation process based on a fiscal decentralisation Programme brought about in-depth modification of the local financial system especially the financing of municipal responsibilities, the structure of municipal revenue and the conditions for municipal borrowing. Changed in 2007, the Bulgarian Constitution provides municipalities with the power to define the amount of local fees and of local own-source taxes.
• Cyprus (unitary state; one level of sub-national government structure): In Cyprus, the
decentralisation process is based on two laws: The Municipal Act (1985) and the Rural Communities Act (1999). Local government systems are still highly centralised. Local government responsibilities are not very extensive and mostly concern the management of community services, excluding education. Rural communities have very limited financial autonomy and are still quite dependent on specific grants allocated on a project-by-project basis. Municipalities are slightly more autonomous, given their more extensive tax and fee revenue and their annual general grant form the central government.
• Czech Republic (unitary state; two tiers of sub-national self government structure):
Decentralisation began in 1990 with the adoption of the Municipal Act conferring legal statute to municipalities, re-establishing local autonomy, defining municipal responsibilities and setting up municipal finding. The second stage of decentralisation took place in 2000, with the creation of a regional self-government tier and the adoption of different acts on regions, municipalities and local finances.
• Estonia (unitary state; one level of sub-national government structure): Decentralisation was
launched in 1989 with the re-establishment of local autonomy (following the abolition of municipalities by the Soviet regime). In 1989 Local Government Act set up a two tiers of local government: municipalities and counties which have received greater financial autonomy via the Finance Act. The territorial organisation was revised between 1990 and 1993. With the 1993 Local Government Organisation Act, counties lost their local government statue and became part of the state territorial administration and municipalities became the sole decentralised local government tier. Since then local tax revenue was modified, the tax base equalisation system introduced and the transfer of responsibility increased (mainly in education).
• Hungary (unitary state, two tiers of sub-national government structure): In Hungary, a
decentralisation process was undertaken in 1989. Reforms progressively transformed the legal framework of local authorities until 1995 by re-establishing local autonomy, instituting elections by universal suffrage, and allocating competences and financial resources. A second phase which began in 1996 included the adoption of measures designed to stabilise local government and improve their efficiency, particularly through inter-municipal cooperation. In parallel, various reforms sought to rationalise regional development policy by creating seven administrative regions. The transformation of theses statistical planning regions into self-governing regions elected by direct universal suffrage has been under discussion for years but has not been implemented so far. It is worth noting that the management of the Operational Programmes in relation to the EU Cohesion Policy is still very much centralised in this country.

41
• Latvia (unitary state, two tires of sub-national government structure): Latvian local government has a history that dates back to the 13th century. Following the proclamation of the Republic of Latvia in 1918, local governments were formed on the basis of imperial Russian legislation. During the Soviet period, local autonomy disappeared. The elections of local and regional governments in December 1989 marked the return of local autonomy, and laws on the administration of districts, cities and rural municipalities were voted as of February 1990. Decentralisation processes, together with the reorganisation of the local sector, were initiated as of 1993, particularly with the Law on Local Governments of 19 May 1994 which defined the legal framework for local government. Other laws (1995 Act of Self-Government Budgets and the 1998 Act on Equalisation of Self-Government Finance) have since been passed specifying the financial framework and administration of local and regional authorities.
• Lithuania (unitary state; one tier sub-national government structure): The decentralisation
process began in 1990 with the first municipal elections and the inclusion of the principle of local self-government in the Constitution. The law on territorial administrative units and their boundaries of 1994 reduced the number of municipalities from 581 to 56 and established this as the single level of local government. After administrative reform of the year 2000, the number of municipalities increased to 60. This process continues to this day, as new reforms are being studied to both increase the number of municipalities (from 60 to 80-90) and their financial resources, and establish elected representative structures at the regional level.
• Malta (unitary state; one tier sub-national government structure): Decentralisation in Malta is
a recent process that began in 1993 with the adoption of the law on local government and the creation of 67 municipalities (which has since increased o 68). This text is based largely on the European Charter of Local Self-Government, which Malta ratified in 1993. In 1999, a law transferred new competences to the communes and gave them the possibility of creating infra-communal structures. In 2001, the principle whereby Malta is divided into local governments with decisional bodies of which the members are elected by universal suffrage was established in the Constitution. Despite these signs of progress, local governments in Malta dispose of only limited real autonomy.
• Poland (unitary state; three levels of sub-national government structure): Decentralisation in
Poland was launched in 1990 with the re-establishment of local autonomy at municipal level (Act on Municipalities) followed by the first municipal elections held in 1990. It continued in 1999 with the rearrangement of the administrative map of the country and the transformation of the regions and counties into local governments in their own right. This reform established a three-level administrative system of local and regional authorities. The financial aspects of the decentralisation process were defined in the 1998 Act on Local Government Revenue which has since been regularly updated.
• Romania (unitary state; two levels of sub-national government structure): Decentralisation
began in 1991 with the adoption of the new Constitution, which defined the principle of local autonomy and which was implemented by a series of laws on organisation, elections, financing and management of local government. After the local finance reform in 1998, the decentralisation process kept going on with the adoption of a series of laws in 2006 (new Framework Law on Decentralisation, Local Finance Act, Local Public Administration Act, Community Service of Public Interest Act).
• Slovakia (unitary state; two levels of sub-national government structure): After the fall of the
USSR, municipal autonomy was restored in 1990, elections were organised and a series of

42
legislations on the operation of local authorities were adopted. With the public administration reform in 1999 stronger decentralisation took place. In 2002, the regional level of governance was established. New competences were transferred to the municipalities and regions between 2002 and 2004, particularly those for which the districts – devolved level of the state – had been responsible, before being eliminated.
• Slovenia (unitary state, one level of sub-national government structure): Following
independence in June 1991, the Slovenian government rapidly recognised the existence of local authorities, and the Constitution of December 1991 guaranteed their autonomy. Decentralisation was undertaken as of 1993 with the adoption of a series of laws on municipalities and the organisation of local elections in 1994. This process was characterised by a territorial re-organisation of the country. In 1994, the 62 former municipalities were replaced by 147 new municipalities which in 2005 increased to 193 and in 2006 to 210.
2.4. CONSULTATION MECHANISMS BETWEEN SUB-NATIONAL GOVERNMENTS20
2.4.1. General overview Consultation procedures have been established in the majority of European countries, but in very different contexts. In each country, the historical legacies, cultural factors and territorial organisation has influenced the relationship between central government and local and regional governments, creating very different situations in the different countries. Most Nordic countries have established effective consultation mechanisms largely based on significant informal contacts. More specifically, in Finland, Sweden and Denmark there is permanent dialogue between the state and the local authorities, and the associations of local and regional authorities in these countries participate directly in the drafting of legislation that affects them. They moreover hold official partner status with the central institutions, and their input is very often invited. Budgetary issues are often at the heart of these negotiations, as the broad range of competences of the local and regional authorities requires a significant budget which necessarily has a major impact on the national budget. However, in Sweden and Denmark, the weakness of the legislation that defines the procedures sometimes leads the associations to be consulted at a very late stage, or even not at all. It is also important to mention the Baltic countries – Lithuania, Latvia and Estonia – in this context. In these young democracies, associations of local and regional governments have partner status and are largely involved in the drafting of legislation through both formal consultation procedures and informal contacts.
20 This section heavily borrows from a study carried out by the Council of European Municipalities and Regions (2007) on consultation procedures within European States.

43
Exhibit 2 – Overview of the quality of consultation in European countries Quality of consultation procedure Countries Consultation highly satisfactory Austria, Finland, Latvia, Lithuania
Consultation satisfactory Sweden, Denmark, Estonia, Belgium, the Netherlands, Germany, Poland, Spain, Luxembourg
Consultation mediocre France, Italy, Czech Republic, Slovakia Influence very limited United Kingdom, Slovenia, Hungary, Romania, Bulgaria Consultation is pure formality Portugal, Ireland, Greece, Cyprus, Malta Source: Council of European Municipalities and Regions (2007). In the three federal states (Austria, Belgium, Germany) the federal entities have significant legislative power. A major part of consultations is therefore carried out at this level, and associations are organised along federal lines. Consultations at this level vary widely from one state to the other, depending on the legal measures in force in each case. The federal structure provides large possibilities for dialogue as the legislators are close to the local and regional authorities. At federal level, the quality of consultations depends on the legal framework in effect which must allow for the demands of local authorities in the different regions to be defended to the central Government. Italy and Spain have undergone advanced processes of decentralisation and regionalisation during which consultation procedures have been established in order to guarantee the continuity of dialogue between the local authorities and the state. This is also the case in the Netherlands. These procedures have since been further strengthened. In France and the United Kingdom (traditionally amongst Europe’s more centralised states), the adoption of laws on decentralisation have led to an increased dialogue between the state and local and regional governments, as well as to the creation of consultation procedures. In particular, the legal requirement to consult and/or the creation of special committees with strictly established operating methods contributed to the strengthening of the consultation process. However certain problems persist due to the absence of a culture of negotiation. The quality of consultation often depends on the political will of central government. In a certain number of countries the consultation is less developed also in relation to the adoption of legislations and / or policies which directly affect local and regions levels. Local and regional governments in Portugal, Greece and Ireland have limited institutional opportunities to influence laws that relate to their interests. The weakness, or absence, of a legal framework for consultation, the often very tight deadlines assigned for proposing amendments as well as the limited amount of informal contacts reduce the effectiveness of the consultation mechanisms in these countries. In this context, the consultation procedures often remain pure formalities. In the new democracies of Central and Eastern Europe, the participation of local and regional authorities in the legislative process is very uneven depending on the country. In most countries, local governments have been formally recognised in the early 1990s. Associations of local and regional authorities facilitated the inclusion of the local dimension both in legal texts and in practice. This being the case, many countries have consultation procedures that are strictly defined by law: the local and regional governments in Bulgaria, Poland, the Czech Republic, Romania and Slovakia all have a precisely defined and binding framework. In Hungary and Slovenia, consultation systems have been established but consultations are often conducted at a late stage and the procedure is not strictly binding.

44
2.4.2. Examples of institutional arrangement for coordination As stressed above, specific national situations as regards consultation are very different and not easy to compare. In the following, a few examples of the arrangements set up to ensure permanent dialogue and coordination are presented for some of the countries covered in the case studies. Germany Since the 1960s there has been a tendency in Germany for the different administrative levels (Federal Government, Federal States and Municipalities) to cooperate in undertaking their public duties and responsibilities. This is often called co-operative federalism (kooperativer Föderalismus) and political interdependence (Politikverflechtung). Criticisms of this development point to conflicts of responsibility, the low efficiency of public activities a lack of arrangements to enforce cooperation. Consultation and co-operation between the different administrative levels is especially strong in relation to the pursuit of the “Common task” (Gemeinschaftsaufgabe). This applies in particular to the co-operation between the Federal Government and the Federal States. This means, that the Federal Government is involved (as regards planning and/or financing) in cases which normally fall under the responsibility of the Federal States in cases where the project is socially important and is intended to improve living conditions. The ‘Common task’ covers the following policy areas:
1. Structural policy: the Federal Government covers half of expenditure 2. Restructuring of agriculture and of coastal protection: the Federal Government covers at
least half the costs 3. Scientific research outside universities, scientific projects and research in universities,
construction of university buildings: the Federal Government and the Federal States may co-operate if the project is of national importance.
In addition, every Federal State maintains a representative at the Federal Government. The main tasks of the representative are:
• To monitor new laws and to try to influence new legislation that it is in line with the interests of the Federal State concerned;
• To liaise with members of the Federal Government and the Bundestag; • To report back to the Federal State; • To co-operate with Federal Ministries; • To undertake “public relations” for the Federal State.
Moreover, there are several legal agreements between the Federal Government and Federal States as well as between the Federal States themselves. These often relate to supra-regional infrastructure, such as harbours, airports, refuse disposal facilities and energy production. Such agreements may consist of a State treaty or an administrative agreement. One example of an agreement between the different Federal States is the State Treaty concerning the ZDF (Public television). Austria In Austria, a number of formal and informal consultation instruments exist. Essentially, the consultation process is predetermined by the Austrian type of consensual democracy, which has been formed over decades of compromise-based policy making (Biegelbauer et al 2008)21.
21 Biegelbauer, P., Mayer, S. (2008): Regulatory Impact Assessment in Austria: Promising Regulations, Disappointing Practices, in Critical Policy Analysis (2008) vol.2, no 2, pp 118-142

45
One formal instrument is the Federal Council (Bundesrat) which represents the nine federal provinces at the national level. The Austrian Parliament consists of two chambers, the National Council and the Federal Council. Most of the power over legislation is concentrated in the National Council, leaving the Federal Council with nothing except a right of veto (apart from constitutional amendments directly affecting the States). In reality, there tend to very few objections. In the period 1994 to 2005, there were only five (Bußjäger et al 2006)22. A second formal instrument is the formal contracts under Article 15a of the Federal Constitution. This instrument is relatively often used. Since 1974, there have been a total of 80 agreements between the central government and the States. In practice, the procedure to establish formal contracts is regarded as complex and time-consuming (Bußjäger et al 2006). In addition to these constitution–based formal instruments, there are a number of informal coordination instruments, which are seen as being much more significant for cooperative federalism in Austria. In general, there is a tendency – wherever possible – to avoid complicated legal procedures and to opt for flexible informal agreements instead (Bußjäger et al. 2006). Informal coordination instruments include the following 23(Schön 2009):
(i) State Conferences (Länderkonferenzen), which are horizontal coordination platforms representing different political and administrative stakeholders from the nine States such as governors, directors-general, financial heads, experts (Landeshauptleutekonferenz, Landesamtsdirektorenkonferenz, Integrationskonferenz der Länder, Referentenkonferenzen, Landtagspräsidentenkonferenz, Länderexpertenkonferenz). In contrast to the well-established coordination between State activities, coordination between a State and the communities situated there is not yet very developed;
(ii) The joint State representatives (Gemeinsame Ländervertreter) which represent the coordinated positions of the States in discussions and negotiations with the Federal |Government;
(iii) The liaison office of the States (Verbindungsstelle der Bundesländer) which is a supporting apparatus for State coordination and serves as an information interface and secretariat. An office of this has been also established in Brussels;
(iv) Austrian Conference on Spatial Planning (ÖROK) which is an organisation set up 1971 by the Bund, the Länder and the Gemeinden to co-ordinate spatial planning at the national level. Within the context of European regional and spatial development policies, ÖROK plays an important role as the co-ordinating body between the national and the European level24;
(v) The representatives of the communes and cities: the Austrian association of cities and towns representing 246 local governments (bigger cities) and the association of municipalities with a membership of 2,345.
As regards fiscal relations between the administrative levels (Bund, Länder, Gemeinden), three regulations are of most importance:
1. the Fiscal Equalisation Law (Finanzausgleichsgesetz); 2. the Austrian Stability Pact; 3. the Consultation Mechanism.
Since 1948, fiscal equalisation between the public authorities is based on a political agreement between Federal Government, States and municipalities (Fiscal Equalisation Pact). The political agreement determines the legal basis for the Austrian revenue sharing system, the Fiscal 22 Bußjäger, P., Bär, S., Willi, U. (2006): Kooperativer Föderalismus im Kontext der Europäischen Integrati-on, Innsbruck 2006, FÖDOK 23. 23 Schön, C. (2009): Zur EU-Politik der österreichischen Bundesländer – unter besonderer Berücksichtigung ihrer regionalpolitischen Interessen, FÖDOK 30, Institut für Förderalismus, Innsbruck 2009. 24 For information see: www.oerok.gv.at

46
Equalisation Law (FAG). The FAG usually is valid for 3 to 6 years. It defines the types of taxes to be assigned to the levels of government (own taxes) and the taxes to be shared between them. It determines the distribution formula for the shared taxes and also specifies major transfer flows between the public authorities (esp. from federal to state government). The Fiscal Equalisation Pact is usually negotiated as a whole package, which includes in addition to the FAG also issues such as the intra-Austrian stability pact and reform issues related to administrative reform, e.g. health care (hospitals, social security) and housing subsidies25. The obligations of the European Growth and Stability Pact (Konvergenzkriterien) represent a challenge for the federally organized Austrian system; effective intra-Austrian coordination of fiscal policy is needed. The Austrian Stability Pact provides for national budget coordination (Austrian and Federal coordination committees concerning budget management), the medium-term orientation of public budgets and the allocation of national convergence criteria (breakdown of public deficit ratio to sub-sectors and States) as well as regulations on an information system for mutual reporting and on sanction mechanisms (definition of penalty costs). Moreover, in 1999, a legal basis (outside the Federal Constitution) was established in order to formalise a shared consultation procedure. The Consultation Mechanism26 is an agreement between the Federal |Government, the States and the municipalities (represented by the Austrian Association of Cities and the Austrian Association of Municipalities). It is designed to consider the budgetary costs to Federal/regional/local authorities arising from the legislation introduced by other authorities (federal and state legislation except tax regulations, fiscal equalization law and obligations by Community law). This mechanism represented an important step towards assessing the financial impact of regulations. The consultation mechanism includes mutual information obligations with the opportunity to comment on all legislative measures, the right to request negotiations in the consultation panel (Konsultationsgremium) and regulations on cost bearing and reimbursement of expenses. In the period 1999 to 2005 there were around 250 requests submitted, which demonstrates the practical significance of the consultation mechanism (Bußjäger et al 2006). Spain After more than 30 years of devolution, Spain is one of the most decentralised countries in Western Europe at regional level and there has been a continuous transfer of competences from Central government to regional (state) and local government over government expenditure and taxes. This decentralization process has made it necessary to establish several institutional arrangements to ensure permanent dialogue and coordination between the different administrative levels (central, regional and local governments). Several bodies are in charge of these coordination arrangements, which are mostly dependent on the Ministry of Economy and Treasury and the Ministry of Public Administrations. The Directorate-General for Financial Coordination with the Autonomous Regions and Local Entities is the main body for coordination (Ministry of Economy and Treasury). Its responsibilities include:
1. Studying, reporting on and proposing rules and measures regarding regional tax systems.
25 Bröthaler, J. (2008), Entwicklung des österreichischen Finanzausgleichs 1948–2008 und finanzielle Aus-wirkungen 1976–2011 (Development of the Austrian Revenue sharing system 1948–2008 and financial effects 1976–2011), in: Bauer, H., Hrsg. (2008), Finanzausgleich 2008, Ein Handbuch – mit Kommentar zum FAG 2008, Öffentliches Management und Finanzwirtschaft 8, Wien/Graz, S. 213–244. 26 BGBl. I Nr. 35/1999: Vereinbarung zwischen dem Bund, den Ländern und den Gemeinden über einen Konsultationsmechanismus und einen künftigen Stabilitätspakt der Gebietskörperschaften; BMF (2009b).

47
2. The application of the systems agreed with the Basque Country and the Foral (traditional law) Region of Navarra, as well as studying, reporting on and proposing rules and measures relating to these systems.
3. The application and management of the financing system for the Autonomous Regions. 4. Estimation of the costs of the services and functions that are transferred, 5. The application and management of the financing system for local authorities. 6. The management of other national resources that finance local authorities. 7. Technical assistance on the budgetary and financial system to local authorities. 8. The monitoring of compliance with budgetary stability objectives. 9. Monitoring of the economic-financial system of the autonomous regions and local
authorities through the collection and processing of information and the preparation of statistics.
The Fiscal and Financial Policy Board of the Autonomous Regions was created in 1980 n the Ministry of the Economy and Public Treasury in order to ensure effective coordination between the financing activities the Autonomous Regions and those of the State Treasury. The Fiscal and Financial Policy Board consist of the Ministry of the Treasury, the Ministry of Public Administrations and the Regional Treasury Minister of each Autonomous Region. The Directorate-General for Financial Coordination with the Autonomous Regions is responsible for performing the role of secretariat. The Board has authority over the following:
- coordination of the budgetary policy of the Autonomous Regions with national budgetary policy
- issuing reports and adopting the resolutions provided for in the Organic Law complementing the General Budgetary Stability Act
- studying and assessing the resource distribution criteria of the Compensation Fund - studying, preparing (if applicable) and revising the methods used for calculating the costs of
the services transferred to the Autonomous Regions - appraising the reasons justifying, in each case, the receipt of the budgetary allocations by the
Autonomous Regions, - coordination of debt policy - coordination of public investment policy - all aspects of the financial activity of the Autonomous Regions and of the State Treasury
that, given their nature, require coordinated action. The Board meets at least twice a year. The Virtual Office of Financial Coordination with Local Entities, created in 2009 by the Ministry of the Economy and Public Treasury, is intended to become the main means of communication between the Directorate General of Financial Coordination with the Autonomous Communities and local bodies and local authorities in all aspects of financing and sharing of budgetary and economic data. Another coordination body is the National Committee of Local Administrations (CNAL) which is under the Ministry for Public Administration and is the permanent body for cooperation between the State and Local Administrations. The Plenary is made up of an equal number of representatives of Local Government and the State Administration and it has to meet at least once a year, while Sub-Committees hold at least three meetings a year. The Committee is responsible for:
1. Issuing reports relating to Bills and State Regulations affecting Local Administration and on criteria for the authorisation of debt operations of the Local Corporations.

48
2. Putting forward proposals and suggestions to the Government as regards Local Administration and particularly on:
a. Assignation and delegation of competences to Local Government b. Distribution of subsidies, credits and transfers from the State to Local
Administration c. Participation in Local Tax Offices in State taxes d. Assessment of the effect of the General State Budgets on Local Government.
A number of other bodies have been created for ensuring better coordination between the different administrative levels in specific areas, such as:
1. Red de Autoridades Ambientales (Environmental Authorities Network), created as a forum for cooperation and coordination between the authorities responsible for the environment and those responsible for the programming and management of the Structural Funds and the Cohesion Fund at the different administrative levels (European, central, regional and local). It was created in 1997.
2. Foro de Economía y Política Regional, regional managers of European Funds of every comunidad autónoma meet every 4 months in a different Spanish region to study developments, , discuss results obtained and coordinate future actions.
France Theoretically, local governments act independently from central government policies in France, according to the constitution which guarantees local autonomy to elected councils (regional, provincial and municipal) and according to the decentralization laws which give them specific competences in various areas of government. In reality, the situation is more complex and numerous consultation procedures result in permanent dialogue and cooperation between the different levels of government, especially in relation to investment. The political system. In France, most senators and members of the National Assembly are at the same time mayors or presidents of provinces or regions, despite previous legal decisions restricting such overlapping mandates. Moreover, the Senate has always been considered as the ‘grand’ council of the French communes and focuses a large part of its activities and discussions on matters related to local governance. Those discussions are also carefully followed by the three national associations, representing the mayors, the presidents of départements and the presidents of régions the main leaders of which are also members of the Senate or the National Assembly. The result is that local decision-makers are l involved to a large extent in national debates, a fact that has consequences for local life, especially when local resources and the transfer of competences are concerned. The official partnership commissions. The importance of local government leaders in national decision-making processes is also enhanced by the role of joint commissions that are in charge of the preparation of government decisions. The most powerful commission is the ‘committee for local finance’ which has played a prominent role over the past 30 years, especially over decisions relating to the block grants (DGF – dotation globale de fonctionnement) allocated each year by the State to local governments. The effectiveness of the ‘local lobby’ in national decisions is reflected in the fact that, up until 2008, the increase in the DGF was always higher than the increase in the national budget.

49
The contractual system between the state and local governments. A significant part of public capital expenditure is decided through multi-annual contracts, especially the ‘contrats de plan Etat-Régions’ which have existed since 1982. The contract for the 2000-2006 period amounted to approximately EUR 35 billion, half of this sum being provided by the State. The plan covers mainly transport infrastructure, education and research, agriculture, urban policies and the environment. There are also other types of contracts concerned joint investment by the State and local governments over the past 20 years:
- Contrats de ville (for poor urban districts) - Contrats de pays (for rural areas) - Pôles de competitivité (research and development clusters)
The permanent dialogue between the prefects and local authorities. As the unique representative of the State, the prefect spends large part of his time in negotiations with local governments over financing joint projects. This is naturally the case for big investment projects, whether included or not in a multi-annual contract (for example the ITER project, for nuclear fusion research in Provence-Côte d’Azur or the TGV line extension to Brest and Quimper in Brittany). According to the legal allocation of competences, only one level of government should be involved in such projects, but in practice, in most situations, the various levels are eager to participate in order to show their involvement in local development. Finally, interlocking responsibilities are so common that there are only few investment projects which concern only a single level of local government. For instance:
- modernisation of public utilities (despite financial help from the other levels for major investment such as tramways) at the level of Communes;
- construction and improvement of roads and junior high schools at the level of départements. - modernisation of regional railways, construction and modernisation of high schools at the
level of régions. Portugal In the Portuguese public administration system, permanent coordination between central, regional and local governments is undertaken primarily through institutional relationships between various bodies of the central administration, the Regional Governments of Madeira and the Azores and the local administrations (municipalities and parishes) and their associations. Accordingly, there are few examples of coordination bodies in which different administration levels are represented and able to establish a permanent, pier-to-pier dialogue. For the Central Government, the body with responsibility for supervising municipalities is the Directorate-General of Local Autarchies (DGAL), a central service of the State under the Council of Ministers and responsible for designing, implementing and coordinating support measures to Local Administration and technical and financial cooperation between Central and Local Administration. DGAL produces legislative proposals, studies and opinions on matters of municipal interest, follows the process of municipal administrative modernisation, identifies the potential, the bottlenecks and the challenges which local administrations faces, and is consulted about legislative initiatives relating to local government by Parliament. Other bodies which are relevant are the five Commissions of Coordination and Regional Development (CCDR), which come under the Ministry of Environment and Spatial Planning.

50
The primary responsibility of the CCDRs is the promotion of integration between regional and local development, spatial planning and environmental policies. They are also an important lever for arrangements between central and local administration, as well as a kink between regional, national and European levels, through the management of Regional Operational Programmes and European Territorial Cooperation Programmes. Within each CCDR, there are also Regional Councils, which are advisory bodies to the CCDR management, composed of municipalities and parish representatives, universities, tourist agencies, environmental NGOs, local development associations and civic associations. At local government level, coordination is undertaken by the National Association of Portuguese Municipalities (ANMP) and the National Association of Parishes (ANAFRE) mandated to represent and defend the interests of their members. At the regional, sub-regional and metropolitan level, there are other forms of association which ensure horizontal cooperation between authorities and with other levels of administration. It should also be noted that municipalities, mostly through their associations, have cooperated in various ways with the CCDRs in the management and monitoring of investment programmes supported by Structural Funds, particularly the Regional Operational Programmes. In the Autonomous Regions of Madeira and the Azores, coordination of municipalities with the Central Government and the Regional Government operates primarily through the respective Associations of Municipalities of the Autonomous Regions, which are represented in various advisory bodies to the Regional Government and Central Administration. Czech Republic In the Czech Republic there are no permanent institutions or arrangements that ensure dialogue and coordination between the different administrative levels. Except in some specific areas, where power is divided between a number of different stakeholders and coordination is undertaken by a Government committee, each public authority is responsible for ensuring dialogue. In this regard, two formal consultation processes can be distinguished:
- Remark proceedings to Czech government are a formal aspect of the decision-making process which leads to a government decree. All central authorities may present their remarks, while regions (kraj) may also submit statements, but the central authority is not obliged to follow them. This process is very formal and in fact does not contain a strong partnership element.
- Public consultation, which covers not only statements of all interested public authorities (central, regional, local – municipalities), but also representatives of civil society, self-governing institutions (chambers of commerce, universities), representatives of interest group etc. This process tales place, in particular, when new policies are designed or some important documents are produced (strategic plans, programmes).
- On the other hand, the culture of “informal” consultation and partnership has certainly strengthened in recent years by Cohesion Policy, particularly as regards economic development.

51
For instance, the National Strategic Reference Framework (NSRF) for the 2007-2013 programming period was drafted to respect the principle of partnership in line with regulations. The role of the Monitoring Committee of NSRF is undertaken by the Management and Co-ordination Committee (MCC), established by the MRD. The MCC: - discusses and recommends the financial and factual modifications of the approved Operational
Programmes; - discusses and approves the proposals and modifications of procedures and rules for the
implementation of social and economic Cohesion Policy; - approves and submits to the Government measures, to improve the efficient implementation of
the NSRF and OPs; - discusses and approves the proposals for financial and factual modifications of the NSRF
Commission's Decision. The MCC became the most important means of co-ordination ensuring the involvement of all relevant stakeholders in the implementation of the Structural and Cohesion Funds. The Minister for Regional Development chairs the Committee, other members include representatives of relevant ministries, territorial self-government (represented by regions, including the Capital City of Prague and representatives of the Union of Towns and Municipalities), economic and social partners, educational institutions and the non-profit sector. The meetings of the MCC are regularly attended by representatives of the Union of Czech and Moravian Production Co-operatives, the Agrarian Chamber and the Academy of Sciences as observers. Representatives of the various institutions are senior enough to enable the MCC to take important decisions. Representatives of partner organisations were actively involved in the preparation of strategic documents for the 2007-2013 programming period, mainly by commenting on draft versions of strategic and programming documents. The comments were presented at the meetings of the working groups and were then incorporated into the relevant documents, subject to the final approval of the MCC. Poland In Poland there are the following committees dealing with co-ordination and consultation between the central and local governments as well as between the central government and social and business partners: - the Joint Central and Local Government Committee; - the Tripartite Commission for Socio-Economic issues, composed of representatives of the
government, employers and employees; - the Parliamentary Commission of the Local Government; - the NSRF Coordination Committee.
The Joint Central and Local Government Committee (JCLGC) was set up in 2005. Membership includes representatives of the central government as well as nationwide organizations of municipalities, districts and regions. The Committee has two chairmen – one from the central government (the Minister of Internal Affairs and Administration) and one from local government. The main task of the JCLGC is analysing and making recommendations on new legislation concerning the organization, competences and finance of local government. The Tripartite Commission for Socio-Economic issues was established in 1994 and since 2001 has served as a platform for social dialogue between employers, employees and the government (which represents the public interest).

52
The aim of Commission’s activity is to achieve and maintain social peace. Every party can invite a representative of social and professional organizations to participate in the work of the Commission. In the Commission, trade unions have three representatives27 and employers’ organizations four28. The government is represented by the eleven most important ministries29. Primarily, the Commission discusses problems relating to employees’ rights and duties as well as to business conditions. Every year the government presents budget proposals for t future salaries in the public sector. The Commission discusses the proposals and, if there is no agreement, the government is obliged to amend the proposals in the light of the Commission’s recommendations. The Parliamentary Commission of the Local Government (CLG) is an important forum for consultation between the Parliament and local government. The CLG invites representatives of the local government to participate in meetings. The Coordination Committee for NSRF / National Development Strategy ensures a proper realisation of the function of the strategic monitoring and evaluation of the NSRF implementation. It also coordinates Cohesion, Common Agricultural and Maritime Policy. The Committee is chaired by the Minister in charge of regional development, and composed of representatives of ministers involved in the implementation of particular operational programmes, Minister in charge of public finances, voivodeships’ marshals, voivodes, representatives of territorial self-government groupings and representatives of social partners (organisations grouped in the Trilateral Commission, non-governmental organisations, academic institutions). The representatives of the EC, the representatives of EIB and EFI may participate in the sittings of the Committee. The Committee carries out a term review of the NSRF implementation and presents recommendations resulting from the analysis to the Minister in charge of the regional development. It provides its advice on the proposals of the Minister, in particular in relation to transfers of resources among programmes.
27 The criteria for representatives of employees are as follow: (i) more than 300 000 members, (ii) active in majority of economic sectors. 28 The criteria for representatives of employers are as follow: (i) members employing more than 300 000 employees, (ii) nation-wide activity, (iii) active in majority of economic sections. 29 The Prime Minister appoints the representatives of the Council of Ministers.

53
2.5. THE EUROPEAN OUTLOOK: EXPENDITURE AND REVENUE OF DIFFERENT ADMINISTRATIVE LEVELS After the description of the main features of decentralisation in Europe, this section is aimed at completing the assessment by examining the distribution of responsibility and resources from a quantitative perspective. The investigation is carried out using for each Member State harmonised data available at the EU level and in particularly the Government Finance Statistics provided by Eurostat which are defined according to ESA 199530. The analysis covers both the expenditure and the revenue side of sub-national governments. Regarding sub-national government expenditure a distinction is made between current and capital expenditures but also between expenditure by economic function (COFOG). The revenue side is disaggregated into transfers and “direct” revenues. The analysis31 focuses on the situation of sub-national governments in Europe on average in 2005-2007 and on the changes that occurred since the 1990s. It considers the different Member States individually and compares their characteristics with those observed on average for different country groups. In particular the study distinguishes between “federal states” (Germany, Austria and Belgium), “regionalised states” (Italy and Spain), countries with “Northern systems” (Sweden, Finland and Denmark) and “other unitary states” (including “Old” and “New” Member States).
2.5.1. Expenditure Sub-national government expenditure in European countries represents on average 34% of general government expenditure (GGE) and 16% of GDP (following exhibit). The weight of this expenditure varies considerably between countries, partly reflecting differences in systems of governance. The highest share of sub-national government expenditure is in Denmark, where around 64% of GGE is accounted for by local government, equivalent to 33% of GDP. The share of sub-national government expenditure is, however, also high in the other countries with a “Northern system” of governance, Sweden (45% of GGE and 25 % of GDP) and Finland (40% of GGE and 19% of GDP), the federal countries of Germany (43% of GGE and 20% of GDP) and Belgium (42% of GGE and 21% of GDP) and the “regionalised” country of Spain (54% of GGE and 21% of GDP). The share of sub-national expenditure, on the other hand, is lower in Austria (at around 33% of GGE and 16% of GDP).
30 The 1995 ESA replaces the European System of Integrated Economic Accounts published in 1970 (1970 ESA; a second, slightly modified edition appeared in 1978). 31 It is worth at this stage emphasising on the need of an integrated lecture of this section with the qualitative information provided in other parts of the study and in particular with the previous sections. This permits to contextualise the results and to avoid misinterpretation.

54
Exhibit 3 - Sub-national government expenditure as a % of GGE
20
30
40
50
1990
1991
1992
1993
1994
1995
1996
1997
1998
1999
2000
2001
2002
2003
2004
2005
2006
2007
% o
f gen
eral
gov
ernm
ent e
xpen
ditu
re
Federal states "Regionalised" states "Northern systems"
Other Unitary states Total
Note: Federal states: AT, BE, DE: “Regionalised” states: ES, IT; countries with “Northern systems”: DK, FI, SE; Other Unitary states: EU27 without Federal states, “Regionalised” states and countries with “Northern systems”; Source: own calculation based on Eurostat data Exhibit 4 - Sub-national government expenditure in % of GDP
5
10
15
20
25
30
1990
1991
1992
1993
1994
1995
1996
1997
1998
1999
2000
2001
2002
2003
2004
2005
2006
2007
% o
f GD
P
Federal states "Regionalised" states "Northern systems"
Other Unitary states Total
Note: Federal states: AT, BE, DE: “Regionalised” states: ES, IT; countries with “Northern systems”: DK, FI, SE; Other Unitary states: EU27 without Federal states, “Regionalised” states and countries with “Northern systems”; Source: own calculation based on Eurostat data In most unitary states as well as in the countries which have entered the Union since 2004, the importance of sub-national government spending is much lower at around 25% of GGE and 11% of GDP. Malta and Cyprus have the smallest shares of sub-national government spending (respectively 1% and 5% of GGE). The share is also small in the southern countries Greece (6% of GGE) and to a lesser extent Portugal (13%). Among the new Member States, Poland has the largest share of expenditure at local and regional level (31% of GGE and 13% of GDP).

55
The share of sub-national government spending in GDP has been fairly stable over the past 15 years (see exhibit above) though there has been a slight tendency for government expenditure to become more decentralised, as reflected in the share of local government spending in GGE (see exhibit 3). Between 1990 and 2007 local and state government expenditure across the EU as a whole rose from 31% to 34% of GGE and from 15% to 16% of GDP. This slight expansion was mainly driven after the mid-1990s by increased sub-national government spending in the “regionalised” countries of Spain and Italy as well as in the Nordic countries. This average tendency conceals different patterns of change. The exhibit below distinguishes four different groups of countries according to their level of decentralised government spending and the change in this over the past 15 years. Situated at the upper right part of the chart, a first group of countries has high levels of decentralised government spending and a tendency towards even greater financial decentralisation. These are the Nordic countries of Denmark, Sweden and Finland, the “regionalised” country of Spain and the federal states of Belgium and Germany, though it is evident to a lesser extent for the last. However, it is evident from the change in sub-national government spending relative to GDP (exhibit 6) that over the period concerned only Belgium, Denmark and Spain have actually been engaged in a financial decentralisation process. A second group of countries which is situated at the upper left part of the chart is composed of countries with a lower than average share of sub-national government expenditure in 2005-2007 relative to GGE but in which the share increased over the period under consideration. This quadrant contains most of the new Member States though also the “traditional” centralised state of France as well as the southern countries of Greece and Portugal. Overall, decentralisation seems to have occurred most in Slovakia and Romania. In contrast to this latter group, countries in the lower left part of the exhibit have a tendency towards less decentralised government expenditure despite the fact that sub-national government expenditure is already low. This is particularly the case in Ireland.
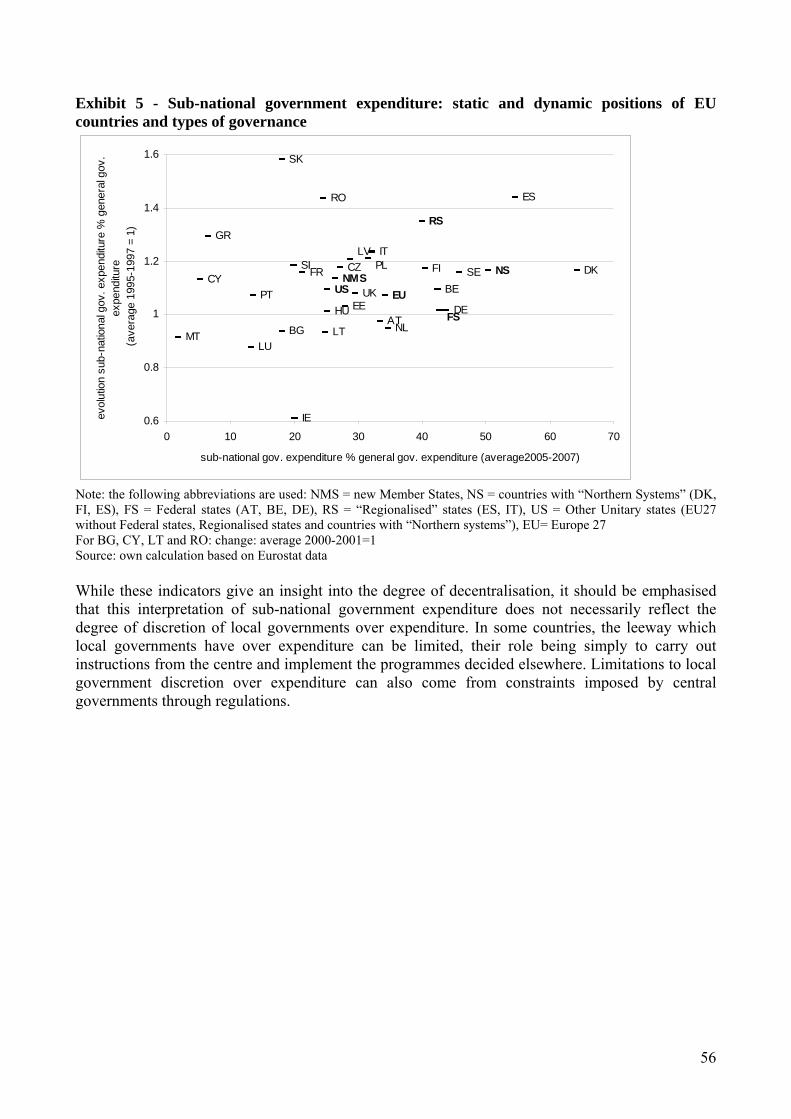
56
Exhibit 5 - Sub-national government expenditure: static and dynamic positions of EU countries and types of governance
UK
LV
EE
CZNMS
HU
US
LT
RO
FR
IE
SI
BG
SK
PT
LU
GR
CY
MT
PLIT
AT
EU
NL
RS
FI
BE
FSDE
SE NS
ES
DK
0.6
0.8
1
1.2
1.4
1.6
0 10 20 30 40 50 60 70
sub-national gov. expenditure % general gov. expenditure (average2005-2007)
evol
utio
n su
b-na
tiona
l gov
. exp
endi
ture
% g
ener
al g
ov.
expe
nditu
re (a
vera
ge 1
995-
1997
= 1
)
Note: the following abbreviations are used: NMS = new Member States, NS = countries with “Northern Systems” (DK, FI, ES), FS = Federal states (AT, BE, DE), RS = “Regionalised” states (ES, IT), US = Other Unitary states (EU27 without Federal states, Regionalised states and countries with “Northern systems”), EU= Europe 27 For BG, CY, LT and RO: change: average 2000-2001=1 Source: own calculation based on Eurostat data While these indicators give an insight into the degree of decentralisation, it should be emphasised that this interpretation of sub-national government expenditure does not necessarily reflect the degree of discretion of local governments over expenditure. In some countries, the leeway which local governments have over expenditure can be limited, their role being simply to carry out instructions from the centre and implement the programmes decided elsewhere. Limitations to local government discretion over expenditure can also come from constraints imposed by central governments through regulations.

57
Exhibit 6 - Sub-national government expenditure
as % of general government expenditure as % of GDP average average
2005-2007 2000-2002 1995-1997 1990-1992 2005-2007 2000-2002 1995-1997 1990-1992 BE 42 41 38 35 21 20 20 16 DE 43 44 43 46 20 21 22 20 AT 33 34 34 35 16 17 19 18 UK 29 29 27 28 13 12 11 12 DK 64 59 55 54 33 32 32 30 IE 20 41 32 29 7 14 12 19 FR 21 19 18 18 11 10 10 9 IT 32 31 26 27 15 15 13 15 LU 13 14 15 16 5 6 6 7 NL 34 35 36 33 15 16 18 18 PT 13 14 12 11 6 6 5 5 FI 40 38 34 40 19 18 20 22 SE 45 44 39 25 25 25 CZ 27 23 23 12 10 10 GR 6 6 5 3 3 2 ES 54 47 38 21 18 16 MT 1 2 2 1 1 1 SI 20 18 17 9 9 8 EE 28 27 27 10 10 10 LV 28 27 23 10 10 9 SK 18 7 11 6 3 6 PL 31 32 26 13 14 12 HU 25 25 24 12 12 13 CY 5 4 2 2 LT 24 26 8 10 RO 24 17 9 7 BG 18 19 7 8 Federal states BE, AT, DE 42 43 42 43 20 20 21 20
"Regionalised" states ES, IT 39 36 29 27 18 16 14 15
"Northern systems" DK, SE, FI 50 47 43 47 26 25 26 26
Other Unitary states (all other) 25 24 23 24 11 11 11 11 New Member States 26 25 23 11 11 11 Total EU 34 33 31 32 16 15 16 15 Source: own calculation based on Eurostat data Note: For AT, BE, DE and ES, state government expenditure and local government expenditure have been grouped together.

58
2.5.1.1. Sub-national government expenditure by type Current expenditure Current expenditure of sub-national governments is in most countries the major part of expenditure, representing on average some 82% of the total, the remainder consisting of capital expenditure (15%) and interest payments (3%) (exhibit 10). Current expenditures consists of the compensation of employees and intermediary consumption (56%), social benefits and transfers to households, enterprises and to the rest of the world (23%) and subsidies to companies (3%). Current expenditure absorbs an even large share of the total in countries where sub-national governments manage extensive social protection systems or where their competence includes education, the police service and healthcare. Consequently, current expenditure in sub-national budgets is larger than average in the three Nordic countries (96% in Denmark, 93% in Sweden and 91% in Finland), the three federal states (88% in Austria, 87% in Belgium, and 83% in Germany), Lithuania and Bulgaria (85%), the UK (89%) and the Netherlands (84%). Exhibit 7 – Current expenditure by sub-national governments in % of total expenditure of sub-national governments
70
75
80
85
90
95
100
1990
1991
1992
1993
1994
1995
1996
1997
1998
1999
2000
2001
2002
2003
2004
2005
2006
2007
% o
f sub
-nat
iona
l gov
ernm
ent e
xpen
ditu
re
Federal states "Regionalised" states "Northern systems"
Other Unitary states Total
Source: own calculation based on Eurostat data Note: Federal states: AT, BE, DE: “Regionalised” states: ES, IT; countries with “Northern systems”: DK, FI, SE; Other Unitary states: EU27 without Federal states, “Regionalised” states and countries with “Northern systems”; Over the past 15-17 years the share of current expenditure in total sub-national government spending has remained broadly unchanged at a very high level for the Nordic countries (exhibit above) and has increased in most of the other European countries. The change has been most marked in unitary states in which the share of current expenditure in sub-national government spending increased from 73% at the beginning of the 1990s to 83% in 2007.

59
Within current expenditure, social benefits and transfer payments are particularly important in Denmark (39%), Austria (37%) and Germany (36%), where most social services are managed and provided by sub-national levels of government in Denmark, all of such services. Capital expenditure On average, capital expenditure accounts for 15% of government expenditure32 at the sub-national level, the major element being gross fixed capital formation (11% of sub-national government spending) (exhibit 10). Capital transfers play a more limited role (4%) except in the federal countries where they account for slightly more than the half of total capital expenditure at the sub-national level. Sub-national governments play a particularly important role in relation to capital expenditure (exhibit 11). On average, 61% of general government capital expenditure is undertaken by local and/or state governments, with the proportion being even higher in federal and regionalised states (77% and 65%, respectively). In comparison, current expenditure at the sub-national government level in relation to general government current expenditure represents on average 33% (41% and 39% in federal and regionalised states). These figures indicate that capital expenditure is much more decentralised than current expenditure. The role of sub-national governments in capital expenditure and in particular in gross fixed capital formation is marked in decentralised countries where local governments are responsible for most public infrastructure investment (in education, public health, transport etc.). Their role is also important in more centralised countries. Whereas, therefore, the share of capital expenditure in the EU averages 15% of total spending (exhibit 10), it amounts to 45% of local budgets in Ireland, around a third in Luxembourg, Portugal and Cyprus and around a quarter in France and the Czech Republic. It should be reiterated, however, that the above figures are liable to give an exaggerated impression of the discretion of local governments over expenditure. In a number of countries, local governments essentially carry out policies decided at national or state level so that the figures for capital expenditure do not accurately reflect their decision making power over investment. This is particularly the case for Ireland, where local capital expenditure is defined by the government in the Public Capital Programme as well as for the Netherlands, where the state can ask local governments to carry out projects that would normally fall under its authority.
32 Capital transfers not consolidated.

60
Exhibit 8 - Sub-national government spending on GFCF in % of GDP
0.5
1.0
1.5
2.0
2.5
3.0
1990
1991
1992
1993
1994
1995
1996
1997
1998
1999
2000
2001
2002
2003
2004
2005
2006
2007
% o
f GD
P
Federal states "Regionalised" states "Northern systems"
New Member States Other Unitary states Total
Source: own calculation based on Eurostat data Note: Federal states: AT, BE, DE: “Regionalised” states: ES, IT; countries with “Northern systems”: DK, FI, SE; Other Unitary states: EU27 without Federal states, “Regionalised” states and countries with “Northern systems”; Exhibit 9 - Sub-national government spending on GFCG as a % of total sub-national government spending
0
5
10
15
20
25
1990
1991
1992
1993
1994
1995
1996
1997
1998
1999
2000
2001
2002
2003
2004
2005
2006
2007
% o
f sub
-nat
iona
l gov
ernm
ent e
xpen
ditu
re
Federal states "Regionalised" states "Northern systems"
New Member States Other Unitary states Total
Source: own calculation based on Eurostat data Note: Federal states: AT, BE, DE: “Regionalised” states: ES, IT; countries with “Northern systems”: DK, FI, SE; Other Unitary states: EU27 without Federal states, “Regionalised” states and countries with “Northern systems”;

61
Exhibit 10 - Sub-national government expenditure by category as a % of total sub-national government expenditure (average 2005-2007)
Tota
l
Cur
rent
ex
pend
iture
Com
pens
atio
n,
inte
rmed
iate
co
nsum
ptio
n
Subs
idie
s to
com
pani
es
Soci
al b
enef
its ,
Tran
sfer
s
Inte
rest
cha
rges
Cap
ital
expe
nditu
re
GFC
F
Cap
ital
Tran
sfer
s
BE 100 87 56 3 29 1 11 7 4 DE 100 83 43 4 36 5 12 5 7 AT 100 88 40 10 37 1 12 5 7 UK 100 89 76 2 11 2 9 8 2 DK 100 96 55 2 39 0 4 4 0 IE 100 54 42 0 12 1 45 42 2 FR 100 74 50 6 18 2 24 21 2 IT 100 81 56 3 22 2 17 12 5 LU 100 68 56 2 9 1 31 31 1 NL 100 84 68 3 12 3 14 14 2 PT 100 67 54 2 11 2 31 27 6 FI 100 91 80 1 11 1 8 9 0 SE 100 93 74 2 17 1 6 7 0 CZ 100 75 61 8 6 1 24 20 4 GR 100 76 71 0 5 1 23 22 1 ES 100 81 56 2 22 2 18 13 5 MT 100 74 74 0 0 0 26 26 0 SI 100 78 67 2 9 0 22 20 3 EE 100 79 71 2 7 1 20 19 1 LV 100 74 68 0 6 1 25 20 5 SK 100 82 73 4 4 1 18 18 1 PL 100 79 65 1 13 1 20 18 2 HU 100 82 73 1 8 1 17 14 4 CY 100 61 59 0 3 7 32 32 0 LT 100 85 75 1 9 0 15 15 0 RO 100 76 62 1 13 1 24 22 1 BG 100 85 80 1 4 0 15 21 0 Federal states BE, AT, DE 100 84 44 5 35 5 12 5 6
"Regionalised" states ES, IT 100 81 56 3 22 2 17 12 5
"Northern systems" DK, SE, FI 100 94 67 2 24 1 5 6 0
Other Unitary states (all other) 100 79 66 2 10 1 21 18 3 New Member States 100 81 64 3 13 2 17 15 2 Total EU 100 82 56 3 23 3 15 11 4 Source: own calculation based on Eurostat data Note: For AT, BE, DE and ES, state government expenditure and local government expenditure have been grouped together.

62
Exhibit 11 - Sub-national government expenditure in % of general government expenditure per type (average 2005-2007)
Tota
l
Cur
rent
exp
endi
ture
Com
pens
atio
n,
inte
rmed
iate
co
nsum
ptio
n
Subs
idie
s to
com
pani
es
Soci
al b
enef
its,
Tran
sfer
s
Inte
rest
cha
rges
Cap
ital e
xpen
ditu
re
GFC
F
Cap
ital T
rans
fers
BE 42 43 75 32 24 7 66 91 42 DE 43 41 73 73 26 39 80 73 88 AT 33 33 47 50 23 4 61 72 54 UK 29 29 42 37 9 13 42 71 15 DK 64 66 70 32 65 9 58 70 12 IE 20 13 20 0 6 8 62 76 15 FR 21 18 30 50 7 8 65 71 34 IT 32 32 51 59 16 6 59 79 35 LU 13 10 26 6 2 36 29 40 2 NL 34 33 63 36 9 17 62 67 53 PT 13 10 19 9 3 4 52 66 29 FI 40 40 69 10 10 10 56 67 5 SE 45 47 71 32 19 15 44 54 11 CZ 27 25 49 51 4 7 41 48 22 GR 6 6 11 0 1 1 15 19 3 ES 54 53 78 44 29 19 73 71 81 MT 1 1 2 0 0 0 4 4 0 SI 20 18 33 11 4 1 43 48 33 EE 28 26 41 19 5 51 36 37 18 LV 28 26 41 5 5 15 39 44 36 SK 18 16 38 22 2 3 37 58 7 PL 31 29 55 21 9 5 59 63 41 HU 25 25 49 9 5 2 37 44 27 CY 5 3 6 0 0 5 18 22 0 LT 24 25 39 7 7 2 25 29 2 RO 24 23 34 3 10 8 32 38 9 BG 18 18 32 7 2 1 18 33 1 Federal states BE, AT, DE 42 41 71 63 26 31 77 75 78 "Regionalised" states ES, IT 39 39 61 53 20 8 65 75 49 "Northern systems" DK, SE, FI 50 51 70 28 31 12 51 60 10 Other Unitary states (all other) 26 25 45 21 6 4 43 49 23 New Member States 25 23 38 39 8 9 53 65 23 Total EU 34 33 51 48 17 15 61 69 47 Source: own calculation based on Eurostat data Note: For AT, BE, DE and ES, state government expenditure and local government expenditure have been grouped together. From a dynamic perspective, sub-national government gross fixed capital formation has been relatively high in recent years particularly in the new Member States (the EU12 countries) and the regionalised countries. This is not only due to increased decentralisation but in the EU12 also to increased government spending in upgrading, renewing and extending infrastructure. Local governments in most EU12 countries are actively involved in local GFCF both in terms of renovation and new construction a well as in ensuring compliance with EU norms in key areas such as transport and the environment. EU funding allocated as part of Cohesion Policy seems to have driven sub-national public capital expenditure in these countries in particular.

63
2.5.1.2. Sub-national government expenditure by economic function At European level, social protection (gf10) and education (gd09) are the main sub-national government expenditure functions, accounting respectively for 19% and 21% of the total (see exhibit below). Sub-national social protection expenditure is particularly important in the Nordic countries (27% in Sweden, 23% in Finland) as well as in the UK (28%) and Germany (25%). Conversely, social protection expenditure represents less than 10% of sub-national budgets in most EU12 Member States and the southern European countries (Greece, Spain and Italy). Expenditure on education is the major item of the budget in all EU12 countries (excluding Cyprus and Malta), its share ranging from 30% in Hungary, Slovakia, Poland and the Czech Republic to 40% in the three Baltic States. This is essentially due to the fact that local governments in most of the EU12 countries are responsible for amenities and the remuneration of primary and secondary school teaching staff. Expenditure is also large in the UK (32%) where education is a responsibility of local authorities and Belgium (32%) where in addition to the extensive involvement of local government tiers in education management, federal entities also have responsibilities for higher education.

64
Exhibit 12 - Distribution of Total General Government expenditure by economic function (average 2005-2007) at sub-national and central levels
total gf01 gf02 gf03 gf04 gf05 gf06 gf07 gf08 gf09 gf10 BE CG 100 52 4 4 8 0 0 3 0 4 25 LG+SG 100 19 0 4 15 3 2 2 6 32 17 BG CG 100 45 6 10 14 1 1 9 2 6 5 LG 100 10 1 1 13 11 10 11 5 32 6 CZ CG 100 15 4 6 15 1 2 5 1 12 38 LG 100 11 0 2 22 8 7 2 8 29 11 DK CG 100 31 5 3 6 1 1 0 2 12 38 LG 100 5 0 0 5 1 1 22 3 12 52 DE CG 100 25 7 1 10 1 2 1 0 1 51 LG+SG 100 21 0 8 12 3 4 3 4 21 25 EE CG 100 18 5 8 13 2 0 7 5 9 32 LG 100 7 0 0 12 4 3 15 11 41 6 IE CG 100 14 2 4 14 0 3 25 1 16 21 LG 100 11 0 3 27 9 25 0 4 16 4 GR CG 100 23 7 4 37 0 1 1 1 9 17 LG 100 40 0 1 18 16 7 0 4 3 11 ES CG 100 61 7 7 11 0 0 2 2 1 8 LG+SG 100 17 0 4 13 4 4 25 6 20 6 FR CG 100 31 8 4 14 0 1 1 2 19 19 LG 100 19 0 3 13 7 15 1 10 17 16 IT CG 100 32 5 6 8 1 1 12 2 14 20 LG 100 15 0 2 14 5 5 45 3 8 4 CY CG 100 31 5 6 12 0 5 8 3 20 10 LG 100 43 0 0 0 14 28 0 15 0 0 LV CG 100 14 7 11 20 3 2 16 4 16 7 LG 100 10 0 2 12 2 13 8 7 39 7 LT CG 100 33 8 8 16 2 0 11 3 10 9 LG 100 7 0 1 9 5 4 21 5 39 9 LU CG 100 17 1 3 13 2 2 2 5 13 42 LG 100 21 0 2 16 12 7 0 13 25 4 HU CG 100 24 4 6 18 1 0 9 3 11 24 LG 100 18 0 1 7 4 8 15 5 29 12 MT CG 100 15 2 3 14 3 2 14 1 13 32 LG 100 57 0 5 9 25 0 0 4 0 0 NL CG 100 31 5 6 9 1 1 1 1 17 28 LG 100 15 0 6 17 5 6 2 7 27 15 AT CG 100 20 3 5 11 1 3 4 1 14 39 LG+SG 100 16 0 1 15 2 3 21 4 18 19 PL CG 100 22 5 7 11 0 1 4 1 21 28 LG 100 9 0 2 14 4 8 15 6 30 13 PT CG 100 34 4 6 9 0 0 22 1 19 4 LG 100 34 0 1 21 7 9 6 11 9 3 RO CG 100 14 12 11 23 1 3 12 2 8 14 LG 100 11 0 1 22 2 13 1 6 30 12 SI CG 100 19 5 6 12 2 1 12 2 16 25 LG 100 18 0 1 8 0 4 11 6 41 10 SK CG 100 22 7 9 18 2 2 7 3 13 18 LG 100 16 3 4 15 6 8 1 6 34 8 FI CG 100 21 6 4 14 1 1 10 2 13 28 LG 100 14 0 1 6 1 1 29 4 21 23 SE CG 100 27 6 4 12 1 1 4 1 7 38 LG 100 11 0 1 6 1 3 27 3 21 27 UK CG 100 16 6 4 6 1 1 18 1 12 34 LG 100 6 0 10 9 4 7 0 4 32 28 Federal states CG 100 29 6 2 10 1 2 2 1 4 44 BE, AT, DE LG 100 21 0 7 12 3 4 4 4 22 24 "Regionalised" states CG 100 40 5 6 9 1 1 9 2 10 17
ES, IT LG 100 16 0 3 14 4 4 35 4 14 5 Northern systems" CG 100 27 5 4 10 1 1 4 2 10 36 DK, SE, FI LG 100 9 0 1 5 1 1 25 3 18 36 New Member States CG 100 21 6 7 15 1 1 7 2 15 25
LG 100 12 0 1 15 5 8 10 6 31 12 Total EU CG 100 27 6 5 10 1 1 9 1 12 29 LG 100 16 0 5 12 4 6 13 5 21 19
Notes: (1) gf01 General public services, gf02 Defence, gf03 Public order and safety, gf04 Economic affairs, gf05 Environment protection, gf06 Housing and community amenities, gf07 Health, gf08 Recreation, culture and religion, gf09 Education, gf10 Social protection. (2) CG = Central Gov.; SG = State Gov.; LG = Local Gov. Source: own calculation based on Eurostat data - (COFOG) – November 2009

65
Economic affairs (gf04) accounts for an average of 12% of sub-national spending across the EU and covers expenditure on transport, telecommunications, agriculture and fishing, energy, and industry, which contributes to economic development. On average, this item is slightly more important in the EU12 countries than the EU15, particularly in the Czech Republic and Romania (22% in each case) and in Slovakia (15%). It is also relatively important in the Cohesion countries of Portugal (21%), Greece (18%) and Spain (13%) as well as Italy (14%), Ireland (27%), the Netherlands (17%), Luxembourg (16%), Austria (16%) and Belgium (15%). These are mostly lagging countries where local or regional governments have received significant EU co-financing for transport and business development and/or countries where local governments are traditionally responsible for undertaking investment in national infrastructure and capital expenditure programmes on behalf of Central Government (Ireland, Luxembourg, the Netherlands, etc.) Healthcare (gf07) accounts for around 13% of total spending at the EU level, but a much larger share in Italy (45%), Sweden (27%), Spain (25%) and Austria (21%). Healthcare expenditure is also relatively large in local expenditure in Finland (29%), where municipalities manage public healthcare centres. The housing and community amenities category (gf06) (6% of EU sub-national budgets) covers both the construction and upkeep of social housing, along with the water supply and public lighting. Although formerly a relatively large item of expenditure in the EU12 countries, the share has declined from the early transition years as a result of the privatisation of the social housing stock. However, local governments still devote a relatively large share of their budget to this item in several countries, such as Romania (13%) and Cyprus (28%), though the last is a special case because of the role of municipalities in the management of water reserves. Even in the EU15, the share of housing and community amenities in sub-national expenditure is as high as 25% in Ireland where housing is a key local government responsibility and 15% in France. Expenditure on recreation, culture and religion (gf08) and environment protection (gf05) accounts on average for 4-5% of the total. Culture and recreation tend to be typically local government responsibilities and account for more or less 6%, though the share is larger in France (10%), Portugal (11%), Estonia and Cyprus (15% each). Environmental protection covers a diverse range of activities, including sewerage management, the collection and treatment of household waste, management of parks and the prevention of air pollution. In several countries, and especially in the EU15, this type of activity is often outsourced to the private sector and no longer features in public budgets even though it remains a basic local responsibility. The item accounts on average for 4% of expenditure but 25% in Malta, 16% in Greece and 14% in Cyprus.
2.5.1.3. Sub-national gross capital formation by economic function As indicated above, sub-national governments play a major role in capital expenditure and in particular in fixed investment. Disaggregation of capital formation by function shows that sub-national governments mainly carry out expenditure on economic affairs (30%), housing and community amenities (16%), education (17%) and recreation and culture (10%) (see exhibit below).

66
Exhibit 13 - Distribution of Gross capital formation (GCF) by economic function (average 2005-2007) at the sub-national and central levels of government total gf01 gf02 gf03 gf04 gf05 gf06 gf07 gf08 gf09 gf10 BE CG 100 25 52 15 3 0 0 2 0 0 2 LG+SG 100 7 0 1 47 9 6 1 14 14 2 BG CG 100 21 5 7 37 4 6 5 2 9 2 LG 100 7 2 2 14 23 34 4 5 8 2 CZ CG 100 4 4 5 74 1 0 0 1 10 1 LG 100 -9 0 2 40 20 8 2 15 17 6 DK CG 100 20 9 5 30 6 0 1 12 15 1 LG 100 8 0 1 15 2 11 23 9 21 9 DE CG 100 8 11 3 70 5 0 1 0 0 0 LG+SG 100 0 0 8 36 9 9 1 8 28 1 EE CG 100 14 9 11 35 0 0 9 9 12 1 LG 100 -3 0 0 30 6 1 10 19 37 0 IE CG 100 13 2 14 16 0 0 26 5 22 1 LG 100 3 0 2 52 8 29 0 4 2 0 GR CG 100 8 1 1 43 5 6 14 3 18 0 LG 100 28 0 0 47 14 6 0 5 0 0 ES CG 100 5 7 7 67 4 3 0 5 0 0 LG+SG 100 8 0 2 37 7 13 8 10 12 2 FR CG 100 17 21 10 24 1 4 1 6 13 2 LG 100 10 0 2 12 9 33 0 14 17 3 IT CG 100 17 12 15 38 7 4 1 5 0 1 LG 100 19 0 1 32 9 12 9 7 10 2 CY CG 100 24 0 4 27 0 17 10 3 15 0 LG 100 40 0 0 0 15 28 0 17 0 0 LV CG 100 15 11 14 32 4 1 14 3 6 1 LG 100 6 0 0 30 4 24 4 8 21 3 LT CG 100 13 16 6 35 7 0 8 4 9 2 LG 100 3 0 0 46 18 6 9 5 11 2 LU CG 100 21 1 4 46 2 4 0 10 12 0 LG 100 13 0 2 18 12 9 0 18 26 2 HU CG 100 5 6 6 68 2 0 5 2 6 0 LG 100 27 0 0 17 22 13 6 4 7 3 MT CG 100 6 2 1 22 11 2 42 2 8 5 LG 100 100 0 0 0 0 0 0 0 0 0 NL CG 100 15 12 7 59 1 0 1 0 4 1 LG 100 11 0 3 41 7 15 0 8 15 0 AT CG 100 26 24 8 12 1 0 4 -8 30 3 LG+SG 100 13 0 6 54 2 2 1 10 12 1 PL CG 100 12 7 12 42 1 1 7 6 11 1 LG 100 5 0 0 42 13 10 7 10 12 1 PT CG 100 -2 10 6 33 9 0 13 7 23 1 LG 100 11 0 1 43 11 12 1 15 6 1 RO CG 100 3 9 8 47 1 11 7 1 13 0 LG 100 7 0 0 39 4 27 1 6 15 1 SI CG 100 19 11 8 26 2 2 12 4 13 3 LG 100 49 0 1 11 0 6 4 7 21 1 SK CG 100 17 5 26 30 2 0 1 7 10 3 LG 100 12 0 0 27 8 30 1 8 10 3 FI CG 100 6 6 3 78 1 1 0 0 3 0 LG 100 16 0 1 20 2 2 18 9 24 9 SE CG 100 12 4 6 65 0 0 0 1 9 2 LG 100 27 0 1 17 1 15 16 7 12 4 UK CG 100 14 26 21 26 -78 4 68 7 10 2 LG 100 6 0 6 33 3 5 0 12 32 3
CG 100 10 14 4 64 5 0 1 0 2 1 Federal states BE, AT, DE LG 100 2 0 7 39 9 8 1 9 25 1 CG 100 10 9 11 55 5 3 1 5 0 0 "Regionalised" states ES, IT LG 100 14 0 1 34 8 12 9 9 11 2 CG 100 12 6 6 61 1 0 0 3 9 2 Northern systems" DK, SE, FI LG 100 19 0 1 17 1 10 19 8 18 6 CG 100 9 7 9 50 2 3 6 3 10 1 New Member States LG 100 7 0 1 35 13 13 5 9 14 2
Total EU CG 100 12 12 9 47 -4 3 10 4 8 1 LG 100 9 0 3 30 8 16 4 10 17 2 Source: own calculation based on Eurostat data - Government expenditure by function (COFOG) – November 2009 Notes: (1) gf01 General public services, gf02 Defence, gf03 Public order and safety, gf04 Economic affairs, gf05 Environment protection, gf06 Housing and community amenities, gf07 Health, gf08 Recreation, culture and religion, gf09 Education, gf10 Social protection. (2) CG = central government; SG = State government; LG = Local government.

67
In federal states and in the EU12 countries, the focus of sub-national government gross capital formation (GCF) is mainly on economic affairs (39% and 35%, respectively) and education (25% and 14%). In most EU15 countries, with the exception of Luxembourg, France, Sweden, Denmark and Finland, economic affairs accounts for the largest share of sub-national government GCF (over a third in each case), in Ireland and Austria, for around half. Investment in education is the largest item in sub-national GCF in Estonia, Luxembourg and Finland. By contrast in Bulgaria, France Slovakia and Romania, sub-national GCF is very much concentrated on housing and community amenities and in some cases relatively little goes to investment in economic affairs or education. Expenditure on regional development largely consists of capital formation in economic affairs33, environmental protection, housing and community amenities34, health care35, recreation, culture and religion36 and education. Given the importance of GCF37 in economic affairs in sub-national expenditure, it is worth examining this item in more detail (exhibit below).
33 The COFOG sub-sectors of economic affairs mainly concerned are: - General economic, commercial and labour affairs; - Agriculture, forestry, fishing and hunting; - Fuel and energy; - Mining, manufacturing and construction; - Transport; - Communication; - Other industries; R&D. 34 The COFOG sub-sectors of housing and community amenities mainly concerned are: - Community development, - Water supply. 35 The COFOG sub-sectors of health mainly concerned are hospital services. 36 The COFOG sub-sectors of recreation, culture and religion mainly concerned are - recreational and supporting services and - cultural services. 37 Gross capital formation covers (1) Gross fixed capital formation, (2) Changes in inventories and (3) acquisition less disposal of valuables. Gross fixed capital formation consists of resident producers’ acquisitions, less disposals, of fixed assets during a given period plus certain additions to the value of non-produced assets realised by the productive activity of producer or institutional units. Gross fixed capital formation can therefore be positive or negative. It is a very unsatisfactory proxy to measure the formation of productive physical capital but is nevertheless used because there is no better alternative proxy available.

68
Exhibit 14 - Gross capital formation in Economic affairs and Total Gross capital formation relative to GDP by period
GCF in economic affairs (gf04) relative to GDP Total GCF relative to GDP 1990-1992 1995-1997 2000-2002 2005-2007 1990-1992 1995-1997 2000-2002 2005-2007
BE CG 0.07 0.01 0.01 0.00 0.37 0.29 0.18 0.14 LG+SG 0.59 0.69 0.73 0.72 1.12 1.48 1.56 1.52 BG CG 1.87 1.10 7.03 2.97 LG 0.10 0.21 1.84 1.48 CZ CG 1.06 1.00 1.80 1.50 1.49 2.44 LG 0.73 0.51 0.93 2.92 2.17 2.36 DK CG 0.21 0.16 0.10 0.16 0.87 0.81 0.61 0.54 LG 0.13 0.16 0.17 0.20 0.86 1.01 1.16 1.27 DE CG 0.28 0.23 0.22 0.25 0.43 0.29 0.31 0.35 LG+SG 0.67 0.56 0.47 0.38 2.24 1.67 1.37 1.04 EE CG 0.50 0.47 1.09 2.78 2.74 3.08 LG 0.37 0.35 0.55 1.79 1.76 1.84 IE CG 0.21 0.09 0.22 0.14 0.75 0.49 0.92 0.90 LG 1.52 1.02 1.58 1.47 2.39 1.91 3.13 2.85 GR CG 0.76 1.27 0.97 2.21 2.61 2.24 LG 0.18 0.20 0.27 0.59 0.71 0.57 ES CG 0.74 0.52 0.69 1.09 0.85 1.02 LG+SG 0.84 0.95 0.97 2.13 2.42 2.65 FR CG 0.20 0.16 0.14 0.74 0.67 0.59 LG 0.42 0.30 0.29 2.05 2.11 2.34 IT CG 0.46 0.19 0.19 0.19 0.88 0.52 0.55 0.50 LG 0.59 0.38 0.54 0.59 1.99 1.52 1.84 1.86 CY CG 0.74 0.64 2.43 2.34 LG 0.00 0.00 0.51 0.65 LV CG 0.37 0.18 1.00 0.88 0.52 3.10 LG 0.05 0.10 0.61 0.83 0.82 2.03 LT CG 1.07 1.09 1.58 3.08 LG 0.65 0.59 0.88 1.28 LU CG 1.36 0.98 1.20 1.08 2.54 2.10 2.57 2.33 LG 0.64 0.48 0.52 0.25 2.09 1.75 1.78 1.45 HU CG 0.75 1.49 2.42 2.20 LG 0.40 0.29 2.57 1.75 MT CG 1.14 1.06 0.93 3.26 3.72 4.26 LG 0.00 0.00 0.00 0.18 0.23 0.16 NL CG 0.64 0.80 0.64 1.10 1.20 1.08 LG 0.77 0.94 0.91 2.02 2.08 2.22 AT CG 0.22 0.09 0.02 0.65 0.33 0.19 LG+SG 0.46 0.39 0.42 1.88 0.93 0.77 PL CG 0.31 0.61 1.06 1.44 LG 0.95 1.01 2.40 2.41 PT CG 0.97 0.53 0.28 2.18 1.33 0.85 LG 0.91 0.92 0.72 1.98 2.32 1.66 RO CG 0.67 1.46 2.76 3.09 LG 0.16 0.75 0.64 1.90 SI CG 0.37 0.48 1.54 1.81 LG 0.18 0.19 1.58 1.72 SK CG 0.96 0.85 0.25 2.32 2.06 0.83 LG 0.32 0.20 0.32 1.43 0.86 1.18 FI CG 0.85 0.74 0.55 0.63 1.52 1.33 0.88 0.81 LG 0.36 0.30 0.33 0.33 2.01 1.50 1.66 1.68 SE CG 1.03 0.68 0.91 1.49 1.31 1.42 LG 0.18 0.24 0.28 1.86 1.62 1.63 UK CG 0.45 0.18 -0.23 0.10 1.37 0.87 0.41 0.39 LG 0.31 0.23 0.57 0.35 1.02 0.66 0.96 1.05
CG 0.20 0.19 0.20 0.32 0.30 0.31 Federal states BE, AT, DE LG 0.57 0.49 0.42 1.67 1.35 1.07
CG 0.38 0.31 0.39 0.71 0.65 0.71 "Regionalised" states ES, IT LG 0.53 0.68 0.74 1.72 2.04 2.17
CG 0.69 0.47 0.61 1.24 0.99 1.00 Northern systems" DK, SE, FI LG 0.20 0.24 0.27 1.51 1.49 1.53
CG 0.70 1.03 1.79 1.81 2.08 New Member States LG 0.48 0.72 2.68 1.84 2.02 Total EU 0.38 0.31 0.22 0.33 0.86 0.72 0.65 0.70 0.53 0.47 0.53 0.50 1.73 1.61 1.63 1.66
Notes: CG = central Government; SG = State Government; LG = Local Government. Source: own calculation based on Eurostat data - Government expenditure by function (COFOG) – November 2009

69
The exhibit above has several interesting features. First, GCF in economic affaires at sub-national government level varies form 1.5% of GDP in Ireland to less than 0.2% in Slovenia, Malta and Cyprus. On average in the EU, the share is around 0.5% but is higher than 0.7% in the EU12 countries. Secondly, in most EU15 countries, GCF in economic affairs is higher at sub-national level than at central level. The exceptions are Greece, Sweden, Finland and Luxembourg. Third, in most EU12 Member States central governments play an important role in GCF in this broad area. The change in GCF relative to GDP at the central and sub-national levels of government has differed across countries since the early 1990s. There are relatively clear signs of increased decentralisation of GCF in Belgium, Spain, Sweden, the UK and Denmark, insofar as GCF at the sub-national level has risen relative to GDP, while it has fallen relative to GDP at the central government level. Increased involvement of sub-national governments in regional development also seems to have occurred in the EU12 countries. In most of them with the exception of Hungary and Lithuania, sub-national GCF increased relative to GDP but only in Romania and Bulgaria was the increase more than at central government level. In the other EU countries, government GCF in economic affairs has declined relative to GDP at sub-national level (Germany, Ireland, France, Luxembourg, Austria, Portugal and Finland) but it also fell at the central government level. It is, therefore, unclear, whether investment became more decentralised or not. In Ireland, Portugal, Finland and Austria, the decline at sub-national level was less than at central level. The opposite was the case in Germany, France and Luxembourg.
2.5.2. Revenue Revenue raised at the sub-national level in EU countries represents on average 34%38 of total general government revenue (GGR) and 15% of GDP. These figures correspond very closely to the respective figures for sub-national government expenditure, which suggests that local and regional authorities are responsible for raising the funds to finance their expenditure. There is also close similarity between the figures for sub-national government revenue and expenditure in individual countries. The share of sub-national revenue in GGR is, therefore, highest in Denmark (58%, or 33% of GDP) and Nordic countries, generally (47% of GGR and 26% of GDP, on average), closely followed by the federal states (43% of GGR and 19% of GDP). On the other hand, shares are lower in most unitary states (26% of GGR and 11% of GDP, on average). Again, shares are particularly low in the southern countries Greece and Portugal which also have low levels of government expenditure at the sub-national level.
38 Revenues include transfers and these represent 44% of total revenue (see exhibit 18).

70
Exhibit 15 - Sub-national government revenue as a % of GGR
20
30
40
50
60
1990
1991
1992
1993
1994
1995
1996
1997
1998
1999
2000
2001
2002
2003
2004
2005
2006
2007
% o
f gen
eral
gov
ernm
ent e
xpen
ditu
re
Federal states "Regionalised" states "Northern systems"
Other Unitary states Total
Source: own calculation based on Eurostat data Note: Federal states: AT, BE, DE: “Regionalised” states: ES, IT; countries with “Northern systems”: DK, FI, SE; Other Unitary states: EU27 without Federal states, “Regionalised” states and countries with “Northern systems”; Exhibit 16 - Sub-national government revenue in % of GDP
5
10
15
20
25
30
1990
1991
1992
1993
1994
1995
1996
1997
1998
1999
2000
2001
2002
2003
2004
2005
2006
2007
% o
f GD
P
Federal states "Regionalised" states "Northern systems"
Otehr Unitary states Total
Source: own calculation based on Eurostat data Note: Federal states: AT, BE, DE: “Regionalised” states: ES, IT; countries with “Northern systems”: DK, FI, SE; Other Unitary states: EU27 without Federal states, “Regionalised” states and countries with “Northern systems”; Sub-national government revenue since the early 1990s has changed little in relation to GGR or GDP (see exhibits above). In the EU on average, it remained at around 34% of GGR. Whereas in federal states a slight decline is evident, the opposite is the case in the regionalised states of Spain

71
and Italy. In the Nordic countries, the increased decentralisation of expenditure was not accompanied by a similar trend in revenue, sub-national government revenue declining from 49% of GGR to 47% over the c period, largely due to the reduction in Finland. A comparison of the change since the early 1990s in sub-national expenditure relative to GDP (exhibit 6) and in sub-national revenue (exhibit 17) reveals several interesting points. In around half the EU countries, both sub-national government revenue and sub-national government expenditure have increased relative to GDP. In some of them, the increase in revenue has exceeded the increase of expenditure, so that there has been a potential expansion of financial means available at the sub-national level. This is the case in Slovakia and Poland as well as in Belgium, Sweden, Portugal, France and to a lesser extent, Spain and Italy. In other countries, the increase in sub-national expenditure exceeded the increase in sub-national revenue so that financial constraints at the sub-national level might have tightened. This is the case in Greece, Denmark and the UK as well as in the Czech Republic, Latvia, Slovenia and Romania. In the other EU countries, sub-national government revenue in relation to GDP has declined. However, in some countries, sub-national government expenditure declined by even more. This is the case in Luxembourg and Ireland and to a lesser extent in Germany and Estonia. In the other countries, the decline in revenue was more than the reduction in expenditure, possibly giving rise to increased pressure on sub-national budgets. This is the case in Austria, Finland and the Netherlands as well as in Hungary, Lithuania and Bulgaria.

72
Exhibit 17 - Sub-national government revenue as a % of General Government Revenue and GDP by periods
as % general government revenue as % of GDP average Average average average average average average average 2005-2007 2000-2002 1995-1997 1990-1992 2005-2007 2000-2002 1995-1997 1990-1992 BE 43 41 40 39 21 20 20 15 DE 44 44 45 47 19 20 21 20 AT 34 35 37 39 16 18 19 19 UK 31 29 29 31 13 11 11 12 DK 58 58 57 57 33 32 32 31 IE 19 39 33 30 7 13 13 19 FR 22 20 20 19 11 10 10 9 IT 33 32 28 32 15 14 13 14 LU 12 13 15 15 5 6 6 7 NL 34 35 40 36 15 16 19 19 PT 14 14 13 12 6 6 5 5 FI 36 34 37 40 19 18 21 22 SE 44 43 41 25 24 24 CZ 28 25 29 12 10 12 GR 7 6 6 3 3 2 ES 51 46 41 21 18 16 MT 2 2 2 1 1 1 SI 20 20 19 9 9 8 EE 25 25 25 9 9 10 LV 27 27 26 10 9 10 SK 19 9 8 6 3 3 PL 33 34 26 13 13 11 HU 28 27 27 12 12 13 CY 5 4 2 2 LT 24 28 8 9 RO 25 18 8 7 BG 17 19 7 8 Federal states 43 43 44 45 19 20 20 19 "Regionalised" states 39 36 32 32 17 15 14 14 "Northern systems" 47 45 45 49 26 25 26 27 New Member States 28 27 25 11 11 11 Other Unitary states 26 25 25 25 11 11 11 11 Total 34 34 34 34 15 15 15 15 Note: For AT, BE, DE and ES, state government expenditure and local government expenditure have been grouped together. Source: own calculation based on Eurostat data
2.5.2.1. Structure and change in sub-national government revenue Sub-national government revenue generally falls into one of three main categories: 1) revenue form the sale of goods and services; 2) tax revenue from business and households; 3) grants or transfers from the central state, the European Union or other levels of sub-national government. The first two can be labelled direct revenue, the third, indirect revenue. On average across the EU, 56% of sub-national government revenue is direct revenue39 and 44% transfers40. These average values, however, conceal significant differences between countries. In Sweden, Finland, Germany and Romania, the predominant part of sub-national government revenue is direct, accounting for more than 70% of the total. Fiscal receipts are, therefore, the main source of revenue for these countries.
39 Direct revenues are composed of fiscal and parafiscal receipts (direct taxes, indirect taxes, actual social contributions and taxes on capital), Imputed social contributions, Received interests and other property income, Current sales of produced goods and services. 40 Transfers cover current transfers from other sectors and capital transfers.
73
The proportions of direct and indirect revenues are the opposite of this in the UK, Ireland, the Netherlands, Malta and Bulgaria. In these countries, revenue at the sub-national level come predominantly from transfers, which account for at least 70% of the total. Fiscal receipts as such are of limited importance at below 10% of total revenue in most countries. The finance coming from direct and indirect sources is relatively similar in Denmark, Italy, Luxembourg, Slovenia, Estonia Cyprus, Poland and Hungary. Fiscal receipts are in most countries the main source of direct revenue at sub-national level, accounting on average for around two-thirds of this, while sales of goods and services are the second most important source. Only in Greece, Malta and the Netherlands do sub-national sales of goods and services generate more revenue than fiscal receipts. The composition of sub-national government revenue, therefore, varies markedly between countries. Countries with the same system of government, however, do not necessarily have the same division of revenue between direct and indirect. The difference is particularly striking within the group of federal countries but there are also differences between the Nordic countries.

74
Exhibit 18 - Sub-national government revenue by type as a % of the total (averages by period)
Fiscal receipts Sales of goods and services Total direct revenues Transfers
2005-2007
2000-2002
1995-1997
2005-2007
2000-2002
1995-1997
2005-2007
2000-2002
1995-1997
2005-2007
2000-2002
1995-1997
BE 100 22 18 16 6 6 6 37 33 31 63 67 69 DE 100 60 59 56 8 9 10 74 73 71 26 27 29 AT 100 46 47 45 7 8 18 61 63 71 39 37 29 UK 100 14 14 12 13 12 10 30 30 27 70 70 73 DK 100 46 52 49 5 6 6 54 61 57 46 39 43 IE 100 10 5 6 9 5 7 28 18 24 72 82 76 FR 100 45 42 47 15 15 14 61 59 63 39 41 37 IT 100 44 44 26 7 8 8 53 54 36 47 46 64 LU 100 32 39 38 20 18 20 54 60 59 46 40 41 NL 100 9 9 7 15 15 13 31 32 29 69 68 71 PT 100 37 35 33 17 16 19 56 53 55 44 47 45 FI 100 48 55 50 21 19 17 72 77 71 28 23 29 SE 100 63 63 62 11 12 15 78 79 80 22 21 20 CZ 100 45 41 36 14 18 15 61 62 53 39 38 47 GR 100 9 11 13 26 24 26 35 37 42 65 63 58 ES 100 54 39 30 5 5 6 60 46 38 40 54 62 MT 100 0 0 0 5 2 1 6 3 2 94 97 98 SI 100 36 33 31 13 15 16 51 51 49 49 49 51 EE 100 46 46 33 8 8 10 55 55 44 45 45 56 LV 100 53 54 62 10 7 8 64 62 71 36 38 29 SK 100 53 45 47 9 18 12 64 65 64 36 35 36 PL 100 33 23 40 11 16 11 47 42 53 53 58 47 HU 100 36 33 25 10 10 12 47 46 39 53 54 61 CY 100 25 29 22 32 49 63 51 37 LT 100 36 50 4 3 42 55 58 45 RO 100 85 49 4 6 90 57 10 43 BG 100 11 42 11 16 24 59 76 41 Federal states BE, AT, DE 100 54 54 51 8 8 10 68 68 67 32 32 33
"Regionalised" states ES, IT
100 49 42 27 6 7 7 56 50 37 44 50 63
"Northern systems" DK, SE, FI
100 54 57 54 10 11 12 67 71 70 33 29 30
Other Unitary states (all other) 100 26 24 26 14 14 12 42 42 43 58 58 57
New Member States 100 42 31 37 10 15 12 55 48 52 45 52 48
Total EU 100 43 42 40 10 10 10 56 56 55 44 44 45 Source: own calculation based on Eurostat data Note: For AT, BE, DE and ES, state government expenditure and local government expenditure have been grouped together. It is difficult to identify any common trend in the division of revenue. In some countries there seem to have been a tendency since the mid-1990s for direct revenues to increase while in others, indirect revenues have tended to increase. Among EU15 countries, there was an increase in direct revenue at sub-national level in Spain, Italy, Ireland, Belgium and, to a lesser extent, the UK, the Netherlands and Germany. This has been achieved by higher fiscal receipts in Spain and Italy while in all other countries, it was due partly to higher revenues from sales of goods and services. By contrast, in Austria, Sweden, Greece, Denmark, France and Luxembourg, transfers increased in importance. In Austria and Sweden, this was accompanied by relatively large reductions in sales of goods and services at sub-national level.

75
It is also difficult to identify any common trend in the EU12 countries, though on average it appears that the share of direct revenues has increased since the mid-1990s while transfers seem to have declined in relative terms.
2.5.2.2. Tax revenue and sub-national government financial autonomy In the EU as whole, fiscal receipts at the sub-national level amount on average to 7% of GDP and around 17% of total government fiscal revenue (GGFR). The amount varies greatly from country to country (see exhibit below). The share of sub-national fiscal revenue is particularly large in Denmark (15% of GDP and 30% GGFR), Sweden (16% of GDP and 32% of GGFR), Germany (12% of GDP and 30% of GGFR) and Spain (11% of GDP and 31% of GGFR). In Bulgaria, Ireland Cyprus and Greece, sub-national fiscal revenue is less than 1% of GDP. Exhibit 19 - Sub-national fiscal revenue
In % of general government fiscal revenue In % of GDP
2005-2007
2000-2002
1995-1997
1990-1992
2005-2007
2000-2002
1995-1997
1990-1992
BE 10 8 7 6 5 4 3 2 DE 30 29 28 29 12 12 11 11 AT 18 19 20 21 8 8 9 9 UK 5 4 4 5 2 2 1 2 DK 30 35 32 31 15 17 16 14 IE 2 2 3 3 1 1 1 1 FR 11 10 11 10 5 4 5 4 IT 16 15 8 6 7 6 3 2 LU 4 6 6 6 2 2 2 2 NL 4 4 3 3 1 1 1 1 PT 6 6 5 5 2 2 2 2 FI 21 22 22 21 9 10 10 9 SE 32 31 30 16 15 15 CZ 14 12 12 5 4 4 GR 1 1 1 0 0 0 ES 31 20 14 11 7 5 MT 0 0 0 0 0 0 SI 8 7 7 3 3 3 EE 13 13 9 4 4 3 LV 18 17 19 5 5 6 SK 11 4 4 3 1 2 PL 13 9 12 4 3 5 HU 12 10 8 4 4 3 CY 1 1 0 0 LT 10 16 3 5 RO 25 12 7 3 BG 2 11 1 3 Federal states BE, AT, DE 26 26 26 26 11 11 10 10
"Regionalised" states ES, IT 21 17 10 6 8 6 4 2
"Northern systems" DK, SE, FI 29 30 29 26 14 15 14 12
Other Unitary states (all other) 8 7 7 7 3 3 3 3
New Member States 13 10 11 5 3 4 Total EU 17 16 15 14 7 6 6 5 Source: own calculation based on Eurostat data Note: For AT, BE, DE and ES, state government expenditure and local government expenditure have been grouped together. But the concept of financial autonomy is wider than own tax revenue and covers several other aspects that have an influence on the level of financial autonomy:

76
1) taxation: the ability to create new own-source taxes, the possibility of adapting the tax base through reductions or exemptions; the possibility of setting the tax rate etc.
2) grants: the ability to negotiate grant levels, to influence the mechanisms guiding their development and to allocate them freely
3) revenues generated from goods and services: the ability to use tariffs and fees and to set their level
4) expenditure: the ability to decide on the allocation of spending There are no harmonised data on these aspects and it is therefore difficult, in practice, to assess the financial autonomy of sub-national governments across the EU. It is tempting however, to estimate their financial autonomy on the basis of own-source tax (Dexia Research Department, 2008) revenue as a share of total revenue at the sub-national level. This gives the following picture:
Exhibit 20 - Financial autonomy – own source tax revenue own-source tax revenue as a % total sub-national revenue
SE 69 FR 49 DK 49 High financial autonomy
FI 43 IT 34 LU 34 EU 27 BE 27 ES 25
Medium high financial autonomy
PT 25 SI 17 NL 17 PL 15 DE 15 UK 15 HU 13 RO 12
Medium low financial autonomy
SK 12 BG 10 AT 9 IE 9 CZ 6 LT 5 EE 4 MT 0
Low financial autonomy
LV 0 Source: Dexia Research Department, 2008 Note: Greece and Cyprus are not included due to the fact that no distinction is made between taxation and revenue from the operation of services. It is clear, however, that such a picture gives a distorted indication of the actual situation in a number of cases, not least in France, where the centre exercises a relatively high degree of control over sub-national authorities despite the large share of taxes raised at the sub-national level and despite the large share of expenditure carried out at this level. The picture given by the quantitative information must, therefore, be supplemented and qualified by the qualitative information on other aspects of the relationship between central government and local and regional authorities, in particular, on the regulations and controls over the revenue raising powers of the latter and on their ability to determine both tax schedules and the scale and composition of their expenditure.

77
2.6. FINAL CONSIDERATIONS ON CHAPTER 2 Decentralisation has taken place in almost all the EU MS during the last forty years or so, even though in different ways and at a different speed across countries, reflecting specific characteristics, economic conditions, history and other factors as stressed in Chapter 1. Decentralisation and, sometimes, regionalisation processes seem to be continuing at present although still with a different pace and with different approaches depending on the particular country. Whereas regionalisation seems to be a priority in some unitary states (especially in Northern Europe), even if only on an experimental basis, it seems to be at standstill in other countries (e.g. Portugal and the UK). With decentralisation advancing, consultation procedures have been established in the majority of European countries. The historical legacies, cultural factors and territorial organisation have strongly influences these procedures. Most Nordic countries have established effective consultation mechanisms largely based on informal contacts. In the Federal states, the federal entities have significant legislative power and a major consultation effort is carried out at this level. Regionalised states, following the advanced process of decentralisation that they have been undergoing, established formal mechanisms to guarantee the continuity of dialogue between administrative levels. In some unitary states, even in those traditionally more centralised (e.g. the UK, France), the adoption of some decentralisation laws has led to increased dialogue and the creation of consultations procedures. In other unitary countries of the EU 15 (Portugal and Greece), consultation is less developed and there is a lack of a legal framework or tight deadlines are assigned for proposing amendments. This reduces the effectiveness of consultation or renders those procedures pure formalities. In the EU 12, local governments have been formally recognised in the early 90ies and the situation as regards consultation is very uneven. In the Baltic countries, associations of local and regional governments have partner status and are largely involved into the drafting of legislation through both formal consultation procedures and informal contacts. In other cases, consultation mechanisms have been established but consultations are conducted at a late stage and the procedures are not strictly binding (e.g. Hungary and Slovenia). The quantitative analysis carried out in this section aimed at contributing to a better insight into the distribution of responsibilities and financial resources between the different administrations in the different Member States. The investigation is based on harmonised data available at the EU level and particularly on the Government Finance Statistics provided by Eurostat. The main lessons that can be derived form the analysis are the following: On average, the share of sub-national government expenditure in general government expenditure is highest in countries with a “Northern system”, the federal countries and in the “regionalised” countries. Since the 1990s for Europe on average, the share of sub-national government spending in GDP has been fairly stable. A significant increase can however be observed for Belgium, Denmark and Spain. The opposite occurred in Ireland, the Netherlands, and Austria. Current expenditure absorb in most countries the major part of total expenditure and are particularly high in countries where sub-national governments manage education, healthcare and social protection. In the Nordic countries current expenditure absorb 94% of total sub-national

78
government expenditure. On average, during the past 15 years the weight of current sub-national expenditure in total expenditure has increased in almost all countries. Sub-national governments play an important role in relation to capital expenditure particularly in federal and regionalised states where more than 2/3 of capital expenditure are undertaken at the sub-national level. The disaggregation of capital formation by economic function shows that sub-national governments mainly carry out expenditure on economic affaires, housing and community amenities, education and recreation and culture. In most EU15 countries, economic affairs account for the largest share. Gross capital formation in economic affaires is higher at the sub-national level than at central level in most EU15 countries. There are relatively clear signs of increased decentralisation of GCF in Belgium, Spain, Sweden, the UK and Lithuania, insofar as GCF at the sub-national level has risen relative to GDP, while it has fallen relative to GDP at the central government level. The figures on revenue raised at the sub-national level in EU countries correspond very closely to the respective figures for sub-national government expenditure. This suggests that local and regional authorities are responsible for raising the funds to finance their expenditure. In around half the EU countries, both sub-national government revenue and sub-national government expenditure have increased relative to GDP. In some of them, the increase in revenue has exceeded the increase of expenditure, so that there has been a potential expansion of financial means available at the sub-national level. This is the case in Slovakia and Poland as well as in Belgium, Sweden, Portugal, France and to a lesser extent, Spain and Italy. In the other countries sub-national government revenues relative to GDP have decreased, possibly giving rise to increased pressure on sub-national budgets. This is the case in Austria, Finland and the Netherlands as well as in Hungary, Lithuania and Bulgaria. Regarding the structure of sub-national government revenue it varies markedly between countries. In Sweden, Finland, Germany and Romania, the predominant part (more than 70%) are direct revenues mainly tax revenues. The proportions of direct and indirect revenues are the opposite in the UK, Ireland, the Netherlands, Malta and Bulgaria. In these countries, revenue at the sub-national level come predominantly from transfers.

79
CHAPTER 3. THE EVOLUTION OF COMPETENCES IN THE AREAS RELEVANT FOR REGIONAL DEVELOPMENT This chapter analyses the public expenditure for development (EfD) of the different administrative levels. The EfD includes all the public capital expenditure more evidently devoted to support growth and development and the current expenditure for training and human resources in the context of development policies. The concept of the EfD has been developed by the study team to obtain an aggregate of public expenditure which is as much consistent as possible with the spending eligible under the EU Cohesion Policy41 (for a detailed definition of EfD see §. 3.2 and Annex 2).
As the previous chapter, the present one is divided into two main parts: - the first part is qualitative and examines “who does what” as regards development policies;
results are presented by groups of countries and national case studies give a more detailed vision of the distribution of competences.
- the second part analyses the allocation of resources in development policies; first a more general approach – based on COFOG 1-digit data – is used in order to compare all the EU27 MS, then a more detailed approach – based on COFOG 2-digit – is used to provide an in-depth view of the models of intervention. The data collected by means of case studies are employed to pursue this goal since Eurostat statistics does not allow the required detail. In this part, a comparison between EU Cohesion Policy and EfD is also carried out.
3.1. COMPETENCES ON DEVELOPMENT POLICIES IN DIFFERENT GROUPS OF EU MEMBER STATES This section presents a qualitative analysis which summarises the division of competences over development policies and its evolution over the recent past, in relation to the four groups of countries identified in the previous chapters. For each group of country, a summary exhibit has been prepared drawing upon the analysis carried out in national case studies. These exhibit show the relative importance of different administrative levels in relation to the sectors most relevant for development. Following a qualitative cross-country assessment of the study team, a score ranging from low to high importance has been given to each administrative level in relation to a specific sector. The score is expressed by means of bullets as explained in the key at the bottom of each exhibit (●●●=high importance: ●●=medium importance; ●=low importance; blank=no importance).
3.1.1. Federalised States Federal States are characterised by a central government and regional authorities both with own legislative and administrative competences. These are exercised independently and recognised by the Constitution. Germany, Austria and Belgium are federations of states. Only in Belgium is federalism a recent development, initiated in the 1970s and completed in 2001 with the Constitutional reform. In the other federal states there has been no major change in the
41 For purpose of verification of the principle of additionality a concept of “expenditure for development” has been devised to gather all national expenditures which are eligible under the EU support. The official references are Regulation 1083/2006 (Article 15) and the Commission methodological paper proposing guidelines on the calculation of public or equivalent structural spending for the purposes of additionality (Working Document n.3/2006).

80
distribution of competences during the last 15-20 years, with the exception of the changes brought about in Eastern Germany after unification. The federal states have legislative and executive powers in most areas relevant for regional development such as aid to enterprises, education, health, housing and public safety while the role of the central government is often confined to basic regulation. Local authorities have competence in regulating issues of local relevance such as traffic management and local public transport, building regulations and urban planning as well as some social services. Competences at local level are hence quite wide, especially in Germany, with the exception of human resources. Exhibit 21 - Distribution of competences for regional development in Federalised States: summary of the importance of different administrative levels
Central State/Regional Local Public corporations
Infrastructure and services ● ●● ●● ● Transport and communications ●●● ●●● ●● ●●
Energy ●● ●● ● ● Environment ●● ●● ●●● ●●
Health ●● ●●● ●● ●● Housing ●●● ●●
Public safety ●●● ●● ●● Culture ● ● ●●●
Social services ●● ●●● Education and training ●● ●●● ●
R&D ●●● ●● Aid schemes for development ●●● ●● ●●● ● Key: ●●●=high importance: ●●=medium importance; ●=low importance; blank=no importance.
In Germany, federalism is an historical heritage which, since the middle ages, came to a halt only during the national-socialist period. The power of Länder and municipalities was strengthened with several reforms in the second half of the XX century. After the 1990 unification, new Länder were established in the Eastern part. More recently, in 2001, a new regulation on equalisation of
transfers was introduced and, in 2002, the Constitution was modified in relation to the division of powers between federal government and Länder. In 2003, the government announced Agenda 2010 to reform the local tax system and increase the investment capacity of local authorities. The federal government holds general legislative power in relation to public services, environmental protection and territorial organisation and secondary education. At the regional level, the federal states, or Länder, have legislative powers over culture, the school system and public safety. There are also shared areas of responsibility such as universities, agriculture and coastal protection. At the local level, districts manage secondary roads and local transport, district territorial planning, natural reserves, social security, waste collection, build and manage secondary schools and hospitals. Apart from these they also have optional competences
Germany - Competences for regional development: functions and administrative levels involved
Central Regional/State Local Public Corporations
Infrastructure and services ٧ ٧ ٧ ٧ Transport and communications ٧ ٧ ٧ ٧
Energy ٧ ٧ ٧ ٧ Environment ٧ ٧ ٧ ٧
Health ٧ ٧ ٧ ٧ Housing ٧ ٧ Safety ٧ ٧ ٧ Culture ٧ ٧
Social services ٧ ٧ Education and training ٧ ٧
R&D ٧ ٧ Aid schemes for development ٧ ٧ ٧

81
(depending on local autonomy) in the fields of cultural activities, public libraries, student exchange programmes, promotion of tourism etc. Municipalities (cities and towns) deal with urban planning and municipal roads, sewage, social security, leisure, build and manage primary schools. They also have optional competences in relation to aid to local business, housing and local infrastructure, culture, twinning, management of energy power plants and the transport infrastructure. Overall, the complex German system is characterised by an historical lack of self-contained competences which leads to unclear divisions between administrative levels; for instance in relation to infrastructures and aid schemes. In Austria, federalism is also a long-standing tradition. Several reforms were introduced during the last thirty years to strengthen the power of the federal states (Länder). After the modifications of the Constitution in 1984 and 1988, and the introduction of a mechanism of consultation as well as of a stability pact between the central state and the Länder in 1999, several other projects of reform were under discussion, however no significant change or simplification was actually introduced. The central government (Bund) holds exclusive legislative power in several fields relevant to development: public safety and labour policy in particular. There are other fields for which the central government is in charge of basic legislation while the Länder carry out the implementation: road, and environmental assessments, especially. Finally, in relation to social services, social protection and land reform, the central government defines framework laws and the federal states are obliged to introduce provisions for their application. At the regional level, the states are competent in all fields except those reserved to the Bund as previously discussed.
At the local level, district
authorities which are decentralised
administrative entities of the Länder have only the power to
implement federal laws. The
municipalities, on the other hand, decide on issues whose relevance is
predominantly local: traffic, building regulations, local health regulations, local territorial planning, promotion of social and cultural services for the local community.
3.1.2. Regionalised states Countries such as Italy and Spain can be considered strongly regionalised. They have established an intermediate or regional level of government with a wide set of competences. At the moment despite a push towards increasing importance of regions also in traditionally unitary states such as the UK, Belgium, Sweden and the EU12, no other European country matches the degree of
Austria - Competences for regional development: functions and administrative levels involved
Central Regional/State Local Public corporations
Infrastructure and services ٧ ٧ ٧ ٧ Transport and communications ٧ ٧ ٧ ٧
Energy ٧ ٧ Environment ٧ ٧ ٧ ٧
Health ٧ ٧ ٧ ٧ Housing ٧ ٧ Safety ٧ Culture ٧ ٧
Social services ٧ (basic legislation) ٧
Education and training ٧ ٧ ٧ R&D ٧ ٧
Aid schemes for development ٧ ٧ ٧ (tourism)
٧ (tourism)

82
regionalisation that has been pursued in Italy and Spain. This justifies considering them as a separate group. Exhibit 22 - Distribution of competences for regional development in Regionalised States: summary of the importance of different administrative levels
Central Regional Local Public corporations
Infrastructure and services ●● ●●● ●●● ● Transport and Communications ●● ●● ●● ●
Energy ●●● ●●● ● ● Environment ● ●● ●●● ●
Health ● ●●● ● Housing ●● ●●●
Public safety ●● ●● Culture ● ●● ●●
Social services ● ●●● ●●● Education and training ●● ●● ●
R&D ●●● ●●● Aid schemes for development ●●● ●●● Key: ●●●=high importance: ●●=medium importance; ●=low importance; blank=no importance. In Italy, regionalisation was pushed forward by the Bassanini reform in 1997 and then by the 2001 constitutional reform. This last step established shared competences between the Central Government and Regions in all areas relevant to economic development such as infrastructures, human resources, productive environment etc.
In most sectors, the Central Government sets the basic legislation to guide the Regions. Moreover the central level implements initiatives of national interest. Among the fields relevant to regional development, the central government deals with education,
environment and culture, social services. Regional governments deal with legislative development and, together with sub-regional levels (Provinces and Municipalities), implement initiatives of local interest. In particular, Regions take care of education, arts and environment, transport, energy, and complementary social protection. Competences on scientific research are shared between central and regional governments. Provinces focus on water and energy resources, protection of the territory and disaster prevention and schools. Municipalities deal with services for the community, waste collection, nurseries, commercial and industrial planning and housing. In Spain, regionalisation took the form of a federation of autonomous regions. The new Constitution introduced in 1978 and the reforms of 2000 and 2002 are the milestones of this process. Responsibility for all the areas most relevant for development such as basic infrastructure,
Italy - Competences for regional development: functions and administrative levels involved
Central Regional Local Public corporations
Infrastructure and services ٧ ٧ ٧ ٧ Transport and Communications ٧ ٧ ٧ ٧
Energy ٧ ٧ ٧ ٧ Environment ٧ ٧ ٧ ٧
Health ٧ Housing ٧ ٧
Public safety ٧ ٧ Culture ٧ ٧ ٧
Social services ٧ (basic legislation) ٧ ٧ Education and training ٧ (basic legislation) ٧ ٧
R&D ٧ ٧ Aid schemes for development ٧ ٧

83
human resources, productive environment. has been given to the Autonomous Communities, to the Provinces and Municipalities. While the Central Government deals with basic legislation in the various sectors, the Autonomous Communities formulate legislation and carry out the implementation of development initiatives. In particular Autonomous Communities mostly deal with urban and territorial planning, housing, local transport, culture and R&D and social assistance. Sub-regional levels of government have also the power to take action in particular areas (e.g. public safety, public transport, environment and water, tourism, housing and health). In particular, provinces coordinate the provision of services in these areas. Municipalities deal with public safety and health, education, traffic management, water management and public lighting, waste collection and public transport.
3.1.3. States with ‘Northern systems’ States with northern systems, typically Scandinavian, are unitary countries where local governments have a wide range of responsibilities in relation to regional development. Denmark, Finland and Sweden belong to this group. Finland has a strong tradition of decentralisation, especially with respect to public services. Recent reforms have been designed to increase efficiency of local provision, often limited by the low population density. Denmark is also decentralised and recent changes aimed at rationalising the geographical organisation of the public administration with the creation of regions by aggregating counties and the reduction of the number of municipalities. In sum, countries with northern systems have a tradition of decentralisation dating back to the beginning of the XX century which was strengthened between the 1970s and the 1990s. More recently, efforts have been concentrated on increasing the efficiency of the spatial organisation of the administration, combining counties and municipalities into larger entities.
Spain - Competences for regional development: functions and administrative levels involved
Central Regional/State Local Public corporations
Infrastructure and services ٧ ٧ ٧ Transport and Communications ٧ ٧ ٧
Energy ٧ ٧ Environment ٧ ٧
Health ٧ ٧ ٧ Housing ٧ ٧
Public safety ٧ Culture ٧
Social services ٧ ٧ Education and training ٧ ٧
R&D ٧ ٧ Aid schemes for development ٧ ٧
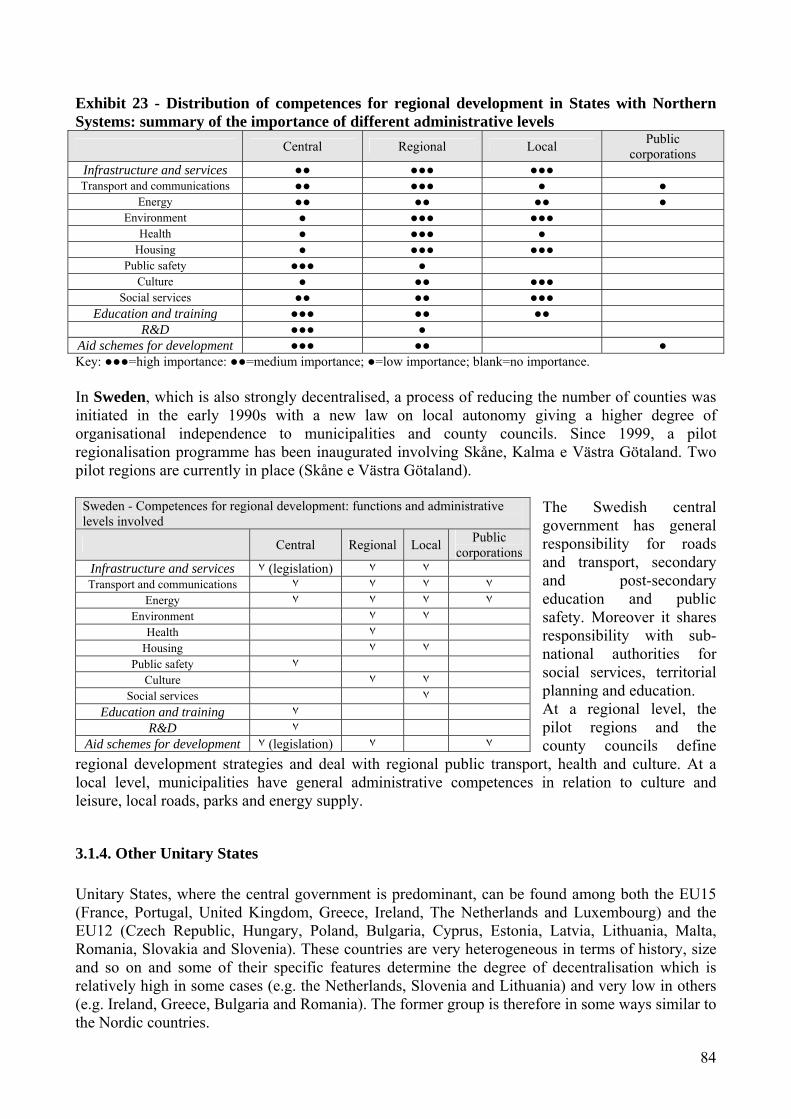
84
Exhibit 23 - Distribution of competences for regional development in States with Northern Systems: summary of the importance of different administrative levels
Central Regional Local Public corporations
Infrastructure and services ●● ●●● ●●● Transport and communications ●● ●●● ● ●
Energy ●● ●● ●● ● Environment ● ●●● ●●●
Health ● ●●● ● Housing ● ●●● ●●●
Public safety ●●● ● Culture ● ●● ●●●
Social services ●● ●● ●●● Education and training ●●● ●● ●●
R&D ●●● ● Aid schemes for development ●●● ●● ● Key: ●●●=high importance: ●●=medium importance; ●=low importance; blank=no importance. In Sweden, which is also strongly decentralised, a process of reducing the number of counties was initiated in the early 1990s with a new law on local autonomy giving a higher degree of organisational independence to municipalities and county councils. Since 1999, a pilot regionalisation programme has been inaugurated involving Skåne, Kalma e Västra Götaland. Two pilot regions are currently in place (Skåne e Västra Götaland).
The Swedish central government has general responsibility for roads and transport, secondary and post-secondary education and public safety. Moreover it shares responsibility with sub-national authorities for social services, territorial planning and education. At a regional level, the pilot regions and the county councils define
regional development strategies and deal with regional public transport, health and culture. At a local level, municipalities have general administrative competences in relation to culture and leisure, local roads, parks and energy supply.
3.1.4. Other Unitary States Unitary States, where the central government is predominant, can be found among both the EU15 (France, Portugal, United Kingdom, Greece, Ireland, The Netherlands and Luxembourg) and the EU12 (Czech Republic, Hungary, Poland, Bulgaria, Cyprus, Estonia, Latvia, Lithuania, Malta, Romania, Slovakia and Slovenia). These countries are very heterogeneous in terms of history, size and so on and some of their specific features determine the degree of decentralisation which is relatively high in some cases (e.g. the Netherlands, Slovenia and Lithuania) and very low in others (e.g. Ireland, Greece, Bulgaria and Romania). The former group is therefore in some ways similar to the Nordic countries.
Sweden - Competences for regional development: functions and administrative levels involved
Central Regional Local Public corporations
Infrastructure and services ٧ (legislation) ٧ ٧ Transport and communications ٧ ٧ ٧ ٧
Energy ٧ ٧ ٧ ٧ Environment ٧ ٧
Health ٧ Housing ٧ ٧
Public safety ٧ Culture ٧ ٧
Social services ٧ Education and training ٧
R&D ٧ Aid schemes for development ٧ (legislation) ٧ ٧

85
The case studies provide an insight into the distribution of competences in relation to regional development in a number of unitary states (France, UK, Portugal, Czech Republic, Poland and Hungary). Even though in recent years unitary states experienced, to varying extents, a process of increasing devolution of regional development policy, they remain very centralised. Sectoral competences in relation to infrastructure for development, human resources and business support schemes are either fully in the hands of national governments or the administration alone has been transferred to sub-national levels while legislation remains a prerogative of the centre. In the EU12, the fall of the Berlin wall was an important milestone in this process which was then fuelled by European integration and the need to manage Cohesion Policy and regional initiatives. In these countries, devolution has actually been stronger than in much of the EU15. In the EU12, the regional level of government either does not exist or is just an administrative tool with little or no political power. On the other hand, the local level is more important and often more autonomous than in the EU15. In the EU15 countries, the devolution trend seems to have been weaker and more likely to have been driven by a growing pressure by regions and minorities for more autonomy for historical, cultural and economic reasons. Exhibit 24 - Distribution of competences for regional development in other Unitary States: summary of the importance of different administrative levels
Central Regional Local Public corporations
EU15
Infrastructure and services ●●● ●● ●● ● Transport and communications ●●● ●● ●● ●
Energy ●●● ● ● Environment ●●● ●● ●●● ●
Health ●●● ●● ● Housing ●●● ● ●
Public safety ●●● ● ● ● Culture ● ●● ●●●
Social services ● ● Education and training ●● ●●● ●● ●
R&D ●●● ● Aid schemes for development ●●● ●● ●
EU12 Infrastructure and services ●●● ● ●●● ● Transport and communications ●●● ●● ●● ●
Energy ●●● ● ●● Environment ● ● ●●●
Health ●●● ● ● Housing ● ●●●
Public safety ●●● ● ●● Culture ●●● ●●●
Social services ●● ●●● ●● Education and training ●●● ●● ●● ●
R&D ●●● Aid schemes for development ●●● ●● ●● Key: ●●●=high importance: ●●=medium importance; ●=low importance; blank=no importance.

86
In France, competences have been always held by the central government and its territorial prefectures. Even here, however, there has been an increase in the autonomy of local authorities since the 1980s (regions, departments and municipalities). The decentralisation Acts in 1982 and 1983 introduced the principle of free administration and a transfer of competences to sub-central levels. With the Constitutional reform in 2003 and the legislation following this, a further step was taken in terms of sharing revenue-raising powers between state and local governments. Despite this trend towards more devolution, the central government exerts a strong influence on investment policy through national regulations and contractual arrangements (contracts de plan) in many areas where competence is not exclusively in the hands of the centre (local infrastructure, transport and education), investment is characterised by marked interaction between the responsibilities of different administrative level. Currently, in the policy areas relevant for development, competences are shared as follows: in relation to social services, basic regulation and supervision of local bodies is carried out by the centre, departments manage social assistance to families, and municipalities are responsible for optional services; in relation to training, central government is responsible for general intervention and basic legislation, regional authorities for regional plans and apprenticeships. As regards urban planning, the centre supervises and municipalities deal with planning. In the case of development support, national initiatives are complemented, in agreement with the centre, by regional, departmental and municipal initiatives. In the case of the environment, the centre deals with national parks and nature reserves, departments with waste management and municipalities with waste collection and sewerage. For culture, responsibility is shared. For transport, responsibilities are divided in such a way that interregional issues are dealt with by the centre, regional issues by the regions and departments and urban transport by the municipalities. Education is also split between the centre (universities and research), regions (high schools), departments (junior high schools) and municipalities (nursery and primary schools). So far as health is concerned, central government is the major player, responsible for universal coverage while municipalities manage local public health offices. Energy, telecommunications and public safety are mostly in the hands of the central government as well.
France - Competences for regional development: functions and administrative levels involved
Central Regional Local Public corporations
Infrastructure and services ٧ ٧ ٧ N/A Transport and Communications ٧ ٧ ٧
Energy ٧ Environment ٧ ٧ ٧
Health ٧ ٧ Housing ٧ ٧ ٧
Public safety ٧ ٧ ٧ Culture ٧ ٧ ٧
Social services Education and training ٧ ٧ ٧ N/A
R&D ٧ N/A Aid schemes for development ٧ ٧ N/A

87
In the UK, a process of devolution started only relatively recently. In 1998, the adoption of the Devolution Act established regional governments in Scotland, Wales and Northern Ireland and Regional Development Agencies were created in England.
The importance of Regional Development Agencies is likely to increase as they take over the functions of Regional Assemblies, administrative bodies, introduced in 2003. Despite these developments, centralisation in the UK remains strong as demonstrated for instance by the failure of a plan to establish elected regional governments in England which came to a halt in
2004. Regional authorities in the Scotland, Wales and Northern Ireland have legislative and administrative responsibility for public safety, telecommunications, culture, education, housing, health, transport, the environment, urban planning. Local authorities have administrative competence for local transport and traffic management, education, social services, waste collection, culture (libraries, museums) and some aspects of the environment. In Portugal, the principle of local self-government was introduced in the 1976 Constitution. Further steps towards devolution were taken in the following years but the process was halted in 1998 when the proposal to create a decentralised regional level was rejected in a referendum. Despite some competence for education (planning and management of education facilities, investment in nursery and primary education and school transport) being transferred to local governments in 1999, Portugal, in practice, remains one of most centralised European countries. At the regional level the Commissions for regional coordination and the Autonomous Regions have a role in the design of national policies for development and to their implementation. At a lower administrative level, the districts have a coordinating role, organise services for local areas and are responsible for school buildings, local arts and culture and museums.
United Kingdom - Competences for regional development: functions and administrative levels involved
Central Regional
(Scotland, Wales, Northern Ireland)
Local Public Corporations
Infrastructure and services ٧ ٧ ٧ ٧ Transport and Communications ٧ ٧ ٧ ٧
Energy ٧ ٧ ٧ Environment ٧ ٧
Health ٧ Housing ٧ ٧ ٧
Public safety ٧ ٧ Culture ٧ ٧ ٧
Social services ٧ ٧ Education and training ٧
R&D ٧ ٧ Aid schemes for development ٧ ٧ ٧
Portugal - Competences for regional development: functions and administrative levels involved
Central Regional Local Public corporations
Infrastructure and services ٧ ٧ ٧ ٧ Transport and communications ٧ ٧ ٧ ٧
Energy ٧ ٧ ٧ Environment ٧ ٧ ٧ ٧
Health ٧ ٧ ٧ Housing ٧ ٧
Public safety ٧ ٧ ٧ Culture ٧ ٧
Social services Education and training ٧ ٧ ٧ ٧
R&D ٧ ٧ Aid schemes for development ٧ ٧ ٧

88
At the local level (municipalities, metropolitan areas and local areas – freguesias), the public authorities are responsible for municipal infrastructure, energy networks, transport and communications, culture and education. In the Czech Republic, a process of decentralisation started in 1990 with the Municipal Act and a
second step occurred in 2000 when the Regions (krajs – NUTS3) were established. This last step in particular led to a transfer of competence for development to regions and municipalities with the central government slowly moving towards a general
coordination/stimulation role. The main areas where sub-national responsibilities have increased are education (primary and secondary), health, environmental protection
(e.g. water and waste management), social services, housing and tourism, culture, transport and communications. In Poland, devolution also started in 1990 with the law on local autonomy and municipalities. Further major steps were taken in 1998 (Act on local government revenue) and 1999 when regions (województwa) and districts (powiaty) were created. Elected regional councils also include representatives of the Prime Minister (wojewoda). The central government has legislative control over sub-national administrations and is also fully responsible for public safety and R&D. Regions have responsibility for certain areas of regional development and deal with territorial planning, health (hospitals), secondary education, social policy and employment, regional transport and communications and the environment. They are also responsible for managing operational programmes of EU Cohesion Policy. Local authorities (districts and municipalities) have shared responsibility for education, transport, the environment, social services, housing and energy supply.
Czech Republic - Competences for regional development: functions and administrative levels involved
Central Regional Local Public corporations
Infrastructure and services ٧ ٧ ٧ N/A
Transport and communications ٧ ٧ ٧
Energy ٧ ٧ Environment ٧ ٧
Health ٧ ٧ ٧ Housing ٧ ٧ Safety ٧ ٧ Culture ٧ ٧
Social services ٧ ٧ ٧
Education and training ٧ (tertiary educat.) ٧
R&D ٧ Aid schemes for
development ٧ ٧ (tourism)
٧ (tourism)
Poland - Competences for regional development: functions and administrative levels involved
Central Regional Local Public corporations
Infrastructure and services ٧ ٧ ٧ N/A Transport and communications ٧ ٧ ٧
Energy ٧ ٧ Environment ٧ ٧ ٧
Health ٧ ٧ ٧ Housing ٧
Public safety ٧ Culture ٧
Social services ٧ ٧ ٧ Education and training ٧ ٧ ٧ N/A
R&D ٧ N/A Aid schemes for development ٧ ٧ ٧ N/A

89
In Hungary, a process of devolution started in 1989 with the revision of the Constitution. Several reform measures were then taken to increase local autonomy and improve efficiency of sub-national authorities. In 1996 a law on planning and regional development allowed counties (megyék) to form administrative regions. In 1999, counties were obliged by law to set up seven administrative regions. There is an ongoing discussion on the possibility of transforming regions into self-governing bodies.
Currently, the central government has legislative responsibility in all areas related to regional development and t manages EU Cohesion Policy. The system of local governments is fragmented, including the capital city, the counties, cities with county status and municipalities (towns and villages). Counties deal with territorial organisation, environmental issues and tourism. Municipalities are
responsible for the environment (water, waste collection, sewerage), housing, local transport, education (from nursery to secondary level), basic health and culture.
Hungary - Competences for regional development: functions and administrative levels involved
Central Regional Local Public corporations
Infrastructure and services ٧ ٧ ٧ Transport and communications ٧ ٧ ٧ ٧
Energy ٧ ٧ Environment ٧ ٧
Health ٧ ٧ Housing ٧ ٧
Public safety ٧ ٧ Culture ٧ ٧
Social services ٧ ٧ Education and training ٧ ٧ ٧
R&D ٧ Aid schemes for development ٧ ٧

90
3.2. AN ANALYSIS OF EXPENDITURE IN THE SECTORS MOST RELEVANT FOR REGIONAL DEVELOPMENT This part of the chapter presents two pieces of analysis of the expenditure for development and the related administrative competences: first at EU27 level and then in seven countries, with a more in-depth sectoral approach. A brief description of the definition of the expenditure for development adopted is given below, before discussing the results of the analysis.
3.2.1. The definition of public expenditure for development A definition of the public expenditure for development (EfD) does not exist in the statistical accounting systems and varies in the economic literature depending on the aims of the different studies. As mentioned above, in line with the objective of the present study, EfD has been defined according to the eligibility criteria of EU Cohesion Policy, taking into account the international classification of the functions of government (COFOG) which categorises public expenditure according to purpose. In this way, the estimate of EfD reflects a statistical basis which is common to different national accounts and is comparable with EU Cohesion Policy expenditure. The approach followed in this study also takes into account the definition of the expenditure for development adopted in the verification of the additionality principle by DG Regio, which has a similar objective. Nonetheless, the EfD definition used here is determined by analytical aims rather than by regulatory compliance. The following exhibit provides a summary view of the definition of EfD adopted in relation to the COFOG classification of public expenditure. The functions of public expenditure (at 1- and 2-digit) are indicated in the rows while the different categories of expenditure (gross fixed capital formation, capital transfer, current expenditure) are shown in the columns; the markers identify the expenditures included in the EfD definition. The selected functions and categories relate largely to structural changes and the main drivers of development (human and physical capital, movements of goods and people, provision of public goods and services and social welfare).

91
Exhibit 25 - Definition of the expenditure for development adopted in the study Type of expenditure
COFOG – 1 digit - division COFOG – 2 digit - groups Gross fixed capital
formation
Capital transfer
Current expenditure
1.1 General public services 1.2 Foreign economic aid 1.3 General services 1.4 Basic research 1.5 R&D General public services √ √ 1.6 General public services n.e.c. 1.7 Public debt transactions
1 General public services
1.8 Transfers between different levels of gov. 2.1 Military defence 2.2 Civil defence 2.3 Foreign military aid 2.4 R&D Defence
2 Defence
2.5 Defence n.e.c. 3.1 Police services 3.2 Fire-protection services 3.3 Law courts 3.4 Prisons 3.5 R&D Public order and safety
3 Public order and safety
3.6 Public order and safety n.e.c. 4.1 General economic and labour affairs √ √ 4.2 Agriculture, forestry, fishing and hunting √ √ 4.3 Fuel and energy √ √ 4.4 Mining, manufacturing and construction √ √ 4.5 Transport √ √ 4.6 Communication √ √ 4.7 Other industries √ √ 4.8 R&D Economic affairs √ √
4 Economic affairs
4.9 Economic affairs n.e.c. 5.1 Waste management √ √ 5.2 Waste water management √ √ 5.3 Pollution abatement √ √ 5.4 Protection of biodiversity and landscape √ √ 5.5 R&D Environmental protection √ √
5 Environmental protection
5.6 Environmental protection n.e.c. √ √ 6.1 Housing development √ √ 6.2 Community development √ √ 6.3 Water supply √ √ 6.4 Street lighting √ √ 6.5 R&D Housing and community amenities √ √
6 Housing and community amenities
6.6 Housing and community amenities n.e.c. 7.1 Medical products, appliances and equipment 7.2 Outpatient services 7.3 Hospital services √ 7.4 Public health services 7.5 R&D Health √ √
7 Health
7.6 Health n.e.c. 8.1 Recreational and sporting services √ √ 8.2 Cultural services √ √ 8.3 Broadcasting and publishing services 8.4 Religious and other community services 8.5 R&D Recreation, culture and religion √ √
8 Recreation, culture and religion
8.6 Recreation, culture and religion n.e.c. 9.1 Pre-primary and primary education √ 9.2 Secondary education √ 9.3 Post-secondary non-tertiary education √ 9.4 Tertiary education √ 9.5 Education not definable by level √ √ √ 9.6 Subsidiary services to education 9.7 R&D Education √ √
9 Education
9.8 Education n.e.c. 10.1 Sickness and disability 10.2 Old age 10.3 Survivors 10.4 Family and children √ 10.5 Unemployment 10.6 Housing 10.7 Social exclusion n.e.c. 10.8 R&D Social protection
10 Social protection
10.9 Social protection n.e.c.

92
This general definition has been adapted in the different steps of the analysis to the availability of data. In the next section (§. 3.2.2), the EU27 analysis is based on capital expenditure at a COFOG 1-digit level (4. Economic affairs; 5. Environmental protection; 6. Housing and community amenities; 7. Health; 8. Recreation, culture and religion; 9. Education) while current expenditure for training activities is not included. Eurostat is the only statistical source for which data for different countries are comparable42. In the following section (§. 3.2.3), the analysis is based on COFOG 2-digit and the EfD aggregate varies between countries because no consistent data at this level of detail exist across countries. As a consequence, statistical sources are national and, in some cases, figures have been estimated by the national experts. A description of approach used is given in the sections. A more detailed discussion of the approach used to measure EfD is contained in Annex 2. There are as few additional considerations concerning financial data on EU Cohesion Policy. Allocated resources rather than disbursements have been used because de-commitments have been very limited and expenditure data changed according to national declarations and EU controls. These data are classified according to the fields of interventions (FOI) defined in the EU Regulation43. The purpose of this classification is monitoring and FOI are not consistent with any statistical classification of public expenditure, COFOG or similar. These considerations imply that EU Cohesion Policy data are not aligned with existing statistics on national public expenditure and the comparison with EfD can be only indicative. Since data on national public expenditure includes EU Cohesion Policy support in every country, the ratio between European and national expenditure must be equal to or lower than 1. In some cases among the comparisons presented below, the ratio is higher than 1. This largely occurs when countries are small and public expenditure low so that the scope for error is significant. Consequently, the ratios presented have to be interpreted as indicative of a high level of EU Cohesion Policy support.
3.2.2. The scale of expenditure for development
3.2.2.1. Preliminary remarks The first estimation of expenditure for development presented in this section is based on Eurostat data and is aimed at sketching the main trends across the EU27. Eurostat data do not enable an analysis to be undertaken of expenditure for development (EfD) in detail for many reasons. The most important are: − Available categories of public expenditures in COFOG are limited and for the purpose of the
study only “Gross capital formation” and “Capital transfer consolidated” can be used. This means that the analysis is partly affected (and even distorted) by the inclusion of financial assets and real estate transactions44 of public bodies, which are not directly relevant for investment (in effect, they can be regarded as a means of financing investment rather investment as such);
− The classification of expenditure by function is available at COFOG 1-digit level and this constrains EU27 comparisons which can be carried out only for the main aggregates;
42 Eurostat data for different administrative levels are not consolidated, and the total of their expenditure can be superior than the general government expenditure. In addition, because data derive from ESA, public sector aggregate is not considered. 43 Commission Regulation No. 438/2001, Annex IV. 44 For these reasons Austria in 2004, Belgium in 2005, UK in 2005 are affected by deep changes in the expenditure and in some other cases aggregates become negative.

93
− Data for different sub-sectors of government are not consolidated and so include transfers between administrative levels and do not provide a precise accounting of real expenditure.
Despite these limitations, the most recent Eurostat data45 have the merit of covering all EU27 Member States in the 2003-2007 period and 24 of them in the 2000-2007 period (Hungary, Poland, Romania are excluded). According to the approach adopted here and the availability of data, the estimate of expenditure for development presented in this section includes (as in the exhibit below): − gross capital formation in the following COFOG divisions: 4. Economic affairs; 5.
Environmental protection; 6. Housing and community amenities; 7. Health; 8. Recreation, culture and religion; 9. Education;
− capital transfers consolidated in the following COFOG divisions: 4. Economic affairs; 5. Environmental protection; 6. Housing and community amenities; 8. Recreation, culture and religion (religion which is not eligible for Structural Fund support is very small).
Exhibit 26 - Categories of expenditure included in the estimate of EfD in the present section
Type of expenditure COFOG digit 1 Gross fixed capital formation Capital transfer
4 Economic affairs √ √ 5 Environmental protection √ √ 6 Housing and community amenities √ √ 7 Health √ 8 Recreation, culture and religion √ √ 9 Education √ The results of the analysis are presented in the following five exhibits; countries are ordered according to the classification used in the previous parts of the study: − Federal states (AT, BE, DE), − “Regionalised” states (ES, IT), − “Northern System” states (DK, FI, SE), − Other Unitary states (EU27 without Federal states, Regionalised states and countries with
“Northern systems”); EU15 and EU12 are grouped separately.
3.2.2.2. Expenditure for development in EU27 The level of expenditure and its orientation towards convergence In the 2000-2007 period, annual EfD in EU27 was around EUR 645 per capita, ranging from a low of EUR 70 in Bulgaria and a high of over EUR 2,000 in Luxemburg. The large differences reflect the investment capacity of countries, price levels and development strategies. In the exhibit below, EfD is deflated by a comparative price index. This reduces the differences among countries, which, nevertheless, remain large, general government expenditure varying from 26% of the EU27 average in Bulgaria to 318% in Luxemburg. Among Objective 1 countries, Spain, Ireland and Greece had relatively high level of EfD per capita; among EU12 countries, the Czech Republic had a level of expenditure above the EU average and three times larger than the other countries in the group.
45 Figures of this paragraph are calculated on data extracted from Eurostat data warehouse at the end of October 2009.

94
Exhibit 27 - Expenditure for development: values per head (EUR, EU27=100; period 2000-2007)
Expenditure per inhabitant (EUR) Expenditure per inhabitant in PPS(c) (EU27=100)
General gov.
Central gov.
State gov.
Local gov.
General gov.
Central gov.
Decentralised gov.
(state+local) AT - Austria 800.2 549.9 179.4 285.6 120.5 175.2 108.1BE - Belgium 687.2 185.8 341.1 195.2 101.0 57.6 121.7Federal
states DE - Germany 673.9 270.8 290.1 255.8 99.7 84.8 124.5ES - Spain 830.3 263.6 358.6 202.3 144.5 97.0 150.6Regionalise
d states IT - Italy 783.1 379.8 505.9 118.2 121.3 117.9DK - Denmark 562.2 186.9 376.1 63.6 44.9 65.5FI - Finland 639.8 281.5 368.7 80.5 75.0 71.6Northern
Systems SE - Sweden 703.3 360.1 356.6 90.4 98.1 70.7FR - France 757.3 215.9 552.6 109.4 66.0 123.1GR - Greece 730.5 863.4 72.2 131.6 329.3 20.0IE - Ireland 1,469.8 1,097.2 1,048.9 184.7 291.6 203.5LU - Luxembourg 2,189.1 1,467.6 850.1 318.6 451.0 191.3NL - Netherlands 906.6 386.2 644.3 135.4 122.2 148.4PT - Portugal 510.3 245.2 264.6 92.8 94.3 74.2
Other Unitary States – EU15
UK – Un.Kingdom 567.6 397.5 315.7 78.4 116.2 67.2BG - Bulgaria 73.1 49.7 23.4 26.2 37.9 12.8CZ - Czech Republic 560.4 359.8 235.2 154.3 210.9 99.1EE - Estonia 288.2 177.4 128.5 68.0 88.4 46.8HU – Hungary(a) 295.3 218.3 110.5 75.7 118.4 44.3LT - Lithuania 165.7 105.8 59.5 46.1 62.5 25.4LV - Latvia 174.9 93.3 88.2 44.6 50.7 34.5PL – Poland(b) 161.9 58.1 107.9 42.2 32.2 43.2RO - Romania(b) 114.9 77.8 40.2 32.8 47.9 17.1SI - Slovenia 351.3 250.4 103.2 72.0 108.7 32.5SK - Slovakia 203.9 171.3 58.6 62.9 113.1 26.1CY - Cyprus 491.2 467.8 59.9 84.9 171.1 16.0
Other Unitary States – EU12
MT - Malta 505.3 505.3 0.0 106.2 224.9 0.0EU27(b) 645.1 304.8 92.1 326.1 100.0 100.0 100.0EU15 723.8 681.9 635.6 590.8 106.9 106.9 213.2EU12(b) 250.0 250.0 250.0 237.1 65.9 65.9 81.0(a) 2001-2007; (b) 2002-2007; (c) calculated with the comparative price indices of Eurostat. Source: Ismeri Europa and Applica processing on Eurostat data As shown in the next exhibit, in PPS terms, EfD per capita is correlated to GDP per head and consequently to the general availability of resources for investment, but some countries diverge from this relationship. Mediterranean countries (MT, ES, GR, and PT) plus IE and CZ spend more than would be expected from this relationship; northern countries (SE, FI, UK, DK) spend less. It is not possible to investigate here the entire range of factors underlying this, but the EU Cohesion Policy are probably one of the main reasons for the high expenditure in Cohesion and Objective 1 countries (taking account of the fact that in the period 2000-07, support to EU12 countries was limited). In the northern countries a better functioning of markets and institutions, as well as higher expenditure on public services and less need for infrastructure may serve to reduce public investment. The variation in EfD per capita appears to be less pronounced in local government than in central government.

95
Exhibit 28 - The relation between total EfD per capita and GDP per head in PPS (2000-2007)
300.0250.0200.0150.0100.050.00.0
350.0
300.0
250.0
200.0
150.0
100.0
50.0
0.0
Tota
l EfD
per
cap
ita in
PPP
s (E
U27
=100
)
EU27
UKSKSI
SE
RO
PT
PL
NL
MT
LV
LU
LT
IT
IE
HU
GR
FI
ES
EE
DE
CZ
BG
BE
AT
R Sq Linear = 0.761
Sources: Ismeri Europa and Applica processing on Eurostat data The next exhibit shows the relationship between GDP per capita and expenditure for development as % of GDP, which measures the development effort of the public sector. This graph confirms the hierarchy between countries described previously, but it also indicates the major effort carried out by cohesion countries in comparison to the other MS and the major contribution of the EU Cohesion Policy in this regard. In fact, the distance of these countries from the EU average depends heavily on EU financial support. It is also interesting to note that countries with expansionary budget policies, such as Greece and Spain, had a better performance than countries with more restrictive policies, such as Portugal and Italy; taking into account differences due to their relative size, these cases demonstrate that EU Cohesion Policy alone, in spite of being crucial for development, cannot generate an increase of national EfD significantly above the EU average.

96
Exhibit 29 - The relation between total EfD (as a % of GDP) and GDP per capita in PPS (2000-2007)
300.0250.0200.0150.0100.050.00.0
7.0
6.0
5.0
4.0
3.0
2.0
1.0
Tota
l EfD
on
GD
P (%
)
EU27
UK
SK
SI SE
RO PT
PL
NL
MT
LV
LU
LT
IT
IEHU
GR
FR
FI
ES
EE
DK
DE
CZ
CYBG
BE
AT
The role of the different administrative levels in EfD As expected, federal and regionalised countries have in general a higher level of expenditure undertaken by decentralised (state plus local) governments. Relative to the EU average, decentralised expenditure is not particularly high in Austria among federal countries, while it is high in France, Ireland, Luxemburg, Netherlands and Czech Republic among unitary countries. In 2000-2007, EfD, as defined here, represented 3% of EU27 GDP and almost 15% of total private and public investment in the EU (see exhibit below); more than half being carried out by decentralised governments. EfD relative to GDP is higher in the less developed countries, but differences exist within the different groups of countries: In Denmark and UK, it is significantly lower than the EU average (in Denmark, it the lowest in the EU), while it is highest in the Czech Republic (6.4%) followed by Greece, Spain, Ireland and Malta. In the EU12, Slovenia and Bulgaria have the lowest levels in relation to GDP.

97
Exhibit 30 - Expenditure for development on GDP and total investment (period 2000-2007) % of GDP % of gross fixed capital formation
General gov.
Central gov. State gov. Local gov. General
gov. Central
gov. State gov. Local gov.
AT – Austria 2.8 1.9 0.6 1.0 12.6 8.7 2.8 4.5 BE – Belgium 2.5 0.7 1.2 0.7 12.2 3.2 6.1 3.5 DE – Germany 2.5 1.0 1.1 1.0 13.5 5.4 5.8 5.1 ES – Spain 4.3 1.4 1.8 1.0 15.3 4.9 6.6 3.7 IT – Italy 3.3 1.6 2.1 16.0 7.7 10.4 DK – Denmark 1.5 0.5 1.0 7.7 2.6 5.1 FI – Finland 2.2 1.0 1.3 11.6 5.1 6.7 SE – Sweden 2.2 1.1 1.1 12.7 6.5 6.5 FR – France 2.9 0.8 2.1 14.5 4.1 10.6 GR - Greece 4.6 5.5 0.5 21.2 24.9 2.1 IE - Ireland 4.1 3.0 2.9 17.0 12.6 12.2 LU - Luxembourg 3.6 2.4 1.4 17.1 11.4 6.7 NL - Netherlands 3.0 1.3 2.1 15.1 6.5 10.7 PT - Portugal 3.8 1.8 2.0 15.9 7.7 8.3 UK - United Kingdom 1.9 1.3 1.1 11.2 7.9 6.3 BG - Bulgaria 2.7 1.9 0.8 12.4 8.8 3.6 CZ - Czech Republic 6.4 4.2 2.6 24.5 15.9 10.1 CY – Cyprus 2.9 2.7 0.3 15.5 14.8 1.9 EE - Estonia 3.7 2.3 1.7 12.1 7.3 5.5 HU - Hungary(a) 4.2 3.1 1.4 18.8 13.9 6.3 LT - Lithuania 2.9 1.9 1.0 13.2 8.5 4.6 LV – Latvia 2.9 1.5 1.5 9.9 5.2 5.1 MT – Malta 4.3 4.3 0.0 22.2 22.2 0.0 PL - Poland(b) 3.4 1.2 2.3 17.8 6.5 11.8 RO – Romania(b) 3.9 2.8 1.3 16.2 11.6 5.1 SI – Slovenia 2.6 1.9 0.8 10.4 7.5 3.0 SK – Slovakia 3.6 3.1 0.9 13.9 12.0 3.4 EU15 2.8 1.3 0.4 1.4 14.0 6.4 2.2 7.2 EU12(b) 4.0 2.3 1.8 17.5 10.3 8.1 EU27(b) 2.9 1.4 0.4 1.5 14.4 6.8 2.1 7.3
(a) 2001-2007; (b) 2002-2007 Source: Ismeri Europa and Applica processing of Eurostat data As regards EU Cohesion Policy, the funding amounted to around 1% of GDP on average to EU10 countries in 2004-2006 and 0.25% to the EU15 in 2000-2006, though in Greece and Portugal, the figure was around 2% of GDP. If the Cohesion Fund is also considered, EU support to EfD in Cohesion countries increases considerably. Decentralised governments manage over 60% of EfD in the EU (see exhibit below), which includes transfers which are not consolidated. In reality, it might be larger if it is reasonably supposed that a large part of transfers takes place from central to local government. The scale of intergovernmental transfers - estimated for some countries in the exhibit as the sum of the expenditure of the different governments in relation to the general government expenditure - is around 12% of the overall expenditure in the EU. The importance of decentralised administrations in EfD varies according to the type of institutional arrangement: it is higher in the federal states and lower in the unitary states. There are, however, some exceptions: in Austria (64%) it is similar to the EU average even though it is a federal state; in France, Netherlands and Ireland, development expenditure undertaken by decentralised governments is more than in regionalised countries. Malta, as its size may suggest, has no EfD at local government level.

98
Exhibit 31 - Expenditure for development: composition and scale of transfers (period 2000-2007)
% of total general gov.
general government Central gov. State gov. Local gov.
Decentralised gov. (state+local)
% of general gov.
Estimation of intergovernmental transfers (c)
(as % of GG expenditure)
AT – Austria 65.4 24.7 39.4 64.1 29.5 BE – Belgium 21.7 53.9 29.9 83.8 5.5 DE - Germany 40.1 43.2 38.0 81.1 21.2 ES - Spain 31.7 43.1 24.4 67.6 0.0 IT - Italy 48.1 65.7 65.7 13.8 DK - Denmark 33.5 66.7 66.7 0.0 FI - Finland 44.1 57.5 57.5 0.0 SE - Sweden 50.9 51.0 51.0 0.0 FR - France 28.4 73.0 73.0 0.0 GR - Greece 118.4 10.1 10.1 28.5 IE - Ireland 74.2 71.7 71.7 45.9 LU - Luxembourg 66.7 39.1 39.1 5.8 NL - Netherlands 42.9 71.0 71.0 13.8 PT - Portugal 47.9 52.0 52.0 0.0 UK - United Kingdom 70.4 57.1 57.1 27.6 BG - Bulgaria 71.8 28.2 28.2 0.0 CZ - Czech Republic 64.8 41.6 41.6 6.3 EE - Estonia 60.4 45.1 45.1 5.5 HU - Hungary(a) 74.0 34.3 34.3 8.4 LT - Lithuania 64.2 35.6 35.6 0.0 LV - Latvia 51.4 52.8 52.8 4.1 PL - Poland(b) 36.5 66.0 66.0 0.0 RO - Romania(b) 72.3 31.0 31.0 0.0 SI - Slovenia 71.6 29.0 29.0 0.0 SK - Slovakia 83.4 31.6 31.6 15.0 CY - Cyprus 95.4 12.2 12.2 7.6 MT - Malta 100.0 0.0 0.0 0.0 EU27(b) 47.2 14.4 50.6 65.0 12.2 (a) 2001-2007; (b) 2002-2007 (c) Intergovernmental transfers have been estimated as difference between the sum of central, state and local government EfD in relation to General Government expenditure. Null values indicate that data are consolidated. Source: Ismeri Europa and Applica processing on Eurostat data The sectoral composition of the EfD Overall, economic affairs accounts for nearly half of total expenditure for development in the EU (see the following exhibit), the share being relatively similar in federal and regionalised states while it is relatively heterogeneous in the countries with northern systems and within EU15 and EU12 unitary states. Within the group with northern systems, economic affairs represents slightly more than a quarter of total EfD in Denmark while the share is twice this in Sweden and Finland. In the EU15, the share of this function varies from 18.5% in France to almost 70% in Greece. In the EU12, it ranges from around 35% in Cyprus to over 70% in Lithuania. Housing and community amenities follow with a share of almost 18% of total European EfD. Within the group of unitary states, the below average share of economic affairs in France is accompanied by a large share accounted for by housing and community services.

99
Exhibit 32 - EfD and COFOG components (General Government EfD=100)
general government GF04 -
Economic affairs
GF05 - Environment
protection
GF06 - Housing
and community amenities
GF07 - Health
GF08 - Recreation, culture and
religion
GF09 - Education Total EfD
AT - Austria 60.0 8.7 13.5 2.8 7.2 7.8 100.0BE - Belgium 63.5 8.8 8.8 0.6 9.7 8.6 100.0DE - Germany 51.5 6.4 24.0 0.5 5.6 12.0 100.0ES - Spain 61.8 5.7 12.7 4.8 7.8 7.1 100.0IT - Italy 65.7 7.3 8.8 5.4 7.0 5.9 100.0DK - Denmark 26.5 4.4 11.0 17.3 13.5 27.3 100.0FI - Finland 52.1 2.2 3.0 13.1 7.9 21.8 100.0SE - Sweden 52.0 1.0 12.5 12.6 4.7 17.2 100.0FR - France 18.5 7.9 33.9 8.9 13.7 17.1 100.0GR - Greece 69.4 4.2 4.3 10.1 2.0 10.1 100.0IE - Ireland 54.4 5.7 21.2 6.8 5.2 6.8 100.0LU - Luxembourg 51.5 6.1 10.4 0.5 13.9 17.6 100.0NL - Netherlands 56.7 5.2 20.1 0.2 6.3 11.4 100.0PT - Portugal 56.6 7.8 11.1 3.9 11.4 9.2 100.0UK - United Kingdom 37.3 5.2 18.3 14.7 8.5 16.1 100.0BG - Bulgaria 47.4 15.4 14.0 10.6 3.6 8.9 100.0CZ - Czech Republic 61.6 8.1 12.0 1.2 6.6 10.5 100.0EE - Estonia 36.1 5.8 4.4 9.3 15.8 28.6 100.0HU - Hungary(a) 62.3 11.4 5.9 5.7 7.6 7.0 100.0LT - Lithuania 71.3 5.1 2.9 8.1 4.0 8.5 100.0LV - Latvia 42.6 12.2 14.6 7.1 8.1 15.4 100.0PL - Poland(b) 48.1 10.5 13.0 6.7 8.7 13.0 100.0RO - Romania(b) 48.9 2.9 25.4 7.7 2.7 12.4 100.0SI - Slovenia 48.9 4.0 6.1 11.7 9.8 19.5 100.0SK - Slovakia 59.3 7.6 13.3 5.5 6.5 7.9 100.0CY - Cyprus 34.8 3.2 31.9 10.2 7.1 12.7 100.0MT - Malta 39.7 7.3 4.3 34.3 3.9 10.6 100.0EU27 49.9 6.4 17.7 6.0 8.1 11.8 100.0(a) 2001-2007; (b) 2002-2007 Source: Ismeri Europa and Applica processing on Eurostat data Education accounts for nearly 12% of EU EfD. Cross-country variability is high and there is no evident pattern across country groups. The share is below average in Ireland, Austria and Hungary while it represents it is close to 30% of EfD in Germany and Denmark and around 20% in Finland, Sweden and Slovenia. The role of the decentralised government levels in the EfD varies across functions. It is particularly large in environmental protection, housing and education where the subsidiarity principle is broadly applied (see exhibit below). By contrast, the role is small in health, where only in the “regionalised” and “northern system” countries are decentralised administrations responsible for expenditure.

100
Exhibit 33 - Expenditure for development: weight of decentralised government expenditure (state + local) in different COFOG categories (not consolidated data; % values; period 2003-2007)
COUNTRY GF04 -
Economic affairs
GF05 - Environment
protection
GF06 - Housing and community amenities
GF07 - Health
GF08 - Recreation, culture and
religion
GF09 - Education TOTAL
AT – Austria 59.8 86.6 65.6 11.0 89.3 68.2 62.5 BE – Belgium 79.2 111.7 126.4 50.0 113.4 98.0 91.3 DE – Germany 72.9 102.3 74.1 70.2 105.3 99.0 79.7 ES – Spain 54.0 80.9 96.1 90.6 86.5 98.3 68.5 IT – Italy 45.1 88.4 54.8 97.4 79.9 99.3 63.6 DK – Denmark 49.9 33.2 87.4 96.2 59.8 77.6 69.6 FI – Finland 30.0 52.2 39.9 99.8 94.4 95.6 59.3 SE – Sweden 21.6 87.7 87.8 99.5 89.5 61.9 49.6 CY – Cyprus 0.0 96.2 16.5 0.0 47.9 0.0 11.8 FR – France 69.4 93.6 83.6 2.7 79.6 84.7 74.0 GR - Greece 11.2 37.0 23.8 0.0 29.3 0.0 10.9 IE - Ireland 68.9 95.7 92.4 48.4 40.0 24.8 71.0 LU - Luxembourg 19.0 83.6 45.5 30.3 67.8 56.4 38.5 MT - Malta 0.0 0.0 0.0 0.0 0.0 0.0 0.0 NL - Netherlands 57.3 82.9 101.3 23.4 87.9 88.2 73.6 PT - Portugal 42.8 71.1 95.8 5.4 75.9 31.2 52.0 UK - United Kingdom 57.6 20.1 58.1 0.0 62.6 93.4 53.4 BG - Bulgaria 11.7 90.6 92.5 28.5 47.0 33.9 37.1 CZ - Czech Republic 28.0 95.4 75.2 55.6 85.2 68.3 45.7 EE - Estonia 28.6 64.1 117.1 34.8 48.6 57.6 42.0 HU - Hungary(a) 18.6 80.5 100.1 45.8 35.2 45.9 34.8 LT - Lithuania 35.7 106.1 93.4 38.7 35.9 36.4 37.5 LV - Latvia 30.3 34.4 81.1 13.2 61.8 65.2 42.6 PL - Poland 58.2 95.7 72.0 59.8 73.2 61.6 65.7 RO - Romania 22.9 36.0 53.2 4.9 62.8 30.1 31.2 SI - Slovenia 17.0 1.8 73.0 20.4 53.0 57.0 32.2 SK - Slovakia 20.5 55.9 87.9 24.2 46.9 54.7 38.0 EU27 52.3 79.9 83.6 37.8 80.2 84.4 64.8 (a) 2002-2007; Source: Ismeri Europa and Applica processing on Eurostat data Decentralised and central governments have similar shares of investment in Economic affairs. The large size and the numerous functions included (transport, enterprise environment, etc.) make it difficult to draw general conclusions. However, the different institutional models can explain a large part of the differences: more devolved expenditure in federal and regionalised countries. The main exceptions are France, Ireland, the Netherlands, the UK and Poland with a large share at local level and Italy with a relatively small share at this level. The dynamics of EfD EfD in the EU has grown by almost 4% per year on average in real terms in the 2004-2007 period, a higher rate than growth of GDP. Growth was highest in many of the EU12 countries, together with Ireland, UK, Austria and Belgium, while expenditure declined in Denmark, Greece, Portugal, Slovenia and Slovakia.

101
Exhibit 34 - Expenditure for development: annual average growth and contribution of levels of government and COFOG categories (period 2001-2007)
Real growth rate(c)
Contributions to total growth(d) Contributions to total growth(d)
General gov.
Central gov. State gov. Local gov.
GF04 - Economic
affairs
GF05 - Environment
protection
GF06 - Housing and community amenities
GF07 - Health
GF08 - Recreation, culture and
religion
GF09 - Education
AT – Austria 12.8 15.4 -1.4 -1.5 15.7 -0.2 -1.3 -0.6 -0.1 -0.7 BE – Belgium 10.8 10.8 0.1 0.0 11.3 -0.5 -0.4 0.1 0.2 0.1 DE – Germany 0.9 1.6 -1.4 -0.8 1.6 -0.4 -0.2 0.0 -0.1 0.0 ES – Spain 4.6 1.4 2.3 1.1 2.5 0.4 0.0 0.4 0.7 0.6 IT – Italy 4.4 3.9 0.8 4.1 0.3 0.1 -0.1 0.0 0.0 DK – Denmark -0.1 -2.2 2.0 -0.2 0.1 -0.6 0.9 0.7 -1.0 FI – Finland 4.3 1.4 3.0 2.2 0.2 0.4 0.8 0.1 0.5 SE – Sweden 3.5 2.6 1.1 3.4 -0.3 0.4 0.3 0.3 -0.6 FR – France 2.5 1.0 2.2 -0.1 0.3 0.9 0.4 0.7 0.3 GR – Greece -2.3 0.1 0.1 -3.1 0.3 0.1 -0.4 0.1 0.6 IE – Ireland 10.7 9.0 6.7 5.2 0.5 3.6 0.3 0.7 0.4 LU - Luxembourg 3.6 3.3 0.7 1.3 0.4 0.2 0.0 1.0 0.9 NL - Netherlands 2.0 -1.3 2.4 0.3 0.2 0.6 0.0 0.0 0.9 PT – Portugal -3.7 -2.6 -1.1 -2.2 -0.3 -0.8 -0.2 0.3 -0.5 UK – Un.Kingd. 10.6 5.8 1.6 4.6 1.2 0.5 -0.1 2.0 2.5 BG – Bulgaria 24.0 14.1 10.0 10.7 2.3 5.7 1.4 1.2 2.7 CZ - Czech Rep. 11.5 7.3 4.3 7.8 0.7 0.9 0.1 0.9 1.1 EE – Estonia 18.7 12.7 8.2 9.6 0.8 0.4 2.2 2.4 3.3 HU - Hungary(a) 11.1 9.0 3.9 9.0 0.5 1.0 0.4 -0.4 0.6 LT – Lithuania 15.4 6.1 9.2 4.0 3.5 0.4 2.5 1.6 3.5 LV – Latvia 27.4 17.2 10.9 14.8 -1.4 2.9 4.3 2.3 4.5 PL - Poland(b) 10.4 3.9 6.5 6.4 0.8 -0.8 1.2 1.8 0.9 RO - Romania(b) 25.7 11.6 13.2 18.9 0.3 3.8 -1.0 0.7 3.0 SI – Slovenia -0.9 -3.0 1.9 -3.1 0.4 0.1 0.4 0.4 0.9 SK – Slovakia -2.2 -7.0 5.9 -2.4 -0.6 1.3 -1.0 0.1 0.4 CY – Cyprus 3.7 2.7 0.7 0.4 0.2 2.6 -0.6 0.4 0.7 MT – Malta 7.9 7.9 0.0 2.9 1.9 -0.7 3.9 -0.4 0.2 EU27(b) 3.8 2.2 0.0 1.4 1.7 0.3 0.9 0.2 0.3 0.4 (a) 2002-2007; (b) 2003-2007; (c) Real average annual growth rate is calculated as average of the annual current growth rate of EfD minus the annual inflation rate. (d) The contribution to general government EfD growth is calculated as percentage variation multiplied for the weight of the component (level of government or function) on the general government EfD of the previous year. In the case of the level of government the total of the contributions does not correspond to the overall growth because EfD data are not consolidated. Source: Ismeri Europa and Applica processing on Eurostat data

102
The biggest contribution to EfD growth46 came from central government at EU level as well as in federal countries and Italy and the UK (see exhibit below). In EU12 countries, the trends were less clear. In some countries, EfD increased, especially at the local level (in Slovenia, Slovakia, Poland, Lithuania) while in others more at central level (Bulgaria, Latvia, Estonia). Economic affairs, which accounts for the largest share of EfD, contributed most to growth (for around half of the overall increase across the EU). Environmental protection made a relatively large contribution in Malta, Bulgaria and Lithuania, while expenditure declined in Germany, Latvia and Slovakia. Growth of expenditure on Housing and community amenities was relatively large in Cyprus, France, Ireland, Bulgaria and Romania while there was a fall in Denmark, Portugal and Poland. Investment in Health increased in Denmark, Malta, Bulgaria and fell in Slovakia and Greece. The contribution of recreation, culture and religion was generally positive, especially in Spain, France, Luxemburg, the UK and Estonia. Investment in education47 increased in the EU12 (especially in Latvia, Estonia and Bulgaria), the Netherlands and the UK and declined in Denmark and Portugal. The EU Cohesion Policy contribution to EfD In the next exhibit, the contribution of EU Cohesion Policy to national EfD is calculated. At this level of functional detail, EU Cohesion Policy values do not include ESF in order to be consistent with EfD. In the 2004-2006 period, the annual contribution of Cohesion Policy amounted to 10.6% of EU25 EfD. This proportion is not negligible and confirms the important role of the EU Cohesion Policy in supporting overall public investment and territorial development. The contribution is unequally distributed between Member States and is highest in the cohesion countries, where it ranges from a maximum of more than 81% in Latvia to a minimum of 13% in Malta. If we consider the cases which are below the EU average, the contribution is most significant, as would be expected, in countries with large Objective 1 areas (7.5% in Ireland, 7.4% in Italy, 5.2% in Germany). The Member States where the contribution is lowest (below 2%) are Denmark, the Netherlands and Luxembourg.
46 The contribution to general government EfD growth is calculated as percentage change multiplied for the weight of the component (level of government or function) on the general government EfD of the previous year. 47 As mentioned in the preliminary remarks, it is worth stressing again that EfD for education does not include current expenditure for training, which is not separable from the overall current expenditure for education. Consequently, it includes only public investments and capital transfers.

103
Exhibit 35 - Contribution of EU Cohesion Policy to EfD in the 2000-2006 period
EU Cohesion Policy (Meur; except ESF; annual
average 2000-2006 or 2004-2006 for NMS)
EfD (Meur; annual average
2000-2006 or 2004-2006 for NMS)
EU contribution to EfD(%)
A B (A/B) LV - Latvia 406 496 81.8 LT - Lithuania 522 645 80.9 SK - Slovakia 537 912 58.9 EE - Estonia 249 450 55.3 PT - Portugal 2,807 5,390 52.1 PL - Poland 4,148 8,243 50.3 GR - Greece 3,196 8,140 39.3 HU - Hungary 1,042 3,512 29.7 SI - Slovenia 158 726 21.7 ES - Spain 6,962 33,937 20.5 CZ - Czech Republic 851 6,288 13.5 MT - Malta 26 201 12.8 EU25* 31,263 294,363 10.6 CY - Cyprus 39 418 9.4 IE - Ireland 418 5,593 7.5 IT - Italy 3,309 44,608 7.4 FI - Finland 195 3,263 6.0 DE - Germany 2,866 54,703 5.2 UK - United Kingdom 1,361 32,354 4.2 FR - France 1,420 46,016 3.1 SE - Sweden 176 6,152 2.9 AT - Austria 174 6,638 2.6 BE - Belgium 152 7,186 2.1 DK - Denmark 56 3,020 1.9 NL - Netherlands 182 14,487 1.3 LU - Luxembourg 8 985 0.8 (*) Annual average of the EU Cohesion Policy effort for EU25 is calculated on the 2004-2006 period Source: our processing on Eurostat and DG Regio data. This hierarchy mainly depends on the territorial concentration of EU Cohesion Policy but it is also affected by the national level of EfD, which is significantly affected by national investment and budgetary policy. This is evident in the different contributions in Greece and Portugal, for instance, or in Czech Republic, where limited Cohesion Policy support occurred with very high EfD.

104
3.2.3. Expenditure for development: a focus on its composition The exhibits below have been assembled on the basis of the work carried out in the national case studies concerning a number of countries which have been examined in some depth. They provide a level of detail far greater than that possible from more readily accessible statistics (e.g. from Eurostat). However, the figures need to be interpreted with care because of the heterogeneity in data quality (e.g. imperfect consolidation) and the differing degree of availability of data on the COFOG functions, which sometimes obliged the experts to reconstruct the COFOG sectors by re-combining national data organised on the basis of different functional classifications (e.g. Italian sectors which derive from specific accounts built up by the Treasury and the Ministry of Economic Development48). The definition of EfD is the starting point for compilation of data at the COFOG 2-digit level. In general the EfD calculated at 2-digit is closer than the previous estimation to the adopted definition, but as mentioned before it is applicable only to some countries and drawing upon different sources of data. In any case, the values calculated here are generally higher than the figures presented in the previous paragraph, because only the most pertinent sub-divisions are considered here in relation to certain COFOG categories (housing, health, recreation, education). On the contrary, the totals have been considered in the previous analysis since it was not possible to sub-divide them49. In each case the definition was adapted, when necessary, in order to make best use of the data available. These caveats make cross-country comparisons of the figures difficult, nevertheless, the detailed information on functional expenditure give an insight into: - the policy areas in which expenditure is most concentrated, which provides an indication of the
development strategy followed. - the role of the different administrative levels. - the relative importance of development expenditure as compared with other areas of government
spending. The subsequent step is to assess the importance of EU Cohesion Policy in relation to the different functions of the national EfD.
The composition of the national EfD in eight countries The EfD breakdown by functions and the share of the sub-national expenditure on the general government expenditure are presented in the next two exhibits. In Spain, within economic affairs which is the most important category, transport occupies a prominent position (almost 37% of total capital expenditure in the policy areas relevant for development). Housing and community (13%) and culture (8%) are the next most important. In general, the regional authorities in Spain have a dominant role (to confirm the results of the institutional analysis), this is true especially for housing and community amenities while as regards economic affairs, central and regional governments have roughly equal responsibility. In terms of overall expenditure, local government is as important as the centre, but particularly in recreation and culture. Capital expenditure is especially significant in manufacturing and construction, transport, agriculture, housing and water, representing over half of total public spending. 48 For more information see “Conti Pubblici Territoriali (CPT)”: http://www.dps.tesoro.it/cpt/cpt.asp 49 On the contrary in these calculation are included some of the capital expenditure for research and childcare (Cofog 10.4) which were not included before. These expenditures are not very relevant on the overall and do not reverse previous considerations.

105
Exhibit 36 - Expenditure for development by function (total expenditure for development=100)
Spain (2000-2006)
Italy (2000-2006)
Portugal (2000-2006)
Sweden (2001-2006)
Austria (2000-2006)
Czech Republic
(2000-2006)
Hungary (2001-2006)
Poland (2002-2006)
4.1 - General economic, commercial and labour affairs 4.4 0.6 1.3 1.4 9.4 0.6 2.6 0.3 4.2 - Agriculture, forestry, fishing and hunting 8.3 5.2 5.6 0.6 2.5 6.0 7.3 0.3 4.3 - Fuel and Energy 1.4 0.5 0.5 1.9 0.3 2.7 0.0 0.0 4.4 - Mining, manufacturing and construction 3.3 18.9 10.3 0.4 0.7 2.6 2.3 0.5 4.5 – Transport 36.7 25.1 41.0 47.9 32.0 48.7 28.7 43.9 4.6 – Communication 0.7 0.1 0.0 0.4 0.0 0.1 0.9 0.0 4.7 - Other industries 4.7 4.7 2.4 0.3 1.6 0.6 4.6 0.1 4 - Economic affairs 60.0 55.1 65.8 52.8 46.6 61.2 49.3 45.2 5.1 - Waste management 0.9 0.4 1.2 0.7 1.2 0.0 1.9 0.7 5.2 - Waste water management 2.0 3.2 4.3 0.0 12.7 0.0 6.7 9.6 5.3 - Pollution abatement 0.4 6.4 0.0 0.1 1.0 0.0 0.2 0.6 5.4 – Protection of biodiversity and landscape 1.7 0.0 2.3 0.0 0.2 0.0 0.2 0.0 5 - Environmental protection 5.8 10.1 9.1 0.9 15.9 0.0 10.0 11.4 6.1 - Housing development 3.9 0.0 0.0 5.4 7.4 10.1 0.6 7.3 6.2 - Community development 6.0 7.9 2.4 2.8 0.4 1.7 0.3 0.0 6.3 - Water supply 2.5 0.7 2.2 4.0 6.9 3.2 0.4 4.0 6.4 - Street lighting 0.4 0.0 0.0 0.0 0.5 0.5 0.1 0.6 6 - Housing and community amenities 12.9 8.6 4.6 12.3 15.2 15.5 4.7 12.1 7.2 – Outpatient services 3.8 0.0 0.0 4.9 0.0 0.0 0.3 1.9 7.3 - Hospital services 0.0 6.1 3.4 6.0 1.8 0.7 3.2 4.9 7.4 - Public health services 0.2 0.0 0.0 0.2 0.0 0.0 0.2 0.2 7 – Health 4.2 6.1 3.4 12.0 1.8 0.7 22.9 7.0 8.1 - Recreational and sporting services 2.7 0.0 7.2 3.9 2.6 5.4 1.7 3.8 8.2 - Cultural services 4.2 0.0 4.0 0.5 3.0 2.9 2.6 2.9 8 - Recreation, culture and religion 7.9 0.0 11.2 4.3 5.6 8.2 6.3 7.1 9.1 - Pre-primary and primary education 2.1 8.6 2.6 6.3 2.0 1.0 1.1 6.7 9.2 – Secondary education 1.5 0.0 1.3 3.3 2.6 7.4 1.2 2.6 9.3 - Post-secondary non-tertiary education 0.0 0.0 0.0 0.0 0.0 0.0 0.0 0.1 9.4 - Tertiary education 2.6 0.0 0.0 6.1 1.8 3.3 2.4 5.3 9.5 – Education not definable by level 0.0 6.1 0.5 1.0 7.6 2.2 0.4 0.2 9 – Education 7.4 14.8 4.4 17.3 13.9 13.9 6.4 15.2 10.4 - Social protection 0.0 1.9 0.3 0.2 0.1 0.4 0.2 0.3 R&D 1.8 3.5 1.2 0.2 0.8 0.0 0.3 1.8 TOTAL 100.0 100.0 100.0 100.0 100.0 100.0 100.0 100.0 Sources: basic data collected from national statistical offices. In the case of Italy, Portugal, Austria and Czech Republic, EfD has been estimated following quite accurately the definition presented at the beginning of the present chapter. In the case of Spain and Sweden, EfD has been estimated considering only capital expenditure in the sectors most relevant for development. In the case of Hungary, EfD has been estimated using GFCF and capital transfer while in the case of Poland only GFCF was used.
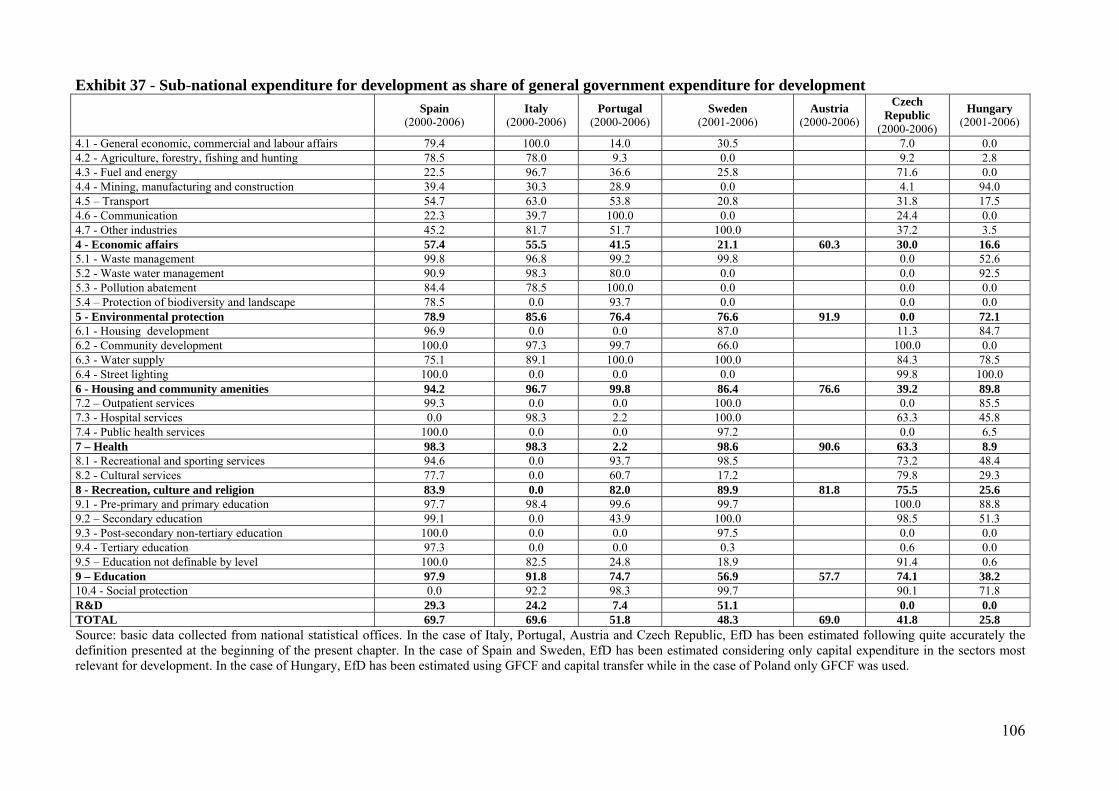
106
Exhibit 37 - Sub-national expenditure for development as share of general government expenditure for development
Spain (2000-2006)
Italy (2000-2006)
Portugal (2000-2006)
Sweden (2001-2006)
Austria (2000-2006)
Czech Republic
(2000-2006)
Hungary (2001-2006)
4.1 - General economic, commercial and labour affairs 79.4 100.0 14.0 30.5 7.0 0.0 4.2 - Agriculture, forestry, fishing and hunting 78.5 78.0 9.3 0.0 9.2 2.8 4.3 - Fuel and energy 22.5 96.7 36.6 25.8 71.6 0.0 4.4 - Mining, manufacturing and construction 39.4 30.3 28.9 0.0 4.1 94.0 4.5 – Transport 54.7 63.0 53.8 20.8 31.8 17.5 4.6 - Communication 22.3 39.7 100.0 0.0 24.4 0.0 4.7 - Other industries 45.2 81.7 51.7 100.0 37.2 3.5 4 - Economic affairs 57.4 55.5 41.5 21.1 60.3 30.0 16.6 5.1 - Waste management 99.8 96.8 99.2 99.8 0.0 52.6 5.2 - Waste water management 90.9 98.3 80.0 0.0 0.0 92.5 5.3 - Pollution abatement 84.4 78.5 100.0 0.0 0.0 0.0 5.4 – Protection of biodiversity and landscape 78.5 0.0 93.7 0.0 0.0 0.0 5 - Environmental protection 78.9 85.6 76.4 76.6 91.9 0.0 72.1 6.1 - Housing development 96.9 0.0 0.0 87.0 11.3 84.7 6.2 - Community development 100.0 97.3 99.7 66.0 100.0 0.0 6.3 - Water supply 75.1 89.1 100.0 100.0 84.3 78.5 6.4 - Street lighting 100.0 0.0 0.0 0.0 99.8 100.0 6 - Housing and community amenities 94.2 96.7 99.8 86.4 76.6 39.2 89.8 7.2 – Outpatient services 99.3 0.0 0.0 100.0 0.0 85.5 7.3 - Hospital services 0.0 98.3 2.2 100.0 63.3 45.8 7.4 - Public health services 100.0 0.0 0.0 97.2 0.0 6.5 7 – Health 98.3 98.3 2.2 98.6 90.6 63.3 8.9 8.1 - Recreational and sporting services 94.6 0.0 93.7 98.5 73.2 48.4 8.2 - Cultural services 77.7 0.0 60.7 17.2 79.8 29.3 8 - Recreation, culture and religion 83.9 0.0 82.0 89.9 81.8 75.5 25.6 9.1 - Pre-primary and primary education 97.7 98.4 99.6 99.7 100.0 88.8 9.2 – Secondary education 99.1 0.0 43.9 100.0 98.5 51.3 9.3 - Post-secondary non-tertiary education 100.0 0.0 0.0 97.5 0.0 0.0 9.4 - Tertiary education 97.3 0.0 0.0 0.3 0.6 0.0 9.5 – Education not definable by level 100.0 82.5 24.8 18.9 91.4 0.6 9 – Education 97.9 91.8 74.7 56.9 57.7 74.1 38.2 10.4 - Social protection 0.0 92.2 98.3 99.7 90.1 71.8 R&D 29.3 24.2 7.4 51.1 0.0 0.0 TOTAL 69.7 69.6 51.8 48.3 69.0 41.8 25.8 Source: basic data collected from national statistical offices. In the case of Italy, Portugal, Austria and Czech Republic, EfD has been estimated following quite accurately the definition presented at the beginning of the present chapter. In the case of Spain and Sweden, EfD has been estimated considering only capital expenditure in the sectors most relevant for development. In the case of Hungary, EfD has been estimated using GFCF and capital transfer while in the case of Poland only GFCF was used.

107
In Italy, mining, manufacturing and construction, together with transport, account for most of expenditure on economic affairs. Other important areas are education, housing and community, and environmental protection. Expenditure is largest at the sub-national level, which includes regions, provinces and municipalities. The only areas where the central government is still responsible for most spending are mining, manufacturing and construction and R&D. In Austria, the share of development expenditure on economic affairs is also relatively large, with transport occupying a prominent position. Other important areas are environmental protection, housing and education, the share spent on the environment being larger than in other countries. Overall, local governments play the most important role in development expenditure, though the central government is important in some areas such as economic affairs and education. In Sweden, economic affairs (in particular transport) accounts for almost half of total capital expenditure, followed by education, housing and health. Overall, central and sub-national governments have similar shares. At the local level, the municipalities have a relatively important role. While central government ‘dominates’ economic affairs, local authorities are far more important in health, housing, recreation and culture, as well as environmental protection. In Portugal, apart from transport which accounts for over 40% of total expenditure for development, there is less concentration of spending than in the other countries. The remaining share of expenditure is spread quite evenly across areas, the largest shares going to culture (11%), mining, manufacturing and construction (10%), and environmental protection (9%). Overall the expenditure carried out by central government and the sub-national authorities is similar in size, with the former having the largest share of spending on health and economic affairs, the latter on housing and community, environmental protection and culture. In Hungary, transport and health represent the most important functions on which development expenditure is concentrated (29% and 23% respectively), followed by environmental protection (10%). The remainder of spending is spread across the other areas relatively evenly. Sub-national governments account for around a fourth of the total (near 18% in the case of transport and 9% in the case of health) but for the largest share of expenditure on water waste management, housing development and primary education. In the Czech Republic, transport again accounts for the largest share of development expenditure (54% of the total), followed by environmental protection, housing and education. Overall, the expenditure of sub-national authorities amounts to less than half of general government spending in these areas, but they account for the largest share of spending on health, culture and education. Polish data are very limited and have been estimated only for general government as a whole. They indicate that transport accounts for the largest share of development expenditure (over 43% of the total), followed by education (15%), housing (12%) and the environment (11%), especially waste water management. The overall results of this analysis can be summarised as follows: - In all the cases examined, expenditure for development (or capital expenditure in the most
relevant policy areas) is concentrated on economic affairs, which accounts for approximately half of the total. Within this, transport, mining, manufacturing and construction are by far the most important areas of spending. The remaining part of development expenditure is either spread across many different areas (e.g. in the case of Portugal) or concentrated on relatively

108
fewer of them (housing in Spain, environmental protection and housing in Austria, education, housing and health in Sweden).
- The role of the different administrative levels in development, as reflected in the expenditure
figures for the period 2000-2006 mirror by and large the above analysis: o The importance of the regional level is evident in regionalised States. Overall, sub-
national expenditure for development is close to 70% of general government expenditure in the same areas. A similar situation can be found in Austria where sub-national expenditure (the federal states and local authorities) is slightly less than 70% of overall general government spending.
o There is a balance between central and local government expenditure in EU15 unitary states, with less spending at intermediate level (e.g. regions, counties) and more spending by municipalities. In these cases, the areas covered by economic affairs are mainly the responsibility of the central government while policy areas such as culture, housing and the environment are mostly the responsibility of local authorities.
o In the EU 12 unitary states covered, the sub-national administrations are responsible for a smaller share of general government expenditure (e.g. 26% in Hungary and 42% in the Czech Republic) even though the analysis of the formal distribution of competences indicated for this group a stronger devolution towards the local level.
The EU sectoral contribution to EfD A final result concerns the EU Cohesion Policy contribution to EfD in relation to the different functions (see next exhibit). The concentration of the EU contribution varies among countries, but the functions in which it is largest are, in general: mining, manufacturing and construction, R&D and environmental protection. Other functions receive significant support from the EU in certain countries: for instance, agriculture and energy in Portugal and Italy, energy in Hungary, health in Portugal and Czech republic, family and children in Austria and R&D in Sweden. Despite differences in the scale depending on the different EU funding per country, EU Cohesion Policy in these areas appears to be important in increasing national investment.

109
Exhibit 38 - EU Cohesion Policy funding as % of EfD (annual average)
Spain (2000-2006)
Italy (2000-2006)
Portugal (2000-2006)
Sweden (2001-2006)
Austria (2000-2006)
Czech Republic
(2000-2006)
Hungary (2001-2006)
4.2 - Agriculture, forestry, fishing and hunting 33.0 23.2 150.8 96.5 13.2 21.0 23.0 4.3 - Fuel and energy 7.9 21.3 256.1 1.0 16.1 5.8 697.5 4.4 - Mining, manufacturing and construction 58.2 9.7 71.2 223.5 164.6 62.8 58.9 4.5 – Transport 18.0 5.7 37.6 0.4 0.3 11.3 21.1 4 - Economic affairs 20.6 13.2 58.8 4.2 6.5 18.4 22.9 5 - Environmental protection 101.0 10.5 102.8 1.7 0.4 n.a. 56.8 6 - Housing and communities amenities 4.1 6.4 94.4 0.7 0.6 6.4 14.6 7.4 - Public Health Services 17.0 2.1 170.7 0.2 0.4 87.2 25.3 8.2 - Cultural services 4.5 11.6 0.0 0.1 0.0 0.0 9.5 - Education (training) 0.4 11.6 8.7 0.3 3.4 11.3 0.6 10.4 - Family and children 15.4 8.3 3.2 209.8 43.7 2.3 11. R&D 68.1 12.6 181.4 183.8 40.2 57.4 207.2 Total (*) 20.9 11.6 61.2 2.7 4.2 19.4 23.5 (*) Totals are not equal to totals of exhibits presented in chapter 4 since aggregates of EfD differ slightly, as mentioned in the text. No differences concern Cohesion Policy values, with the exception of ITALY, Spain and Czech Republic where ESF is included due to the fact that EfD has been estimated considering also current expenditure for training.
110
3.3. FINAL CONSIDERATIONS ON CHAPTER 3 This section has analysed the expenditure for development in the Member States of the EU; an aggregate of public expenditure which embraces the eligible expenditure under EU Cohesion Policy and is directly comparable with it. The competences in expenditure for development are in line with the more general competences for public expenditure. More decentralised countries assign more responsibility to regional and local authorities. This result is to be expected, but there are many less obvious features: - Federal and regionalised states do not show major differences in the distribution of
competences. Clearly, competences, allocation of funds and related policy decision-making processes have not the same legal status in the two types of country but the basic “division of labour” between central states and decentralised administrations is not so different in development policy;
- Similar observations can be made for States with northern systems, where not only local administrations, but also intermediate levels of administration are tending to increase their role in development policy;
- In unitary States very different national models of competence distribution coexist; in the EU12 significant devolution is also evident (in some cases going further than in EU15 centralised States). In centralised countries, in general, local administrations have a significant role in all, or many, policy areas included in EfD;
- In many cases and in all the types of country, competences are shared between different administrative levels, and, even if our analysis has not detailed every policy area and the specific role of each administrative level, it implies that in many policy areas for development, co-decision or coordination between different administrative levels is necessary;
- Decentralised governments have generally more power in competences linked to territorial management (the environment, urban policy, culture, etc.) and in some important public services (housing, social services, public utilities, etc.). The central level has more power in infrastructure (energy, transport, etc.) and national standardised services (education, public safety) or in policy which is not territorialised (R&D).
Notwithstanding the previously mentioned data problems, this section provided interesting information on the value of the EfD at EU level, its composition according to the main functions of public expenditure and some estimations of the EU contribution to EfD in the different countries. Main findings include: - According to very approximate estimation, EfD in EU27 amounted to EUR 645 per capita in the
period 2002-2007, or to 2.9% of GDP and 14.4% of overall gross fixed capital formation; - There were significant differences in EfD in recent years between EU countries either in PPP
per capita or as a % of GDP. In general, cohesion countries had a high level of EfD, in large part thanks to EU Cohesion Policy, even if per capita expenditure is still lower than in the more advanced countries.
- At EU level, decentralised governments undertake 65% of total EfD (but data are not consolidated); in 14 countries this proportion is higher than 50%, in seven countries it is between 30 and 50%, and in the remaining 5 countries it is lower than 30% (Malta is excluded). The role of decentralised governments is of major importance.
- Over the period 2000-2007, EfD is estimated to have increased in real terms by more than GDP, the main growth elements being central government and ‘economic affairs’;
- ‘Economic affairs’ is also the major element in EfD and involves around 50% of total expenditure (this function includes enterprise environment support, transport,

111
telecommunications and other relevant policy fields). The remaining 50% is shared between environmental protection, housing and community amenities, health, recreation & culture, education. Economic affairs and health are the least decentralised policy areas, 52% and 38% of their total expenditure, respectively, being decentralised.
- EU Cohesion Policy accounted for 11% of total EfD in the EU27. In the cohesion countries it is more important (up to 82% of overall EfD), but it also significant in other countries: 7% of the total in Italy, 5% in Germany and 4% in UK. Only in 5 countries is contribution less than 3% of EfD (Austria, Belgium, Denmark, the Netherlands and Luxembourg).
- In the seven countries examined in detail, the EU contribution is generally more important in the enterprise environment, R&D and environmental protection.

112
CHAPTER 4. TERRITORIAL DISTRIBUTION OF COMPETENCES 4.1. INTRODUCTION This chapter analyses the distribution of expenditure for development (EfD) by administrative level and by region. The analysis is carried out for ten countries where territorial data are available50. The availability of regional information is summarised in the following exhibit. Exhibit 39 - Availability of territorial data in the countries covered in case studies
Country Main variables Government levels Years Austria Capital Expenditure and EfD All (Central, State Local) 1995-2008 Germany Public Investment State 1995-2008 Spain Capital expenditure, public investments State (CCAA) and Local 1998-2006
Italy Capital expenditure, Public investments, EfD All (Central, Local and also Public sector) 1996-2006
France Public investment and capital transfer Local 2005 The United Kingdom
Gross capital expenditure, capital expenditure, EfD All (Central, Local) 2002-2009
Sweden Gross fixed formation All (Central, Local) 1995-2006 Portugal Planned Public Investments Central 2002-2006 Poland Capital expenditure and investments All (Central, Local) 1999-2005 Hungary Investments and capital expenditure Local 2000, 2005 The differences in data and methods adopted in the country analyses makes it difficult to analyse the results together and so each country is considered individually below. The main aims of the territorial analysis are to: - identify the importance of national Expenditure for Development (EfD) carried out by different
levels of government in each region; - assess whether EfD at the different government levels is in line with equity and cohesion
objectives; - Assess the role of the EU Cohesion Policy in supporting EfD in Objective 1 and 2 regions. Simple indicators (EfD as % of GDP and per capita) have been used to examine the data according to the above aims; in the synthesis a simple econometric analysis examines the relationship between EfD at different administrative levels and economic performance. Monitoring data do not provide information on EU Cohesion Policy expenditure by regions; hence, estimates have been produced on the basis of: - The study “ERDF and CF Regional Expenditure” (Sweco, 2008) carried out for Dg Regio. This
study regionalises ERDF and Cohesion Fund committed resources; in the present study total allocated funds (rather than commitments or disbursements) have been used in order to consider the entirety of resources devoted to the MS51. For this reason, the regional shares calculated in the SWECO study on the basis of commitments have been applied to the total allocated resources to estimate total EU Cohesion Policy support by region in the period 2000-2006. These coefficients have been also used to carry out a regional breakdown of EAGGF and FIFG allocated resources, for which here is no other source of regional expenditure available;
50 All countries of the sample apart from Czech Republic. 51 At the moment, de-commitments of initial allocations to MS are very poor.

113
- Regional population shares have been used to regionalise ESF in relation to Objective 1 and Objective 3 programmes.
These regional estimates of EU Cohesion Policy support are then compared with public expenditure for development. The DG Regio Fields of Interventions (FOI) have been used to carry out a comparison between EU Cohesion Policy support geared towards different sectors and functional breakdown of EfD data according to COFOG. All such estimates are characterised by some degree of approximation, due to the fact that the FOI and COFOG classifications are not methodologically coherent; however, the results are sufficiently robust for an initial assessment of the EU Cohesion Policy support to regional public investments.

114
4.2. MAIN RESULTS FROM THE COUNTRY STUDIES 4.2.1. Austria Investment indicators are estimated below for each of the 9 NUTS 2 regions in Austria, based on the methodology set out in the country report. 4.2.1.1. Total public investment in Austrian regions Total capital expenditure is calculated for COFOG functions 01 to 10 which includes gross fixed capital formation and capital transfer to the private sector. This amounts for around EUR 8 to 9 billion annually (EUR 1,154 per capita in 2007) or EUR 59.9 billion EUR over the period 2000-2006 in the country as a whole. Exhibit 40 - Austria - Total capital expenditure relative to GDP by NUTS 2 regions , general government Total capital expenditure
Annual average at current price(EUR million)
Average annual growth rate at constant price
(%)
Relative to GDP
(annual average; %) 1995-99 2000-06 1996-99 2000-08 1995-99 2000-06 ÖSTERREICH 8177 8550 -1.4 0.1 4.4 3.8 Burgenland 215 232 -6.2 1.7 5.2 4.5 Niederösterreich 1402 1323 -4.1 -0.2 4.9 3.8 Vienna 1656 1920 -5.1 7.3 3.2 3.1 Kärnten 471 607 1.1 1.8 4.3 4.7 Steiermark 1345 1119 3.2 -2.5 5.7 4.0 Oberösterreich 1284 1533 0.7 -2.2 4.2 4.1 Salzburg 529 549 -0.6 4.7 3.9 3.3 Tirol 872 863 2.3 -2.2 5.6 4.4 Vorarlberg 402 406 -1.3 -1.0 4.8 3.9 Total obj.1 215 232 -6.2 1.7 5.2 4.5 Total rest of country 7961 8319 -1.2 0.1 4.3 3.7
Note: real growth rate is calculated as variation at current price less variation in price index. Source: Eurostat (2009); Statistics Austria (2009); ISMERI (EfD-definition, 2009); own calculations (Aug. 2009). Data for the period 1995 to 2008 reveal a mixed picture at regional level: - At national level capital expenditure in real terms declined in the 1996-99 period (-1.4% per
year on average) and was virtually unchanged in the 2000-08 period. Over the total period, there was an annual average decline (-0.4% a year);
- in both periods, capital expenditure increased in Kärnten as well as in Salzburg und Wien, in the 2000-2006 period. In contrast, total capital expenditure declined in Niederösterreich and Vorarlberg in both periods and declined or remained unchanged in the other federal states;
- in general capital expenditure shows a large difference between the two periods. Total capital expenditure amounted on average to around 4% of GDP, though figure declined or remained unchanged over the period 1995 to 2008. The level was large in the Objective 1 region of Burgenland at 5% of GDP (2006), though this had fallen since 1995. The capital city, Vienna, (a NUTS 2 region) has a particularly small level (3%).

115
To sum it up: capital investment fell slightly in real terms. It was larger in Burgenland than in Objective 2 regions but tended to decline as in most regions. Investment increased in only three regions over the period (Kärnten, Salzburg und Wien). Capital expenditure per capita is highest in the strongest regions. Exhibit 41 - Austria - Total capital expenditure relative to GDP by NUTS2-region, general government
Capital expenditure per capita (AT=100; average in the period)
GDP per capita (AT=100 average in the period)
1995-1999 2000-08 1995-99 2000-06 ÖSTERREICH 100.0 100.0 100.0 100.0 Burgenland 75.6 78.5 63.5 66.5 Niederösterreich 89.5 80.5 80.4 80.8 Vienna 104.6 119.5 143.4 139.1 Kärnten 81.7 103.3 83.3 83.3 Steiermark 110.8 88.7 84.4 85.1 Oberösterreich 91.8 99.0 94.6 96.2 Salzburg 101.0 105.7 113.5 111.3 Tirol 129.1 118.1 100.8 102.7 Vorarlberg 113.6 105.8 102.5 103.8 Total obj.1 75.6 78.5 63.4 66.6 Total rest of country 100.9 100.8 101.3 101.2 Source: Eurostat (2009); Statistics Austria (2009); ISMERI (EfD-definition, 2009); own calculations (Aug. 2009). In the following exhibit capital expenditure in the 2000-2006 period is presented by function and region; estimations at the COFOG 2-digit level are only indicative and should be treated with caution (next exhibit). In Vienna, capital expenditure is concentrated on general public services and economic affairs, which are also the main functions at national level. Kärnten and Tirol have the largest shares of expenditure in environmental protection; while Tirol, Steiermark and Vorarlberg devotes around 25% of expenditure to housing and community amenities. Capital expenditure in health and education is relatively large in Salzburg, while the share of expenditure going to R&D is particularly significant in Burgenland (obj.1), Salzburg and Tirol. The share of capital expenditure on transport was relatively large in Vienna (38% of the total) and small in Tirol (18%), while the share accounted for by water supply was large in Vorarlberg and Steiermark. In comparison with Objective 2 regions, capital expenditure in Burgenland is concentrated on Economic affairs and, in particular, on supporting business sector (4.1) and agriculture, fishing and forestry (4.2).

116
Exhibit 42 - Austria - Total capital expenditure by region and function, Total general government, 2000-2006 (% on total) Capital expenditure general gov. sum 2000-06 (% on tot.)
Burgenland
Niederösterreich Vienna Kärnten Steierma
rk Oberösterreich Salzburg Tirol Vorarlb
erg Obj.-1 Obj.2 Total AT
1 - General public services 9.4 10.1 35.7 11.6 11.0 9.8 8.5 11.3 8.3 9.4 16.1 15.9 1.4 Basic research 0.4 0.4 0.1 0.3 0.4 0.3 0.3 0.5 0.2 0.4 0.3 0.3 4 - Economic affairs 48.3 37.9 52.0 36.5 29.7 40.3 28.4 28.7 33.0 48.3 38.6 38.8 4.1 General economic, commercial and labour affairs 10.4 5.9 12.6 6.4 5.1 8.1 5.5 5.0 5.3 10.4 7.6 7.7 4.2 Agriculture, forestry, fishing, hunting 9.6 2.4 0.5 3.5 2.3 1.9 1.8 1.7 2.9 9.6 1.9 2.1 4.3 Fuel and energy 0.3 0.4 0.0 0.7 0.2 0.2 0.2 0.3 0.5 0.3 0.2 0.3 4.4 Mining, manufacturing and construction 0.7 0.4 1.1 0.4 0.2 0.6 0.4 0.4 0.4 0.7 0.6 0.6 4.5 Transport 29.5 26.7 37.5 22.7 19.1 26.7 19.0 17.9 19.5 29.5 26.1 26.2 4.6 Communication 0.1 0.0 0.0 0.0 0.0 0.0 0.0 0.0 0.1 0.1 0.0 0.0 4.7 Other industries 1.7 1.5 0.4 1.8 1.6 1.4 1.0 1.5 2.5 1.7 1.3 1.3 4.8 R&D Economic affairs 0.7 0.4 0.9 0.5 0.3 0.6 0.4 0.3 0.4 0.7 0.5 0.5 5 - Environmental protection 12.4 15.8 5.8 22.9 15.3 13.0 11.8 17.6 9.5 12.4 13.0 13.0 5.5 R&D Environmental protection 0.0 0.0 0.0 0.0 0.0 0.0 0.0 0.0 0.0 0.0 0.0 0.0 6 - Housing and community amenities 9.9 14.4 1.7 10.9 26.8 9.3 5.5 20.3 26.2 9.9 12.5 12.5 6.1 Housing development 4.4 8.2 0.0 4.3 14.6 3.5 2.1 10.7 12.8 4.4 6.1 6.0 6.2 Community development 0.1 0.6 0.0 0.3 0.6 0.4 0.2 0.4 0.6 0.1 0.4 0.4 6.3 Water supply 7.0 3.6 0.9 8.7 10.6 6.0 4.4 8.2 10.8 7.0 5.6 5.7 6.4 Street lighting 0.9 0.5 0.3 0.3 0.5 0.4 0.3 0.4 0.5 0.9 0.4 0.4 6.5 R&D Housing, community amenities 0.0 0.0 0.0 0.0 0.0 0.0 0.0 0.0 0.0 0.0 0.0 0.0 7. Health 7.7 7.9 0.0 3.4 2.1 6.0 21.3 4.4 8.3 7.7 5.2 5.2 7.3 Hospital Services 7.0 5.9 0.0 3.2 2.0 5.7 18.8 3.1 7.1 7.0 4.4 4.5 7.5 R&D Health 0.1 0.1 0.0 0.0 0.1 0.0 0.5 0.3 0.1 0.1 0.1 0.1 8 - Recreation, culture and religion 3.2 3.7 2.2 5.8 7.0 6.6 6.8 6.2 5.2 3.2 5.0 5.0 8.1 Recreational and sporting services 1.5 1.6 0.7 3.4 2.9 2.6 3.0 2.8 3.1 1.5 2.2 2.2 8.2 Cultural services 1.5 1.8 1.8 2.6 3.2 3.4 3.0 2.7 1.6 1.5 2.5 2.5 8.5 R&D Recreation, culture and religion 0.0 0.0 0.0 0.0 0.0 0.0 0.0 0.0 0.0 0.0 0.0 0.0 9 – Education 8.6 6.6 0.9 7.8 6.7 11.2 14.7 10.8 8.2 8.6 7.3 7.3 9.1 Pre-primary and primary education 2.5 2.3 0.2 2.3 1.9 3.0 3.0 2.7 2.1 2.5 2.0 2.0 9.2 Secondary education 3.0 1.4 0.6 1.7 1.9 3.7 6.6 3.5 3.2 3.0 2.3 2.4 9.3 Post-secondary non-tertiary education 0.0 0.0 0.1 0.0 0.0 0.0 0.0 0.0 0.1 0.0 0.0 0.0 9.4 Tertiary education 0.4 2.7 0.6 3.1 3.5 3.9 1.2 2.7 2.0 0.4 2.4 2.4 9.5 Education not definable by level (training) 0.4 0.3 0.0 0.4 0.3 0.6 0.8 0.5 0.4 0.4 0.4 0.4 9.7 R&D Education 0.0 0.0 0.0 0.0 0.0 0.0 0.0 0.0 0.0 0.0 0.0 0.0 10 - Social protection 0.6 3.7 1.6 1.1 1.4 3.8 3.0 0.7 1.2 0.6 2.3 2.2 10.4 Family and children 0.0 0.2 0.1 0.0 0.1 0.2 0.1 0.0 0.1 0.0 0.1 0.1 Total 100.0 100.0 100.0 100.0 100.0 100.0 100.0 100.0 100.0 100.0 100.0 100.0 Tot.R&D 1.2 0.9 1.0 0.8 0.8 1.0 1.2 1.2 0.7 0.9 0.7 1.0 Note: COFOG level 2 figures serve for illustration purpose only und are not fully consistent with COFOG level 1 sums. Source: Eurostat (2009); Statistics Austria (2009); ISMERI (EfD-definition, 2009); own calculations (Aug. 2009).

117
4.2.1.2. Expenditure for development in Austrian regions The concern here is with the public investment on development (expenditure for development – EfD) in each region and the responsibility of each administrative level in this regard. Investment for development accounted for around EUR 6.4 to EUR 7.7billion a year in Austria (EUR 918 per capita in 2007). For the period 2000-2006, development expenditure amounted to around EUR 49.3 billion. Exhibit 43 - Austria - Expenditure for development by region, general government, 2000-2008
Total expenditure for development
(annual average, current prices, EUR
million)
Share of total public expenditure
(%)
Share of total public capital expenditure
(%)
1995-99 2000-08 1995-99 2000-08 1995-99 2000-08 ÖSTERREICH 6,655 7,040 9.2 8.6 81.4 82.3 Burgenland 198 207 9.8 8.4 92.0 89.4 Niederösterreich 1,212 1,195 10.1 8.1 86.3 90.2 Vienna 958 1254 5.1 7.0 57.8 63.7 Kärnten 424 536 8.3 9.7 89.9 88.5 Steiermark 1,183 1,028 11.8 8.4 88.0 92.2 Oberösterreich 1,102 1,291 9.9 9.9 85.8 84.6 Salzburg 443 392 9.3 7.7 83.9 73.0 Tirol 780 766 14.0 11.4 89.3 89.1 Vorarlberg 356 371 11.9 11.0 88.4 91.5 Total obj.1 198 207 9.8 8.4 92.0 89.4 Total rest of country 6456 6833 9.2 8.6 81.1 82.1 Source: Eurostat (2009); Statistics Austria (2009); ISMERI (EfD-definition, 2009); own calculations (Aug. 2009). Expenditure for development amounts to around 9-10% of total public expenditure, and 82% of total public capital expenditure (see exhibit above). In Vienna, these percentages are lower because of the high concentration of public administration (and the expenditure on this) otherwise the proportions are similar across regions. The share of investments is particularly large in Tirol and Vorarlberg in both periods. In the period 2000-2008, a growth of development expenditures in real terms took place only in two Austrian regions (Kärnten und Wien). In all other 7 regions, development investments have decreased or stagnated. Also in relation to GDP, the weight of the expenditure for development decreased in all regions, with the only exceptions of Vienna and Kärnten. The regions where it was higher are: the objective 1 region of Burgenland, Niederösterreich, Tirol, Vorarlberg and Kärnten.

118
Exhibit 44 - Austria - Expenditure for development in regions: trends and relevance
EfD average annual growth rate at constant price
(%)
EfD on GDP (annual average, %)
EfD per capita (AT=100; average)
1995-99 2000-08 1995-99 2000-06 1995-1999 2000-08 ÖSTERREICH -1.3 -0.2 3.6 3.1 100.0 100.0 Burgenland -5.8 0.3 4.8 4.0 85.4 84.4 Niederösterreich -4.3 0.3 4.2 3.4 95.0 88.9 Vienna -6.6 12.1 1.8 2.0 74.4 95.9 Kärnten 1.9 1.1 3.9 4.1 90.3 111.2 Steiermark 3.5 -2.6 5.0 3.7 119.8 99.9 Oberösterreich 0.5 -2.6 3.6 3.5 96.8 102.0 Salzburg -2.2 0.1 3.3 2.4 104.0 87.6 Tirol 2.7 -3.3 5.0 3.9 141.7 127.2 Vorarlberg -1.3 -0.8 4.3 3.6 123.5 118.3 Total obj.1 -5.8 0.3 4.8 4.0 85.4 84.4 Total rest of country -1.1 -0.2 3.5 3.1 100.5 100.5 Note: real growth rate is calculated as variation at current price less variation in price index. Source: Eurostat (2009); Statistics Austria (2009); ISMERI (EfD-definition, 2009); own calculations (Aug. 2009). The distribution of per capita EfD indicates its relatively low potential for reducing regional differences, since investment per capita is lower than the national average in Burgenland and the other low income Eastern regions. In terms of administrative levels, the data indicate that the local level is responsible for around 50% of total development investment, the central level for 30% and the Länder for 20%. Differences between regions are not large, with the exception of Vienna, which has no Länder expenditure, and Vorarlberg, where the Länder expenditure is higher than elsewhere (32%). Exhibit 45 - Austria - Total public expenditure for development (EfD) by administrative level, 2000-2008
Composition by adm. level
(% on total)
Annual average growth rate (%)
EfD per head (average of the period, AT=100)
Central level
State level
Local level
Central level
State level
Local level TOTAL Central
level State level
Local level TOTAL
ÖSTERREICH 32.7 20.2 47.2 8.0 -0.8 -2.2 -0.2 100 100 100 100 Burgenland 32.4 27.9 39.6 2.9 0.4 2.3 0.2 86 115 71 84 Niederösterreich 27.6 20.7 51.7 10.2 7.5 -2.5 0.3 75 92 98 89 Vienna 47.3 0 52.7 33.7 0 4.4 12.1 133 0 109 96 Kärnten 26.9 27.0 46.1 5.8 2.1 0.6 1.1 94 149 108 111 Steiermark 27.0 26.2 46.7 2.0 -4.0 -3.2 -2.6 86 129 98 100 Oberösterreich 31.6 26.8 41.6 2.3 -3.9 -1.9 -2.6 101 134 89 102 Salzburg 33.7 25.8 40.4 6.5 3.0 -3.7 0.1 91 112 75 88 Tirol 29.4 20.6 50.0 2.6 -2.2 -5.7 -3.3 117 130 134 127 Vorarlberg 28.3 32.6 39.1 3.4 3.8 -5.1 -0.8 105 192 98 118 Total obj.1 32.4 27.9 39.6 2.9 0.4 2.3 0.2 86 115 71 84 Total rest of country 32.7 19.9 47.4 8.2 -0.8 -2.3 -0.2 101 99 101 101 Note: Central level: central government (S.1311), social security funds (S.1314) and AWS (S12); State level: state government (S.131) and ecoplus (S.11); Local level: local government (S.1313) and quasi-corporations (S11). Source: Eurostat (2009); Statistics Austria (2009); ISMERI (EfD-definition, 2009); own calculations (Aug. 2009). In the period 2000-2008, development investment in real terms declined, particularly at the local level (-2,2% a year on average) and at the state level (-0,8% a year), while investment at the central level has increased (+8%). The sub-national level, therefore, became less important

119
over the period. In Vienna the most significant increase in investment came from the central government and, to a more limited extent, the local level; In Niederösterreich and Salzburg both central and state investment increased, as it did in Burgenland, but to a lesser extent. Reductions in EfD were widespread, especially in Tirol and Vorarlberg. As mentioned before, EfD has an overall limited cohesion effect and only expenditure per capita at federal level shows a more significant convergence effects, but its regional distribution is affected by the absence of Vienna. Expenditure for development at local level has the minor convergence effects. The distribution of the expenditure for development by function is concentrated for almost half of the total in economic affairs, which includes support to enterprises and transport infrastructures. Environmental protection, housing and education represent around 15% of the total each. Exhibit 46 - Austria- Total public expenditure for development by function, Total General Government, (% of total)
Burgenland
Niederösterreich
Vienna
Kärnten
Steiermark
Oberösterreich
Salzburg Tirol
Vorarlber
g
Obj.-1
Obj.-2
Total AT
1 - General public services 0.4 0.5 0.5 0.3 0.4 0.4 0.4 0.3 0.4 0.4 0.4 0.4 4 - Economic affairs 53.9 41.8 79.2 41.2 32.2 47.7 39.6 32.2 36.0 53.9 46.8 47.0 5 - Environmental protection 13.9 17.5 8.9 26.0 16.6 15.5 16.5 19.9 10.4 13.9 15.9 15.8 6 - Housing and comm. amenities 11.1 15.9 2.7 12.4 29.2 11.0 7.7 22.9 28.7 11.1 15.3 15.2 7. Health 0.3 6.0 0.0 0.2 0.1 0.7 3.2 3.2 4.2 0.3 2.0 1.9 8 - Recreation, culture and religion 3.4 3.9 3.1 6.1 7.2 7.3 8.9 6.5 5.3 3.4 5.7 5.7
9 – Education 17.0 14.3 5.6 13.8 14.2 17.4 23.7 15.1 15.0 17.0 13.9 14.0 10 - Social protection 0.0 0.0 0.2 0.0 0.1 0.1 0.0 0.0 0.0 0.0 0.1 0.1
Total 100.0 100.0 100.
0 100.
0 100.
0 100.0 100.0
100.0
100.0
100.0
100.0
100.0
Tot.R&D 1.4 1.0 1.6 0.9 0.9 1.2 1.7 1.3 0.8 1.0 0.8 1.2 Note: R&D derives from a 2-digit COGFOG estimation and sums up R&D within the different functions. Source: Eurostat (2009); Statistics Austria (2009); ISMERI (EfD-definition, 2009); own calculations (Aug. 2009). The regional distribution of expenditure by function highlights some important differences: Vienna allocates 80% of expenditure to economic affairs, Kärnten spends 27% of its resources on environmental protection, Steiermark and Tirol almost 30% in housing and Burgenland invests more in economic affairs. 4.2.1.3. EU Cohesion Policy support to development in the Austrian regions The following exhibit presents the ratio between EU Cohesion Policy funds and EfD by regions and COFOG. In objective 1 the contribution of Cohesion Policy reached the 20% of the total EfD in the 2000-2006, while in objective 2 regions it varied between 2.3% and 4.6%

120
Exhibit 47 - Comparison between EU Cohesion Policy funds and expenditure for development in Austria (%; 2000-2006)
Burgen-land
Nieder-österreic
h Vienna Kärnte
n Steierm
ark
Ober-österreic
h
Salzburg Tirol Vorarlb
erg Obj.-1 Obj.-2 Total AT
4.1 - General economic and labour affairs 28.2 11.3 3.9 8.3 12.0 6.4 10.5 9.3 9.2 28.2 7.2 7.9 4.2 - Agriculture, forestry, fishing 2.3 5.1 51.8 11.3 2.1 6.3 26.6 34.5 2.6 2.3 12.7 11.5 4.3 - Fuel and energy 92.9 11.5 0.5 20.8 5.2 21.9 30.6 6.2 92.9 11.9 14.3 4.4 - Mining, manufacturing and construction 1,210.9 246.1 14.0 417.3 607.2 106.4 50.6 67.4 74.5 1,210.9 121.2 152.5
4.5 - Transport 0.3 0.3 0.2 0.1 0.2 0.0 0.2 0.2 0.0 0.3 0.2 0.2 4.6 - Communication 416.2 43.5 0.0 188.3 192.8 269.2 93.0 144.0 14.8 416.2 167.7 180.1 4.7 - Other industries (tourism) 204.8 52.9 8.5 24.7 12.0 15.3 28.5 16.3 13.8 204.8 22.7 28.4 4 - Economic affairs 29.5 7.4 2.1 8.8 8.5 4.1 5.9 6.5 4.0 29.5 5.0 5.9 5 - Environmental protection 2.1 0.0 0.2 0.0 1.6 0.2 0.0 0.3 0.1 2.1 0.4 0.4 6&8 - Housing and Recreation 0.2 0.3 2.7 0.1 0.1 0.1 0.0 0.5 0.1 0.2 0.3 0.3 7. Health 0.4 0.0 0.0 0.4 0.5 3.4 0.0 0.0 0.2 0.4 0.3 0.3 9 – Education 17.3 4.7 12.1 4.0 4.1 3.1 2.9 3.2 3.6 17.3 4.3 4.8 11. RTDI 110.2 39.0 14.1 46.2 121.7 46.3 15.8 14.5 35.8 110.2 38.7 41.1 TOTAL 20.3 4.2 2.8 4.5 4.6 3.1 3.2 2.9 2.3 20.3 3.5 4.0 Note: Numerator: total EU Cohesion Policy funds; Denominator: EfD Source: Statistics Austria (2009); DG REGIO data.

121
In Austria, EU Cohesion Policy has been particularly important for economic affairs, especially mining, manufacturing and construction as well as communication where its contribution sometimes seems higher than the national expenditure to indicate a strong concentration52. Also the contribution to RTDI policy is relevant in all the regions. 4.2.2. Germany
4.2.2.1. Financial equalization scheme in Germany Before examining expenditure data, it is interesting to consider the German financial equalisation scheme, which provides the necessary funds to each local (municipal financial equalisation) and state government (financial equalisation scheme between the Federal Government and the Länder) for the accomplishment of assigned tasks. The scheme is divided into a “vertical” and an “horizontal” part. Both systems are defined by the Maßstäbegesetz (“Benchmark-law”) and the Finanzausgleichgesetz (financial equalisation law). The former is a long-term law which describes the requirements under constitutional law. The latter specifies the concrete method of calculation of the financial equalisation. Both laws have been in operation since 2005. a) Financial equalisation between the Federal Government and the Federal States (“vertikaler Finanzausgleich”); features: - Taxes which are due to the Federal States and to the Federal Government
(“Steuerverbund”) are allocated between the administrative levels according to the tax revenue and partially redistributed.
- Additional payments from the Federal Government to financially weak Federal States are granted to those Federal States whose financial power is still weaker than the average despite of the financial equalisation scheme. Special additional payments are granted in the case of a distressed budget or to Federal States with a special burden Bremen and Saarland get money as a consequence of a decision of the Federal Constitutional Court.
- The financial participation of the Federal Government in common tasks takes place in forms of a mixed financing. Article 91a of the constitutional law ascertains the principles of joint tasks and their financing. Provided that the following responsibilities are important to society as a whole and that federal participation is necessary for the improvement of living conditions, the Federation shall participate in the discharge of responsibilities of the Länder:
1. improvement of regional economic structures; 2. improvement of the agrarian structure and of coastal preservation.
In cases of clause (1) the Federation shall finance one half of the expenditure in each Land. In cases of clause (2) the Federation shall finance at least on half of the expenditure, and the proportion shall be the same for all Länder. In cases of superregional importance in the promotion of:
1. research facilities and projects apart from institutions of higher education; 2. scientific projects and research at institutions of higher education;
52 As mentioned before, rations exceeding 100% are possible due to the fact that the two compared aggregates are not completely homogeneous.

122
3. construction of facilities at institutions of higher education, including large scientific installations
the Federation and the Länder may mutually agree to cooperate. (Art. 91b Constitutional Law).
The eastern Federal States especially receive additional payments from the Federal Government. According to the second batch of the solidarity agreement, the eastern Federal States receive EUR 105 billion in total. These transfers are declining: until 2008, about EUR 10 billion were given to the eastern Federal States every year. In 2009, this has been reduced to about EUR 9 billion and will fall further to about EUR 2 billion in 2019 when the scheme will end. Exhibit 48 - Germany - Planned funds for the New Länder
Year Amount (EUR million) Change (%) 2005 10.533 2006 10.481 -0.5 2007 10.379 -1.0 2008 10.226 -1.5 2009 9.510 -7.0 2010 8.743 -8.1 2011 8.027 -8.2 2012 7.260 -9.6 2013 6.545 -9.8 2014 5.778 -11.7 2015 5.062 -12.4 2016 4.295 -15.2 2017 3.579 -16.7 2018 2.812 -21.4 2019 2.096 -25.5
Source: German Bundestag, Ministry of Finance Under the investment incentive law “Aufbau Ost”, which is financed as a special property of the Federation - an institution of the Federation for special tasks - non-earmarked additional payments have been given to the eastern Federal States since 2002 to foster growth and to equalise the diverging economic power within Germany. Additionally, the Federal Government has promised about EUR 50 billion extra payments. b) Financial equalisation between the Federal States (Art. 107,1 Basic Law) (“horizontaler Finanzausgleich”) The financial equalisation according to Art. 107,1 adjusts the diverging financial power of the different States appropriately. Rich Federal States are obliged to remit funds to financially weaker States. The actual total revenue of each Federal State is compared to its hypothetical revenue. The hypothetical revenue is mainly based upon the nationwide average financial power. The Land share of revenue from the turnover tax shall accrue to the individual Länder on a per capita basis. A federal law, requiring the consent of the Bundesrat, provides for the grant of supplementary shares not exceeding one quarter of a Land share to Länder whose per capita revenue from Land taxes and from income and corporation taxes is below the average of all the Länder combined. The mentioned federal law ensures a reasonable equalisation of the disparate financial capacities of the Länder, with due regard for the financial capacities and needs of municipalities. It specifies the conditions governing the claims of Länder entitled to equalisation payments and the liabilities of Länder required to make them as well as the criteria for determining the amounts of such payments. It also provides for grants to be made

123
by the Federation to financially weak Länder from its own funds, to assist them in meeting their financial needs (supplementary grants). The two city states (Hamburg and Bremen) receive “special” treatment: each inhabitant is weighted by a factor of 1.35. This is justified on the following grounds: - City States are important central points for industry, distributive trades and services. - They are considered to be regional centres of commerce and areas of growth. - They offer business activities that can be compared to other large cities. - They have to fulfil the tasks of a capital of a Federal State as well as of a large city. City States have always been important in the development of the German State.

124
Exhibit 49 - Germany - Financial equalisation between the different Federal States in Germany 1950 – 2008 in Mio EUR BE BW BY BB HB HH HE MV NI NW RP SL SN ST SH TH Total
Year Berlin Baden- Württemberg Bayern Branden-
burg Bremen Hamburg Hessen Mecklenburg-Vorpommern
Nieder-sachsen
Nordrhein- Westfalen
Rheinland-Pfalz Saarland Sachsen Sachsen-
Anhalt Schleswig-Holstein Thüringen
1950 ./. -33 18 ./. 0 -17 -14 ./. 41 -65 18 ./. ./. ./. 53 ./. ± 130 19601 ./. -55 95 ./. 0 -113 -35 ./. 133 -265 131 ./. ./. ./. 109 ./. ± 468 1970 ./. –161 76 ./. 46 –150 –148 ./. 208 –162 117 73 ./. ./. 102 ./. ± 621 1980 ./. –769 206 ./. 91 –160 –152 ./. 385 –39 126 147 ./. ./. 165 ./. ± 1.120 1985 ./. –738 14 ./. 170 –208 –370 ./. 423 46 191 184 ./. ./. 288 ./. ± 1.317 1990 ./. –1.264 –18 ./. 327 –4 –739 ./. 985 –32 250 187 ./. ./. 308 ./. ± 2.057 1991 ./. –1.282 –2 ./. 301 –34 –682 ./. 898 –4 301 195 ./. ./. 308 ./. ± 2.003 1992 ./. –770 28 ./. 262 0 –942 ./. 661 –2 338 219 ./. ./. 206 ./. ± 1.714 1993 ./. –518 –6 ./. 325 58 –1.094 ./. 510 16 398 215 ./. ./. 95 ./. ± 1.618 1994 ./. –210 –342 ./. 291 31 –935 ./. 490 80 336 222 ./. ./. 37 ./. ± 1.487 1995 2.159 –1.433 –1.295 442 287 –60 –1.101 394 231 –1.763 117 92 907 574 –72 521 ± 5.724 1996 2.217 –1.289 –1.463 529 325 –246 –1.657 438 283 –1.598 118 120 1.005 635 8 576 ± 6.253 1997 2.266 –1.232 –1.586 504 179 –140 –1.610 431 344 –1.564 151 104 981 601 –3 574 ± 6.134 1998 2.501 –1.778 –1.486 534 466 –314 –1.758 448 403 –1.583 219 117 1.020 617 0 595 ± 6.920 1999 2.725 –1.760 –1.635 587 340 –345 –2.433 464 532 –1.318 195 153 1122 672 89 612 ± 7.490 2000 2.812 –1.957 –1.884 644 442 –556 –2.734 500 568 –1.141 392 167 1.182 711 185 670 ± 8.273 2001 2.653 –2.115 –2.277 498 402 –268 –2.629 434 952 –278 229 146 1.031 591 60 573 ± 7.568 2002 2.677 –1.663 –2.047 541 407 –197 –1.910 439 487 –1.628 419 139 1.047 607 112 571 ± 7.445 2003 2.639 –2.169 –1.859 502 346 –656 –1.876 392 393 –50 259 107 936 520 16 500 ± 6.610 2004 2.703 –2.170 –2.315 534 331 –578 –1.529 403 446 –213 190 116 930 532 102 517 ± 6.804 2005 2.456 –2.235 –2.234 588 366 –383 –1.606 434 363 –490 294 113 1.020 587 146 581 ± 6.948 2006 2.709 –2.057 –2.093 611 417 –623 –2.418 475 240 –132 346 115 1.078 590 124 617 ± 7.322 2007 2.900 –2.316 –2.311 675 471 –368 –2.885 513 318 –38 343 125 1.165 627 136 644 ± 7.917 2008* 3.154 –2.521 –2.938 627 507 –375 –2.489 545 323 50 377 117 1.170 633 178 643 ± 8.322 Total 36.571 –44.980 –24.406 7.816 9.077 –11.513 –40.445 6.310 21.810 –17.353 10.687 6.281 14.594 8.497 8.860 8.194 1 For 9 months only * (estimated) Source: German Bundestag, Ministry of Finance

125
As a consequence, City States exhibit higher finance requirements than the Territorial States. A Federal State is considered to be “rich”, if actual revenue is higher than hypothetical revenue and vice versa. The adjustment payments of the “rich” states increase progressively. 75 % of the portion exceeding 121 % of the average financial capacity according to Art. 107,1 Basic Law have to be paid to the weaker countries. Up to 72, 5 % of the total revenue “surplus” of a rich State is siphoned off to the financial equalisation mechanism. The exhibit above gives an impression of the transfers between the different Federal States. These have risen considerably since the introduction of the financial equalisation mechanism, starting from an amount of about EUR 130 million53 in 1950. At the moment, more than EUR 8 billion is necessary to contribute to the equalisation of the financial power. The financial power of the different states diverged more and more in the course of time since 1950. At the moment five donor states support 11 states with transfers. There is a rather distinct north-south divide: Federal States located in the south (Bavaria, Baden-Wuerttemberg, Hesse and –the only exception– Hamburg) are donor states, although Bavaria received funds up to 1990. The states receiving transfers are mostly located in the north or in the east. North Rhine-Westphalia was the big sponsor in times of an expanding steal and coal industry. But according to the estimation for the year 2008, it is likely to receive transfers. NRW has to restructure his historical industries, namely the heavy industry into modern service regions. Furthermore, Bremen used to be a donor until the end of the sixties. All eastern Federal States are also receiving funds.
4.2.2.2. Länder expenditure for investments in Germany Regional expenditure data for Germany cover only State (Länder) expenditure for investments in the 1995-2008 period. Average annual expenditure for investments of Länder decreased from EUR 59.5 billion in the 1995-99 period to 48.4 billions in the 2000-08; in real terms the reduction has been equal to -5% every year in the first period and -2.5% in the second period. The exceptional effort made after the reunification at the beginning of nineties progressively diminished and influenced this downturn; in fact, the decrease is more important in Objective 1 regions during both periods.
53 The term refers to German Million and Billion.

126
Exhibit 50 - Germany - State (Länder) expenditure for investment in Germany: values and trends
Annual average (MEUR)
% on total expenditure
Average annual growth rate
1995-99 2000-08 1995-99 2000-08 1996-99 2000-08 DEUTSCHLAND 59,521.4 48,415.4 17.4 13.5 -4.9 -2.5 Baden-Württemberg 6,439.0 6,328.7 15.9 14.0 -2.8 -0.7 Bavaria 10,358.7 9,191.0 21.5 17.5 -4.6 2.4 Berlin 3,040.8 2,058.5 13.7 9.7 -10.2 0.2 Brandenburg 3,069.3 2,184.8 24.8 17.9 -1.2 -5.1 Bremen 509.7 609.1 12.3 14.4 6.2 -4.1 Hamburg 1,019.4 1,161.9 10.7 11.4 -0.5 6.3 Hesse 3,263.9 3,011.5 12.5 10.5 -6.7 -0.3 Mecklenburg-W. Pomerania 2,392.0 1,461.3 26.2 17.3 -4.7 -7.0
Lower Saxony 4,072.3 3,377.6 13.9 10.7 -5.1 -2.7 North Rhine-Westphalia 8,648.5 7,074.2 12.0 9.2 -4.2 -3.8 Rhineland-Palatine 2,201.6 1,876.6 14.8 11.6 -1.5 -1.1 Saarland 484.9 472.7 11.2 10.6 -2.1 0.7 Saxony 6,152.7 4,311.7 29.6 22.2 -8.3 -4.4 Saxony-Anhalt 3,459.0 2,188.8 26.4 17.8 -5.5 -7.1 Schleswig-Holstein 1,478.1 1,219.1 13.6 10.6 -4.3 -2.1 Thuringia 2,931.0 1,888.0 25.1 17.4 -4.4 -6.5 Obj.1 18,004.0 12,034.6 26.9 19.0 -5.8 -6.0 Obj.2 41,516.9 36,380.9 14.7 12.0 -4.5 -1.1 Memo: Feder. Governm. 18,885.9 18,568.3 7.3 6.6 -5.7 4.3 Source: German Bundestag, Ministry of Finance; Eurostat for the price index In the 2000-2008 period, investment of Länder represented 14% of their total expenditure, while Federal Government investment amounted to only 7% of its total expenditure; an amount equal to about one third of the resources committed by the Länder. Among Objective 2 regions, Bavaria shows the biggest increase with a share of 18% of total expenditure devoted to investment and an increase in real terms of 2.4% over the period. In the exhibit below, Länder investment is shown in relation to GDP and population. Relative to GDP (around 2%), it is three times as large as Federal investment and more than double that in Objective 1 regions. This is also true for investments per capita.

127
Exhibit 51 - Germany - State (Länder) expenditure for investment: relative to GDP and per capita
Inv. on GDP (%)
Inv. per capita (DE=100)
GDP per capita
(DE=100)
1995-99 2000-06 1995-99 2000-07 2000-06 DEUTSCHLAND 3.1 2.3 100.0 100.0 100.0 Baden-Württemberg 2.3 2.1 85.7 101.0 112.3 Bavaria 3.2 2.3 118.4 121.5 117.7 Berlin 3.8 2.8 120.9 105.7 87.9 Brandenburg 7.4 4.8 165.1 146.2 69.5 Bremen 2.4 2.8 105.4 162.6 135.6 Hamburg 1.5 1.4 82.6 109.6 171.7 Hesse 1.9 1.6 74.4 84.4 121.6 Mecklenburg-Western Pomerania 8.3 5.0 181.7 145.2 68.0 Lower Saxony 2.4 1.9 71.7 72.5 88.5 North Rhine-Westphalia 2.0 1.6 66.4 68.0 99.8 Rhineland-Palatine 2.5 2.0 76.0 77.5 88.4 Saarland 2.0 1.8 62.0 77.2 93.5 Saxony 8.3 5.5 186.2 173.2 71.9 Saxony-Anhalt 8.4 5.1 177.7 151.6 69.4 Schleswig-Holstein 2.4 1.8 74.0 73.4 90.0 Thuringia 7.8 4.6 162.8 136.3 68.9 Obj.1 8.1 5.1 176.0 154.0 69.9 Obj.2 2.4 1.9 84.3 89.4 106.0 Memo: Feder. Governm. 1.0 0.8 31.7 36.5 - Source: German Bundestag, Ministry of Finance; Eurostat.
4.2.2.3. EU Cohesion Policy support to development in the German regions The following exhibit presents the ratio between EU Cohesion Policy funds and expenditure for development by region, estimated on the basis of GFCF at state government level. This approximation of EfD embraces all the economic categories, but excludes capital transfers and refers only to state government level54. It is reasonable to assume that, especially in Objective 2 where state expenditure is more relevant than in Objective 1, state GFCF does not differ greatly from the actual total development spending. In the period 2000-2006, on average the ratio between EU Cohesion Policy and state GFCF was above 16% in Objective 1 regions, slightly above 2% in Objective 2 regions and 5.8% at national level. The Saxony-Anhalt (17.4% of state investments) received the highest contribution from EU and the Baden-Württemberg the lowest (0.8%). Among Objective 2 regions, the importance of EU Cohesion Policy is lowest in Baden-Württemberg and Hamburg while it is highest in Saarland and Berlin (amongst the regions with the lowest GDP per head within the Objective 2 group with Berlin combining both Objectives 1 and 2).
54 As shown in exhibit 31, at COFOG 1-digit, the share of total EfD managed by the state government level in Germany is around 40%.

128
Exhibit 52 - Comparison between EU Cohesion Policy funds and expenditure for development in Germany (2000-2006)
Regions (NUTS1) % Baden-Württemberg 0.8 Bavaria 1.8 Berlin 6.8 Brandenburg 16.9 Bremen 9.0 Hamburg 0.1 Hesse 1.0 Mecklenburg-Western Pomerania 16.0 Lower Saxony 3.4 North Rhine-Westphalia 2.3 Rhineland-Palatine 1.5 Saarland 3.8 Saxony 15.0 Saxony-Anhalt 17.4 Schleswig-Holstein 3.4 Thuringia 16.7 Obj.1 16.2 Obj.2 2.2 TOTAL 5.8 Numerator: EU Cohesion Policy funds except ESF; Denominator: GFCF at state government level Source: German Bundestag, Ministry of Finance; DG REGIO data.

129
4.2.3. Spain
4.2.3.1. Regional investment and expenditure for development in Spain For Spain, it is possible to regionalise public expenditure at state (Comunidades Autónomas - CCAA) and local government level. The two exhibits below show capital expenditure and public investment in each Spanish region during 2000-2006. Several features emerge from the first exhibit: - capital expenditure per capita at state level under the common system (CC.AA)
increased significantly from 1998 to 2006; at current prices, most autonomous communities have doubled or even tripled per capita capital expenditure, while at constant prices, expenditure rose on average by 8% a year for state governments and 7% a years for local governments;
- the communities characterised by a special fiscal regime, allowing them broad fiscal autonomy (País Vasco and Navarra), experienced lower growth in capital expenditure at state level than under those under the CC.AA., but capital expenditure at local level increased significantly. On the other hand, in Comunidad Valenciana and Canarias, the increase in expenditure at both government levels was below the national average.
- Capital expenditure of state government amounts on average to 2.3% of GDP and that of e local government to 1.3% of GDP; in Extremadura expenditure of the former was 4.5% of GDP;
- Both state and local government expenditure of the various regions have shown some general convergence tendency, in the sense that the level in less advanced regions, with the exception of Andalucia and Murcia, has risen in relative terms.
The following exhibit on gross fixed capital formation indicates: - total public investment has shown significant growth in all Spanish regions at state
level, however, Objective 1 regions have experienced higher growth than Objective 2 regions, except the Balearic Islands (which showed remarkable growth in public investment at state level between 1998 and 2006);
- public investment at local level also increased during the period but by less than at state level, in this case Objective 2 regions experienced much higher growth than Objective 1 regions.

130
Exhibit 53 - Spain - Total capital expenditure by region 1998-2006
Total value (annual average, MEUR)
On GDP (annual average, %)
Growth rate (annual average, %)
Per head (annual average, ES=100)
state gov local gov state gov local gov state gov local gov state gov local gov ESPAÑA 16,941.0 10,068.3 2.3 1.3 6.3 7.6 100.0 100.0 Galicia 1,364.8 503.2 3.6 1.3 6.1 8.6 125.8 76.3 Asturias 594.0 186.4 3.7 1.2 6.6 7.1 139.3 73.6 Cantabria 345.0 85.9 3.7 0.9 12.0 8.2 155.4 66.0 País Vasco 940.2 1,092.7 2.1 2.3 3.6 8.8 113.3 216.4 Navarra 457.6 206.8 3.7 1.6 2.2 17.5 206.9 146.5 La Rioja 179.5 86.8 3.1 1.5 16.1 12.3 152.8 126.1 Aragón 555.4 379.7 2.4 1.6 10.3 13.6 110.3 125.6 Madrid 1,949.6 1,239.0 1.5 0.9 11.3 18.8 85.3 89.0 Castilla León 1,380.7 658.7 3.3 1.6 9.8 7.3 136.4 110.9 Castilla la Mancha 802.4 391.7 3.1 1.5 9.6 8.9 108.3 89.7 Extremadura 548.6 216.9 4.5 1.8 6.5 2.8 128.9 86.9 Cataluña 1,877.3 1,488.9 1.3 1.1 9.2 6.6 69.4 97.0 Comunidad Valenciana 1,657.3 861.8 2.3 1.2 2.3 4.0 97.9 85.9 Baleares 375.8 191.9 1.9 1.0 16.9 19.9 97.1 86.0 Andalucía 2,719.6 1,597.5 2.7 1.6 7.5 10.7 88.9 87.8 Murcia 448.4 212.0 2.4 1.1 9.0 12.2 89.6 68.8 Ceuta 4.6 28.6 0.4 2.4 25.4 14.2 157.2 Melilla 2.4 26.9 0.2 2.8 11.5 8.1 181.0 Canarias 737.9 613.0 2.5 2.0 0.2 3.6 103.8 144.1 obj.1 10,605.6 5,382.5 2.9 1.5 5.8 6.6 106.7 91.1 obj.2 6,335.4 4,685.7 1.7 1.2 7.5 9.7 90.3 112.7 Source: IGAE (data on capital expenditure); Eurostat (data on population).

131
Exhibit 54 - Spain - Total public investment by region; 1998-2006
Total value (annual average, MEUR)
On GDP (annual average, %)
Growth rate (annual average, %)
Per head (annual average, ES=100)
state gov local gov state gov local gov state gov local gov state gov local gov ESPAÑA 9,985.2 8,247.7 1.3 1.1 7.7 6.3 100.0 100.0 Galicia 794.2 404.1 2.1 1.1 7.3 2.4 124.3 76.9 Asturias 381.3 143.3 2.4 0.9 7.5 2.9 153.3 69.4 Cantabria 253.0 69.8 2.7 0.8 13.6 -1.8 192.8 68.2 País Vasco 364.1 885.9 0.8 1.9 5.4 10.0 73.7 212.2 Navarra 198.7 171.3 1.6 1.3 1.5 11.8 154.5 152.1 La Rioja 109.3 72.8 1.9 1.3 25.4 10.4 152.9 129.9 Aragón 271.1 313.1 1.1 1.3 12.8 7.7 91.7 129.2 Madrid 1,430.8 1,036.9 1.1 0.7 15.8 24.3 106.9 88.2 Castilla León 805.4 552.9 2.0 1.4 7.3 1.6 137.7 115.3 Castilla la Mancha 450.8 333.9 1.7 1.3 14.2 4.9 101.2 94.5 Extremadura 333.1 184.6 2.7 1.6 11.0 -1.5 130.9 91.1 Cataluña 1,268.0 1,138.6 0.9 0.8 12.3 6.8 79.1 88.8 Comunidad Valenciana 1,127.3 760.6 1.6 1.1 3.0 1.6 114.0 92.6 Baleares 231.0 158.6 1.2 0.8 24.0 9.3 98.0 89.1 Andalucía 1,307.8 1,284.6 1.3 1.3 7.4 6.1 73.3 87.3 Murcia 258.5 176.9 1.4 0.9 11.5 8.2 87.3 71.8 Ceuta 23.8 2.0 39.6 156.1 Melilla 22.9 2.4 11.4 182.2 Canarias 400.7 513.4 1.3 1.7 11.1 3.2 92.3 146.1 obj.1 6,112.2 4,470.6 1.7 1.2 6.7 3.0 104.8 93.4 obj.2 3,873.0 3,777.1 1.0 1.0 10.7 10.6 93.1 109.4 Source: IGAE (data on capital expenditure); Eurostat (data on population).

132
The following exhibits show estimates of the role of state and local administrative levels in carrying out public investment for development in the different regions; the first exhibit presents data on capital expenditure for development (capital transfers private + gross capital formation, on COFOG 1 level relevant for development) and the second exhibit shows data on total expenditure for development (capital expenditure for development + current expenditure on training). Information contained in the first exhibit indicates, on the one hand, that Objective 2 regions at local level have experienced on average a higher increase in capital expenditure for development than Objective 1 regions over the period 1998-2006, and on the other, that at state level most regions have significantly increased capital expenditure for development. This is true for all regions except Valencia, Canarias and País Vasco. If current expenditure on training is included, the results are the same: a high growth at state and local government levels over the programming period 2000-2006, especially at regional (state) level.

133
Exhibit 55 - Spain - Capital expenditure for development by administrative level and by region; 1998-2006 Total value
(annual average, MEUR) On GDP
(annual average %) Growth rate
(annual average,%) Per head
(annual average, ES=100) state gov local gov state gov local gov state gov local gov state gov local gov
ESPAÑA 13,068.3 7,769.7 1.7 1.0 6.2 5.1 100.0 100.0 Galicia 1,153.5 361.1 3.0 1.0 5.3 1.7 137.5 72.7 Asturias 471.7 137.4 2.9 0.9 5.6 0.4 143.1 71.0 Cantabria 291.8 61.7 3.1 0.7 12.5 -1.4 170.6 63.3 País Vasco 595.7 877.3 1.3 1.9 -0.3 6.7 94.0 224.2 Navarra 330.6 153.4 2.6 1.2 2.6 10.2 192.3 144.6 La Rioja 144.2 65.4 2.5 1.2 17.1 9.0 157.7 123.8 Aragón 396.9 287.0 1.7 1.2 9.9 7.1 102.4 125.6 Madrid 1,621.6 947.7 1.2 0.7 13.8 20.9 91.7 87.0 Castilla León 1,091.2 492.9 2.7 1.2 7.5 1.0 140.5 108.8 Castilla la Mancha 617.1 295.9 2.4 1.2 11.9 4.1 106.6 88.8 Extremadura 435.9 163.1 3.5 1.4 7.2 -2.9 131.4 85.1 Cataluña 1,472.2 1,198.7 1.0 0.9 8.6 6.3 70.9 98.5 Comunidad Valenciana 1,332.0 676.5 1.9 1.0 1.7 1.0 102.2 86.9 Baleares 273.3 145.5 1.4 0.8 16.3 9.3 92.0 86.5 Andalucía 2,036.1 1,203.4 2.0 1.2 6.4 5.1 86.8 86.9 Murcia 332.1 160.9 1.8 0.9 9.5 6.7 85.9 69.4 Ceuta 24.1 2.1 25.2 171.0 Melilla 24.1 2.5 9.5 201.2 Canarias 472.6 493.6 1.6 1.7 5.0 2.5 84.7 148.7 obj.1 8,233.9 4,094.8 2.2 1.1 5.6 2.2 107.4 90.6 obj.2 4,834.5 3,675.0 1.3 1.0 8.0 8.7 89.4 113.5 Source: Own elaboration from IGAE.

134
Exhibit 56 - Spain - Expenditure for development by administrative level and by region; 2000-06 Total value
(annual average, MEUR) On GDP
(annual average %) Growth rate
(annual average %) Per head
(annual average, ES=100) state gov local gov state gov local gov state gov local gov state gov local gov
ESPAÑA 14,745.2 8,345.2 1.8 1.1 6.6 5.6 100.0 100.0 Galicia 1,259.4 379.3 3.1 0.9 5.7 -0.8 133.2 71.7 Asturias 517.9 134.2 3.0 0.8 6.0 5.2 140.4 64.1 Cantabria 321.5 65.1 3.2 0.7 12.7 -11.5 166.6 62.8 País Vasco 660.6 975.4 1.4 2.0 -1.7 3.8 92.2 236.7 Navarra 362.9 168.4 2.7 1.2 0.1 8.3 186.1 149.5 La Rioja 165.6 70.4 2.7 1.2 16.5 11.5 162.0 123.8 Aragón 450.2 310.6 1.8 1.3 10.3 6.2 103.9 127.7 Madrid 1,882.1 1,057.3 1.3 0.7 17.3 29.2 94.8 90.1 Castilla León 1,230.9 510.9 2.8 1.2 6.0 1.0 143.1 105.6 Castilla la Mancha 711.8 315.2 2.6 1.2 16.0 4.9 110.2 87.9 Extremadura 481.9 154.0 3.6 1.2 8.1 4.6 129.4 73.2 Cataluña 1,706.5 1,279.8 1.1 0.9 8.5 10.3 73.1 97.3 Comunidad Valenciana 1,470.2 705.1 1.9 0.9 0.8 0.4 98.6 83.2 Baleares 317.6 160.1 1.5 0.8 21.2 12.4 94.0 87.6 Andalucía 2,291.2 1,297.8 2.1 1.2 8.1 1.2 86.4 87.8 Murcia 375.3 178.5 1.9 0.9 9.0 8.4 85.2 71.6 Ceuta 0.1 28.9 2.4 26.2 0.4 198.5 Melilla 0.1 23.6 2.2 -0.1 0.3 181.3 Canarias 539.3 530.5 1.7 1.7 2.2 -0.5 84.8 147.5 obj.1 9,199.6 4,323.1 2.3 1.1 5.9 1.0 106.3 89.0 obj.2 5,545.6 4,022.1 1.4 1.0 8.7 11.1 91.0 115.7 Source: Own elaboration from IGAE.

135
4.2.3.2. EU Cohesion Policy support to development in the Spanish regions The following exhibit presents the ratio between EU Cohesion Policy funds and EfD – calculated for state and local governments – by region. On average the ratio is above 56% in Objective 1 regions and nearly 11% in Objective 2 regions. Among Objective 2 regions, the importance of EU Cohesion Policy is lowest in La Rioja and highest in Cataluña. Exhibit 57 - Comparison between EU Cohesion Policy funds and expenditure for development in Spain (2000-2006)
Regions % Galicia 56.0 Asturias 57.6 Cantabria 28.4 País Vasco 12.0 Navarra 7.7 La Rioja 7.3 Aragón 14.2 Madrid 7.8 Castilla León 48.6 Castilla la Mancha 54.1 Extremadura 82.8 Cataluña 13.7 Comunidad Valenciana 45.5 Baleares 9.2 Andalucía 66.1 Murcia 65.6 Ceuta 87.6 Melilla 85.7 Canarias 52.7 obj.1 56.7 obj.2 10.9 TOTAL 37.7 Numerator: EU Cohesion Policy funds; Denominator: EfD Source: IGAE; DG REGIO data. Across Objective 1 regions, the role of EU Cohesion Policy is of major importance in Extremadura (a region with lowest GDP per head at the beginning of the past programming period), Ceuta and Melilla whilst it is relatively close to the average in the other regions.

136
4.2.4. Italy Regional data for Italy are available for expenditure for development (EfD)55 in the 1995-2007 period. These also enable public corporations and the public sector as a whole to be examined. 4.2.4.1. Expenditure for development in the Italian regions In the 2000-2007 period on average, expenditure for development was around EUR 41 billion per year at general government level and around EUR 63.5 billion at public sector level. EfD is around 6% of the total expenditure of the general government and 7% of that of the public sector, representing over 80% of total capital expenditure of both general government and the public sector. Within EfD, public corporations are important and account for approximately a third of the overall EfD. Within the public corporations, there are important national bodies such as the national railways company (Ferrovie dello Stato - FS) and the national oil company (Ente Nazionale Idrocarburi - ENI) which are in different ways controlled by the State. In addition, there are local public corporations which are generally public utilities (electricity, water, etc.) and are controlled by Municipalities or Regions. The main actors in relation to regional expenditure for development are “Other local governments” (mainly municipalities) and the public corporations, which account for 30% and the 35% of total expenditure for development. If only general government is considered, local authorities account for over the 40% of total expenditure. The relative scale of central state expenditure and that of local (regions and others local authorities) government differs across regions according to two main factors: The six Regions with a special statute (Valle d’Aosta, PA Trento e PA Bolzano, Friuli Venezia Giulia, Sardinia, Sicily), which receive a larger amount of fiscal revenues than other regions and consequently their share of expenditure varies between 30% and 50% of the overall expenditure of the public sector (in contrast with a national average of 18%); Differences between Objective 1 and 2 regions; in Objective 1 regions, central government expenditure is larger than in Objective 2 regions due to some convergence policies managed by the State and the state co-financing of the EU Cohesion Policy; in addition the role of public corporations is not extensive. This last element involves different aspects: first, some national public corporations decided in the 2000-06 period to invest mainly in Objective 2 regions because it is more profitable (such as investment in high speed trains); secondly, local public corporations in Objective 2 regions are larger and more efficient because they operate in more developed areas and can invest more than their Objective 1 equivalents. 55 Calculated according to the methodology Cofog 2 digit on the basis of specific statistics produced by the Italian Ministry for Development (Conti Pubblici Territoriali). These statistics adopt an accounting system different from that of ESA95 and similar to the account for public budget; for this reason their sectors do not correspond to the COFOG category but are sufficiently similar to them (see annex).

137
Exhibit 58 - Italy - Expenditure for development in 2000-06 by government level and region
EUR million (annual average) % on total
1. Central
gov.
2. Local gov.
2.1 Regions
2.2 Others
loc.
3. (1+2) General
gov.
4. Public comp.
5. (3+4) Public sector
1. Central
gov.
2. Local gov.
2.1 Regions
2.2 Others
loc.
3. (1+2) General
gov.
4. Public comp.
5. (3+4) Public sector
ITALIA 12,339 28,706 11,217 17,489 41,045 22,549 63,594 19.6 45.2 17.7 27.5 64.8 35.2 100.0 Piedmont 757 2,239 837 1,401 2,996 1,703 4,699 16.2 47.8 18.0 29.8 64.1 35.9 100.0 Valle d'Aosta 30 205 195 10 235 149 384 7.7 54.2 51.4 2.8 61.9 38.1 100.0 Lombardy 1,172 3,594 963 2,631 4,766 3,611 8,377 14.3 43.1 11.8 31.3 57.4 42.6 100.0 PA Bolzano 51 1,212 794 417 1,263 305 1,568 3.2 77.5 50.9 26.6 80.7 19.3 100.0 PA Trento 67 1,080 703 378 1,148 228 1,376 4.9 78.6 51.1 27.5 83.5 16.5 100.0 Veneto 677 2,009 782 1,226 2,685 1,749 4,434 15.9 45.4 17.6 27.7 61.2 38.8 100.0 Friuli Venezia Giulia 149 939 493 446 1,088 622 1,710 8.8 54.9 28.9 26.0 63.6 36.4 100.0 Liguria 363 804 188 617 1,167 845 2,012 18.1 40.0 9.4 30.7 58.2 41.8 100.0 Emilia Romagna 623 2,006 704 1,301 2,628 2,219 4,848 13.0 41.1 14.5 26.6 54.1 45.9 100.0 Tuscany 558 1,620 461 1,159 2,178 1,794 3,972 14.2 40.9 11.7 29.2 55.1 44.9 100.0 Umbria 216 737 192 546 953 356 1,309 16.5 56.2 14.8 41.4 72.7 27.3 100.0 Marche 191 764 216 549 956 534 1,490 12.8 51.3 14.5 36.8 64.1 35.9 100.0 Lazio 1,323 1,567 251 1,316 2,890 3,303 6,193 21.8 25.4 4.1 21.3 47.2 52.8 100.0 Abruzzi 335 593 219 374 928 341 1,269 26.8 46.6 17.2 29.4 73.3 26.7 100.0 Molise 124 257 117 140 381 123 503 24.7 50.3 22.5 27.8 75.0 25.0 100.0 Campania 1,595 2,466 758 1,708 4,062 1,162 5,224 30.7 47.1 14.4 32.7 77.8 22.2 100.0 Puglia 1,012 1,191 401 790 2,203 869 3,072 33.1 38.7 13.0 25.7 71.8 28.2 100.0 Basilicata 303 441 162 279 744 330 1,075 28.1 41.1 15.1 26.0 69.2 30.8 100.0 Calabria 1,027 1,001 427 574 2,028 514 2,542 40.2 39.4 16.9 22.6 79.7 20.3 100.0 Sicily 1,178 2,509 1,581 928 3,687 1,230 4,918 24.0 51.0 32.0 19.0 75.0 25.0 100.0 Sardinia 587 1,472 771 701 2,059 562 2,622 22.5 56.0 29.3 26.6 78.4 21.6 100.0 Obj.1 5,826 9,338 4,218 5,120 15,164 4,791 19,955 29.2 46.8 21.1 25.7 76.0 24.0 100.0 Obj.2 6,513 19,368 6,999 12,369 25,881 17,758 43,639 15.2 44.5 16.2 28.3 59.6 40.4 100.0 Source: Ismeri Europa processing on Ministry for development data (Conti Pubblici Territoriali - CPT)

138
The second exhibit shows the trend in EfD in the different regions and at different government levels from 1995 to 2007. From 1995 to 1999 general government expenditure grew at an annual average rate of 5% (in real terms) and public sector expenditure at 2%; the fall in the EfD (-8%) of public corporations explaining the difference. General government expenditure was supported by the significant growth of the local level, which experienced an increase in competences and resources; this trend was especially pronounced in Objective 2 regions, which were favoured by the increased autonomy and had their income capacity. Public corporation expenditure declined both because the wave of privatisation which started at the beginning of the 1990s was still underway and their number was diminishing56 and because transfers to public corporations were reduced as part of restrictive budgetary policy. These trends were widespread. In the 2000-2007 period the trends were reversed: general government EfD declined and public corporations increased their expenditure. These increased investment for two main reasons: some of them raised funds in the market and increased their size by means of merging and acquisition (especially local public corporations in the Central and Northern regions); and the possibility for local government to avoid budget constraints by undertaking expenditure through public corporations. However, local governments (Regions, Provinces, Municipalities and others) continued to increase their EfD, but at a slower pace, and central expenditure declined at an average of almost 5% a year. Growth of the EfD was higher in Objective 2 regions in both periods and in both the general government and public sectors. This was the case across regions and for each government level, with only few exceptions reflecting specific circumstances57. In the 2000-07 period, the decrease of Central government EfD in Objective 1 regions was significant (-5% a years as against+4% a year in Objective 2) and is the reason for the decline at general government level. The persistently high level of public debt and progress towards devolution affected spending for development in this period: the former reduced the overall capacity for spending and led to a transfer of responsibility for investment to public corporations, the latter reinforced the local government level; both shifted EfD towards the larger agglomerations and reduced convergence
56 The man public owned company privatised in that period was Telecom, the telephone company. 57 For instance, in 2000-2007 the EfD of central government in Trento and Bolzano has large increase because it started from very low level.

139
Exhibit 59 - Italy - Expenditure for development by government level and region: main trends (annual average growth, %)
1997-99 2000-07
Regions (NUTS 2) 1. Central
gov.
2. Local gov.
(regions+others)
3. (1+2) General
gov.
4 Public comp.
5. (3+4) Public sector
1. Central
gov.
2. Local gov. (regions+
others)
3. (1+2) General
gov.
4 Public comp.
5. (3+4) Public sector
ITALIA 2.3 7.5 5.4 -8.0 1.6 -4.7 1.5 -0.5 4.9 3.9 Piedmont 9.9 11.8 10.5 -8.2 3.6 -4.6 3.0 0.0 6.9 4.5 Valle d'Aosta -25.1 4.7 -3.0 -28.1 -9.9 4.0 -6.4 -6.1 11.8 0.6 Lombardy 4.2 13.2 10.3 -13.0 1.1 -0.6 1.7 0.8 9.4 6.5 PA Bolzano -19.8 9.7 7.8 -16.5 4.7 35.6 0.4 0.7 14.2 4.8 PA Trento -19.0 0.8 -0.8 -19.0 -3.6 67.2 3.4 3.7 4.5 6.0 Veneto 8.3 7.5 7.7 -2.8 4.0 -0.5 4.3 2.6 8.8 7.3 Friuli Venezia Giulia -1.2 10.4 6.9 2.4 5.9 3.3 1.3 1.1 3.6 3.9 Liguria 17.4 8.3 6.1 -3.1 2.6 -4.4 -0.6 -2.4 1.0 1.1 Emilia Romagna 2.7 11.6 8.8 -1.1 5.3 -2.3 1.9 0.8 7.1 5.6 Toscana 5.0 14.3 10.7 -1.9 6.0 -2.9 -0.5 -1.3 3.3 3.1 Umbria -1.8 36.6 21.6 -14.4 11.2 -0.4 0.8 0.2 11.1 4.7 Marche 10.7 21.3 17.9 29.8 21.8 -4.0 -0.3 -1.7 -0.3 0.8 Lazio 5.6 -2.0 0.9 -9.0 -3.3 -2.3 3.6 0.2 7.1 5.4 Abruzzi -7.2 12.3 1.0 -13.7 -1.5 -9.3 2.2 -2.4 7.5 2.2 Molise 18.4 27.0 22.0 -12.8 14.9 -7.8 0.4 -4.4 12.8 0.7 Campania 4.6 12.4 7.8 -15.5 1.6 -7.9 5.6 -0.1 1.8 2.8 Puglia 0.5 11.1 3.6 -10.5 0.8 -7.1 3.8 -1.7 6.1 2.5 Basilicata -5.7 4.2 -2.4 10.2 0.7 -0.7 1.0 -1.1 4.2 2.1 Calabria 7.0 2.7 4.6 -8.3 2.5 4.4 -2.3 0.7 3.7 3.6 Sicilia 19.7 -1.8 3.8 -10.4 1.0 -3.4 2.8 0.3 3.7 3.5 Sardinia -2.3 -0.2 -5.0 -3.1 -3.4 -4.4 0.7 -1.0 1.4 1.8 Obj.1 2.8 3.8 3.1 -10.4 0.7 -4.9 2.1 -0.8 2.7 2.5 Obj.2 2.2 9.6 7.0 -7.1 2.1 -3.8 1.4 0.0 5.7 4.6 Source: Ismeri Europa processing on Ministry for Development data (Conti Pubblici Territoriali - CPT) and Eurostat (price index)

140
4.2.4.2. The cohesion orientation of EfD in Italian regions The exhibit below shows EfD relative to GDP and per capita in the 2000-2007 period. Despite the major reduction in EfD in Objective 1 regions, EfD remains significantly higher in relation to GDP (7%) than in Objective 2 regions (4%). This is a result of the large differences in the GDP between the two and a EfD per capita is only slightly higher in Objective 1 regions. The EfD per capita of public corporations is concentrated in Objective 2 regions and to some extent offsets the higher general government EfD in Objective 1 regions. Autonomous regions (see above) have higher levels of EfD both as a % of GDP and per capita, but the level is also high in small regions in the South (Molise and Basilicata). Per capita EfD in some large Objective 1 (Puglia) and Objective 2 (Lombardy, Veneto and Piedmont) regions is relatively low and suggests that the regional distribution of investment is driven only partially by a convergence objective or by needs, but also that it also significantly affected by special advantage and increasing autonomy in the management of resources at local level (government and public corporations). The fourth exhibit shows EfD by COFOG category58 for the general government in 2000-07. Economic Affairs absorbed more than 50% of the total EfD, and in Objective 1 it represented 60% of the total. Within this category most expenditure was accounted for by transport and support to the manufacturing sector; transport was more important in Objective 2 and support to enterprise in Objective 1. The other categories of expenditure account for similar shares in the two groups of region, the larger share of EfD going to the environment, education, health and recreation in Objective 2 regions reflecting the priority given to these. National strategy, therefore, seems to be to favour support to enterprises in the Objective 1 regions and transport and other infrastructure in Objective 2 regions. There are no major differences in the allocation of resources by broad category between regions. In Objective 2 regions, it is worth noting the relatively large expenditure in Veneto on Environmental protection, in Valle d’Aosta on tourism, economic affairs and education, and in Umbria on housing. In Objective 1 regions, in Puglia, resources were concentrated on manufacturing, in Campania on transport (rail and others), and in Sardinia on agriculture and forestry.
58 The Italian data of the Ministry of Development adopt a particular classification, but it is possible to approximate it to the 2-digit COFOG classification

141
Exhibit 60 - Italy - Expenditure for development by government level and region: relevance on economy in 2000-07 period (annual average, %)
% on GDP per head (IT=100)
1. Central
gov.
2. Local gov.
2.1 Regions
2.2 Others
loc.
3. (1+2) General
gov.
4. Public comp.
5. (3+4) Public sector
1. Central
gov.
2. Local gov.
2.1 Regions
2.2 Others
loc.
3. (1+2) General
gov.
4. Public comp.
5. (3+4) Public sector
ITALIA 1.2 2.0 0.8 1.1 3.2 1.6 4.8 100 100 100 100 100 100 100 Piedmont 0.8 1.5 0.6 0.9 2.2 1.2 3.5 76.9 86.8 78.8 93.1 83.2 90.0 85.7 Valle d'Aosta 1.1 8.4 6.4 2.0 9.4 4.0 13.4 130.4 613.1 1,099.2 256.5 434.6 354.5 408.6 Lombardy 0.4 1.1 0.3 0.8 1.6 1.1 2.6 53.7 80.9 56.4 99.2 70.8 90.7 77.9 PA Bolzano 0.4 7.3 5.1 2.1 7.7 1.4 9.1 51.7 527.4 877.4 270.1 350.1 119.0 272.7 PA Trento 0.6 7.1 4.8 2.3 7.7 1.9 9.6 63.9 469.3 751.5 260.0 318.0 152.0 261.8 Veneto 0.6 1.2 0.5 0.7 1.8 1.0 2.8 62.2 75.9 74.4 77.0 70.7 74.3 72.0 Friuli V. Giulia 1.0 2.8 1.6 1.2 3.7 1.7 5.4 93.4 161.1 220.5 117.9 135.9 118.9 129.8 Liguria 1.6 1.9 0.6 1.4 3.6 2.6 6.2 146.6 101.7 69.3 126.0 118.3 172.4 136.2 Emilia Romagna 0.5 1.4 0.5 0.9 2.0 1.3 3.3 61.3 96.0 79.7 108.0 83.1 111.8 92.6
Toscana 0.7 1.6 0.5 1.2 2.3 1.8 4.1 67.6 92.5 61.0 115.3 83.3 123.4 96.7 Umbria 1.2 2.3 1.0 1.4 3.6 1.5 5.1 106.1 116.3 113.0 118.9 112.8 94.2 106.9 Marche 0.7 1.9 0.7 1.1 2.6 1.3 3.9 65.8 96.1 88.1 102.1 84.9 88.3 85.6 Lazio 1.3 1.0 0.1 0.8 2.3 2.4 4.7 136.3 58.8 19.8 88.1 87.4 177.3 117.8 Abruzzi 2.5 2.2 0.8 1.4 4.6 1.2 5.9 189.1 98.7 86.8 107.7 132.7 68.6 110.9 Molise 4.0 4.2 2.0 2.1 8.2 1.7 10.0 265.1 160.7 183.5 145.5 199.6 82.8 160.6 Campania 2.7 2.3 0.6 1.7 5.0 2.0 7.0 147.9 75.9 49.9 94.4 102.8 82.2 96.1 Puglia 2.0 1.7 0.8 1.0 3.7 1.4 5.1 115.2 60.2 64.2 57.2 80.9 58.1 73.1 Basilicata 4.9 4.9 2.0 2.9 9.8 3.0 12.8 294.1 179.4 172.6 185.1 222.9 137.9 192.4 Calabria 2.9 3.7 2.0 1.7 6.6 1.8 8.4 156.9 120.8 153.5 96.7 134.1 73.4 113.5 Sicilia 1.5 3.5 2.0 1.5 5.0 1.7 6.7 85.6 120.3 163.0 88.1 106.9 71.1 94.8 Sardinia 2.4 5.0 3.1 1.9 7.5 2.4 9.8 162.2 202.4 292.3 136.1 188.0 116.7 162.7 Obj.1 2.3 3.0 1.5 1.5 5.3 1.9 7.2 133.7 104.2 119.7 92.5 115.2 78.0 102.5 Obj.2 0.8 1.6 0.6 1.0 2.4 1.5 3.8 82.5 97.8 89.8 103.9 92.1 111.4 98.7 Source: Ismeri Europa processing on Ministry for development data (Conti Pubblici Territoriali - CPT), Istat for GDP and Eurostat for Population.

142
Exhibit 61 - Italy - Expenditure for development of general government by region and COFOG (annual average 2000-07; % on total)
Categories Pied VdA Lom PA Bolz PA Tren Ven Fvg Lig ERo Tos Umb Mar Laz Abr Mol Cam Pug Bas Cal Sic Sar Obj.1 Obj.2 ITA
4.1 - General economic and labour affairs 0.8 0.2 0.2 0.0 3.0 0.0 0.2 0.0 0.0 0.0 0.3 0.3 0.8 1.8 0.7 0.3 0.0 0.4 0.4 0.5 3.2 0.7 0.4 0.6
4.2 - Agriculture, forestry 2.8 11.1 2.9 7.7 7.4 4.3 5.5 1.6 4.8 2.0 3.3 4.2 5.2 4.0 10.3 3.7 3.6 6.8 4.2 8.3 11.4 6.2 4.1 4.9 4.2 - fishing 0.0 0.0 0.0 0.0 0.0 0.1 0.2 0.1 0.0 0.0 0.0 0.0 0.0 0.0 0.1 0.0 0.2 0.0 0.1 0.1 0.1 0.1 0.0 0.0 4.3 – Fuel and energy 0.0 0.3 0.0 1.4 0.8 0.0 0.1 0.0 0.0 0.8 0.2 0.1 0.1 0.0 0.1 5.0 0.0 0.4 0.1 0.0 0.2 1.4 0.2 0.6 4.4 - Mining, manufacturing and construction 13.3 6.2 13.5 6.7 6.4 7.4 5.2 12.2 6.4 6.9 6.5 9.8 11.3 17.6 17.8 25.9 32.6 25.5 24.7 22.4 17.3 24.5 10.0 15.3
4.5 - Transport (others) 4.9 7.6 5.7 5.4 2.6 5.8 3.9 14.9 6.1 5.9 3.0 4.5 10.4 5.3 6.4 9.7 6.8 2.0 3.5 3.8 3.2 5.7 6.2 6.0 4.5 - Transport (roads) 20.5 18.0 19.0 19.3 22.4 21.7 20.3 21.1 23.0 21.0 18.5 20.7 16.6 22.2 25.7 11.1 12.2 17.5 27.1 12.2 17.6 15.2 20.2 18.4 4.6 - Communication 0.0 0.1 0.1 0.4 0.1 0.0 0.1 0.1 0.1 0.0 0.0 0.1 0.2 0.6 0.1 0.0 0.0 0.0 0.0 0.0 0.2 0.0 0.1 0.1 4.7 - Other industries (commerce) 0.4 1.7 0.8 0.8 1.1 0.4 0.7 0.3 0.2 0.5 0.2 0.4 0.5 0.3 0.2 0.2 0.3 0.5 0.5 0.1 0.2 0.3 0.5 0.4
4.7 - Other industries (tourism) 3.0 6.0 0.8 2.6 3.6 0.9 1.3 1.7 0.6 1.2 0.7 1.0 0.4 1.7 2.1 0.4 0.4 2.0 1.1 2.1 3.4 1.4 1.4 1.4
4.7, 4.9 Other industries and n.e.c. 4.2 10.7 3.7 6.3 3.2 2.6 14.5 2.6 4.0 6.4 9.3 3.4 2.8 4.2 3.4 4.6 5.2 3.8 6.4 5.8 2.4 4.9 4.6 4.7
4 - Economic affairs 49.9 61.8 46.8 50.6 50.5 43.4 52.1 54.5 45.2 44.8 41.9 44.2 48.2 57.7 66.7 61.0 61.3 58.8 68.2 55.3 59.4 60.4 47.8 52.5 5.1, 5.2 Waste management 0.3 0.7 0.4 1.0 0.5 0.5 0.4 0.4 0.3 0.6 0.3 0.5 0.3 0.5 0.5 0.2 0.6 0.6 0.2 0.6 0.3 0.4 0.4 0.4 5.3, 5.4, 5.6 Environmental protection 6.5 5.5 4.6 3.3 8.1 14.0 7.3 6.8 6.7 5.9 11.4 8.9 3.6 4.8 5.7 5.6 3.5 10.3 4.6 4.2 7.4 5.3 6.7 6.2
5 - Environmental protection 6.8 6.2 5.0 4.3 8.6 14.5 7.8 7.2 7.0 6.5 11.8 9.4 3.9 5.4 6.2 5.8 4.1 11.0 4.7 4.9 7.7 5.7 7.2 6.6
6.2 - Community development 4.7 3.3 6.5 8.0 7.6 4.4 7.9 5.7 3.4 8.0 27.2 11.1 8.2 7.4 4.1 10.3 8.1 8.8 6.3 8.0 6.4 8.1 7.2 7.5 6.3 Water supply 3.7 5.1 4.2 5.1 3.8 2.6 2.7 3.3 1.8 2.7 1.8 2.4 3.4 1.9 6.6 3.6 5.2 2.3 3.0 5.0 7.3 4.6 3.2 3.7 6 - Housing 8.4 8.4 10.7 13.0 11.4 7.1 10.6 9.0 5.3 10.8 29.0 13.6 11.6 9.2 10.7 13.9 13.3 11.1 9.3 13.0 13.8 12.7 10.4 11.3 7 - Health 6.2 3.3 6.7 7.0 4.9 9.2 3.2 6.1 13.9 9.9 2.5 8.0 3.6 3.6 1.6 3.5 2.9 3.1 3.9 5.6 3.3 3.9 7.1 5.9 8 - Recreation, culture and religion 9.0 4.7 7.4 7.5 7.8 6.3 7.2 5.1 6.6 8.2 5.0 7.6 9.0 6.1 4.4 4.2 3.8 3.7 3.0 4.2 4.4 4.0 7.4 6.1
9.1-9.4 Education 8.0 5.3 12.3 9.7 7.3 10.0 7.3 5.3 10.6 10.8 4.7 9.5 9.4 8.4 4.5 7.3 6.1 3.7 6.4 6.2 4.7 6.1 9.5 8.3 9.5 - Education not definable by level (training) 8.0 9.4 6.7 7.8 6.5 6.1 8.4 8.4 8.2 4.1 3.2 5.7 5.0 6.0 4.0 1.4 5.7 6.3 1.8 8.9 5.4 4.7 6.5 5.9
9 - Education 16.0 14.7 19.0 17.5 13.8 16.1 15.7 13.7 18.8 14.9 7.9 15.2 14.4 14.5 8.5 8.7 11.8 10.0 8.2 15.0 10.1 10.9 16.0 14.1 11. R&D 3.6 0.8 4.4 0.1 3.1 3.4 3.5 4.4 3.1 5.0 1.9 2.1 9.3 3.5 1.8 2.9 2.8 2.4 2.5 2.0 1.4 2.4 4.1 3.5 Total 100 100 100 100 100 100 100 100 100 100 100 100 100 100 100 100 100 100 100 100 100 100 100 100 Source: Ismeri Europa processing on Ministry for development data (Conti Pubblici Territoriali - CPT).

143
4.2.4.3. EU Cohesion Policy support to development in the Italian regions The following exhibit presents the ratio between EU Cohesion Policy funds and EfD by region and COFOG. As in the Austrian cases shown above which provides the same level of detail, the variation of the indicator across Italian regions is marked and sometimes the ratio exceeds 100%. This means that the numerators and denominators are not always fully comparable. Consequently, the numbers shown in the exhibit should not be interpreted strictly as a measure of the actual relationship between two financial sums but rather as an indication of the importance of EU Cohesion Policy in certain regions and in relation to certain functions. In Italy, EU Cohesion Policy has been relatively important in relation to economic affairs (particularly agriculture), environmental protection, training, social inclusion and RTDI; to a much more limited extent in relation to health, housing and recreation. As regards agriculture, the contribution of EU Cohesion Policy seems to have been large in certain Objective 2 regions such as Friuli V.G., Tuscany, Veneto, Bolzano and Piedmont. In Objective 1 regions it is also very important in Puglia and more to a more limited extent in Sardinia. In relation to mining, manufacturing and construction, EU Cohesion Policy support was very important in all Objective 1 but also in some Objective 2 regions such as Veneto, Friuli and Umbria. In relation to training, EU Cohesion Policy played a significant role in Lombardy. So far as RTDI is concerned, EU Cohesion Policy does not seem to have been particularly significant in Objective 2 regions (apart from Piedmont and Bolzano) while its contribution was large across Objective 1 regions. It is worth noting, however, that estimating the EU support by means of fields of intervention is sometimes tricky and results should be handled carefully. In the case of Lombardy for instance, most resources cannot be allocated to the various functions determining an underestimate of EU Cohesion support.

144
Exhibit 62 - Comparison between EU Cohesion Policy funds and expenditure for development in Italy (2000-2006) Pied. VDA Lom. Bolz. Tren. Ven. FVG Lig. E.R. Tusc. Umb. Mar. Laz. Abr. Mol. Cam. Pug. Bas. Cal. Sic. Sard. Obj.2 Obj1. TOTAL
4.2 - Agriculture, forestry, fishing and hunting 32.3 6.5 8.2 33.8 0.0 41.4 113.7 8.4 7.9 94.1 0.0 27.8 0.0 19.7 4.5 0.5 172.6 0.1 0.3 0.2 24.8 27.5 19.3 23.2 4.4 - Mining, manufacturing and construction 7.6 0.7 1.1 1.7 0.4 12.3 9.8 7.4 5.0 1.7 9.2 6.0 7.1 3.1 7.8 14.2 17.9 18.3 15.9 15.9 16.9 3.5 22.8 11.4
4.5 - Transport 0.1 0.0 0.5 0.6 0.0 1.0 1.0 0.6 0.1 0.9 0.0 0.5 1.0 2.1 2.5 24.3 15.5 11.8 10.5 18.0 11.7 1.3 7.5 5.5
4.7 - Other industries (tourism) 5.1 1.5 1.7 1.4 0.7 9.6 2.5 5.8 3.9 2.6 1.2 7.1 7.5 5.8 22.0 30.1 17.3 46.5 15.2 25.9 14.4 6.2 13.7 10.9 4 - Economic affairs 6.8 2.4 4.0 6.5 0.7 10.9 16.8 4.5 4.3 8.0 3.1 7.4 5.1 6.4 7.7 22.8 32.0 29.4 15.9 22.0 18.0 8.4 16.4 13.0 5 - Environmental protection 1.0 0.0 1.1 0.1 0.3 1.5 0.2 2.9 1.6 7.0 0.3 5.6 12.0 6.8 11.4 36.3 84.9 28.8 42.4 30.6 50.6 5.6 19.6 15.2
6&8 - Housing and Recreation 3.0 7.2 0.6 0.4 0.4 1.9 1.3 3.1 1.5 2.0 0.3 0.6 1.1 2.1 6.8 6.7 6.7 5.7 11.8 10.3 10.5 2.5 4.7 4.0
7 - Health 0.9 0.0 0.0 0.0 0.5 0.0 0.0 1.3 0.0 1.1 0.0 1.2 2.1 0.1 0.2 6.5 10.2 19.8 4.3 4.0 11.4 1.5 2.2 2.0 9&10 – Education and social inclusion 9.3 3.8 10.7 2.6 3.2 11.5 8.5 10.6 8.7 11.6 11.7 11.4 13.0 10.4 22.7 36.4 41.4 18.0 27.0 20.2 18.0 24.8 10.9 14.8
11. R&D 8.7 1.0 0.0 8.8 0.0 0.8 5.1 1.8 1.2 0.1 0.0 1.9 0.0 0.2 0.6 58.5 46.5 53.2 12.3 45.0 21.8 4.1 14.5 11.8
Total 5.9 3.0 4.1 3.8 0.9 7.1 10.5 4.7 3.9 6.3 2.4 5.8 5.1 5.9 8.8 22.3 30.7 25.0 17.0 19.6 19.0 8.7 12.6 11.1 Numerator: EU Cohesion Policy funds; Denominator: EfD Source: Ministry for development data (Conti Pubblici Territoriali - CPT); DG REGIO data.

145
4.2.5. France There are major problems of producing regional statistics on public expenditure, especially on public investment: - There is no regional breakdown of state expenditure. Recommendations in this regard were
made in a 2007 report of the National Council for statistics, but they have not yet been fully implemented. A regional breakdown of state expenditure is available in relation to “contracts de plan”; these are shown below but they represent only a portion (approximately one sixth) of central government investments.
- There is no breakdown by COFOG function; - There are no related time series.
4.2.5.1. Local investments by region For the reasons mentioned above, most of the figures for France in this section relate to revenue and investment expenditure as well as capital transfers of local public authorities by region. Exhibit 63 - France – Local public authorities in 2005: expenditure and revenues (EUR million and per head) EUR million Per capita
(FR=100)
Expenditure Revenue Financing Needs Expenditure Revenues GDP
Île-de-France 38,594 37,545 1,049 112.4 111.3 155.3 Champagne-Ardenne 3,691 3,526 165 92.0 89.4 91.3 Picardie 4,646 4,837 -191 82.3 87.1 79.6 Haute-Normandie 5,478 5,385 93 101.0 101.0 90.2 Centre 6,671 6,581 90 88.9 89.3 88.7 Basse-Normandie 3,929 3,841 88 90.5 90.1 82.2 Bourgogne 4,324 4,179 145 88.8 87.4 86.5 Nord-Pas-de-Calais 11,374 11,541 -167 93.9 97.0 79.3 Lorraine 6,101 5,967 134 87.1 86.7 82.2 Alsace 5,336 5,147 189 98.2 96.4 93.1 Franche-Comté 3,065 2,971 94 89.3 88.1 85.5 Pays de la Loire 9,001 8,867 134 87.9 88.1 90.9 Bretagne 8,043 8,013 30 87.3 88.5 88.7 Poitou-Charentes 4,613 4,613 0 90.0 91.6 83.6 Aquitaine 8,674 8,949 -275 93.6 98.3 90.2 Midi-Pyrénées 8,093 8,143 -50 98.3 100.7 90.5 Limousin 2,139 2,096 43 98.4 98.2 82.2 Rhône-Alpes 18,483 17,904 579 103.0 101.6 100.4 Auvergne 3,895 3,732 163 97.5 95.1 84.0 Languedoc-Roussillon 7,736 7,745 -9 102.8 104.8 78.5 Provence-Alpes-Côte d’Azur 16,380 15,450 930 114.6 110.0 95.3 Corse 1,566 1,499 67 187.8 183.0 80.4 France de province 143,238 140,986 2,252 96.4 96.6 88.6 France métropolitaine 181,832 178,531 3,301 99.4 99.3 101.1 Départements. d'outre-mer 6,556 6,589 -33 120.0 122.7 58.9 France 188,388 185,120 3,268 100.0 100.0 100.0 Source: Insee from data DGFIP and MEEDDAT. In terms of GDP, there are still marked disparities between French regions: Ile-de-France (Paris region) has the highest level of GDP per head in PPS terms in Europe and accounts for 28% of

146
national GNP. Some other regions also have relatively high levels of GDP per head: Rhône-Alpes (10% of the national total) and Provence-Alpes-Côte-d’Azur. The overseas territories have by far the lowest levels and are still covered by the Convergence Objective of the EU Cohesion Policy. Some metropolitan regions also have relatively low levels of GDP per head (Corse, Limousin, Nord-Pas-de-Calais). Nevertheless, disparities in terms of revenue per capita at local government level are not so marked between regions because of the redistribution of funds which, on average, accounts for 30% of the total. In 2005, revenue in Ile-de-France was a24% above average and in Nord-Pas-de-Calais, 17% below average. Disparities narrowed slightly between 2000 and 2007. There are three types of policy for reducing regional disparities, the first being by far the most powerful: - National legislation for individual access to public services and the social benefits. Social
benefits (minimum income support, old-age pensions, transfers to families etc.) amount on average to 30% of t average personal income. In the poorest metropolitan regions, this proportion can reach 35%. In addition, free services provided in the form of healthcare (hospitals and private medicine) and education (primary, secondary and universities) also effectively add to income, but this has not been quantified.
- Equalisation policy for the allocation of state transfers from the state to local governments. Following legislation on decentralisation, an important part of local government revenue (30% on average) comes from the DGF (dotation générale de fonctionnement), which includes an increasing part for equalisation, determined according to a complex formula. This part, however, amounts to less than 5% of the total.
- Investment policy through the ’contrats de plan’ and the EU Cohesion Policy. The state and the local governments still argue over whether the ’contrats de plan’ should, or should not, be managed as an equalisation tool. In 2000-2006, the state financed 44% of the contract for Ile-de-France, 60% for Nord-Pas-de-Calais and 65% for Limousin, so recognising the disparities between regions. The regional breakdown of resources mobilised by “contracts de plan” are shown in the exhibit below; the values per head show a general orientation of “contracts de plan” towards re-balancing disparities in GDP per capita (Départements D'outre-Mer, Corse, Nord pas de Calais) even if some of the low income regions (Languedoc, Picardie) are not strongly supported though this instrument.

147
Exhibit 64 – “Contracts de Plan” between the State and Regions (total of programmes; end of 2006)
REGIONS 2000-2006 (thousands of EUR) %
“Contracts de plan” per head
(France=100)
GDP per Head (France=100)
Alsace 496,233 2.5 88.2 93.1 Aquitaine 814,963 4.2 85.3 90.2 Auvergne 431,876 2.2 103.6 84.0 Bourgogne 405,491 2.1 79.6 86.5 Bretagne 958,125 4.9 100.8 88.7 Centre 574,298 2.9 73.5 88.7 Champagne ardennes 402,232 2.1 95.5 91.3 Corse 241,820 1.2 281.8 80.4 Franche comte 372,600 1.9 104.3 85.5 Ile de france 3,065,610 15.7 86.4 155.3 Languedoc roussillon 723,484 3.7 94.0 78.5 Limousin 379,388 1.9 167.2 82.2 Lorraine 1,023,579 5.2 139.7 82.2 Midi pyrenees 898,895 4.6 106.3 90.5 Nord pas de calais 1,657,749 8.5 131.0 79.3 Basse normandie 576,779 3.0 127.3 82.2 Haute normandie 552,447 2.8 97.6 90.2 Pays de la loire 787,855 4.0 74.6 90.9 Picardie 485,563 2.5 82.3 79.6 Poitou charentes 606,113 3.1 114.1 83.6 Provence alpes côte d’azur 1,163,271 6.0 78.9 95.3 Rhône alpes 1,330,130 6.8 71.9 100.4 Guadeloupe 226,648 1.2 164.5 59.5 Guyane 187,155 1.0 151.9 66.1 Martinique 194,165 1.0 325.2 49.8 Reunion 329,180 1.7 138.1 54.5 Total (regional) 18,885,649 96.8 Total (interregional) 623,299 3.2 Total (general) 19,508,948 100.0 100.0 100.0 Source: DIACT, Eurostat As showed in the exhibit below, investments by local authorities are around 20% of their total expenditure and this percentage is relatively stable across regions, with the exception of the Île-de-France (16%). Investment of local authorities amounted to 2% of GDP in 2005, while capital transfers were 0.3%. Again, Île-de-France has the lowest value (1.3%) and Corse the highest (5.5%).

148
Exhibit 65 - France – Local public Authorities in 2005: investment and capital transfers (EUR million, % of GDP and per capita)
Gross fixed capital
formation
Capital Transfers
paid
Gross fixed Capital
formation on total
expenditure
Gross fixed
Capital formation
Capital Transfers
paid
Gross fixed
Capital formation
Capital Transfers
paid
EUR million % As % of GDP Per person (FR=100) Île-de-France 6,339 1,192 16.4 1.3 0.2 83.8 145.8 Champagne-Ardenne 949 118 25.7 2.8 0.4 107.3 123.4 Picardie 906 111 19.5 2.2 0.3 72.8 82.5 Haute-Normandie 1,323 145 24.2 2.9 0.3 110.7 112.2 Centre 1,598 187 24.0 2.6 0.3 96.7 104.7 Basse-Normandie 874 151 22.2 2.7 0.5 91.4 146.0 Bourgogne 936 70 21.6 2.4 0.2 87.3 60.4 Nord-Pas-de-Calais 2,351 69 20.7 2.7 0.1 88.1 23.9 Lorraine 1,470 188 24.1 2.8 0.4 95.2 112.6 Alsace 1,266 268 23.7 2.7 0.6 105.8 207.1 Franche-Comté 780 65 25.4 2.9 0.2 103.2 79.5 Pays de la Loire 2,160 172 24.0 2.5 0.2 95.8 70.5 Bretagne 1,948 205 24.2 2.6 0.3 96.0 93.4 Poitou-Charentes 1,032 79 22.4 2.6 0.2 91.4 64.7 Aquitaine 2,027 154 23.4 2.6 0.2 99.3 69.8 Midi-Pyrénées 2,011 111 24.8 2.9 0.2 110.9 56.6 Limousin 497 68 23.2 3.0 0.4 103.8 131.4 Rhône-Alpes 4,772 586 25.8 2.9 0.4 120.8 137.1 Auvergne 1,054 97 27.1 3.4 0.3 119.8 101.9 Languedoc-Roussillon 1,864 74 24.1 3.4 0.1 112.5 41.3 Provence-Alpes-Côte d’Azur 3,639 403 22.2 2.9 0.3 115.6 118.4
Corse 335 17 21.4 5.5 0.3 182.4 85.6 France de province 33,792 3,338 23.6 2.8 0.3 103.2 94.3 France métropolitaine 40,131 4,530 22.1 2.4 0.3 99.6 104.0 Départements. d'outre-mer (obj.1) 1,369 -42 20.9 4.6 -0.1 113.7 -32.3
France 41,500 4,488 22.0 2.4 0.3 100.0 100.0 Source: Insee from data DGFIP and MEEDDAT. The investment of local authorities does not seem to have a clear convergence aim: with a low per capita levels in Île-de-France, but a high value in Rhône-Alpes, and a high per capita level in Corse and Languedoc-Roussillon, but a low level in Picardie and in Nord-Pas-de-Calais. During the 2000-2006 period, only the overseas regions (Réunion, Guadeloupe, Martinique and Guyane) were included in Objective 1; in 2005, investment of local public authorities amounted to 4.6% of GDP and in per capita terms was 14% higher than the national average. 4.2.5.2. Support of the EU Cohesion Policy to French regions The contribution the EU Cohesion Policy to regional investment can be regarded as being strongly linked to that of the ‘contrats de plan’, since the two procedures are integrated at the regional as at the national level. Objective 1 and Objective 2 regions need to be considered separately.

149
In the former (the four overseas regions, as well as Corse and Hainaut in 2000-2006), the amount invested was relatively large as compared with total public capital expenditure. The result seems to have been favourable, since economic growth was relatively higher in all of the regions. From the evaluation reports produced in 2006 and 2007 for DIACT, it is still difficult to assess the detailed effect by region and by function, since the reports are more qualitative than quantitative. It remains particularly difficult to isolate EU and CPER effects from that produced by indirect aids given to overseas regions and Corse (especially the large tax exemptions and special benefits for civil servants). As regards Objective 2 regions, the evaluation reports are too weak to assess the effect of EU Cohesion Policy. This can partly be explained by the relatively small share of EU support as compared with total investment for development. The following exhibit presents the ratio between EU Cohesion Policy and expenditure for development in French regions. The latter has been estimated on the basis of the sum of investments of local authorities and “contracts de plan” resources, which represent only a small share of total central government expenditure for development. The ratio is on average equal to 12% in Objective 1 and nearly 3% in Objective 2 regions. Exhibit 66 - Comparison between EU Cohesion Policy funds and expenditure for development in France (2000-2006)
Regions % Alsace 1.2Aquitaine 3.1Auvergne 3.6Basse-Normandie 3.4Bourgogne 3.4Bretagne 2.8Centre 1.6Champagne-Ardenne 2.9Corse 6.7Franche-Comté 3.4Haute-Normandie 3.2Île de France 0.4Languedoc-Roussillon 2.2Limousin 3.2Lorraine 3.6Midi-Pyrénées 2.8Nord - Pas-de-Calais 5.9Pays de la Loire 2.5Picardie 4.0Poitou-Charentes 3.4Provence-Alpes-Côte d'Azur 1.2Rhône-Alpes 1.1Départements. d'outre-mer 23.4Total 2.9Numerator: EU Cohesion Policy except ESF (average 2000-2006); Denominator: GFCF and Capital Transfer of local authorities (2005) plus “contracts de plan” (average 2000-2006). Source: DIACT; DG REGIO data.

150
4.2.6. The UK59 The division of responsibility for development expenditure varies between broad functions, or policy areas. This can most clearly been seen in the UK if Scotland, Wales and Northern Ireland are examined separately from the English regions given the additional layer of government in the former. In Scotland, therefore, the regional government (the Executive of the Parliament) accounts for some 60% of total development expenditure, with local authorities in Scotland accounting for most of the remaining amount (for almost a third of the total, see exhibit below). The Scottish government is, therefore, responsible for over 90% of expenditure on Science and technology and Housing and community amenities and for virtually 100% of spending on Health care, while the central government in the UK is responsible for all of capital spending on employment policies (which is only a small amount – see below) and over 60% of that on Environmental protection, but relatively little of spending on any other category. Local authorities, on the other hand, are responsible for most of capital expenditure on Recreational and cultural amenities and Education and for over 40% of that on Enterprise development and Agriculture. Exhibit 67 - UK - Division of gross capital expenditure between authorities by function, Scotland, 2008-09 (% expenditure on each item)
Central Regional Local 4.1 Enterprise+economic development 13,8 42,9 43,2 4.2 Science and technology 8,9 91,1 0,0 4.3 Employment policies 100,0 0,0 0,0 4.4 Agriculture, fisheries, forestry 0,1 51,1 48,8 4.5 Transport 9,3 51,1 39,5 5. Environmental protection 62,2 6,6 31,2 6. Housing and community amenities 0,0 93,1 6,9 7. Health 0,6 99,4 0,0 8. Recreation, culture and religion 8,2 10,9 80,9 9. Education 0,4 27,6 72,0 Total 7,7 60,3 32,0 Note: Regional=Scottish Government Source: HM Treasury Exhibit 68 - UK - Division of capital expenditure between functions by level of government, Scotland, 2008-09 (% expenditure on each item)
Central Regional Local % Total 4.1 Enterprise+economic development 9,7 3,9 7,3 5,4 4.2 Science and technology 1,3 1,8 0,0 1,2 4.3 Employment policies 0,8 0,0 0,0 0,1 4.4 Agriculture, fisheries, forestry 0,0 1,8 3,3 2,2 4.5 Transport 31,5 22,2 32,4 26,2 5. Environmental protection 49,7 0,7 6,0 6,2 6. Housing and community amenities 0,0 44,4 6,2 28,7 7. Health 0,8 17,7 0,0 10,8 8. Recreation, culture and religion 5,3 0,9 12,7 5,0 9. Education 0,8 6,6 32,2 14,3 Total 100,0 100,0 100,0 100,0 Note: Regional=Scottish Government Source: HM Treasury
59 See Annex 3 for a description of the difficulties of compiling data on development expenditure in the UK. These difficulties are also applicable to other countries, though in most case to a lesser extent.

151
Data on the division of expenditure between the broad functions indicate that over half of capital expenditure for development in Scotland is accounted for by two functions – Housing and community amenities and Transport, which together make up two-thirds of Scottish government spending, while health adds another 18%. In Wales, the division of capital expenditure between the levels of government is similar to that in Scotland, though the Executive of Welsh Assembly accounts for a slightly smaller proportion and local authorities in Wales for a slightly larger one. The regional government is responsible for much more of expenditure than in Scotland on Enterprise development and Agriculture and for much less of that on Transport and for none of the capital spending on Science and technology. Environmental protection, moreover, is much more under the responsibility of local authorities than in Scotland. The division of expenditure between broad functions is also similar to that in Scotland, with much of capital spending going to Transport, Housing and community amenities and Health care. However, enterprise development accounts for much of the overall spending of the regional government in Wales. Exhibit 69 - UK - Division of gross capital expenditure between authorities by function, Wales, 2008-09 (% expenditure on each item) Central Regional Local 4.1 Enterprise+economic development 9,4 88,5 2,14.2 Science and technology 100,0 0,0 0,04.3 Employment policies 2,2 97,8 0,04.4 Agriculture, fisheries, forestry 0,1 77,3 22,54.5 Transport 27,4 29,5 43,05. Environmental protection 9,7 17,7 72,66. Housing and community amenities 0,0 58,6 41,47. Health 0,6 99,4 0,08. Recreation, culture and religion 12,5 10,8 76,79. Education 0,8 24,0 75,2Total 9,0 54,5 36,6Note: Regional=Welsh Assembly Government Source: HM Treasury Exhibit 70 - UK - Division of capital expenditure between functions by level of government, Wales, 2008-09 (% Total expenditure)
Central Regional Local % Total 4.1 Enterprise+economic development 9,1 14,1 0,5 8,7 4.2 Science and technology 1,0 0,0 0,0 0,1 4.3 Employment policies 0,9 6,8 0,0 3,8 4.4 Agriculture, fisheries, forestry 0,0 2,9 1,3 2,0 4.5 Transport 76,7 13,6 29,4 25,0 5. Environmental protection 1,1 0,3 2,0 1,0 6. Housing and community amenities 0,0 23,9 25,1 22,2 7. Health 1,1 31,0 0,0 17,0 8. Recreation, culture and religion 8,9 1,3 13,3 6,4 9. Education 1,2 6,1 28,4 13,8 Total 100,0 100,0 100,0 100,0 Note: Regional=Welsh Assembly Government Source: HM Treasury

152
In Northern Ireland, the division of responsibilities is somewhat different than in the other two regions, the regional government (the Executive arm of the Northern Ireland assembly) carrying out a much larger share of total sending on development – for 90% of the total. Only in Environmental protection and Recreation and culture does the regional government not account for most of capital spending. The division of development expenditure is also slightly different, with much more going to Housing and community amenities and less going to Transport. Exhibit 71 - UK - Division of gross capital expenditure between authorities by function, Northern Ireland, 2008-09 (% expenditure on each item) Central Regional Local 4.1 Enterprise+economic development 15,6 74,9 9,5 4.2 Science and technology 13,0 87,0 0,0 4.3 Employment policies 0,0 100,0 0,0 4.4 Agriculture, fisheries, forestry 0,0 100,0 0,0 4.5 Transport 1,1 98,9 0,0 5. Environmental protection 3,0 3,8 93,2 6. Housing and community amenities 0,0 95,4 4,6 7. Health 0,4 95,6 4,0 8. Recreation, culture and religion 7,5 40,8 51,8 9. Education 0,3 99,7 0,0 Total 1,5 90,5 8,0 Note: Regional=Northern Ireland Department Source: HM Treasury Exhibit 72 - UK - Division of capital expenditure between functions by level of government, Northern Ireland, 2008-09 (% Total expenditure)
Central Regional Local % Total 4.1 Enterprise+economic development 37,3 2,9 4,2 3,6 4.2 Science and technology 3,1 0,3 0,0 0,4 4.3 Employment policies 0,0 0,1 0,0 0,1 4.4 Agriculture, fisheries, forestry 0,1 6,0 0,0 5,4 4.5 Transport 11,9 17,7 0,0 16,2 5. Environmental protection 3,3 0,1 19,2 1,6 6. Housing and community amenities 0,0 40,2 22,0 38,2 7. Health 3,3 12,3 5,8 11,6 8. Recreation, culture and religion 37,8 3,4 48,8 7,6 9. Education 3,3 17,0 0,0 15,4 Total 100,0 100,0 100,0 100,0 Note: Regional=Northern Ireland Departments Source: HM Treasury The division of responsibility for development expenditure in the English (NUTS 1) regions is different again. Overall, the central government accounts for just over 60% of total capital expenditure in the policy areas concerned (and closer to 70% if current expenditure on training is also included). It is particularly important as regards Science and technology (or RTD), Employment policies and Health services, for all of which it accounts for 95% or more of capital expenditure undertaken in the English regions, while for Enterprise environment and business support, it is responsible for just under 90% of spending and for Environmental protection, for just over 80%. In the case of Health services, much of the expenditure on the ground is channelled through Regional Health Authorities, while for Housing, Housing Associations, which are responsible for the provision of social housing, play an important role.

153
Exhibit 73 - UK - Division of capital expenditure between functions by level of government, English regions, 2008-09 (% expenditure on each item) Central Local4.1 Enterprise+economic development 87,9 12,1 4.2 Science and technology 100,0 0,0 4.3 Employment policies 95,9 4,1 4.4 Agriculture, fisheries, forestry 55,6 44,4 4.5 Transport 57,8 42,2 5. Environmental protection 81,5 18,5 6. Housing and community amenities 72,3 27,7 7. Health 97,9 2,1 8. Recreation, culture and religion 17,1 82,9 9. Education 31,2 68,8 Total 62,3 37,7 Source: HM Treasury The role of local authorities is particularly important as regards Recreational and cultural activities, where they account for over 80% of expenditure, and Education, where they are responsible for just under 70% of total capital spending, though central government in the form of the Regional Development Authorities (RDAs) are responsible for a large part of spending on training, especially outside the mainstream system (i.e. for continuing training, training for the unemployed and adult education). Local authorities also account for a significant part of capital expenditure on Transport (over 40% of the total in the English regions), most of it going on local roads, and on Agriculture (almost 45% of the total). As in Scotland and Wales, Transport and Housing and Community amenities absorb a significant proportion of total development expenditure (around half), while Education adds a further 20%. Expenditure on environmental protection represents only a small part of total capital spending in the English regions, much of it going on reducing pollution and waste disposal. It accounts, however, for a substantial part of RDA capital expenditure (over a third). Exhibit 74 - UK - Breakdown of gross capital expenditure between central and local government by broad function, English regions, 2008-09(% Total expenditure) Central Local Total4.1 Enterprise+economic development 9,7 2,2 6,9 4.2 Science and technology 1,0 0,0 0,6 4.3 Employment policies 0,1 0,0 0,1 4.4 Agriculture, fisheries, forestry 0,5 0,7 0,6 4.5 Transport 24,3 29,4 26,2 5. Environmental protection 7,4 2,8 5,6 6. Housing and community amenities 27,6 17,5 23,7 7. Health 18,1 0,6 11,5 8. Recreation, culture and religion 1,2 9,7 4,4 9. Education 10,2 37,2 20,4 Total 100,0 100,0 100,0 Source: HM Treasury, pesa 2009 and author's estimates Current expenditure on training which is eligible for Structural Fund support (for continuing training and that which is part of active labour market policies – not shown in the exhibit above) represents only a relatively small part of overall expenditure on education at regional level, but for much of the spending which is directly under central government control. RDAs play a important part in managing the expenditure, working with training providers in the regions to implement the Government’s National Skills Strategy and supporting measures to increase the employability of disadvantaged groups.

154
4.2.6.1. The relative scale of development expenditure across regions Development expenditure per head of population and in relation to GDP varies across regions in the UK. Relative to population, it is particularly high in London, though this to some extent reflects the relatively high costs of expenditure in the capital as compared with other parts of the UK. In relation to GDP, it is no higher than the average for the UK, though this also reflects the high level of GDP in the region. In these terms, the highest level of expenditure is in Northern Ireland (5% of GDP in 2008-09), followed by the two Northern English regions and Scotland, with the lowest level in the South-East. Development expenditure has trended to increase over time relative to GDP in all regions, though more so in Yorkshire and Humberside and Wales than elsewhere. Exhibit 75 - UK - Development expenditure per head and relative to GDP in UK regions
2002-03 2003-04 2004-05 2005-06 2006-07 2007-08 2008-09 £ per inhabitant East Midlands 350 386 433 449 471 471 608 London 652 795 825 895 981 1138 1232 North East 465 550 578 651 667 661 777 North West 469 502 542 582 708 771 898 South East 405 419 449 494 530 537 590 South West 333 356 393 458 474 497 581 West Midlands 386 444 476 506 565 550 649 Yorks+Humberside 446 431 486 539 573 561 650 Eastern 329 351 378 454 468 492 570 Northern Ireland 424 471 635 674 658 833 957 Scotland 480 447 526 765 883 929 935 Wales 404 365 417 484 585 619 624 UK 437 471 515 583 640 680 762 % GDP East Midlands 2,1 2,2 2,4 2,4 2,4 2,3 2,9 London 2,2 2,6 2,5 2,6 2,7 3,0 3,2 North East 3,3 3,7 3,7 4,0 3,9 3,6 4,1 North West 2,9 3,0 3,1 3,2 3,7 3,8 4,3 South East 2,1 2,0 2,1 2,2 2,3 2,2 2,4 South West 2,0 2,0 2,1 2,4 2,4 2,4 2,7 West Midlands 2,4 2,6 2,7 2,8 3,0 2,8 3,2 Yorks+Humberside 2,8 2,6 2,8 3,0 3,1 2,9 3,2 Eastern 1,9 1,9 2,0 2,3 2,3 2,3 2,6 Northern Ireland 2,9 3,1 3,9 4,0 3,7 4,5 5,0 Scotland 2,8 2,5 2,8 3,8 4,2 4,2 4,1 Wales 2,9 2,5 2,7 3,1 3,6 3,6 3,5 UK 2,4 2,5 2,6 2,8 2,9 3,0 3,2 Source: HM Treasury plus author's estimates to adjust to gross terms
4.2.6.2. Support of the EU Cohesion Policy to the UK regions It is far from straight-forward to relate development expenditure in the UK regions to the finance received from the EU Cohesion Policy. This is partly because of differences in the system for classifying expenditure but also because of a lack of data on development expenditure which can be compared directly with the support provided by the EU Cohesion Policy in different policy areas. While it is possible, therefore, to identify the finance from the EU Cohesion Policy that went into the different regions and to relate the ERDF element of this to the capital expenditure for development undertaken in the region by central government or regional and local authorities, it is

155
not possible from the data available – or, more accurately, it is possible, but not meaningful – to relate the finance received from the other funds (the ESF and the EAGGF, in particular), to the national expenditure undertaken in the policy areas in question. There is a lack of data, in other words, on expenditure on the items eligible for support from the funds concerned. The analysis here, therefore, is confined to assessing the scale of support received by the UK regions from the ERDF in relation to development spending, which is here defined, as above, as capital expenditure (capital transfers as well as capital formation) in relevant policy areas. There is also a lack of UK data on expenditure at NUTS 2 level, which is the focus of Structural Fund support, at least under the former Objective 1 and the present Convergence Objective. This is to a large extent because the funds are administered at a NUTS 1 rather than NUTS 2 level – and accordingly it is most appropriate to analyse the regional incidence of support at this level – and because NUTS 2 regions in the UK are largely a statistical artefact with very limited political and administrative significance. The analysis here, therefore, as elsewhere in the study is conducted at a NUTS 1 level. In the programming period 2000-06, the UK received in total some EUR 8.6 billion from the ERDF which went to both Objective 1 and Objective 2 regions, the larger part of it to the Objective 1 NUTS 2 regions in the North West (Merseyside), Yorkshire and Humberside (South Yorkshire), the South-West (Cornwall and the Isles of Scilly), Scotland (the Highlands and Islands), Wales (West Wales and the Valleys) and Northern Ireland. The ERDF finance going into these regions was, accordingly, on a larger scale than into the other regions in the UK. Over the 2000-2006 period – or more precisely, over the period 2002-03 to 2006-07 for which data on development expenditure by region are available – support from the ERDF amounted to an average of just under 3% of development expenditure a year in the UK as a whole and around 2% of expenditure in England (see exhibit below). It was in general most important in the regions listed above which were in receipt of Objective 1 support. The ERDF, therefore, accounted for some 4-5% of development expenditure in the North West and Yorkshire and Humberside, just over 5% in Northern Ireland and almost 10% in Wales. In the South-West, however, it amounted to only just over 2% of development expenditure and in Scotland, to just 3%, in both cases reflecting the relatively small population size of the regions receiving Objective 1 assistance. Elsewhere, the ERDF contributed some 4% of total development expenditure in the North East and almost 3% in the West Midlands, both old industrial regions, but less than 1% in the East and London and only 0.1% in the South East, the last two being by some way the most prosperous regions in the UK. In the present programming period, the scale of support is significantly less than in the previous one, as would be expected given the substantial funding going to regions in the EU12 Member States without any increase in the overall budget for Cohesion Policy.

156
Exhibit 76 - UK - Support from the ERFD in relation to development expenditure in UK regions 2002-03 to 2006-07 2007-08 2008-09 ERDF support (£ million) England 556,4 373,1 410,8 North West 169,9 107,3 110,3 North East 59,9 34,6 41,0 Yorks+Humberside 125,4 87,0 88,2 East 15,5 10,2 12,1 East Midlands 35,6 24,7 29,3 West Midlands 71,6 36,8 43,7 South East 4,8 2,2 2,6 London 25,5 16,7 19,9 South West 48,2 53,6 63,6 Scotland 94,1 54,1 60,8 Wales 125,0 121,8 144,6 Northern Ireland 52,7 28,2 33,5 UK 828,1 577,3 649,7 Development expenditure (£ million) England 26305,2 33355,1 33357,8 North West 3840,1 5295,2 5295,8 North East 1490,0 1694,9 1695,0 Yorks+Humberside 2518,4 2906,9 2907,1 East 2171,0 2784,7 2784,9 East Midlands 1800,1 2071,0 2071,3 West Midlands 2548,9 2962,9 2963,3 South East 3722,1 4460,2 4460,6 London 6185,5 8608,0 8608,3 South West 2029,2 2571,3 2571,6 Scotland 3156,0 4785,7 4842,6 Wales 1304,0 1843,9 1866,5 Northern Ireland 985,8 1459,2 1687,9 UK 31750,9 41443,8 41754,9 ERDF as % Development expenditure England 2,1 1,1 1,2 North West 4,4 2,0 2,1 North East 4,0 2,0 2,4 Yorks+Humberside 5,0 3,0 3,0 East 0,7 0,4 0,4 East Midlands 2,0 1,2 1,4 West Midlands 2,8 1,2 1,5 South East 0,1 0,0 0,1 London 0,4 0,2 0,2 South West 2,4 2,1 2,5 Scotland 3,0 1,1 1,3 Wales 9,6 6,6 7,7 Northern Ireland 5,3 1,9 2,0 UK 2,6 1,4 1,6 Note: The data for development expenditure relates to capital spending only (measured gross of capital receipts). The data are on a UK financial year basis (April-March), whereas the ERDF data are on a calendar year basis. It is assumed, however, that this affects the results only marginally if at all. Source: ERDF data from DG Regio for 2000-06 and from HM Treasury for the subsequent two years. Development expenditure data are based on HM Treasury pesa statistics but involve some estimation.

157
Overall, therefore, support from the ERDF to UK regions, according to UK Government figures, amounted to some EUR 844 million in 2007 and around EUR 816 million in 2008. In terms of national currency, however, the total amount in 2008 was larger than in 2007 because of the marked depreciation of sterling against the euro. In both years, the total received was equivalent to around 1.5% of development expenditure in the UK and to just over 1% in England. Again the largest amount in relative terms went to Wales (reflecting the support under the Convergence Objective going to West Wales and the Valleys), where it accounted on average for just over 7% of expenditure, around 25% less than in the previous programming period. The next largest amount in these terms went to Yorkshire and Humberside (because of support going to South Yorkshire), where it made up 3% of development expenditure. Relatively large amounts, as in the previous programming period, also went to the North West, the North East and the South West, especially to the last where, because of the support going to Cornwall and the Isles of Scilly, ERDF financing amounted to much the same proportion of development expenditure as in the earlier period. In Scotland, however, there was a marked reduction in ERDF support, to only just over 1% of development expenditure, as there was in Northern Ireland, to around 2% from over 5% in the previous period. Once again, the more prosperous regions of the East of England, London and the South-East, received relatively little funding, this accounting for only just over half the share of development expenditure as in the earlier period. As indicated above, it is not possible from the data available to say much about the relative scale of support from the EU Cohesion Policy to expenditure in the different policy areas. It seems, however, that in the case of Transport, the ERDF amounted, on average, to less than 1% of investment across UK regions in the last programming period, as was the case in Housing and community amenities, while it appears to have been slightly more important as regards Environmental protection, where it is estimated to have accounted for around 2.5% of expenditure in the UK regions. Nor, as also noted, is it possible to assess the scale of support from the ESF in relation to national expenditure in the regions, though it is possible to give an indication of the amount going to the various UK regions in 2007 and 2008 as compared with the amount of the ERDF. According to the indicative figures published by the UK Government, the ESF allocated to the UK amounted to just under EUR 680 million in 2007 and to around EUR 660 million in 2008. Accordingly, the total sum received in the two years was only a little smaller than the ERDF support received, the ESF accounting for around 45% of the total received by the UK from the two funds (see exhibit below). As might be expected, the relative importance of the ESF as compared with the ERDF at regional tends to vary with the scale of the latter, being smaller in Wales, which received the most support from the ERDF, than in the London or the South-East which received the least. The ESF, therefore, made up 90% of the overall finance from the EU Cohesion Policy going to the South-East and almost three-quarters of the total going to London. The relationship, however, is not systematic, with, in particular, the ESF making up a marginally larger share of overall funding going to Wales than going to Scotland.

158
Exhibit 77 - UK - Relative scale of the ESF in UK regions 2007 2008
ESF allocation (£ million) England 331,7 372,3 North West 75,0 77,7 North East 22,0 26,1 Yorks+Humberside 58,6 59,5 East 21,2 25,2 East Midlands 22,8 27,1 West Midlands 34,3 40,7 South East 21,1 25,0 London 45,2 53,6 South West 31,3 37,2 Scotland 34,6 39,4 Wales 82,6 98,1 Northern Ireland 15,3 18,1 UK 463,9 527,5 ESF allocation as % ERDF+ESF England 47,1 47,5 North West 41,1 41,3 North East 38,8 38,8 Yorks+Humberside 40,3 40,3 East 67,5 67,5 East Midlands 48,0 48,0 West Midlands 48,2 48,2 South East 90,6 90,6 London 73,0 73,0 South West 36,9 36,9 Scotland 39,0 39,3 Wales 40,4 40,4 Northern Ireland 35,1 35,1 UK 44,6 44,8 Source: UK Government indicative figures Although the contribution of the EU Cohesion Policy to development expenditure in the UK regions might seem small, it is important to bear in mind that what is being compared here is the support provided by the ERDF (and ESF) for regional development with expenditure by national, regional or local authorities in the regions concerned. Whereas the purpose of the ERDF is to help tackle problems which hinder economic advance in the regions assisted, in areas of industrial decline in particular, this is not necessarily the case for much of national expenditure which in many cases will be geared towards national rather than specifically regional objectives. In other words, what is being compared is capital expenditure which happens to take place in a particular region with expenditure which has a specific regional development objective. From this perspective, the ERDF may well contribute more to regional development than would appear from the relative level of funding involved, but how much more – how much the amount of support provided is in practice in relation to the national expenditure directed specifically at regional development – remains an open question.

159
4.2.7. Sweden Sweden's geography, climate and large sparsely populated areas are all taken into account in the Swedish system for regional support. The political objective is to achieve regional equalisation, and reduce existing gaps between the different Swedish regions where some remote and sparsely populated regions have significant disadvantages mainly depending on their geographical location. This has also been one of the reasons for the EU Cohesion Policy support, despite a relatively high level of regional GDP per head. However, the economy's increasing tempo in its restructuring from old fashioned and ineffective basic industries to a cost effective and profitable industries, among other things, using industrial robots and a high level of ICT tools and solutions has ended up in the fact that many industrial jobs have been lost over the years and therefore some regions are suffering from a relatively high unemployment rate by Swedish standards. Some regions have been dependent on basic industries and this has also resulted in a low level of start-ups and an unfavourable environment for entrepreneurship. These facts are also relevant as regards the Swedish system for regional development and supporting and encouraging the establishment of new industries and businesses, new innovations and start-up companies are a top priority in national and regional programmes. In many Swedish regions there is an ongoing debate at political level and in various political assemblies about participation in the new regional system for allocating the regional development funds. This will strengthen the power of political assemblies and give them more influence over the different funds which today are allocated through the County Administrative Board (Central Government) officials, despite their different activities to integrate political influences, achieved through a partnership involving representatives from political assemblies, public officials, University, Trade Unions, Chambers of Commerce and the National Employment Services. A governmental investigation ended up with the conclusion that merging of regions into larger units was beneficial and should also allow elected politicians to take control over the different development funds and programmes. Despite this broad political investigation to create new regions, only two regions have so far been established - Skåne, with Malmö as its centre and the other in western Sweden with Gothenburg as its centre.
4.2.7.1. Public investments in Swedishregions Regional analysis at NUTS 2 level for Sweden is possible with respect to the gross fixed capital formation undertaken by public authorities across the country.

160
Exhibit 78 - Sweden - Gross fixed capital formation by administrative level and region: size and composition
1995-99 (annual average)
2000-06 (annual average)
general local Total general local Total
EUR mn % EUR mn % EUR mn EUR mn % EUR mn % EUR mnSVERIGE 3,254.8 49.8 3,284.1 50.2 6,538.9 3,831.9 50.7 3,732.2 49.3 7,564.1 Stockholm 789.1 59.6 535.1 40.4 1,324.2 1,110.7 60.7 718.6 39.3 1,829.3 Östra Mellansverigen 476.2 47.6 524.0 52.4 1,000.2 555.9 47.7 609.4 52.3 1,165.3 Småland, Öland and Gotland 286.7 47.7 314.2 52.3 600.8 174.5 33.8 341.7 66.2 516.2 Sydsverige 360.5 41.6 506.4 58.4 866.8 444.9 41.1 636.4 58.9 1,081.3 Västsverige 514.5 45.8 607.8 54.2 1,122.2 751.2 49.5 765.3 50.5 1,516.5 Norra Mellansverige 376.0 52.0 347.6 48.0 723.5 273.0 47.3 304.1 52.7 577.1 Mellersta Norrland 237.1 58.0 171.6 42.0 408.7 230.8 63.3 133.7 36.7 364.5 Övre Norrland 214.8 43.6 277.6 56.4 492.3 290.9 56.6 223.1 43.4 514.0 Obj.1 451.9 50.1 449.2 49.9 901.0 521.7 59.4 356.8 40.6 878.5 Obj.2 2802.9 49.7 2834.9 50.3 5637.9 3310.2 49.5 3375.4 50.5 6685.6 Sources: Statistiska Central Byrån (SCB) and Eurostat The exhibit above shows the total breakdown between the different NUTS2 regions in Sweden in the 1995-2006 period. The highest proportion of regional co-financing is in Sydsverige and the lowest in Stockholm. The average ratio is roughly 50 - 50. In the 2000-2006 period public investment rose at 2.6% a year and by slightly more at the central level (3.2%). Northern Objective 1 regions benefited more from central government investment (+14% per year). On average, public investment amounted to 2.7% of GDP, but in Objective 1 regions to 3.5%. Exhibit 79 - Sweden - Gross fixed capital formation by administrative level and region: trend and scale2000-06)
Growth rate % on GDP Per capita (SE=100) central local Total central local Total central local Total SVERIGE 3.2 2.1 2.6 1.4 1.3 2.7 100.0 100.0 100.0 Stockholm 0.0 2.5 0.8 1.4 0.9 2.3 142.4 93.0 117.7 Östra Mellansverigen 5.0 3.0 3.5 1.4 1.5 2.9 86.2 97.0 91.5 Småland, Öland and Gotland -0.4 1.3 0.3 0.8 1.6 2.3 51.6 102.9 76.9 Sydsverige 4.3 4.2 3.7 1.2 1.7 3.0 79.5 117.4 98.3 Västsverige 3.8 3.2 3.3 1.4 1.4 2.8 98.3 102.7 100.5 Norra Mellansverige 4.3 0.4 1.3 1.2 1.4 2.6 76.7 88.2 82.5 Mellersta Norrland 22.2 -3.6 8.2 2.1 1.3 3.4 139.0 86.5 114.5 Övre Norrland 12.7 1.5 7.1 2.0 1.6 3.6 131.1 105.0 118.2 Obj.1 14.2 -1.0 6.9 2.0 1.4 3.5 134.4 97.2 116.6 Obj.2 1.8 2.5 2.1 1.3 1.3 2.6 96.3 100.3 98.2 Sources: Statistiska Central Byrån (SCB) and Eurostat In the 2000-06 period, the regional distribution of central government investment per head was strongly polarised between Stockholm and Objective 1 regions, while local investment was more evenly distributed. The overall distribution favoured Objective 1 regions relative to Objective 2 regions.

161
4.2.7.2. Support of the EU Cohesion Policy to Swedish regions The following exhibit presents the ratio between EU Cohesion Policy funds and public investments by region in Sweden. On average the EU contribution is 10% of public investments in Objective 1 regions and around 1.3% in Objective 2. Exhibit 80 – Comparison between EU Cohesion Policy funds and expenditure for development in Sweden (2000-2006)
Regions % Stockholm 0.1 Östra Mellansverigen 1.1 Småland o öarna 2.4 Sydsverige 0.5 Västsverige 1.0 Norra Mellansverige 6.8 Mellersta Norrland 9.2 Övre Norrland 10.6 Obj.1 (SE32+SE33) 10.0 Obj.2 1.3 SWEDEN 2.3 Numerator: EU Cohesion Policy funds except ESF; Denominator: GFCF Source: Statistiska Central Byrån (SCB); DG REGIO data. In the latter group of regions, the ratio is highest in Norra Mellansverige which is in part covered by the Sodra Skogslanseregionen Objective 1 programme and lowest in the most prosperous areas such as the Stockholm region.

162
4.2.8. Portugal In Portugal, the non-existence of regionalised accounts for the public sector makes territorial analysis very difficult, so requiring the use of some approximation and estimation, as explained below. Territorialised expenditure data are not available in the national accounts statistics: according to INE60currently there is no statistical output by COFOG by region. In addition, regionalised information on public authorities is not available separately. Between 1990 and 1995, some regionalised information was published on gross fixed capital formation and support to investment. However, aside from the fact that this data series no longer exist, it was compiled according to the 1989 NUTS II regional boundaries (which changed considerably in 2002), the pre-ESA95 national accounting system and a previous COFOG classification. Otherwise, INE publishes every year regional accounts statistics, which include gross fixed capital formation by region and by CAE (the Portuguese Classification of Economic Activities, similar to the Statistical Classification of Economic Activities in the European Union – NACE). However, with the CAE classification it is not possible to single out data for the public sector. For example, there is a CAE class for “Public Administration, Defence and Social Security” that does not include education or health and social care services: these are included in their own specific classes, without differentiation between public and private sector.
4.2.8.1. Investment of Central Administration by region Accordingly, as a reference for the investment of Central Administration, the regional annual values of actual expenditure of PIDDAC (Programme of Investment and Development Expenditure of Central Government) can be considered, as they are presented in the annual State General Accounts. The PIDDAC is presented annually in the State Budget Law and includes programmes and budgetary measures, in conjunction with the Great Options of the Plan, CSF III (2000-2006) and the current NSRF (2007-2013), highlighting multiannual charges, the sources of funding (including EU funds) and the regional distribution of programmes and measures, implemented by all branches of Central Government. In addition, the Autonomous Region of Madeira will be examined through the PIDDAR Programme (Programme for Investment and Development Expenditure of Regional Administration) data, between 2002 and 2007, as an example of the weight of the investment of Regional Governments in Central Government investment (S.1311) in the two archipelago regions. For the regional analysis of Local Government capital expenditure (equivalent to sub-sector S.1313), the annual capital expenditure of municipalities was used as a reference, as it is provided by the General Directorate of Local Administration (DGAL). These figures correspond to the aggregation of NUTS II from the data for municipalities and include the purchase of capital goods, capital transfers, financial assets and liabilities and other capital expenditure.
60 Portuguese National Statistics Institute (INE – Instituto Nacional de Estatística)

163
Before proceeding to the analysis of these data, it is important to consider the following: - The two periods are not comparable because territorialized PIDDAC expenditure data are only
available in the State General Accounts from 2006 onward, while the DGAL data available relate to the 2003-2006 period.
- The figures for PIDDAC investment do not correspond exactly to sub-sector S.1311, as they include direct funding from Chapter 50 in the State Budget ("Investment of the Plan"), investment in "Other national Sources”, such as resources, autonomous funds or public enterprises and participation of the EU Cohesion Policy.
- Furthermore, unlike the data from sub-sector S.1311 presented elsewhere in this study, the values of PIDDAC do not include investment of the Regional Governments of the Azores or Madeira;
- There are doubts about the comparability between the values obtained through these sources and between these and the national accounts figures;
- Moreover, in the period in question, there were major changes in the configuration of NUTS II regions, especially of Lisbon, Centre and Alentejo, so there are also doubts about whether the names associated with these two sources actually correspond to the same clusters of municipalities.
Nevertheless, it is considered that the data make it possible to draw an approximate picture of the NUTS II distribution of public investment undertaken by Central Government and Local Authorities in Portugal in recent years. Starting with Central Government investment, analysis of investment per capita shows a higher level in the regions of Lisbon, Alentejo and Algarve. In turn, the lowest per capita investment is in the Autonomous Regions of Madeira and Azores. Over the period under consideration, a gradual trend reduction in PIDDAC investment relative to regional GDP is evident in all regions, reflecting the slowdown in public investment as result of the measures adopted to combat excessive deficits. It should also be noted that this figure has always been higher in Alentejo and lower in Madeira and Azores.
Exhibit 81 - Portugal - Total PIDDAC Investment of Central Administration, by NUTS II, on GDP and per capita (2002-2006) Value Growth
rate On GDP Per capita
(EUR million) Average % % PT=100
NUTS II 2002 2003 2004 2005 2006 2003-06 2002-06 2002-06 PORTUGAL (allocated) 4,268.8 4,042.8 3,912.2 2,988.0 2,300.3 -16.5 2.5 100.0 Norte 1,414.2 1,370.2 1,426.8 993.3 787.0 -15.3 3.0 96.5 Algarve 193.6 189.2 181.7 140.3 98.6 -17.4 2.8 117.6 Centro 714.8 706.2 682.2 663.4 528.3 -9.7 2.4 85.8 Lisboa 1,512.7 1,348.4 1,217.4 879.1 577.4 -23.4 2.1 118.0 Alentejo 382.0 368.9 349.5 250.5 268.9 -10.1 3.4 128.9 Açores 34.7 45.3 41.6 13.1 23.0 4.6 1.1 38.7 Madeira 16.8 14.6 13.0 48.3 17.1 43.0 0.5 29.7 Not allocated 672.1 768.4 653.7 1,278.3 1,225.7 20.0 0.6 29.5 OVERALL TOTAL 4,940.9 4,811.2 4,565.9 4,266.3 3,526.0 -10.6 3.1 129.5
(1) Includes direct funding from Chapter 50 of the State Budget ("Investments of the Plan"), investments in "Other National Sources" such as resources, autonomous funds or public enterprises, and participation of the EU Cohesion Policy. Sources: Ministry of Finance – General Directorate of Budget and Department of Prospective and Planning. A cross-reading of the regional data on Central Administration investment and of the socio-economic characteristics of Portuguese regions suggests the following:

164
- In mainland Portugal, Alentejo, with the lowest level of GDP per head was the largest recipient of Central Government investment in the period;
- The region of Lisbon, with the highest GDP per head, had a high level of PIDDAC investment at the beginning of the period, particularly in terms of investment per head;
- PIDDAC Investment in the Azores and Madeira is the lowest of all the Portuguese NUTS II regions (both regions are classified as Outermost Regions of the EU).
In the Autonomous Regions, investment undertaken by Regional Governments (financed with their own resources, Central Government transfers and EU Cohesion Policy) are relatively large in relation to both GDP and per capita. Considering PIDDAC investment in the Autonomous Region of Madeira in the 2002-2007 period (exhibit above), it is clear that public investment made by Regional Government through PIDDAR is much higher than PIDDAC investment in the mainland regions. Exhibit 82 - Portugal – Change in PIDDAR Madeira Investment (Chapter 50), relative to GDP and per capita (2002-2007)
Indicators 2002 2003 2004 2005 2006 2007 Investment Expenditure (M€) 260.5 303.2 518.9 412 329.3 372.6 Investment Expenditure per capita (€) 1,079.8 1,247.7 2,124.1 1,680.3 1,339.7 1,510.4 Investment Expenditure / GDP (%) 6.7 7.8 12.5 9.5 7.1 7.7 Units: Millions of EUR. Prices: Current. Source: Regional Government of Madeira - Regional Secretary of Planning and Finance - Account Report of the Autonomous Region of Madeira 2007 This difference is mainly explained by the fact that it is an Outermost Region, so receiving significantly higher public investment as a means of reducing the costs related to its island characteristics. As regards Local Government capital expenditure, the relative share going to each NUTS II region reflects, not surprisingly, the influence of factors such as population, land area and the number of municipalities. Exhibit 83 - Portugal - Total Capital Expenditure of Municipalities, by NUTS II (2003-2006)
2003 2004 2005 2006 NUTS II €M % €M % €M % €M % PORTUGAL 3,052 100 2,954.0 100 3,131.7 100 2,761.2 100 Norte 1,002 32.8 964.1 32.6 1,031.1 32.9 906.0 32.8 Centro 163 5.3 171.5 5.8 206.0 6.6 171.9 6.2 Lisboa (1) 808 26.5 752.0 25.5 735.3 23.5 691.8 25.1 Alentejo 623 20.4 607.4 20.6 646.6 20.6 529.5 19.2 Algarve 253 8.3 266.0 9 307.2 9.8 275.2 10 Açores 117 3.8 99.1 3.4 102.0 3.3 87.7 3.2 Madeira 85 2.8 93.9 3.2 103.5 3.3 99.1 3.6 Notes: (1) The Lisboa Region value in 2006 lacks data for the Municipality of Setúbal, which was not available for this year. Source: General Directorate of Local Authorities However, considering Local Government capital expenditure relative to GDP and per capita, it is interesting to note that: - Local Government capital expenditure is particularly important in the Azores, representing more
than 4% of regional GDP in 2003; - Capital expenditure by municipalities in Madeira is less than in the Azores relative to GDP,
mainly because Madeira’s GDP is around EUR 1 billion higher than that of the Azores; - For the same reason, in the wealthier region of Lisbon, this investment relative to GDP is the
lowest in the country, at around 1%;

165
- Municipalities in the Algarve are, on average, responsible for the highest levels of capital expenditure per head, which was continuously above EUR 400 per head in this period.
Exhibit 84 - Portugal - Total Capital Expenditure of Municipalities, by NUTS II, relative to GDP and per capita (2003-2006)
2003 2004 2005 2006 NUTS II €/pc % GDP € pc % GDP €pc % GDP €pc % GDP PORTUGAL 291 2.2 281 2.0 296 2.1 261 1.8 Norte 270 2.6 259 2.4 276 2.5 242 2.1 Centro 341 3.0 316 2.7 309 2.6 290 2.3 Lisboa 227 1.2 220 1.1 233 1.2 190 0.9 Alentejo 330 2.7 347 2.7 401 3.1 360 2.6 Algarve 402 2.9 417 2.9 494 3.3 408 2.6 Açores 487 4.2 411 3.4 421 3.4 361 2.7 Madeira 351 2.2 384 2.3 422 2.4 403 2.1 Source: General Directorate of Local Authorities
4.2.8.2. Support of the EU Cohesion Policy to Portuguese regions The following exhibit presents the ratio between EU Cohesion Policy funds and expenditure for development by region in Portugal. The latter is estimated on the basis of gross fixed capital formation, as set in the programmes of investment and development of central government (PIDDAC), of the regional administration of Madeira (PIDDAR), and by means of capital expenditure of municipalities. On average the ratio amounts to nearly 38% which indicates an strong contribution of EU Cohesion Policy to regional development in Portugal. The ratio is lowest in the phasing out capital region and highest in the Outermost Region of Azores. Exhibit 85 - Comparison between EU Cohesion Policy funds and expenditure for development in Portugal (2000-2006)
Regions (NUTS2) % Norte 44.6 Algarve 47.9 Centro 49.6 Lisboa 19.7 Alentejo 57.5 Açores 121.4 Madeira 29.7 PORTUGAL 37.9 Numerator: EU Cohesion Policy funds except ESF; Denominator: GFCF; sum of PIDDAC, PIDDAR and investment of local government. Source: Ministry of Finance – General Directorate of Budget and Department of Prospective and Planning; General Directorate of Local Authorities; DG REGIO data.

166
4.2.9. Poland
4.2.9.1. Capital expenditure and investment by region in Poland In Poland, between 1999 and 2005, capital expenditure on average increased by 1% a year in real terms. The largest (over 3% a year) increase was in Małopolskie and Wielkopolskie, which have different levels of GDP per capita (respectively low and high relative to the national average). Expenditure61 which cannot be allocated also grew significantly by 11% a year. Public capital expenditure relative to GDP is similar in all the regions at around 2-3%. In 2005, capital expenditure of public institutions in the voivodships of Eastern Poland was among the lowest in Poland. Average per capita spending in the five top performing regions was 28% higher than that in the Eastern Poland voivodships. Exhibit 86 - Poland – General government capital expenditure by regions
Capital expenditure (annual average)
GDP per capita (PL=100)
In value (EUR mn) Growth rate % on GDP per capita
(PL=100) annual average
1999-2005 2000-05 1999-2005 1999-2005 1999-2005 Poland 5,372.0 1.0 3.3 100.0 100.0 Łódzkie 290.8 2.8 2.3 91.0 65.2 Mazowieckie 1,038.9 0.5 2.5 154.5 119.1 Małopolskie 426.6 3.6 2.9 85.9 77.1 Śląskie 586.1 0.5 2.2 108.7 72.5 Lubelskie 220.3 1.1 2.7 69.9 58.8 Podkarpackie 242.6 -0.9 3.2 70.0 67.9 Świętokrzyskie 144.4 0.1 2.8 76.8 65.4 Podlaskie 155.4 2.3 3.3 75.2 75.4 Wielkopolskie 450.6 3.1 2.4 105.7 78.7 Zachodniopomorskie 284.1 -6.9 3.3 97.0 99.1 Lubuskie 144.4 -1.1 3.1 88.9 84.4 Dolnośląskie 599.6 -3.3 3.9 102.5 122.1 Opolskie 140.7 -0.5 3.1 82.4 77.9 Kujawsko–Pomorskie 213.1 0.8 2.2 89.7 60.4 Warmińsko-Mazurskie 157.6 2.6 2.7 77.3 64.6 Pomorskie 276.8 1.1 2.5 98.8 74.5 central gov. not allocated 1,145.6 10.6 0.6 - 17.4 Source: Ministry of Finance, estimates of Gdańsk Institute for Market Economy. Analysis of capital spending split by central and local government points to a gradual increase in the share of the latter. With exception of the Łódzkie region, all other voivodships experienced an increase their own share of public spending. This was especially the case in Lubuskie and Zachodniopomorskie, where the share of local government (total spending by local authorities, associated bodies and Voivodship environmental protection and water management funds) increased by some 35 percentage points. If non-allocated expenditure is left out of account, then spending at local level amounted to nearly 78% of the total. This points to a high level of devolution of capital expenditure. In 2005 the largest local government share was in Śląskie (87.5%) and the smallest in Dolnośląskie (68%). 61 The expenditure of central government which could not be allocated to specific regions includes some secret spending (such as on equipping the army) as well as spending outside the country, while some is spent in ways which do not allow it to be allocated to regions.

167
Exhibit 87 - Poland - Capital expenditure of central and local sector by regions; 1999-2005 Capital expenditure per capita
(annual average PL=100) Local capital expenditure on total (%)
Central Local 1999 2005 2005-1999 Poland 100.0 100.0 55.9 61.7 5.8 Łódzkie 35.5 88.6 78.0 76.7 -1.3 Mazowieckie 90.7 141.0 58.5 72.2 13.7 Małopolskie 49.9 98.5 70.4 76.3 5.8 Śląskie 42.2 95.9 70.4 87.5 17.1 Lubelskie 39.4 74.2 67.2 76.0 8.8 Podkarpackie 40.0 90.0 77.1 85.0 7.9 Świętokrzyskie 30.4 93.3 77.9 85.2 7.3 Podlaskie 56.3 90.5 68.5 76.1 7.6 Wielkopolskie 52.4 99.3 71.4 73.1 1.7 Zachodniopomorskie 101.2 95.8 50.2 85.1 34.9 Lubuskie 62.3 101.4 50.4 84.3 33.9 Dolnośląskie 138.4 108.4 52.4 68.0 15.7 Opolskie 72.8 81.5 59.4 76.1 16.7 Kujawsko–Pomorskie 32.0 82.5 71.6 87.2 15.5 Warmińsko–Mazurskie 41.8 82.6 67.5 81.2 13.7 Pomorskie 37.6 103.1 76.0 83.4 7.3 central gov.not allocated 40.0 - - - - Source: estimates of Gdańsk Institute for Market Economy. Capital expenditure per head shows a tendency to be higher in the more advanced regions as regards both central and local spending. Expenditure for development can be divided by region only in relation to local government spending. In the years 2004-2007, the average per capita expenditure for development in nine voivodships exceeded PLN 500. This group included three regions of Eastern Poland, two regions with average GDP per head and four regions in the best performing group. The highest level expenditure for development undertaken by local government is in the most prosperous regions. Śląskie had the highest spending per capita (an average of PLN 638 over the years 2004–2007), followed by Pomorskie (PLN 595) and Dolnośląskie (PLN 590).

168
Exhibit 88 - Poland - Local expenditure for development by regions Total value
(MEUR) % on GDP
(annual average) per capita PL=100 (annual average)
Growth rate (annual average)
2007 2004-2006 2004-2007 2005-2007 Poland 6,636 1.8 100.0 27.4 Łódzkie 382 1.7 83.2 39.7 Mazowieckie 826 1.2 102.2 16.7 Małopolskie 464 1.9 90.1 9.5 Śląskie 955 2.1 122.8 22.1 Lubelskie 335 2.2 83.0 46.0 Podkarpackie 377 2.7 101.1 35.9 Świętokrzyskie 199 2.8 112.8 12.2 Podlaskie 194 2.4 92.4 75.4 Wielkopolskie 523 1.6 90.4 22.1 Zachodniopomorskie 285 2.0 100.6 27.9 Lubuskie 194 2.3 108.0 89.9 Dolnośląskie 618 1.9 111.7 39.0 Opolskie 164 2.1 90.2 60.5 Kujawsko–Pomorskie 359 1.9 92.7 47.3 Warmińsko–Mazurskie 241 2.0 83.9 72.4 Pomorskie 521 1.9 110.6 45.6 Source: estimates of Gdańsk Institute for Market Economy. Analysis of changes in development expenditure over time shows a high rate of growth in the most recent years (27% a year in the 2005-07 period), especially in the low-income regions, which are gradually reducing the gap with the more prosperous ones: between 2004 and 2007, expenditure for development in Eastern Poland grew faster than in other regions.
4.2.9.2. Support of the EU Cohesion Policy to Polish regions The exhibit below presents a comparison between EU Cohesion Policy support and expenditure for development in Polish regions. The latter is estimated on the basis of total capital expenditure of central and local administrations. Sometimes in the case of Poland, the ratio exceeds 100%. This means that numerator and denominators are not always fully comparable and results depend on the consistency of the classification methods used for measuring the two quantities. As a consequence, the numbers shown in the exhibit should not be interpreted strictly as a measure of the actual relationship between two financial quantities but rather as an indication of the importance of EU Cohesion Policy in certain regions. On average the ratio is very high, indicating a strong contribution of EU Cohesion Policy to regional development in Poland. The ratio is lowest in Dolnośląskie, Wielkopolskie (among the better off regions in terms of GDP per head) and Opolskie, while it is highest in Lubuskie and Warmińsko-Mazurskie (amongst the least well off regions) as well as in Łódzkie and Pomorskie that have a GDP per head slightly below average.

169
Exhibit 89 - Comparison between EU Cohesion Policy funds and expenditure for development in Poland (2004-2006) Regions (NUTS2) % Łódzkie 195.3 Mazowieckie 55.4 Małopolskie 85.2 Śląskie 58.9 Lubelskie 81.4 Podkarpackie 75.6 Świętokrzyskie 74.8 Podlaskie 89.2 Wielkopolskie 55.0 Zachodniopomorskie 93.7 Lubuskie 127.2 Dolnośląskie 50.1 Opolskie 56.3 Kujawsko–Pomorskie 69.2 Warmińsko-Mazurskie 110.8 Pomorskie 104.0 Poland 77.2 Numerator: EU Cohesion Policy funds except ESF; Denominator: Capital expenditure Source: estimates of Gdańsk Institute for Market Economy; DG REGIO data.

170
4.2.10. Hungary In Hungary despite fiscal expansion in recent years, regional disparities did not narrow. Development policy areas in general and regional development policy areas in particular were relative losers from the fiscal policy pursued. The institutional background of regional policy developed somewhat, although the central government, central decision making and central allocation of financial resources has continued to dominate the formulation of regional development policy. The widening regional disparities reflect the main trends of spatial development in Hungary. As the exhibit below indicates, in the period 2000 2007, the dominant economic role of the Central Hungarian Region has not changed. All of the Hungarian regions, including the latter, were eligible for Objective 1 support in the period 2004-2006, but since its GDP per head exceeds 75% of the EU average, the Central Hungarian region lost eligibility for Objective 1 support after 2006. In the West and North-Western part of the country, the regions are relatively developed, while the Eastern and South-Western regions are typically lagging, most of them being in a d peripheral position. In addition, these less developed regions neighbour less developed countries and regions, typically far from r developed agglomerations. Spatial development in Hungary is characterised by a widening divergence with three NUTS 2 regions (Central Hungary, Western Transdanubia, Central Transdanubia) developing faster than the national average, while the other four NUTS 2 regions (Southern Transdanubia, Southern Great Plain, Northern Hungary, Northern Great Plain) lag ever further behind. Besides the geographical position (i.e. the distance from the European core regions) the main factors behind the regional disparities are differences in human capital and physical infrastructure endowment. The characteristics of Hungarian economic growth, with exports of manufactures being the main driver over the past 15 year, widened regional disparities. Because of the uneven distribution of the FDI inflows into manufacturing (85% of the total FDI flowed into the three most developed regions), regional rates of employment also differ markedly. These differences increased continuously in the 1990s and remain wide. The employment rate is generally low in Hungary, but it is much lower in the four less developed NUTS 2 regions than in the three most developed. It is also noticeable that Central Hungary is the only region where business services (and market services in general) are a major source of growth of GDP and employment. The reduction in differences in physical infrastructure endowment (i.e. intensive motorway building projects in the low-income regions) has not had a significant impact on regional disparities: the differences in regional GDP per head and employment still exist, partly because of differences in education levels. Narrowing regional disparities is a priority of development policy. Available data shown in the exhibit below indicate that the financial capacity of local governments to invest differs widely across regions.

171
Exhibit 90 – Hungary: Expenditures of local governments in 2000 and 2005 (EUR million) Total
Expenditure Investment and capital expenditure 2000 2005 2000 2005
MAGYARORSZAG 6,349.4 10,936.0 1,236.7 1,844.9 Budapest 1,429.4 2,304.9 323.0 409.9 Pest 509.2 907.9 112.4 157.1 Central Hungary 1,938.6 3,212.8 435.3 567.1 Fejér 247.6 465.8 51.8 104.5 Komárom-Esztergom 172.9 308.9 27.1 51.4 Veszprém 220.9 389.6 37.7 63.7 Central Transdanubia 641.4 1,164.2 116.7 219.6 Győr-Moson-Sopron 247.8 435.3 39.0 67.5 Vas 160.1 285.6 24.9 47.4 Zala 201.1 347.2 42.8 62.5 Western Transdanubia 609.0 1,068.1 106.7 177.3 Baranya 220.8 423.6 29.3 74.6 Somogy 227.8 407.2 40.2 63.5 Tolna 142.4 256.8 26.3 45.9 Southern Transdanubia 591.0 1,087.6 95.7 184.1 Borsod-Abaúj-Zemplén 475.4 861.7 69.4 146.6 Heves 206.1 348.6 53.0 68.5 Nógrád 152.3 227.1 42.1 32.3 Northern Hungary 833.8 1,437.4 164.6 247.4 Hajdú-Bihar 291.8 551.9 39.5 93.9 Jász-Nagykun-Szolnok 279.3 417.1 63.6 53.2 Szabolcs-Szatmár-Bereg 374.4 626.6 72.9 73.0 Northern Great Plain 945.6 1,595.6 179.9 220.1 Bács-Kiskun 300.5 498.5 54.4 68.6 Békés 239.6 409.7 38.8 65.5 Csongrád 249.8 462.2 44.5 95.3 Southern Great Plain 789.9 1,370.3 137.8 229.4 Source: HCSO, Regional Statistics, 2000 and 2005. Investment of local government amounted to 20% of total expenditure in 2000 and declined to 16% in 2005 (these percentage are similar in all regions, the highest share being in Budapest in 2000 at 23% of the total). Consequently, the growth of the two kinds of expenditure was different and total expenditure grew by more than twice the rate of capital expenditure (see exhibit below). The increase in of total expenditure was similar across regions, while investments was more concentrated and was highest in the western regions of Central and Southern Transdanubia (an increase of over 50%). Exhibit 91 – Hungary: Expenditure of local governments: growth and level relative to GDP Change 2000-05
(%) Relative to GDP
(%)
Total
Expenditures
Capital type expenditures Total Expenditures Capital expenditures
2005 2005 2000 2005 2000 2005 MAGYARORSZAG 38.4 15.3 12.2 12.3 2.4 2.1 Central Hungary 31.9 -3.6 8.7 7.9 2.0 1.4 Central Transdanubia 47.6 54.4 11.6 12.7 2.1 2.4 Western Transdanubia 41.5 32.3 10.4 12.2 1.8 2.0 Southern Transdanubia 50.2 58.4 15.5 18.3 2.5 3.1 Northern Hungary 38.5 16.5 19.5 19.6 3.8 3.4 Northern Great Plain 34.9 -11.5 18.3 18.6 3.5 2.6 Southern Great Plain 39.6 32.6 15.3 17.0 2.7 2.8 Source: HCSO, Regional Statistics, 2000 and 2005; Eurostat for price index and GDP

172
Local government expenditure was on average around 12% of GDP in the two years, but was higher (18-19%) in the low-income regions. Local public investment was around 2% of GDP and as before was highest in the weakest regions. In relation to population, both total expenditure and investment is highest in the Budapest region. Exhibit 92 – Hungary: Expenditure of local governments: per capita indices Total Expenditure per
capita (HU=100) Investments and capital expenditure (HU=100) GDP per capita (HU=100)
2000 2005 2000 2005 2000 2005 MAGYARORSZAG 100 100 100 100 100 100 Central Hungary 109 105 126 110 153 163 Central Transdanubia 92 97 86 108 98 94 Western Transdanubia 98 99 88 98 114 99 Southern Transdanubia 96 102 79 102 75 69 Northern Hungary 103 103 105 106 65 66 Northern Great Plain 98 96 95 78 65 64 Southern Great Plain 93 93 83 92 73 68 Source: HCSO, Regional Statistics, 2000 and 2005; Eurostat for population and GDP The exhibit below indicates another characteristic of development policy. As local governments are responsible mainly for social issue, education and healthcare, investment directed at strengthening economic growth represents a smaller share of their capital budget. Exhibit 93 – Hungary: Public capital expenditure for development (current price, EUR million and %)
2001 2002 2003 2004 2005 2006 2007 Calculated at the official exchange rate
Central government 1 529.4 2 887.7 2 048.8 2 124.0 2 511.1 2 796.6 3 464.8 Local government 415.0 755.1 547.5 614.6 707.0 1 079.0 943.2 General government, total 1 944.4 3 642.8 2 596.3 2 738.6 3 218.1 3 875.6 4 408.0 Calculated in PPS Central government 3 047.0 5 220.8 3 643.0 3 566.6 4 056.9 4 700.4 5 368.5 Local government 826.9 1 365.2 973.4 1 032.1 1 142.1 1 813.5 1 461.5 General government, total 3 873.9 6 586.0 4 616.5 4 598.8 5 199.0 6 513.9 6 830.0
EfD/TCE Central government 40.3 54.3 54.7 46.4 47.7 46.1 72.0 Local government 34.7 41.7 31.5 37.7 36.9 47.5 45.1 General government, total 39.0 51.1 47.3 44.1 44.8 46.5 63.9 Source: HCSO, Ministry of Finance The breakdown of public investment by regional administrative level has remained largely unchanged; the share of local government investment in total public investment was around 43-45% over the period. The figures reflect the high degree of centralisation of Hungarian development policy. Over the period, around 80% of public expenditure on development was conducted, or at least financed, through capital transfers by the central government.
4.2.10.1. Support of the EU Cohesion Policy to Hungarian regions The following exhibit presents the ratio between EU Cohesion Policy funds and expenditure for development by region in Hungary. The latter is estimated on the basis of capital expenditure of local governments.

173
On average, the ratio is high (exceeding 56%) and indicates a strong contribution of EU Cohesion Policy to regional development in this country. The ratio is lowest in Central Hungary (the most prosperous region) and Central Transdanubia while it is highest in Northern Hungary and Northern Great Plain which are the regions with the lowest levels of GDP per head. Exhibit 94 - Comparison between EU Cohesion Policy funds and expenditure for development in Hungary (2004-2006)
Regions (NUTS2) % Central Hungary 39.5 Central Transdanubia 38.5 Western Transdanubia 51.5 Southern Transdanubia 54.8 Northern Hungary 85.0 Northern Great Plain 82.7 Southern Great Plain 64.8 Hungary 56.5 Numerator: EU Cohesion Policy funds except ESF; Denominator: Capital Expenditure Source: HCSO, Ministry of Finance; DG REGIO data.
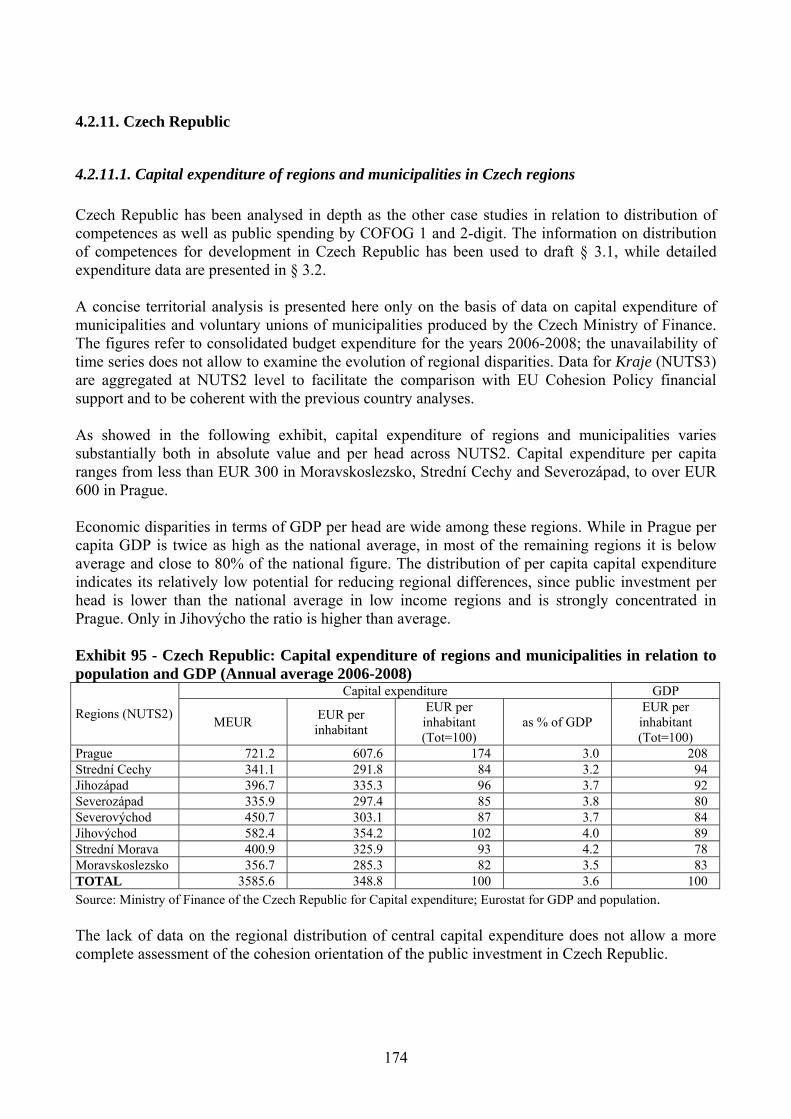
174
4.2.11. Czech Republic
4.2.11.1. Capital expenditure of regions and municipalities in Czech regions Czech Republic has been analysed in depth as the other case studies in relation to distribution of competences as well as public spending by COFOG 1 and 2-digit. The information on distribution of competences for development in Czech Republic has been used to draft § 3.1, while detailed expenditure data are presented in § 3.2. A concise territorial analysis is presented here only on the basis of data on capital expenditure of municipalities and voluntary unions of municipalities produced by the Czech Ministry of Finance. The figures refer to consolidated budget expenditure for the years 2006-2008; the unavailability of time series does not allow to examine the evolution of regional disparities. Data for Kraje (NUTS3) are aggregated at NUTS2 level to facilitate the comparison with EU Cohesion Policy financial support and to be coherent with the previous country analyses. As showed in the following exhibit, capital expenditure of regions and municipalities varies substantially both in absolute value and per head across NUTS2. Capital expenditure per capita ranges from less than EUR 300 in Moravskoslezsko, Strední Cechy and Severozápad, to over EUR 600 in Prague. Economic disparities in terms of GDP per head are wide among these regions. While in Prague per capita GDP is twice as high as the national average, in most of the remaining regions it is below average and close to 80% of the national figure. The distribution of per capita capital expenditure indicates its relatively low potential for reducing regional differences, since public investment per head is lower than the national average in low income regions and is strongly concentrated in Prague. Only in Jihovýcho the ratio is higher than average. Exhibit 95 - Czech Republic: Capital expenditure of regions and municipalities in relation to population and GDP (Annual average 2006-2008)
Capital expenditure GDP
Regions (NUTS2) MEUR EUR per inhabitant
EUR per inhabitant (Tot=100)
as % of GDP EUR per inhabitant (Tot=100)
Prague 721.2 607.6 174 3.0 208 Strední Cechy 341.1 291.8 84 3.2 94 Jihozápad 396.7 335.3 96 3.7 92 Severozápad 335.9 297.4 85 3.8 80 Severovýchod 450.7 303.1 87 3.7 84 Jihovýchod 582.4 354.2 102 4.0 89 Strední Morava 400.9 325.9 93 4.2 78 Moravskoslezsko 356.7 285.3 82 3.5 83 TOTAL 3585.6 348.8 100 3.6 100 Source: Ministry of Finance of the Czech Republic for Capital expenditure; Eurostat for GDP and population. The lack of data on the regional distribution of central capital expenditure does not allow a more complete assessment of the cohesion orientation of the public investment in Czech Republic.

175
4.2.11.2. EU Cohesion Policy support to development in Czech regions The following exhibit presents the ratio between EU Cohesion Policy funds and EfD in Czech regions. The latter is estimated on the basis of budget capital expenditure of regions, municipalities and voluntary unions of municipalities. Exhibit 96 - Comparison between EU Cohesion Policy finds and expenditure for development in Czech Republic (2004-2006) Regions (NUTS2) % Prague 7.3Stredni Cechy 23.5Jihozapad 31.5Severozapad 42.7Severovychod 24.8Jihovychod 23.0Stredni Morava 24.3Moravskoslezsko 30.0TOTAL 23.7Numerator: EU Cohesion Policy funds except ESF; Denominator: Capital expenditure of regions, municipalities and voluntary unions of municipalities. Source: Czech Ministry of Finance; DG REGIO data. On average the contribution of EU Cohesion Policy is significant, considering that the denominator of the ration captures only a share of total capital expenditure. The ratio ranges from approximately 7% in the Objective 2 capital region to over 40% in Severozapad, among the areas with the lowest per capita GDP.

176
4.3. FINAL CONSIDERATIONS ON CHAPTER 4 A number of points emerge from the analysis of the regional distribution of expenditure for development. 1. The trends in public investment have been very different across Member States both at national and regional level. National choices, more than a common cycle, underlie these trends. As a consequence, EU Cohesion Policy co-existed with very different national contexts in terms of public investment growth. 2. In recent years, development expenditure has tended to grow by less in Objective 1 regions than elsewhere in the countries examined. As shown in the exhibit below, EfD62 has declined in Portugal, Germany and Italy and has been lower than in Objective 2 regions in Spain. Growth in the Objective 1 region in Austria was not particularly relevant; though in Poland and Hungary, public expenditure expended and this tend to favour less developed regions where public infrastructure endowment was deficient. Exhibit 97 - Annual average change in real terms in development expenditure in the selected countries by level of government
Government Country Objectives 2000-2006 Central State Local General Years
obj.1 2.9 0.4 2.3 0.2 Austria obj.2 8.2 -0.8 -2.3 -0.2 2000-2008
obj.1 -6.0 n.a. n.a. Germany obj.2 4.3 -1.1 n.a. 2000-2008
obj.1 n.a. 5.9 1.0 n.a. Spain obj.2 n.a. 8.7 11.1 n.a. 2000-2006
obj.1 -4.9 2.1 -0.8 Italy obj.2 -3.8 1.4 0.0 2000-2007
UK(a) obj.2 3.9 12.0 9.4 2003-2007 obj.1 14.2 -1.0 6.9 Sweden obj.2 1.8 2.5 2.1 2000-2006
Portugal obj.1 -16.5 n.a. n.a. 2003-2006 Poland obj.1 2.5 7.7 4.9 2003-2005 Hungary obj.1 n.a. 1.8 n.a. 2000-2005 (a) UK is considered entirely obj.2 because obj.1 regions are not distinguishable. Sources: Ismeri Europa and Applica processing of data of previous exhibits in this chapter These results help to give a better understanding of the effects of EU Cohesion Policy in the previous programming period. The aggregates are only an approximation of the indicators used to verify additionality, but they summarise well the national context for public investment in which the EU Cohesion Policy has operated.
62 In this paragraph the aggregates considered for each MS are the same examined above in the country sections.

177
Exhibit 98 - Development expenditure (or comparable expenditure categories) by country and region
GDP Central Gov. State Gov. Local Gov. GENERAL Gov.
(Local+ state) / general MS Expenditure
& period Region (example) Ranking GDP p.c. per capita MS= 100 %
Burgenland (A) min 66.6 85.6 115.4 70.7 84.3 67.6 Oberösterreich median 96.2 101.2 133.5 87.0 100.4 68.4 ÖSTERREICH EfD
2000-08 Vienna max 139.0 132.8 0.0 108.6 95.9 52.7 Mecklenburg-W. Pomerania min 68.0 36.5 145.2 n.a n.a 75.0 Schleswig-Holstein median 90.0 36.5 73.4 n.a n.a 67.0 DEUTSCHLAND(a) Investments
2000-07 Hamburg max 171.7 36.5 109.6 n.a n.a 80.2 Extremadura min 65.7 n.a 130.6 73.2 n.a n.a Castilla y León median 92.8 n.a 145.0 105.8 n.a n.a ESPAÑA EfD
2000-06 Comunidad de Madrid max 132.6 n.a 95.2 90.2 n.a n.a Calabria min 69.1 240.4 100.7 141.6 49.4 Liguria median 110.3 106.4 102.2 103.5 68.9 ITALIA EfD
2000-07 PA Bolzano max 141.2 50.3 523.0 379.2 96.0 Départements. d'outre-mer min 58.9 113.7 n.a n.a Bretagne median 88.7 96.0 n.a n.a FRANCE Investments
2005 Île-de-France max 155.3 83.8 n.a n.a Wales min 75.8 21.5 172.1 86.1 86.1 East Midlands median 89.5 84.7 68.4 77.6 40.0 UK EfD
2002-07 London max 162.9 195.0 110.7 158.7 30.7 Östra Mellansverigen min 85.8 86.2 97.0 91.5 52.3 Sydsverige median 89.9 79.5 117.4 98.3 58.9 SVERIGE Investments
2000-06 Stockholm max 137.3 142.4 93.0 117.7 39.3 Norte min 79.7 96.5 92.6 n.a n.a Alentejo median 92.5 128.9 123.7 n.a n.a PORTUGAL(b)
Invest.cent. & cap. Expend. loc 2002-06 Lisboa max 140.7 118.0 78.4 n.a n.a
Podkarpackie min 69.4 68.9 90.0 82.6 73.6 Kujawsko-Pomorskie median 89.6 51.8 82.5 72.9 77.8 POLSKA(c)
capital expenditure 2000-05 Mazowieckie max 155.2 147.9 141.0 143.4 68.3
Strední Morava min 78.0 n.a 93.4 n.a n.a Severovýchod median 84.0 n.a 86.9 n.a n.a CZECH REPUBLIC
capital expenditure 2006-08 Prague max 208.0 n.a 174.2 n.a n.a
Northern Great Plain min 63.6 n.a 78.3 n.a n.a Southern Transdanubia median 69.3 n.a 102.4 n.a n.a HUNGARY
capital expenditure 2005 Central Hungary max 162.5 n.a 109.6 n.a n.a
(a) Central investment is equally redistributed among regions; (b) in the estimations central and local levels are not comparable and consequently General level is unknown; (c) central level only on allocated expenditure by region. Sources: Ismeri Europa and Applica processing on data of previous exhibits in this chapter.

178
3. The role of regional and local governments in managing development policies is significant (in general they account for over 50% of total expenditure), but can differ markedly not only across Member States but also within them and between regions. The right-hand column of the exhibit above shows the share of local and state expenditure in total development spending in some sample regions of the countries examined: this share ranges from 31% in London to 96% in Bolzano (Italy) and to more than 80% in Wales. The large variation depends on institutional and policy arrangements which affect the distribution of competences between government levels and policy areas; the mix of these two factors can produce very different national and regional regimes. This is particularly true in countries with differing degrees of autonomy attributed to the regions (Italy, the UK), but it is also significant in other countries. 4. Capital regions (or large metropolitan regions) often have special arrangements as regards the distribution of responsibility for development policy; the cases of Vienna, London, Stockholm and Lisbon are sufficient evidence of this. For these regions, the mix between national and local expenditure is different from the mix prevalent in other regions. 5. The regional distribution of the expenditure for development is only to a limited extent in line with cohesion and equality objectives. In general, the level of this expenditure relative to GDP is higher in less developed regions, but in these regions per capita expenditure is often lower than the national average. This means that the people living in these regions often benefit less from public investment than those in more developed regions and this in the long run can widen disparities in terms of the endowment of public goods and services. 6. The pursuit of the objective of equalising resources is distributed between different government levels according to the national institutional system in place. It is difficult to identify general models, but in federal and regionalised countries, local governments seem to manage resources according to GDP and central or state governments provide some rebalancing in cohesion terms. In centralised countries, this commitment seems to be more related to the local government level (see previous exhibit). 7. As mentioned above, national expenditure for development is only partly coherent with cohesion objectives and different administrative levels play different roles. To analyse this issue further and attempt some comparison between and within countries, regional public development expenditure per head is regressed on regional GDP per head, for the different government levels in the different countries, the two variables being taken as difference from the national average63. The standard error measures that part of the distribution of expenditure not explained by GDP per head and which depends on other factors. The results are presented in the exhibit below. The coefficient B provides some clues as to the ‘correspondence’ between public expenditure policy by different level of government and the regional economic situation (i.e. above or below average GDP). In cases where B>1, income disparities on average can be associated with more than proportionate disparities in the capital expenditure of each administrative level. This may denote a lack of an effort towards convergence.
63 The model does not include a constant coefficient (intercept).

179
In cases where B<1, income disparities on average can be associated with less than proportionate difference in the expenditure by each administrative level, denoting an effort towards convergence. The main limits of the analysis are: small number of observations and the high variability of capital expenditure. Main conclusions by country: − in Austria, different government levels show a similar convergence effort; − in Germany, state expenditure seems to have gone in the direction of divergence; − in Spain regional and local expenditure have gone in the direction of convergence; − in Italy, only the central and other local (provinces and municipalities) government levels
denote a convergence effort; − in France capital expenditure of local authorities has gone in the direction of convergence
while capital transfers were in the opposite direction; − in UK there was an overall convergence effect, even though at Central government level
there was some divergence; − in Sweden the situation is similar to that in the UK; − in Portugal local capital expenditure indicates an effort towards convergence; − in Poland the capital expenditure of general government indicates an effort towards
convergence while central government expenditure goes in the direction of divergence; − in Hungary, capital expenditure at local level has a positive convergence effect; − in Czech Republic, capital expenditure of regions and municipalities denotes a moderate
convergence effort. In conclusion, this exercise confirms the existence of different forces within EfD at different government levels. Very rarely are the differences in GDP per capita completely balanced by differences in development expenditure, but in general a positive efforts towards convergence prevails. 8. In relation to the contribution of EU Cohesion Policy to EfD, regional differences are substantial as the analysis of case studies points out. It is worth noting again as the results of this analysis should be handled with care, given the differences in the national sources and in the expenditure categories used to estimate EfD in the different cases. - In the Objective 1 regions examined, belonging to the EU15, the share of EU support in
EfD ranges from less than 5% on average in the UK to over 50% in the Spanish regions; - In the Objective 1 regions belonging to the EU12, this share is well above 50% (e.g. 77%
in Poland and 57% in Hungary); - In the Objective 2 regions examined, the contribution of EU Cohesion Policy is lighter,
ranging from 1% or less (e.g. UK, Sweden) to 11% in Spain.

180
Exhibit 99 - Correlation between regional GDP per capita and expenditure for development (Linear regression of differences from the national average of EfD on differences in GDP, results indicate: a) B= 1 neutral policy, >1 divergence, < 1 convergence; b) Std error= variance differences from the national average of the expenditure not explained by GDP differences from the national average) Country & type of expenditure Government
level Years B Std. Error p-value
Austria Expenditure fD* Central 2000-2006 0.490 0.194 0.036 Expenditure fD State 2000-2006 0.219 0.269 0.440 Expenditure fD Local 2000-2006 0.279 0.316 0.403 Germany Expenditure fD * State 2000-2006 1.057 0.133 0.000 Spain Expenditure fD Total (State+local) 2000-2006 0.472 0.332 0.173 Expenditure fD State (CCAA) 2000-2006 0.324 0.589 0.589 Expenditure fD Local 2000-2006 0.739 0.598 0.233 Italy Expenditure fD* Public sector 2000-2006 1.299 0.565 0.032 Expenditure fD* Public corporations 2000-2006 1.402 0.371 0.001 Expenditure fD General 2000-2006 1.228 0.751 0.118 Expenditure fD* Central 2000-2006 -1.317 0.350 0.001 Expenditure fD* Local (Regions+other locals) 2000-2006 2.368 1.027 0.032 Expenditure fD* Regions 2000-2006 4.888 2.070 0.028 Expenditure fD Other locals 2000-2006 0.733 0.541 0.190 France A Gross Capital Form. Local 2005 -0.295 0.216 0.185 B Capital Transfer paid* Local 2005 1.221 0.447 0.012 A+B Local 2005 -0.147 0.204 0.479 UK Expenditure fD** General 2002-2007 0.641 0.214 0.010 Expenditure fD* Central 2002-2007 1.651 0.455 0.003 Expenditure fD Locals 2002-2007 -0.697 0.225 0.413 Sweden Gross capital formation General 2000-2006 0.453 0.294 0.167 Gross capital formation Central 2000-2006 1.018 0.601 0.134 Gross capital formation Local 2000-2006 -0.103 0.214 0.645 Portugal
Capital expenditure Local (includes Madeira CIDAR) 2003-2006 0.036 0.034 0.333
Poland Capital Expenditures* General 2000-2005 0.916 0.240 0.002 Capital Expenditures* Central 2000-2005 1.264 0.532 0.031 Capital Expenditures* Local 2000-2005 0.640 0.088 0.000 Expenditure fD Local 2004-2006 0.217 0.138 0.138 Hungary Capital Expenditures ** Local 2005 0.158 0.102 0.093 Czech Republic
Capital Expenditures* Local 2006-2008
(GDP: 2004-2006)
0.681 0.061 0.000
* 5% significance; ** 10% Significance Sources: Ismeri Europa and Applica processing on data of previous exhibits in this chapter

181
CHAPTER 5. CONCLUSIONS AND POLICY IMPLICATIONS In this last chapter the main findings of the study are summarised and the related implications for EU Cohesion Policy are indicated. The chapter is organised around four main themes:
1. Trends in the general distribution of competences 2. Trends in the autonomy of local governments 3. Competences on the expenditure for development 4. Methodological issues and directions for future research
Trends in the general distribution of competences The main typologies of state organisation – The review of the literature has identified four main models on the basis of the prevailing forms of decentralisation and intergovernmental relationships: − federal states are characterised by a central government and regional authorities both with
own legislative and administrative competences. These are exercised independently and recognised by the constitution;
− regionalised or “quasi-federal” states are those that have established an intermediate or regional level of government with a wide set of competences.
− States with “northern systems”, typically Scandinavian, are unitary countries where local governments have a wide range of responsibilities in relation to regional development.
− Unitary states have in common a relatively high degree of centralisation and the main legislative competences are a prerogative of the central government. In the analysis, this group, which includes many different institutional kinds of organisation, has been divided into two groups: EU12 and EU15 Member States, because the former have implemented substantial institutional reforms since the beginning of the 1990s.
All the groups have experienced an increase in competences of the sub-central level of government in recent years. This trend has been very diversified and, in some Member States, it translated into deconcentration, in others, it meant devolution or some intermediate state. This redistribution of competences was reinforced by several factors such as globalisation, European enlargement and integration, the implementation of Cohesion Policy, the application of the principle of subsidiarity and the crisis of the welfare state in the face of demographic trends. In several cases, political choices determined by a resurgence of local identity played a major role in this process (e.g. in the UK, Belgium and Spain). Despite this institutional and political process, from a budgetary point of view, the redistribution of competences from central to sub-central levels was particularly strong only in regionalised states (Spain and Italy) and, to a more limited extent, in Nordic countries and in small unitary states where a kind of central versus local confrontation occurred. A relatively high degree of devolution took place also in the UK, at least in Scotland and Wales. In general the need to keep public spending under control was an important restraint on the devolution process.

182
Financial devolution is significant only in regionalised countries – The study highlights the following main trends in the EU27:
- an evident decentralisation process in Spain and Italy, already strongly regionalised, which could result in new federal arrangements; in the regionalised states, sub-national government expenditure increased from about 25% of the general government total in the early 1990s to the current level of approximately 40%. Sub-central levels are in these countries particularly high as regards capital expenditure, where they undertake over two thirds of the total;
- the stability of sub-national government expenditure in federal states, around 40% of general government expenditure during the last two decades. While the ratio even declined slightly in Germany and Austria, in Belgium it increased from 35% in 1990 to just above 40% at present;
- the termination or at least the notable slow down of the devolution process in some unitary states (Portugal and Greece) and the slow progress in others (France);
- the rationalisation of decentralised governments in Scandinavian countries, where the unification of local governments or creation of intermediate governments is on a voluntary or experimental basis. In general, this reorganisation did not affect significantly the level of sub-national government expenditure, which in the Nordic countries remained the highest in Europe (on average around 50% of total general government expenditure and in Denmark, around 64%);
- the broad reorganisation of local government (mainly at municipal level) in the Central and Eastern European countries, which are engaged in restoring a more balanced distribution of powers, but for the moment stop short of creating new administrations at NUTS2 level (with the exception of Poland). In these countries, sub-national expenditure increased very little from 23% of the total in 1995 to 26% in 2005.
This outline gives rise to a number of reflections. Firstly, the need to respond through policy initiatives to the challenges posed by globalisation strong cost competition and relocation of industries towards emerging economies, global financial interdependence and the rapid spreading of shocks) slowed down devolution, even if subsidiarity and local responsibility were pushing for a decentralised distribution of competences. This, also, demonstrates the fact that institutional arrangements are the result of complex political and historical forces, which do not necessarily respond to general efficiency criteria. Secondly, devolution in unitary countries with strong concentration of population and economic activity in capital cities seems more difficult and less supported by decentralised elites than in countries with multiple centres. Thirdly, changes in the distribution of powers are traditionally slow and existing trends are very likely to prevail over the next few years. The important role of municipalities and other local levels – The analysis of the distribution of competences indicates the significant role of municipalities in development policies, both in unitary and decentralised States. The role of intermediate or central levels varies markedly across the EU27, while the role of municipality (and other sub-regional) levels is generally similar. On average, this level manages around 30% of public expenditure for development. How this expenditure can be included in broader development strategies, to support the whole region effectively without fragmentation of intervention, and the extent of involvement of local actors remain persistent questions for national and Cohesion Policy. Answering those questions is beyond the scope of this study. However, the results of the analysis underline the

183
relevance of local development actions and the necessity of well defined governance at the municipal level in regional and national operational programmes. Regional policy without Regions? - The possibility for Cohesion Policy to have in many countries a government level coinciding with the territorial level at which it is implemented (NUTS 2) does not seem to be feasible in the near future. At the moment, this is the case in only a relatively few countries (Italy, Spain and France and the small “single-region” states (Latvia, Lithuania, Estonia, Cyprus, Malta and Luxemburg), but in the remaining countries, it is not the case (in Germany, Austria, Belgium and in some degree the UK and the Netherlands, the relevant administrative level is NUTS 1)64. The development of these “intermediate” institutions, which in the beginning was an implicit objective of the Cohesion Policy, has not been achieved. In countries supported to a large extent by Cohesion Policy, the economic rationale behind this aim clashed with resistance of the national context. In addition, other events (the enlargement, the single currency, as well as constitutional reforms) overcrowded the EU agenda. All this suggests that coordination between the central and local level remains fundamental for a successful EU Cohesion Policy. Moreover, it is important to remember that Cohesion Policy, for its participatory nature, local-based approach and multilevel features, often introduces in the national policy arena new actors and specific rules. The confrontation of these two, national and EU, decentralising processes requires a more important commitment to coordination and support to administrative capacity in the weaker countries. Predominance and specialisation of sub-national government in public investment - In total capital expenditure and in gross capital formation the share of sub-national government expenditure is larger than the share of central government and, in recent years, the EU27 average has reached 61% of total capital expenditure and 69% of gross capital formation. The role of sub-national governments is smaller as regards capital transfers. The role of sub-national level in public investment has increased over recent years and is largest in economic affairs, housing and community amenities, education and recreation, and culture because of increasing responsibility in these functions. Not surprisingly, the role of sub-national governments is most important in relation to territorial assets, while central governments maintain competence in relation to infrastructure, R&D and general aid-schemes. This division tends to vary according to the overall institutional arrangements65, but in general it corresponds with functional criteria and subsidiarity.
64 UK has an intermediate situation with Nuts 1 regional level – Scotland, Wales, North Ireland – plus Regional Development Agencies in England. 65 Sub-national governments support 75% of the total GFCF in Federal states and states with “northern system”, 60% in unitary states and 65% in the new member states (not consolidated data).

184
Exhibit 100 - Summary of features of different groups of countries: trends in competences and local autonomy
Group of countries Features Trends in competences Local revenues & autonomy Sub-national exp. on general government exp.
(2005-07)
Federal states (AT, BE, DE)
Constitutionally recognised, shared powers between central and sub-
central levels (states)
Not significant changes, reinforcement of federal organisation in BE
Medium Total: 42%
Current: 41% Capital: 77%
Unitary “Northern system” (SE, FI, DK)
Centralised states with strong local
autonomy
Rationalisation and unification of some local tiers (counties, municipalities aggregated into regions)
High Total: 50%
Current: 51% Capital: 51%
Unitary regionalised states (ES, IT)
Strong autonomy of intermediate levels
(regions)
Fast devolution and tendency to introduce federal agreements
Medium- high and increasing Total: 39%
Current: 39% Capital: 65%
Old MS
Different institutional forms with more (UK, NL, FR) or less
power to local gov. (PT, GR)
- On-going but slow devolution and reorganisation in UK and FR
- Slow-down or devolution halt in PT and GR
Medium (high in FR) Total: 26%
Current: 25% Capital: 43%
Other unitary states
New MS
States undergoing restructuring;
limited power to local gov.
Re-establishment and reinforcement of local governments; some more articulated devolution process in PL
Medium low Total: 25%
Current: 23% Capital: 53%
“Old” unitary MS (FR, GR, IE, LU, NL, PT, UK); “New” unitary MS (BG, CZ, EE, HU, LT, LV, PL, RO, SI, SK, CY, MT).

185
In general, local governments invest in public goods and services aimed at increasing welfare and the quality of life, while central governments invest in infrastructure networks, large projects and direct support to private firms. Although assessing the contribution to development of the different types of public investment is difficult and it varies according to the economic and territorial context, the above specialisation is important because Cohesion Policy may mobilise different actors independently from the amount of resources involved. Trends in the autonomy of local governments Increase in revenues and autonomy of local governments – In the period examined, the fiscal revenue of sub-national government increased from 14% to 17% of the total. The analysis indicates a slight increase of direct revenue in sub-national governments. In general, this process is positively correlated to the increase in sub-national expenditure and is more evident in regionalised countries with higher local expenditure. This tendency would require a specific analysis because fiscal autonomy depends on a broad range of rules and funding methods, but it reflects the desire to give increasing responsibility and decision capacity to local levels. EU Cohesion Policy funding is often free from budgetary rules and represents a ‘less constrained’ source for increasing autonomy of local governments. Competences in relation to expenditure for development Main competences of local governments for expenditure for development - In federalised countries, local authorities have competence in regulating issues of territorial importance such as traffic management and local public transport, building regulations and urban planning as well as some social services. Competences at local level are hence quite wide in these countries, and especially in Germany, with the exception of human resources. In regionalised countries, central and intermediate levels of government tend to have shared competences in all areas relevant to economic development such as infrastructure, human resources, productive environment. In most sectors, the Central Government sets the basic legislation to guide the Regions. Moreover the central level implements initiatives of national interest. Countries with northern systems have an old tradition of decentralisation, especially with respect to the provision of services relevant to development. More recently, as mentioned above, efforts have been concentrated on increasing the efficiency of the spatial organisation of administrations, combining counties and municipalities into larger entities. The country studies provide an insight into the distribution of competences in relation to regional development in a number of unitary states (France, UK, Portugal, Czech Republic, Poland and Hungary). Even though in recent years unitary states experienced, to varying degrees, a process of increasing devolution of regional development policy, they remain very centralised. Competences in relation to infrastructure for development, human resources and business support schemes are either fully in the hands of central governments or the administration alone has been transferred to sub-national levels while decision-making

186
remains a prerogative of the centre. In some of the EU12 countries, devolution has been significant and the local level is sometimes more important and often more autonomous than in the EU15. The scale of expenditure for development and the EU Cohesion Policy – In the report, a definition of EfD is proposed to encompass the eligible expenditure of EU Cohesion Policy in order to compare the two aggregates, though the actual definition used in the country studies is determined by the data available. Estimates based on Eurostat data66 and comparable at EU27 level in the 2000-2007 period indicate that expenditure for development was about 3% of GDP and 14% of total gross fixed capital formation in the EU27. On average, EU Cohesion Policy67 funded 11% of this expenditure with a higher share in the Objective 1 areas. In some countries (Estonia, Latvia, Cyprus, Lithuania, Portugal, Greece, Poland, Slovakia and Slovenia) Cohesion Policy accounted for most or a large part of resources for development and it was also important in Spain (around 20%). The countries where it was least important were Denmark, the Netherlands and Luxembourg (less than 3% of the national expenditure for development).
66 According to a general definition of EfD, two estimations of the expenditure for development are proposed in the study. They are based on the COFOG categories of expenditure more related to development and support to private investments; they are inferior than the overall public capital expenditure. 67 Excluding ESF, because current public expenditure for training and similar interventions was not included in the EfD estimation.

187
Exhibit 101 - Relevance of Cohesion Policy on national expenditure for development (annual average 2000-2006) Country Structural and cohesion funds as % of expenditure for
development LV – Latvia 81.8 LT – Lithuania 80.9 SK – Slovakia 58.9 EE – Estonia 55.3 PT – Portugal 52.1 PL – Poland 50.3 GR – Greece 39.3 EU10 36.4 HU – Hungary 29.7 SI – Slovenia 21.7 ES – Spain 20.5 CZ - Czech Republic 13.5 MT – Malta 12.8 EU25* 10.6 CY – Cyprus 9.4 EU15 8.5 IE – Ireland 7.5 IT – Italy 7.4 FI – Finland 6.0 DE – Germany 5.2 UK - United Kingdom 4.2 FR – France 3.1 SE – Sweden 2.9 AT – Austria 2.6 BE – Belgium 2.1 DK – Denmark 1.9 NL – Netherlands 1.3 LU – Luxembourg 0.8 Note: Estimate calculated on total allocation and in relation to the period 2004-2006 for new member countries and EU25. ESF is not included in coherence with EfD calculation. Sources: Ismeri Europa and Applica processing on DG Regio, Sweco (ERDF and CF Regional Expenditure, 2008) and Eurostat The importance of Cohesion Policy in EU investment policy is evident in the next exhibit, as well as its capacity to balance territorial disequilibria and to favour a widespread distribution of growth potential. In this respect, Cohesion Policy has been fundamental to increasing the public investment capacity of Central and Eastern European countries, which have been engaged in a major effort to update infrastructure, as well as of Italy and Portugal, where budgetary policy was restrictive. A prominent role of local administrations in regional development - Annual expenditure for development in Europe was on average EUR 650 per head in the period 2000-2007. On average, sub-central governments accounted for two-thirds of total development spending, approximately EUR 425 per head. In regionalised States, sub-central expenditure per head was higher than for the central level (e.g. in Spain EUR 560 versus. EUR 260 per head). In some northern systems as well as unitary States, there is an imbalance in favour of the central level (e.g. Greece, Slovakia and Slovenia). In many other unitary States, there is a prevalence of local government expenditure (e.g. France and the Netherlands in the EU15, Poland in the EU12).

188
In general, the role of intermediate or central levels varies significantly across the EU27, while the role of municipalities (and other sub-regional levels) is roughly comparable. On average, the local level manages around 50% of public expenditure for development. Expenditure for development (EfD) shows little or no shift towards intermediate levels of government, apart from in regionalised States and a few other countries. A significant feature is the widespread importance of local administrations in development expenditure as opposed to intermediate sub-central governments, even if in recent years, increases in EfD were larger in areas under central State responsibility. The significant role of local governments in public investment policy derives from the distribution of competences and from the wide powers over territorial policy of local governments. In general, among development policy initiatives, central government manages business support schemes, R&D, higher education, labour market measures and large infrastructure projects. Consequently, Cohesion Policy is an important support to sub-national government expenditure, especially in Objective 1 countries where funding was largest. Contribution of expenditure for development to convergence – In general expenditure for development is oriented towards correcting territorial disparities. The regional analysis carried out for 10 Member States confirms that expenditure for development relative to GDP is normally higher in the less developed regions. However, the analysis also highlighted the fact that per capita expenditure is normally lower in these regions and, hence, its “propensity” to improve cohesion, or to contribute to convergence, more limited. A correlation analysis shows different cohesion propensities in central or sub-national components of the expenditure and their different combinations in the countries examined. The results of the analysis suggest two main points: - the propensity towards cohesion of public investment is the product of a combination of
different forces, which act in a different way according to the distribution of competences and the national institutional and budgetary arrangements. It is difficult to identify general models as regards the pursuit of the objective of equalising resources, but in federal and regionalised countries, local governments seem to manage resources according to GDP and central or state governments provide some rebalancing in cohesion terms. In centralised countries, this commitment seems to be more related to the local government level.
- the concentration of resources in the strongest regions is high in both cases, and the effort
to equalise per capita investment in the different regions would require a large increase in investment expenditure. This point is crucial, because it underlines how difficult it is for the less developed areas to catch up in the context of the concentration of public investment in agglomerations to varying degrees, and, at the same time, how important it is to shift resources to the poorest regions to avoid a widening of disparities in GDP. This aspect has to be contextualised in relation to the level of economic development (in particular, agglomeration push is understandable in former communist countries, in which market economies have been built up in the recent years), but in any case it requires policy measures to bring about territorial spillover effects and to exploit the potential resources of the less developed areas.

189
The trends in the expenditure for development across the EU – National expenditure for development increased by almost 4% a year in real terms between 2001 and 2007. In the EU15, the increase was rather limited in large countries (e.g. 0.9% in Germany, 2.5% in France) while there was a substantial increase in Austria, Belgium and the UK (above 10% in real terms). On the contrary, Portugal (-3.7%) and Greece (-2.3%) experienced a decrease. In the EU12, growth has been substantial, ranging from 10% per year in Poland to 28% in Latvia. Only Slovenia and Slovakia experienced a reduction. This EU12 growth represented the main increase of expenditure for development at the EU27 level. It seems clear from the data that changes in expenditure for development did not follow a common trend, but mainly reacted to national budget policy. As a consequence, it can be argued that the macroeconomic influence of Cohesion Policy has been diverse across the EU: in some cases it counterbalanced restrictive policies while in other cases it supported expansionary policies. Therefore the effects of Cohesion Policy, especially in Objective 1 regions where its impact was greatest, have been strongly influenced by the public finance context and varied according to overall expenditure for development. The growth of expenditure for development in the EU after 2000 pointed also to: - an increasing role of central government as compared to sub-national governments. This
was evident in the more decentralised States and could be regarded as a consequence of the will to increase only the most flexible and easiest to modify component of the expenditure.
- a general penalisation of the weakest areas: in dualistic countries (Spain, Italy and Germany), expenditure in Objective 1 regions decreased - or increased less than in other regions - and in mainly Objective 1 countries (Portugal, Greece and the EU12) the increase in expenditure favoured the most advanced regions. Despite such penalisation of weak areas as regards EfD, the importance of the Structural Funds in avoiding an even more unbalanced distribution of public investment is evident (especially in Italy, Portugal and in many EU12 countries).
Methodological and data issues The study also suggests some important directions for future research aimed at developing the analysis of expenditure for development further. The tested approach to expenditure for development and the verification of additionality – The study adopted a definition of expenditure for development which can support a clearer and more effective analysis of additionality in accordance with Structural Fund regulation. The possibility of linking the verification of additionality to data from national accounts (COFOG definition) was not an aim of the study, but it is its by-product. Additional work should be done to better fine-tune public expenditure and Structural Fund definitions and to develop a more practical and effective verification of additionality, as well as a territorialisation methodology for all the countries, but our results demonstrate the possibility of estimating trends in public expenditure for development in different countries and regions. Methodological aspects linked to the analysis of the public expenditure for development - The study confirms also the importance of having good data on public expenditure in order to understand the role of EU Cohesion Policy. Data and indicators of public expenditure

190
should be connected to the monitoring systems of the EU NSRFs and of the Operational Programmes in order to assess the real contribution of the Structural Funds to the different policies. In this regard, the definition of the most appropriate aggregates to investigate is crucial. The cases of the UK and Italy, but also of other countries, highlighted the growing relevance of privatisation of public services and goods and the extension of the role of public corporations in providing utilities and services. It means that the general government aggregate is often inadequate to examine public activities, and the public sector, including public corporations is a more relevant aggregate, or at least there is a need to consider explicitly government transfers to these. Related to this, the most relevant concept to examine in relation to development is total public capital expenditure because gross capital formation and capital transfers tend increasingly to be interconnected. Furthermore, total capital expenditure needs to be defined in the most relevant way for the purposes of assessing the scale of development spending, which means that it has to be gross of asset transactions (of the sale less purchases of assets of one kind and another), whereas for purposes of public sector accounting – and for the national accounts - it is normally defined net of these transactions. Given the growing importance of the transactions concerned as the ‘commercial’ activities of governments expand, it is critical that the accounts are presented on this basis. Much of the analysis presented in this report has been based on Eurostat public accounts data where capital expenditure is defined net rather than gross of transactions. As such, it is inevitably flawed and could potentially give a misleading indication of both the relative scale of development expenditure across the EU and of developments over recent years. Whether and how far this is the case is impossible with the data available to know.

191
6. REFERENCES
Aydalot, P. (1986). Milieux innovateurs en Europe. Paris: GREMI. Bache, I. (1998). The Politics of European Union regional policy: multi-level governance or
flexible gatekeeping? . Bachtler, J. (1993). Regional Policy in the 1990s. The European Perspective. In R. T.
Harrison & M. Hart (Eds.), Spatial Policy in a Divided Nation. London: Jessica Kingsley.
Bagnasco, A., & Trigilia, C. (1993). La construction sociale du marché. Le défi de la troisième Italie. Cachan: Editions de l'Ecole Normale Supérieur de Cachan.
Bahl, R., & Linn, J. F. (1992). Urban Politic Finance in Developing Countries. Oxford: Oxford University Press.
Benz, A., & Eberlein, B. (1999). The Europeanization of regional policies: patterns of multilevel governance. Journal of European Public Policy, 6(2), 329-348.
Bernardi (2000). Finanza pubblica centralizzata e federale: aspetti generali e il caso italiano. Bird, R. M. (1993). Threading the fiscal labyrinth: some issues in fiscal decentralisation.
National Tax Journal, 46, 207-227. Bird, R. M. (1999). Rethinking Subnational Taxes: A New Look at Tax Assignment. IMF
Working Paper, 99(165). Blöchliger, H., & King, D. (2006). Less than you thought: the fiscal autonomy of sub-central
governments. Bloomfield, J. (2006). Controlling, cajoling or co-operating? . Brussels: Council of European
Municipalities and Regions. Bobbio, L. (2002). Governi locali nelle democrazie contemporanee (Vol. 326): Laterza. Börzel, T. (1999). Towards convergence in Europe? Institutional adaptation and
Europeanization in Germany and Spain. Journal of Common Market Studies, 37(4), 573-596.
Börzel, T. (2002). States and regions in the European Union: institutional adaptation in Germany and Spain.
Bradford, D. F., & Oates, W. E. (1971). Towards a predictive theory of intergovernmental grants. American Economic Review, 61(2), 440-448.
Brennan, G., & Buchanan, J. M. (1980). The power to tax. The analytical foundations of a fiscal constitution. Cambridge: Cambridge University Press.
Council of European Municipalities and Regions (2005). Local and regional structures in Europe. Brussels: Council of European Municipalities and Regions.
Council of European Municipalities and Regions (2007). Consultation procedurs within European states. Brussels: Council of European Municipalities and Regions.
Dafflon, B. (2008). Fédéralisme financier et décentralisation: Université de Fribourg. Dexia Research Department (2008). In D. Editions (Ed.), Sub-national governments in the
European Union. Versailles. European Commission for Democracy through Law (1997). Federal and Regional States (pp.
66): Council of Europe. European University Institute (2009). Study on the division of powers between the European
Union, the Members States and Regional and Local Authorities (study No. 978-92-895-0449-2). Florence: European University Institute.
Eurostat (2002). Manual on sources and methods for the compilation on ESA95 financial accounts (5th edition ed.).

192
Feldstein, M., & Vaillant Wrobel, M. (1998). Can state taxes redistribute their income? Journal of Public Economy, 68(3), 369-396.
Florida, R. (1998). Calibrating the learning region. In J. De la Mothe & G. Paquet (Eds.), Local and regional systems of innovation. Boston, London: Kluwer Academic Publishers.
Garfoli, G. (1991). Local Networks, Innovation and Policy in Italian Industrial Districts. In E. Bergman, G. Maier & F. Tödtling (Eds.), Regions Reconsidered. Economic Networks, Innovation and Local Development in Industrialized Countries. London: Mansell.
Green Cowles, M., Caporaso, J., & Risse, T. (2001). Transforming Europe: Europeanization and domestic change. In Ithaca (Ed.): Cornell University Press.
Héritier, A. (2001). Differential Europe: The European Union Impact on National Policymaking. In A. Héritier & e. al. (Eds.), Differential Europe: The European Union Impact on National Policymaking (pp. 1-22). Lanham, Boulder: Rowman and Littlefield Publishers.
Hughes, J., Sasse, G., & Gordon (2004). Conditionality and Compliance in the EU’s Eastward Enlargement: Regional Policy and the Reform of Sub-national Government. Journal of Common Market Studies(42), 523-551.
Hughes, J., Sasse, G., & Gordon (2004). Europeanization and regionalization in the EU’s enlargement to Central and Eastern Europe: the myth of conditionality. Houndmills: Palgrave Macmillan.
Jeffery, C. (1997). The Regional dimension of the European Union: towards a third level in Europe? London.
Keating, M., & Hughes, J. (Eds.). (2003). The Regional Challenge in Central and Eastern Europe. Territorial Restructuring and European Integration Brussels: Peter Lang.
Kincaid, J. (2002). Introduction. In A. L. Griffiths & K. Nerenberg (Eds.), Guide des pays fédérés (Montréal & Kingston ed., pp. 3-13): McGill-Queen's University Press.
Loughlin , J. (2008). Federal and local government institutions. In D. Caramani (Ed.), Comparative Politics (pp. 264-287). Oxford: Oxford University Press.
Loughlin, J., & Aja, E. (Eds.). (2001). Subnational democracy in the European union: challenges and opportunities. Oxford: Oxford University Press.
Loughlin, J., & Delcamp, A. (2003). La décentralisation dans les Etats de l'Union européenne. Paris: La Documentation Française.
Loughlin, J., Keating, M., & Deschouwer, K. (2003). Culture, Institutions and Regional Development: a Study of Eight European Regions. Cheltenham: Edward Elgar.
Morgan, K. (1997). The learning region: institutions, innovation and regional renewal. Regional Studies, 31(5), 491-503.
Musgrave, R. M. (1969). Fiscal systems. New Haven, London: Yale University Press. Oates, W. E. (1972). Fiscal federalism. New York: Harcourt Brace Jovanovich. Oates, W. E. (1999). An essay in fiscal federalism. Journal of Economic Literature(37). Oates, W. E. (2002). Fiscal Federalism and European Union: Some Reflections (preliminary
draft). Paper presented at the XIV Conference of the Società Italiana di Economica Pubblica.
Pauly, M. V. (1973). Income redistribution as local public good. Journal of Public Economics, 2, 35-58.
Planning Bureau of the Republic of Cyprus (2009). Aims and objectives Retrieved August, 2009, from: http://www.planning.gov.cy/planning/planning.nsf/dmlaims_en/dmlaims_en?OpenDocument
Pyke, F., & Sengenberger, W. (1992). Industrial districs and local economic regeneration. Geneva: International Institute for Labour Studies.

193
Schimmelfennig, F., & Sedelmeier, U. (Eds.). (2005). The Europeanization of Central and Eastern Europe. Ithaca, NY: Cornell University Press.
Scott, A. J. (1996). Regional Motors of the Global Economy. Futures, 28(5), 391-411. Scott, A. J. (1998). Regions and the World Economy. The Coming Shape of Global
Production, Competition, and Political Order. Oxford: Oxford University Press. Scott, A. J., Soja, E. W., & Storper, M. (2001). Global City-Regions. In A. J. Scott (Ed.),
Global City-Regions: Trends, Theory, Policy. Oxford: Oxford University Press. Scott, A. J., & Storper, M. (1992). Industrialization and Regional Development. In A. J. Scott
& M. Storper (Eds.), Pathways to Industrialization and Regional Development. London, New York: Routledge.
Stöhr, W. B. (1989). Regional Policy at the Crossroads. In L. Albrechts, F. Moulaert, P. Roberts & E. Swyngedouw (Eds.), Regional Policy at the crossroads: European Perspectives. London: Kingsley.
Storper, M. (1995). The Resurgence of Regional Economies, 10 Years Later. European Urban and Regional Studies, 2(3), 191-221.
Storper, M. (1997). The Regional World. Territorial Development in a Global Economy. New York, London: Guilford.
SWECO (2008). ERDF and CF Regional Expenditure, a study for DG Regio. Sutherland, D., Price, R., & Joumard, I. (2005). Sub-central government fiscal rules:
O.E.C.D. Weingast, B. R. (1995). The economic role of political institutions: market-preserving
federalism and economic development. Journal of Law and Economic Organisation, 11(1), 1-31.
Yuill, D., Allen, K., Bachtler, J., Clement, K., & Wishlade, F. (Eds.). (1993). European Regional Incentives, 1993-94 (13th Edition ed.). London: Bowker-Saur.

194
7. ANNEX 1 – COUNTRY NOTES (MS NOT COVERED IN THE CASE STUDIES)
7.1. BELGIUM
1. Background The kingdom of Belgium was formed as a unitary state in 1830. There have long been tensions between the Flemish and French languages communities and, from the mid-twentieth century onwards, economic disparities between the regions of Flanders and Wallonia. After several constitutional reforms, Belgium has been transformed into a federalised state, formally recognised as such in 1993.
2. Institutional organisation Belgium has three tiers of sub-national government: the six federated entities (three regions and three language communities with overlapping territories), the provinces and the municipalities. 1. Regional level68 The regional level - The three communities: the Flemish Community (Vlaamse Gemeenschap), the French
Community (Communauté française), the German Community (Deutschsprarchige Gemainschaft);
- The three regions: the Flemish Region (Vlaanderen), the Walloon region (Région Wallone); the Brussels Capital Region (Région Bruxelles Capital – Brussels Hoofdtedelijk Gewest).
While in Flanders regional and community instances have merged after 1980 to form a unique Flemish Parliament and Government, in the French and German speaking part of the country the Communities and Region are separate federal entities with each a distinct parliament and government. A special status applies to Brussels due to the bilingual nature of the Belgian Capital. 2. Provincial level: There are 10 provinces (province – provincie) in Belgium, five in each region. Provinces are autonomous institutions and manage everything considered as being of provincial interest while being subject to supervisory control by different authority levels. The Brussels Region directly exercises provincial competences. 3. Municipal level: The 589 municipalities (commune – gemeente) are recognised by the Constitution and represent the local government tier closest to the citizen. They enjoy a great level of autonomy in managing local affairs, but like provinces they are supervised by different authority levels, especially by the regions.
3. Distribution of competences The division of powers between the federal and the regional levels of government is attributed on an exclusive basis meaning that the central State cannot intervene in their respective sphere of competences. The general government has only specific assigned competences, with all other competences going to regions and communities. In practice, it is hard to separate 68 It is important to note that the standardised English language vocabulary adopted in the countries’ reports in order to allow comparison does not necessary correspond to the denomination of these levels of government in the country’s language, which are indicated in each report.

195
competences clearly and it has proved necessary to specify competences in order to indicate whether they should go to the regions or to the communities. The federal state retains important domestic competences including the judicial system, the police and important elements of social security, including unemployment, pensions, child benefits and health insurance, as well as state-owned companies and federal scientific and cultural institutions. An important feature of the Belgian system is that the regions and communities have responsibility for the international and European aspects of their domestic competences, within the limits of Belgian foreign policy interests. Communities are responsible for areas affecting “their” population, which means in practice that they are responsible for all services delivered to individuals where the language is important such as culture (including media), education (at including university and scientific research) and training, health care and social services. Communities are also responsible for international relations in the areas under their management. Regions have powers in fields that are connected with the region or territory, and their responsibilities have been extended over the years. Regions are responsible for areas linked to “territorial planning”, in the widest sense of the term. This includes regional planning and urban policy, housing, environment protection, agriculture, water policy. Regions share competences with other administrative levels in areas such as the transport, employment and economic development (public works and infrastructures, external trade, energy, R&D). Since 2001, regions are also responsible for local government organisation. In practice this means that they are responsible for enacting all the organisational rules regarding the provincial and municipal institutions operating on their territory. As set out in the Constitution, provinces and municipalities have extensive autonomy with regard to the management of local issues within the framework of responsibilities they carry out under the supervision or control of higher-level authorities. Their responsibilities are not clearly defined in the legislation and are based on the simple premise of being in the provincial or municipal interest. Provinces therefore operate in a relatively extensive range of areas. They have taken initiatives in the domain of education, social and cultural infrastructure, medical prevention and social policy. They general assume responsibility for the environment, roads and waterways, the economy, transports, public works and housing (social housing subsides). Municipalities have extensive responsibilities which depend on the missions attributed to them by higher authorities (such as responsibility for public law and order), or by “the municipal interest” principle. In this latter case, municipalities have competences in areas such as town planning, transport, education, culture and sports, environmental issues, tourism, health and social welfare. Regional development in Belgium is entirely decentralised to the regional level. The regional institutions are responsible for the planning and implementation of policies and are also the main actors in relation to the EU Cohesion Policy.
4. Control, cooperation and consultation
There is no strictly defined procedure at the federal level governing consultation between the State and the associations of local and regional authorities. The three associations which represent the local governments at regional level69 participate in numerous inter-institutional committees and, for matters under the competence of the federal state that affect local governments, they consult together in order to adopt a common position if at all possible. At 69 The three associations are respectively:
- the Association of Flemish Cities and Municipalities (VVSG) for the Flanders region; - Union of Cities and Municipalities of the Walloon Region (UVCW) for the Walloon region; - the Association of the City and the Municipalities of the Brussels-Capital Region (AVCB) for the
Brussels region.

196
regional level, the consultation procedures differ between the regions. In the Flemish and Brussels regions, no formal consultation procedure exists: the respective associations participate in various inter-institutional committees and councils. In the Walloon region, the local governments have their own consultative council, which provides non-binding opinions on draft decrees of the Walloon Parliament. Given the number of councils and committees in which the associations are represented, local governments in Belgium are consulted widely. However, consultation is not systematic and the associations have to try to take action in time on issues that affect local authorities, particularly financial ones.
5. Facts and figures Sub-national government expenditure in Belgium amounts to 21% of GDP and around 42% of general government expenditure (Table BE1). These figures are above the EU average and have increased over the last decade. Current expenditure of sub-national government is relatively high and well above the EU average. Transfers are the main source of revenue at this level, amounting to 13% of GDP, twice the EU average. Disaggregation of total expenditure by economic function (Table BE2) shows that sub-national government expenditure is relatively high as regards education, economic affairs, recreation and culture, general public services and social protection. Overall, 9% of sub-national expenditure goes to regional development. This represents two thirds of general government expenditure for development and 1.9% of GDP, half of it going to economic affairs.

197
Table BE1: Sub-national government revenue and expenditure in Belgium
average 2005-2007 % change (1995/97)-(2005/07) subnat. gov. %
GDP EU average subnat. gov. %
general gov. EU average subnat. gov. %
GDP subnat. gov. %
general gov. Total Expenditure 20.8 15.6 42.0 33.8 4.6 9.5 Current expenditure excluding interest charges 18.2 12.9 43.3 32.6 8.6 4.8 - Compensation, Intermediate consumption 11.6 8.8 74.9 51.3 7.9 5.2 - Subsidies to companies 0.6 0.5 32.3 48.0 5.0 -26.3 - Social benefits, transfers 6.0 3.6 24.4 16.9 10.3 7.8 Interest charges 0.3 0.4 7.0 14.9 -57.5 -12.7 Capital expenditure 2.3 2.2 65.9 60.7 -5.5 -19.1 - Gross fixed capital formation 1.5 1.6 90.6 68.8 2.4 9.6 - Capital transfers 0.8 0.6 41.8 47.1 -19.4 -44.8 Total Revenue 20.8 15.3 42.8 34.5 6.7 5.9 Direct revenues 7.6 8.6 15.9 19.9 24.8 24.1 - Fiscal receipts 4.6 6.6 10.4 16.8 42.0 40.9 - Sales of goods and services 1.2 1.5 72.6 65.7 11.0 -12.6 - Other 1.9 0.6 68.4 30.1 2.8 18.7 Transfers 13.2 6.7 2663.8 665.9 -1.6 -18.9
Source: own calculations based on Eurostat - Government revenue, expenditure and main aggregates – May 2009

198
Table BE2: Sub-national government expenditure by economic function in Belgium Total government expenditure Development expenditure
average (2005-2007) average (2005-2007) % change p.a. (1995/97)-(2005/07)
subnat. gov % GDP
EU
subnat. gov %
general. gov.
EU subnat. gov % GDP
EU
subnat. gov %
general. gov.
EU subnat. gov % GDP
subnat. gov %
general. gov.
total Total 20.8 15.6 42.0 33.7 1.9 1.9 66.3 63.6 0.4 -2.9 gf01 Gen. publ. services 3.9 2.4 45.2 39.0 gf02 Defence 0.0 0.0 0.0 0.2 gf03 Public order, safety 0.8 0.8 50.3 42.8 gf04 Economic affairs 3.2 1.9 54.9 48.7 1.0 0.7 48.8 50.4 -0.3 -4.6 gf05 Environment 0.6 0.6 103.1 82.8 0.2 0.2 112.6 84.5 -3.7 0.6 gf06 Housing 0.4 0.9 112.5 85.4 0.2 0.4 124.3 81.0 2.9 0.0 gf07 Health 0.4 2.0 5.0 30.6 0.0 0.1 68.2 37.1 38.7 7.4 gf08 Recreation, culture 1.2 0.8 98.7 71.9 0.3 0.2 110.3 81.1 3.8 -0.2 gf09 Education 6.7 3.3 113.8 62.8 0.2 0.3 99.9 84.0 1.8 0.5 gf10 Social protection 3.6 3.0 20.6 16.3
Source: own calculations based on Eurostat data - Government expenditure by function (COFOG) – November 2009

199
7.2. LUXEMBOURG
1. Background The administrative organisation of communes and the institutional framework of the country have not changed significantly since 1843 when the first law defining the administrative structure of the Grand Duchy of Luxembourg was first introduced. An administrative and territorial reform is currently under discussion.
2. Institutional organisation Luxembourg is a unitary state. Due to the small size, the country has no intermediary territorial level of government and municipalities constitute the only sub-national government tier. The Grand Duchy is divided into three administrative districts, also called provinces (Luxembourg, Diekirch, and Grevenmacher), which are units of central State territorial administration. They are headed by a State representative, the district commissioner, appointed by the Grand Duke. Luxembourg has 116 municipalities (communes) of which 12 are defined as towns (villes). They constitute the only tier of sub-national government.
3. Distribution of competences Districts are levels of state administration without their own powers. The Constitution of Luxembourg guarantees self-government of municipalities but gives no indication of the powers involved. In practice, municipalities have mandatory powers including some delegated by central government and optional responsibilities. Mandatory powers cover public order and safety, hygiene, public health and local public utilities (water, sewerage, waste collection and disposal) and local roads. State delegated responsibilities concern mainly pre-school and primary school education. Optional powers include local transport, health care, social welfare, culture and sport. Some discretionary services, such as culture, day care centres, centres for the elderly or music schools, which are defined as being of “general interest” in the legislation, and can therefore receive State funding. Those considered to be purely of “local interest” do not qualify for any specific State funding.
4. Control, cooperation and consultation Most of the decisions taken by the municipalities are subject to approval from the Grand Duke or the central government. While in practice local authorities are consulted through the Association of Luxembourg Towns and Municipalities (SYVICOL), there is no formal framework for Government consultation.
5. Facts and figures Sub-national government expenditure amounts to 5% of GDP and less than 13% of general government expenditure. These figures are smaller than the EU average and have declined over the past decade. Disaggregation of sub-national government expenditure by economic function shows that the largest part (25%) goes to education followed by general public services (20%) but expenditure on both relative to GDP is well below the EU average. Sub-national government expenditure on development, in relation to both GDP (1.2%) and total general government expenditure on development (37%), is below the EU average.

200
However, it constitutes a relatively large share of overall sub-national government expenditure.

201
Table LU1: Sub-national government revenue and expenditure in Luxembourg average 2005-2007 % change (1995/97)-(2005/07) subnat. gov. %
GDP EU average subnat. gov. %
general gov. EU average subnat. gov. %
GDP subnat. gov. %
general gov. Total Expenditure 5.0 15.5 12.8 33.8 -15.1 -12.3 Current expenditure excluding interest charges 3.4 12.9 10.1 32.6 -15.7 -12.4 - Compensation, Intermediate consumption 2.8 8.8 26.3 51.3 -11.7 0.0 - Subsidies to companies 0.1 0.5 6.5 48.0 -28.3 -21.6 - Social benefits, transfers 0.5 3.6 2.2 16.9 -31.6 -32.3 Interest charges 0.1 0.4 36.4 14.9 -36.7 31.0 Capital expenditure 1.6 2.2 28.8 60.7 -12.2 -16.6 - Gross fixed capital formation 1.5 1.6 39.5 68.8 -11.6 -11.4 - Capital transfers 0.0 0.6 2.3 47.1 -10.9 -25.4 Total Revenue 5.0 15.3 12.3 34.5 -20.8 -16.7 Direct revenues 2.7 8.6 6.7 19.9 -27.6 -23.9 - Fiscal receipts 1.6 6.6 4.4 16.8 -32.5 -31.0 - Sales of goods and services 1.0 1.5 54.6 65.7 -20.9 -8.4 - Other 0.1 0.6 4.6 30.1 5.1 51.5 Transfers 2.3 6.7 1053.7 665.9 -10.8 14.9
Source: own calculations based on Eurostat - Government revenue, expenditure and main aggregates – May 2009

202
Table LU2: Sub-national government expenditure by economic function in Luxembourg Total government expenditure Development expenditure
average (2005-2007) average (2005-2007) % change p.a. (1995/97)-(2005/07)
subnat. gov % GDP
EU
subnat. gov %
general. gov.
EU subnat. gov % GDP
EU
subnat. gov %
general. gov.
EU subnat. gov % GDP
subnat. gov %
general. gov.
total Total 4.9 15.6 12.6 33.7 1.2 1.9 36.5 63.6 -2.8 -1.9 gf01 Gen. publ. services 1.0 2.4 24.1 39.0 gf02 Defence 0.0 0.0 0.0 0.2 gf03 Public order, safety 0.1 0.8 8.9 42.8 gf04 Economic affairs 0.8 1.9 18.0 48.7 0.3 0.7 16.1 50.4 -7.6 -6.0 gf05 Environment 0.6 0.6 57.0 82.8 0.2 0.2 80.4 84.5 -5.2 1.1 gf06 Housing 0.4 0.9 54.9 85.4 0.1 0.4 44.1 81.0 -5.9 -3.0 gf07 Health 0.0 2.0 0.4 30.6 0.0 0.1 42.8 37.1 21.9 34.2 gf08 Recreation, culture 0.6 0.8 34.0 71.9 0.3 0.2 50.6 81.1 -2.2 -5.4 gf09 Education 1.2 3.3 27.4 62.8 0.4 0.3 57.3 84.0 6.4 3.9 gf10 Social protection 0.2 3.0 1.2 16.3
Source: own calculations based on Eurostat data - Government expenditure by function (COFOG) – November 2009
203
7.3. DENMARK
1. Background Denmark is a constitutional monarchy which has historically been a very decentralised State. The principle of local self-government, guaranteed by the 1953 constitutional amendment, has been strengthened by several reforms introduced in the 1970s. These reforms also led to a simplification of the country’s administrative organisation, a reduction of the number of local authorities and a strengthening of their powers. A major public sector reform was carried out in 2005 (and came into effect in 2007) which established a regional level of government.
2. Institutional organisation The public sector reform of 2005 reorganised the institutional landscape of Denmark by establishing a new division of municipalities, replacing counties (amtskommuner) by regions (regioner), redistributing competences between the different levels of government and introducing a new financing and equalisation system. Denmark is today composed of 5 regional governments and 98 municipalities (kommuner). Greenland and Faroe Islands have autonomous status with their own governments and legislative assemblies.
3. Distribution of competences Since the 2005 reform, regions have responsibility for regional development, health care and the management of social institutions, as well as for environmental protection, cultural activities, planning (raw material mapping and planning), and transport. Unlike the former counties, regions are not allowed to levy taxes. Health care, which is a major responsibility of regions, is primarily financed by a national tax and other funds from the central level and from municipalities. Municipalities have been reduced in number but their powers have been broadened. Municipalities are responsible for most welfare services and are the main access point of citizens to the public sector. New municipal powers cover health care, employment, social services, education, business services, collective transport and roads, the environment and cultural activities. Since the 2005 reform, regions have statutory responsibility for regional development in Denmark. Decisions are taken within the “Regional Growth Forums” bringing together representatives of the business community, the education sector and local authorities.
4. Control, cooperation and consultation Sub-national governments in Denmark are consulted and involved in the coordination of economic policy: Each year, representatives of central government negotiate the general financial framework at the sub-national level with sub-national government associations70.
5. Facts and figures Sub-national governments in Denmark play a particularly important role. Local expenditure amounts to around 33% of GDP and to two-thirds of general government expenditure. These 70 In Denmark there are two sub-national government associations, one for each sub-national tier:
- Local Government Denmark – LGDK which represents the 98 municipalities; - Danish Regions, which represents the five regions.
204
figures are the highest in the EU and twice the average. Sub-national government expenditure is almost exclusively current in form, reflecting the extensive responsibilities of municipalities and regions for the delivery of services. Capital expenditure at the sub-national level is much smaller (only 1.3% of GDP) and well below the EU average.

205
Table DK1: Sub-national government revenue and expenditure in Denmark average 2005-2007 % change (1995/97)-(2005/07) subnat. gov. %
GDP EU average subnat. gov. %
general gov. EU average subnat. gov. %
GDP subnat. gov. %
general gov. Total Expenditure 33.0 15.5 63.8 33.8 3.6 16.4 Current expenditure excluding interest charges 31.6 12.9 66.1 32.6 3.2 8.4 - Compensation, Intermediate consumption 18.1 8.8 69.8 51.3 7.2 2.9 - Subsidies to companies 0.7 0.5 32.0 48.0 1.3 21.9 - Social benefits, transfers 12.8 3.6 65.1 16.9 -2.0 13.0 Interest charges 0.2 0.4 8.8 14.9 -35.8 98.3 Capital expenditure 1.3 2.2 58.5 60.7 26.2 41.0 - Gross fixed capital formation 1.3 1.6 69.9 68.8 25.6 27.2 - Capital transfers 0.0 0.6 11.5 47.1 60.5 149.7 Total Revenue 32.7 15.3 57.8 34.5 1.7 1.4 Direct revenues 17.7 8.6 32.0 19.9 -3.9 -3.5 - Fiscal receipts 15.1 6.6 30.4 16.8 -3.9 -5.1 - Sales of goods and services 1.8 1.5 60.9 65.7 -0.6 0.6 - Other 0.8 0.6 30.3 30.1 -10.8 17.7 Transfers 15.1 6.7 1034.1 665.9 9.2 -19.5
Source: own calculations based on Eurostat - Government revenue, expenditure and main aggregates – May 2009

206
Table DK2: Sub-national government expenditure by economic function in Denmark Total government expenditure Development expenditure
average (2005-2007) average (2005-2007) % change p.a. (1995/97)-(2005/07)
subnat. gov % GDP
EU
subnat. gov %
general. gov.
EU subnat. gov % GDP
EU
subnat. gov %
general. gov.
EU subnat. gov % GDP
subnat. gov %
general. gov.
total Total 33.0 15.6 63.8 33.7 1.1 1.9 71.9 63.6 4.7 5.6 gf01 Gen. publ. services 1.6 2.4 26.1 39.0 gf02 Defence 0.0 0.0 1.0 0.2 gf03 Public order, safety 0.1 0.8 9.0 42.8 gf04 Economic affairs 1.5 1.9 43.9 48.7 0.2 0.7 49.7 50.4 2.9 5.5 gf05 Environment 0.3 0.6 54.9 82.8 0.0 0.2 38.6 84.5 5.0 5.1 gf06 Housing 0.2 0.9 32.2 85.4 0.1 0.4 91.1 81.0 9.6 8.0 gf07 Health 7.1 2.0 99.4 30.6 0.3 0.1 99.0 37.1 2.3 0.4 gf08 Recreation, culture 0.9 0.8 56.5 71.9 0.1 0.2 65.0 81.1 1.8 3.4 gf09 Education 4.0 3.3 52.6 62.8 0.3 0.3 76.7 84.0 9.0 10.9 gf10 Social protection 17.3 3.0 78.2 16.3
Source: own calculations based on Eurostat data - Government expenditure by function (COFOG) – November 2009

207
7.4. FINLAND
1. Background Finland is a decentralised country where local self-government has its roots in two laws that date back to 1865 and 1873, which remain the basis for the current system. The country became an independent Republic in 1917 and municipal self-government is recognised by the Constitution. Municipalities in Finland have a wide range of responsibilities which have been increased over recent years without a corresponding change in the budget allocated. Although local authorities can decide on their local tax rate, many of them have faced difficulties in financing the expenditure implied by their new legal mandates because of their small populations. Since the 2007 Act on Restructuring of Local Government and Services, minimum population requirements need to be met for the delivery of basic local services and therefore mergers and cooperation between municipalities are encouraged.
2. Institutional organisation Finland is a unitary state, composed of 416 municipalities (kunta), 6 provinces (läänit), and 20 regions (maakunnan liitto) including the Ǻland Islands. For the purposes of state territorial administration, there are six State Offices and ninety State Local Districts. The 1995 Local Government Act recognises diversity among local authorities and gives them leeway to organise their functions and administration as they wish. In Finland, two regions have specific statutes:
- the Ǻland Islands have an autonomous administration;
- the region of Kainuu has temporarily been given self-governing powers for the period 2005 to 2012 as a part of a regional self-government experiment.
3. Distribution of competences Finland has 19 regions for strategic planning purposes. The 19 regional councils (maakunta) have statutory responsibility for regional development and planning as well as for the preparation and execution of EU Structural Fund programmes. They also promote the interests of their regions and perform a wide range of voluntary functions. The Ǻland Islands have legislative powers over all matters except constitutional law, foreign relations, general taxes, criminal and most civil laws, social insurance, navigation, aviation and communication. The Kainuu Region has wide responsibilities including over social welfare and health, upper secondary education, vocational education, economic development and management of the EU Cohesion Policy. Municipalities are guaranteed autonomy under the Constitution and have extensive responsibility for the provision of basic services, including social services and welfare, health care, education, local public utilities and economic development.
4. Control, cooperation and consultation Finnish municipalities are represented at national level by the association of Finnish Local Regional Authorities (AFLRA), which acts as the interface with the State on discussions of municipal responsibilities, finance and administration. In cooperation with the State and under the direction of the Ministry of Finance, the association prepares an annual municipal budget which is used for the preparation of the State budget.

208
5. Facts and figures Sub-national government expenditure amounts to 19% of GDP and 40% of general government expenditure, higher than the EU average (Table FI1). While current expenditure is relatively large as a share of GDP and general government expenditure, capital expenditure is below the EU average. As compared with other EU countries, sub-national government direct revenue – both tax receipts and the proceeds from sales of goods and services – is high. The largest shares of expenditure at sub-national level are on health care, social protection and education (Table FI2). Local health care expenditure represents over 80% of general government expenditure, over three times the EU average share. Development expenditure at local level is smaller in Finland than in other EU countries but has tended to increase in relation to both GDP and overall general government expenditure.

209
Table FI1: Sub-national government revenue and expenditure in Finland average 2005-2007 % change (1995/97)-(2005/07) subnat. gov. %
GDP EU average subnat. gov. %
general gov. EU average subnat. gov. %
GDP subnat. gov. %
general gov. Total Expenditure 19.5 15.5 40.0 33.8 -3.3 17.4 Current expenditure excluding interest charges 17.8 12.9 40.1 32.6 -2.7 11.0 - Compensation, Intermediate consumption 15.5 8.8 69.1 51.3 -1.0 5.1 - Subsidies to companies 0.1 0.5 10.2 48.0 -2.0 61.9 - Social benefits, transfers 2.1 3.6 10.3 16.9 -13.6 3.2 Interest charges 0.2 0.4 10.3 14.9 -53.9 20.9 Capital expenditure 1.6 2.2 56.4 60.7 0.9 61.5 - Gross fixed capital formation 1.7 1.6 66.6 68.8 10.8 26.2 - Capital transfers 0.0 0.6 5.3 47.1 -55.7 90.7 Total Revenue 19.1 15.3 36.3 34.5 -7.9 -2.9 Direct revenues 13.7 8.6 26.2 19.9 -7.7 -2.8 - Fiscal receipts 9.2 6.6 21.1 16.8 -11.2 -5.7 - Sales of goods and services 3.9 1.5 79.4 65.7 10.7 14.2 - Other 0.6 0.6 15.2 30.1 -37.5 -39.1 Transfers 5.4 6.7 1250.5 665.9 -8.5 15.9
Source: own calculations based on Eurostat - Government revenue, expenditure and main aggregates – May 2009

210
Table FI2: Sub-national government expenditure by economic function in Finland Total government expenditure Development expenditure
average (2005-2007) average (2005-2007) % change p.a. (1995/97)-(2005/07)
subnat. gov % GDP
EU
subnat. gov %
general. gov.
EU subnat. gov % GDP
EU
subnat. gov %
general. gov.
EU subnat. gov % GDP
subnat. gov %
general. gov.
total Total 19.5 15.6 40.0 33.7 1.3 1.9 57.6 63.6 1.3 7.5 gf01 Gen. publ. services 2.7 2.4 41.9 39.0 gf02 Defence 0.0 0.0 0.0 0.2 gf03 Public order, safety 0.3 0.8 19.5 42.8 gf04 Economic affairs 1.2 1.9 27.2 48.7 0.3 0.7 30.0 50.4 1.9 11.4 gf05 Environment 0.1 0.6 43.7 82.8 0.0 0.2 56.1 84.5 11.8 11.5 gf06 Housing 0.1 0.9 47.6 85.4 0.0 0.4 35.3 81.0 9.9 13.5 gf07 Health 5.6 2.0 82.7 30.6 0.3 0.1 99.4 37.1 2.5 0.3 gf08 Recreation, culture 0.8 0.8 74.5 71.9 0.1 0.2 92.9 81.1 -2.6 0.9 gf09 Education 4.0 3.3 67.6 62.8 0.4 0.3 93.7 84.0 0.5 3.5 gf10 Social protection 4.6 3.0 22.3 16.3
Source: own calculations based on Eurostat data - Government expenditure by function (COFOG) – November 2009

211
7.5. THE NETHERLANDS
1. Background While the Netherlands was a confederation of autonomous provinces until the end of the 18th century, after the French occupation, the administrative structure became similar to that of France. Today, the Netherlands is a constitutional monarchy where local-self governance is anchored in the Constitution. Over the past 40 years, the number of municipalities has been significantly reduced and the powers of the provinces have been strengthened.
2. Institutional organisation The Netherlands is a decentralised unitary state composed of two tiers of sub-national government. These consist of 12 provinces (provincies) and 443 municipalities (gemeenten). The capital city, Amsterdam, is responsible for both municipal and provincial activities and is divided into 15 districts.
3. Distribution of competences The distribution of competences between levels of sub-national government is set out in the Constitution which grants to local governments general competence for local issues. Local governments have two types of responsibility: general competence for all local or provincial affairs as long as these do not conflict with national legislation, and jointly exercised powers attributed by national legislation. Provinces are responsible for the delivery of supra-municipal public services. Their main tasks are land planning (land use, public transport and roads), environmental protection and housing. Provinces are also responsible for economic development, though this tends to be managed at the (NUTS 1) regional level by cooperation between them. In the current programming period, in three of the four region, one of the provinces which make up the region concerned takes the lead in implementing Structural Fund programmes (in the Noord region, on a rotational basis), while in the fourth region, the West, the city of Rotterdam development agency performs this role. In addition, there is close cooperation with the business community, universities and research centres and large cities, while the 30 largest cities are accorded additional attention in the implementation of policy. Municipalities have major responsibility for social services, education, housing, health, local public utilities and leisure facilities.
4. Control, cooperation and consultation
Each level of Dutch sub-national government is controlled by the level immediately above: municipalities by the provincial executive body, provinces by the Ministry of Interior. A relevant characteristic of the Dutch political and administrative system is the major role played by consultation in an attempt to ensure consensus71. This applies within central government as well as to relations between central government, provinces and municipalities. The two associations which represent local governments72 are involved on a regular basis in policy-making at the central level.
71 Source: Council of European Municipalities and Regions, (2007), “Consultation procedures within European states”. 72 In the Netherlands, there are two sub-national government representative associations:

212
5. Facts and figures In the Netherlands, sub-national government expenditure (16% of GDP) is similar in scale to the EU average (Table NL1). Local gross fixed capital formation has increased over the past decade to 2.2% of GDP, higher than the EU average. Sub-national governments raise relatively little in taxes73 and transfers are the main source of local revenue74. The largest shares of local expenditure go to education (27%), economic affairs (17%), social protection (15%) and general public services (15%). Sub-national government expenditure on regional development amounts to 2.2% of GDP and accounts for 77% of general government expenditure on this, mainly going to economic affairs and housing (Table NL2).
- The Association of the Netherlands Municipalities, which represents all Dutch municipalities on a
voluntary basis; - The Association of Provinces of the Netherlands, which represents the 12 provinces.
73 In the Netherlands, fiscal receipts at the sub-national government level represent 1.4% of GDP which is much below the European average (6.6% of GDP). 74 Transfers to Dutch sub-national governments represent 10.6% of GDP while at the European level the corresponding value is 6.7% of GDP.

213
Table NL1: Sub-national government revenue and expenditure in the Netherlands average 2005-2007 % change (1995/97)-(2005/07) subnat. gov. %
GDP EU average subnat. gov. %
general gov. EU average subnat. gov. %
GDP subnat. gov. %
general gov. Total Expenditure 15.5 15.5 34.2 33.8 -15.8 -5.0 Current expenditure excluding interest charges 12.9 12.9 32.7 32.6 -6.5 -3.6 - Compensation, Intermediate consumption 10.6 8.8 63.3 51.3 0.5 1.6 - Subsidies to companies 0.4 0.5 36.4 48.0 3.2 -3.6 - Social benefits, transfers 1.9 3.6 8.9 16.9 -33.4 -29.9 Interest charges 0.4 0.4 17.1 14.9 -60.8 -8.6 Capital expenditure 2.2 2.2 62.0 60.7 -39.2 -11.8 - Gross fixed capital formation 2.2 1.6 67.1 68.8 9.9 4.2 - Capital transfers 0.3 0.6 52.6 47.1 -85.3 -35.8 Total Revenue 15.4 15.3 33.8 34.5 -17.7 -14.9 Direct revenues 4.8 8.6 10.6 19.9 -12.8 -10.0 - Fiscal receipts 1.4 6.6 3.6 16.8 1.7 4.2 - Sales of goods and services 2.4 1.5 68.1 65.7 -3.4 -3.9 - Other 1.0 0.6 30.5 30.1 -38.3 -29.4 Transfers 10.6 6.7 1892.0 665.9 -19.7 -5.0
Source: own calculations based on Eurostat - Government revenue, expenditure and main aggregates – May 2009

214
Table NL2: Sub-national government expenditure by economic function in the Netherlands Total government expenditure Development expenditure
average (2005-2007) average (2005-2007) % change p.a. (1995/97)-(2005/07)
subnat. gov % GDP
EU
subnat. gov %
general. gov.
EU subnat. gov % GDP
EU
subnat. gov %
general. gov.
EU subnat. gov % GDP
subnat. gov %
general. gov.
total Total 15.5 15.6 34.2 33.7 2.2 1.9 76.7 63.6 -5.9 -0.4 gf01 Gen. publ. services 2.3 2.4 31.8 39.0 gf02 Defence 0.0 0.0 0.0 0.2 gf03 Public order, safety 1.0 0.8 54.3 42.8 gf04 Economic affairs 2.6 1.9 55.6 48.7 0.9 0.7 61.7 50.4 2.5 4.6 gf05 Environment 0.7 0.6 87.3 82.8 0.1 0.2 91.2 84.5 0.6 0.4 gf06 Housing 0.9 0.9 92.9 85.4 0.6 0.4 100.9 81.0 -14.9 -0.8 gf07 Health 0.3 2.0 5.1 30.6 0.0 0.1 20.4 37.1 -15.5 -14.1 gf08 Recreation, culture 1.1 0.8 81.6 71.9 0.2 0.2 89.2 81.1 2.2 0.0 gf09 Education 4.2 3.3 82.9 62.8 0.3 0.3 88.3 84.0 0.9 -0.8 gf10 Social protection 2.2 3.0 13.7 16.3
Source: own calculations based on Eurostat data - Government expenditure by function (COFOG) – November 2009

215
7.6. SLOVENIA
1. Background Slovenia is a Republic under the 1991 Constitution which guarantees local self-government. The decentralisation process started in 1993 with the adoption of a series of acts on municipalities, local elections, territorial reorganisation and an increase in the number of municipalities. Central government, however, maintains significant control over local authorities.
2. Institutional organisation Slovenia is a decentralised unitary state, composed of 58 state administrations (upravna enota) and 210 municipalities (mesta). Only the latter have the status of local governments. State administrations supervise the municipalities in relation to State-delegated responsibilities. As of February 2007, there are 12 statistical regions grouped into East and West Slovenia.
3. Distribution of competences Although the constitution guarantees local self-government, no clear indication is given of the division of responsibilities, which in practice are decided by central government. The main mission of municipalities is to look after municipal affairs, which includes primary education (school buildings and facilities), social welfare (childcare, elderly care and social assistance), health care, social housing, leisure facilities, local public utilities (waste and water management) and local roads. The central government can delegate additional responsibilities to municipalities so long as it provides the corresponding financial resources. Urban municipalities have in addition responsibilities relating to urban development (urban transport, cultural activities and education).
4. Control, cooperation and consultation Consultation takes place through the Association of Municipalities and Towns of Slovenia (SOS), the Association of Slovenian Municipalities and individual local authorities. Although the law on local autonomy stipulates systematic consultation on matters that directly affect local authorities, the effectiveness of the consultation procedure depends in practice on individual ministries.
5. Facts and figures
Compared to the other European countries, sub-national governments in Slovenia play a relatively limited role (Table SI1). Local expenditure, slightly above 8% of GDP, represents less than 20% of general government spending. Local government gross fixed capital formation is proportionally higher in Slovenia than the EU average while local current expenditures is lower. Local government expenditure mainly covers education (41%) general public services (18%) and health (12%) (Table SI2). Around 10% of local government expenditure relates to development, which is smaller than the EU average and represents only a third of general government expenditure.

216
Table SI1: Sub-national government revenue and expenditure in Slovenia average 2005-2007 % change (1995/97)-(2005/07) subnat. gov. %
GDP EU average subnat. gov. %
general gov. EU average subnat. gov. %
GDP subnat. gov. %
general gov. Total Expenditure 8.6 15.5 19.5 33.8 10.2 18.2 Current expenditure excluding interest charges 6.7 12.9 17.6 32.6 4.3 4.9 - Compensation, Intermediate consumption 5.8 8.8 32.7 51.3 -1.4 1.1 - Subsidies to companies 0.2 0.5 10.9 48.0 75.9 119.8 - Social benefits, transfers 0.8 3.6 4.1 16.9 57.7 52.5 Interest charges 0.0 0.4 1.3 14.9 -45.9 -14.9 Capital expenditure 1.8 2.2 42.9 60.7 40.3 111.3 - Gross fixed capital formation 1.7 1.6 48.2 68.8 50.6 28.7 - Capital transfers 0.3 0.6 33.4 47.1 51.6 522.7 Total Revenue 8.5 15.3 19.6 34.5 6.0 6.0 Direct revenues 4.4 8.6 10.5 19.9 10.4 10.4 - Fiscal receipts 3.1 6.6 8.1 16.8 23.2 23.1 - Sales of goods and services 1.1 1.5 41.6 65.7 -13.2 -5.4 - Other 0.2 0.6 16.3 30.1 2.9 -18.1 Transfers 4.1 6.7 274.1 665.9 1.7 0.4
Source: own calculations based on Eurostat - Government revenue, expenditure and main aggregates – May 2009

217
Table SI2: Sub-national government expenditure by economic function in Slovenia Total government expenditure Development expenditure
average (2005-2007) average (2005-2007) % change p.a. (2000/02)-(2005/07)
subnat. gov % GDP
EU
subnat. gov %
general. gov.
EU subnat. gov % GDP
EU
subnat. gov %
general. gov.
EU subnat. gov % GDP
subnat. gov %
general. gov.
total Total 8.6 15.6 19.5 33.7 0.9 1.9 35.6 63.6 9.4 13.7 gf01 Gen. publ. services 1.6 2.4 25.2 39.0 gf02 Defence 0.0 0.0 0.0 0.2 gf03 Public order, safety 0.1 0.8 5.0 42.8 gf04 Economic affairs 0.7 1.9 17.8 48.7 0.2 0.7 18.2 50.4 1.8 14.9 gf05 Environment 0.0 0.6 3.2 82.8 0.0 0.2 1.7 84.5 6.1 -3.5 gf06 Housing 0.3 0.9 61.1 85.4 0.1 0.4 67.2 81.0 -3.2 -1.1 gf07 Health 1.0 2.0 16.2 30.6 0.1 0.1 21.7 37.1 -7.1 -4.7 gf08 Recreation, culture 0.5 0.8 49.4 71.9 0.2 0.2 58.9 81.1 15.1 14.1 gf09 Education 3.5 3.3 57.5 62.8 0.4 0.3 60.5 84.0 24.1 12.0 gf10 Social protection 0.8 3.0 5.1 16.3
Source: own calculations based on Eurostat data - Government expenditure by function (COFOG) – November 2009

218
7.7. IRELAND
1. Background Ireland has a strongly centralised system of government. The model is unique in Europe and complex. The foundation of the current system was put in place by the 1898 Local Government Act. Local Government Acts in 1941 and 1946 established central government control over local authorities. However, significant changes occurred in the structure of Irish local administration in the 1990s. The creation of regional authorities under the Local Government Act 1991 and of regional assemblies in 1999 was partly linked to the implementation of EU Cohesion Policy. A so called “decentralisation plan” is currently being implemented which concerns the physical decentralisation of central government rather than the devolution of power.
2. Institutional organisation Ireland is a unitary state composed of two sub-national tiers of government, the regional and the local level. At the regional level, two types of structures co-exist: 8 regional authorities (Údarás Réigiúnach) with nominated members from local government and 2 regional assemblies (Tionól réigiúnach) with nominated members from the regional authorities. Regional assemblies are not sub-national self-government bodies but were created to manage the EU Cohesion Policy75. The local level is composed of 114 local councils (Comhairlí) with a two tier structure: - The first tier consists of 29 country councils (Comhairlí Contae) and 5 city councils
(Comhairlí Cathrach) that together cover the country.
- The second tier consists of 80 town authorities, including 5 borough councils (Comhairlí Buirge) and 75 town councils (Comhairlí Baile).
3. Distribution of competences Local sub-national governments have very limited administrative powers and a limited degree of autonomy. Responsibilities are often executed within a policy framework determined by the central government. The regions have general responsibility for the coordination of public services and development programmes. The Regional Authorities have responsibility for: - coordinating public services and promoting cooperation and joint action;
- supervising the implementation of EU Structural Fund programmes.
The overall responsibility for the implementation of the National Development Plan/Community Support Framework remains with the Department of Finance but the regional Operational Programmes are administrated by the regional assembles. Accordingly, Regional Assemblies have responsibility for EU Cohesion Policy and national programmes. County and city councils have broader competences than the municipalities. The main functions are the planning of land use, transport, the environment, housing, fire services, leisure facilities and the coordination of public services across different agencies operating locally.
75 Ireland was divided into two NUTS 2 level regions (the Border Midland & Western and the Southern and Eastern Region).

219
Municipal councils have limited powers, covering road construction and maintenance, housing, social welfare, public health, leisure facilities and urban planning.
4. Control, cooperation and consultation Ireland has no legal framework for consultation between central, local and regional governments. However, ad hoc informal consultation may be take place on the initiative of both any of the parties. Most consultation involves the Department for the Environment Heritage and Local Government, which has supervisory responsibility for local and regional authorities.
5. Facts and figures The low degree of decentralisation in Ireland is reflected in the small share of sub-national government expenditure in relation to both GDP (7%) and total general government spending (20%) (Table IE1). These figures are less than half the EU average and have declined significantly over the past decade. Despite this, sub-national government capital expenditure, and in particular fixed capital formation, is high and have risen relative to GDP over the past ten years. Revenue for sub-national expenditure comes mainly from central government transfers, which account over 70% of the funding. Local authorities are particularly responsible for expenditure on the environment and housing (Table IE2), their share amounting to 90% of general government expenditure. Expenditure of sub-national governments on development amounts to 2.9% of GDP and accounts for over two thirds of total spending on this.

220
Table IE1: Sub-national government revenue and expenditure in Ireland average 2005-2007 % change (1995/97)-(2005/07) subnat. gov. %
GDP EU average subnat. gov. %
general gov. EU average subnat. gov. %
GDP subnat. gov. %
general gov. Total Expenditure 6.7 15.5 19.6 33.8 -45.9 -39.1 Current expenditure excluding interest charges 3.6 12.9 12.7 32.6 -64.5 -62.0 - Compensation, Intermediate consumption 2.8 8.8 19.8 51.3 -63.8 -62.5 - Subsidies to companies 0.0 0.5 0.0 48.0 - Social benefits, transfers 0.8 3.6 5.9 16.9 -66.8 -64.1 Interest charges 0.1 0.4 8.0 14.9 -47.5 143.9 Capital expenditure 3.0 2.2 62.3 60.7 48.1 12.8 - Gross fixed capital formation 2.8 1.6 76.0 68.8 48.6 -4.4 - Capital transfers 0.2 0.6 14.6 47.1 38.5 62.8 Total Revenue 6.8 15.3 18.9 34.5 -46.0 -42.0 Direct revenues 1.9 8.6 5.5 19.9 -36.9 -34.0 - Fiscal receipts 0.7 6.6 2.3 16.8 -13.8 -11.6 - Sales of goods and services 0.6 1.5 42.6 65.7 -37.2 -30.8 - Other 0.6 0.6 27.0 30.1 -51.2 -38.1 Transfers 4.9 6.7 431.2 665.9 -49.0 3.1
Source: own calculations based on Eurostat - Government revenue, expenditure and main aggregates – May 2009

221
Table IE2: Sub-national government expenditure by economic function in Ireland Total government expenditure Development expenditure
average (2005-2007) average (2005-2007) % change p.a. (1995/97)-(2005/07)
subnat. gov % GDP
EU
subnat. gov %
general. gov.
EU subnat. gov % GDP
EU
subnat. gov %
general. gov.
EU subnat. gov % GDP
subnat. gov %
general. gov.
total Total 6.7 15.6 19.6 33.7 2.9 1.9 68.7 63.6 5.0 0.1 gf01 Gen. publ. services 0.7 2.4 19.5 39.0 gf02 Defence 0.0 0.0 0.0 0.2 gf03 Public order, safety 0.2 0.8 15.7 42.8 gf04 Economic affairs 1.8 1.9 41.1 48.7 1.5 0.7 68.6 50.4 4.8 1.5 gf05 Environment 0.6 0.6 92.4 82.8 0.2 0.2 98.5 84.5 6.6 0.0 gf06 Housing 1.7 0.9 94.3 85.4 1.0 0.4 95.8 81.0 7.9 1.2 gf07 Health 0.0 2.0 0.0 30.6 0.0 0.1 0.0 37.1 -100.0 -100.0 gf08 Recreation, culture 0.3 0.8 43.1 71.9 0.1 0.2 43.4 81.1 9.6 0.4 gf09 Education 1.1 3.3 24.3 62.8 0.1 0.3 24.7 84.0 -3.0 -8.1 gf10 Social protection 0.2 3.0 2.6 16.3
Source: own calculations based on Eurostat data - Government expenditure by function (COFOG) – November 2009

222
7.8. GREECE
1. Background Greece, which is historically a highly centralised country, has introduced several reforms to create and strengthen sub-national levels of government since its entry into the EU in 1981. In 1987, 13 development regions were established and in 1994, the prefectures which had been acting as state territorial administrative units for 160 years, became self-governments with directly elected members. The number of municipalities was reduced markedly in 1997 and since 2003 there has been an ongoing debate on the creation of a regional tier of self-government but no agreement about this.
2. Institutional organisation Greece is divided into 13 regions (peripheries) established in 1987 which constitute the decentralised administrative units of central government. There are two levels of sub-national government: - 50 departments (nomarchiakes autodiikisis nomoi) also called prefectures
- 1034 local authorities divided into 914 urban municipalities (dimoi) and 120 communities (koinotites), which are generally small villages or islands.
3. Distribution of competences There is only limited devolution of power and no clear division of competences. Certain responsibilities are shared between periphereies, departments and central government. Some of the former responsibilities of the prefectures have been transferred to the regions, others kept at the department level. Regions have responsibility for economic and social development including the coordination of economic policy. Some ministerial responsibilities have also been delegated to the regions. Departments are in charge of most tasks previously undertaken by state prefectures. Main responsibilities include consumer protection, public health, environmental protection and supra-municipal infrastructure and transport. Municipalities and communities have competence over local public utilities, local roads, public transport and civil protection, in some cases jointly with departments.
4. Control, cooperation and consultation In Greece, there is no constitutional guarantee of the involvement of local sub-national governments in the decision-making process as regards issues of direct concern to them. In practice, consultation takes place via the KEDKE76 and ENAE77, which are the main interfaces for negotiations between local and central State.
5. Facts and figures Greece has one of the lowest levels of sub-national government expenditure in the EU, amounting to less than 3% of GDP and 7% of general government expenditure. Both shares, however, have increased over the past decade (Table GR1).
76 KEDKE (Central Union of Cities and Rural Communities) is the representative body of municipalities and communes at the national and international level. 77 ENAE (Central Union of Departments) is the representative body of departments.

223
Most development expenditure is centrally administrated (Table GR2). Local government development expenditure accounts for only 13% of general government expenditure on this, and 0.4% of GDP. Over 50% of local development expenditure falls under economic affairs.

224
Table GR1: Sub-national government revenue and expenditure in Greece average 2005-2007 % change (1995/97)-(2005/07) subnat. gov. %
GDP EU average subnat. gov. %
general gov. EU average subnat. gov. %
GDP subnat. gov. %
general gov. Total Expenditure 2.6 15.5 6.1 33.8 24.7 29.4 Current expenditure excluding interest charges 2.0 12.9 5.7 32.6 42.4 22.0 - Compensation, Intermediate consumption 1.9 8.8 11.5 51.3 50.4 35.2 - Subsidies to companies 0.0 0.5 0.0 48.0 - Social benefits, transfers 0.1 3.6 0.7 16.9 -20.2 -35.5 Interest charges 0.0 0.4 0.6 14.9 -0.8 135.0 Capital expenditure 0.6 2.2 14.9 60.7 -10.5 1.4 - Gross fixed capital formation 0.6 1.6 19.2 68.8 -4.0 -5.4 - Capital transfers 0.0 0.6 3.0 47.1 -55.7 -30.4 Total Revenue 2.6 15.3 6.5 34.5 18.4 13.9 Direct revenues 0.9 8.6 2.5 19.9 -0.4 -5.0 - Fiscal receipts 0.2 6.6 0.7 16.8 -20.3 -26.1 - Sales of goods and services 0.7 1.5 43.6 65.7 18.3 0.5 - Other 0.0 0.6 0.4 30.1 -79.4 -73.6 Transfers 1.7 6.7 52.3 665.9 31.9 38.3
Source: own calculations based on Eurostat - Government revenue, expenditure and main aggregates – May 2009

225
Table GR2: Sub-national government expenditure by economic function in Greece Total government expenditure Development expenditure
average (2005-2007) average (2005-2007) % change p.a. (1995/97)-(2005/07)
subnat. gov % GDP
EU
subnat. gov %
general. gov.
EU subnat. gov % GDP
EU
subnat. gov %
general. gov.
EU subnat. gov % GDP
subnat. gov %
general. gov.
total Total 2.6 15.6 6.1 33.7 0.4 1.9 12.5 63.6 0.4 2.5 gf01 Gen. publ. services 1.0 2.4 13.1 39.0 gf02 Defence 0.0 0.0 0.0 0.2 gf03 Public order, safety 0.0 0.8 1.7 42.8 gf04 Economic affairs 0.5 1.9 10.6 48.7 0.3 0.7 13.1 50.4 2.4 4.0 gf05 Environment 0.4 0.6 77.4 82.8 0.1 0.2 38.9 84.5 -2.5 -5.1 gf06 Housing 0.2 0.9 48.9 85.4 0.0 0.4 19.0 81.0 -6.8 -8.5 gf07 Health 0.0 2.0 0.0 30.6 0.0 0.1 0.0 37.1 gf08 Recreation, culture 0.1 0.8 32.7 71.9 0.0 0.2 30.9 81.1 2.2 -0.9 gf09 Education 0.1 3.3 2.8 62.8 0.0 0.3 0.0 84.0 gf10 Social protection 0.3 3.0 1.6 16.3
Source: own calculations based on Eurostat data - Government expenditure by function (COFOG) – November 2009

226
7.9. SLOVAKIA
1. Background After the fall of the URSS, the first steps towards decentralisation were taken in 1990 with the re-establishment of municipal autonomy. In 1996, the state administrative bodies were transformed into 79 districts and 8 administrative regions. The latter became decentralised self-governments in 2002. In 2004, the 79 districts were abolished and their responsibilities transferred to the regions and regional offices. A further administrative reform in 2007 abolished the regional offices. How their powers are to be re-assigned is yet to be decided.
2. Institutional organisation Slovakia is a regionalised unitary state, with a two-tier sub-national system of government. The upper level is made up of 8 regions, so called “higher territorial units” (Vyssie uzemmné celky), which were changed from administrative regions into self-governing bodies in 2002. At the local level, there are 2891 municipalities (obec) of which 138 have the status of cities (mesto). The two main municipalities - Bratislava and Košice - have a special status and are sub-divided into, respectively, 17 and 22 city districts78.
3. Distribution of competences The main regional responsibilities relate to education, health, social welfare, transport and economic development. Regions are intended gradually to play a larger role in the management of regional Operational Programmes under EU Cohesion Policy. Municipalities have responsibility for education (to primary level), public transport, water supply and treatment, social assistance, urban planning, cultural and sporting facilities, health and public order, as well as for local planning and tourism.
4. Control, cooperation and consultation There is a strictly defined consultation procedure between state and regional administrative bodies over financial aspects. Effective consultation is achieved through permanent dialogue between interested parties, including the Association of Towns and Communities (ZMOS).
5. Facts and figures Sub-national government expenditure in Slovakia amounts to around 18% of general government spending and some 6% of GDP, both figures below the EU average (Table SK1). Education (30%), general public services (16%) and economic affairs (14%) are the main items of local government expenditure (Table SK2). Development expenditure at the sub-national level amounts to 1% of GDP and 45% of general government expenditure on this. Local governments have main responsibility for housing (accounting for more than 90% of general government housing expenditure).
78 These city districts are not included in the total number of municipalities.

227
Table SK1: Sub-national government revenue and expenditure in Slovakia average 2005-2007 % change (1995/97)-(2005/07) subnat. gov. %
GDP EU average subnat. gov. %
general gov. EU average subnat. gov. %
GDP subnat. gov. %
general gov. Total Expenditure 6.4 15.5 17.6 33.8 14.1 58.3 Current expenditure excluding interest charges 5.2 12.9 16.5 32.6 73.2 116.1 - Compensation, Intermediate consumption 4.7 8.8 37.8 51.3 90.3 184.7 - Subsidies to companies 0.3 0.5 21.9 48.0 -15.4 184.4 - Social benefits, transfers 0.3 3.6 1.5 16.9 18.1 9.8 Interest charges 0.1 0.4 3.4 14.9 -26.9 18.6 Capital expenditure 1.1 2.2 36.6 60.7 -55.3 21.2 - Gross fixed capital formation 1.2 1.6 57.9 68.8 -17.8 60.3 - Capital transfers 0.1 0.6 6.7 47.1 101.2 456.5 Total Revenue 6.3 15.3 18.6 34.5 83.3 138.5 Direct revenues 4.0 8.6 12.3 19.9 83.8 138.1 - Fiscal receipts 3.3 6.6 11.2 16.8 107.2 170.8 - Sales of goods and services 0.5 1.5 48.3 65.7 30.1 103.9 - Other 0.1 0.6 8.2 30.1 -11.2 -17.5 Transfers 2.3 6.7 221.9 665.9 82.6 171.0
Source: own calculations based on Eurostat - Government revenue, expenditure and main aggregates – May 2009
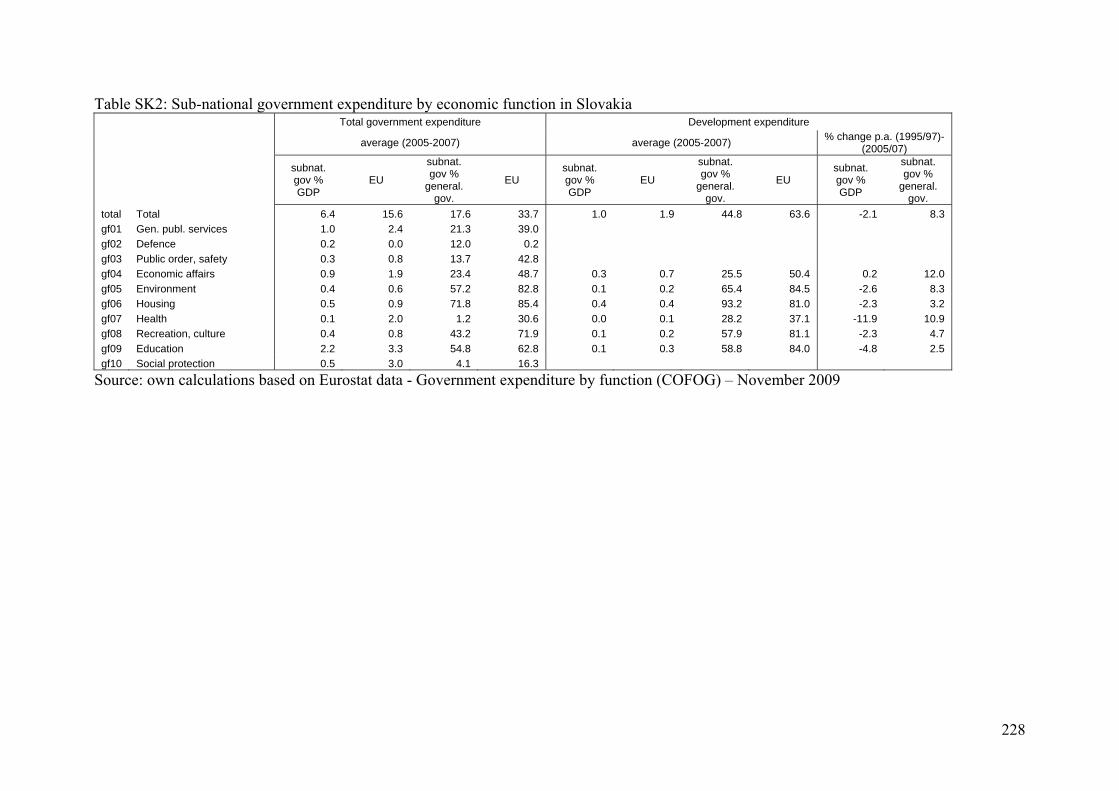
228
Table SK2: Sub-national government expenditure by economic function in Slovakia Total government expenditure Development expenditure
average (2005-2007) average (2005-2007) % change p.a. (1995/97)-(2005/07)
subnat. gov % GDP
EU
subnat. gov %
general. gov.
EU subnat. gov % GDP
EU
subnat. gov %
general. gov.
EU subnat. gov % GDP
subnat. gov %
general. gov.
total Total 6.4 15.6 17.6 33.7 1.0 1.9 44.8 63.6 -2.1 8.3 gf01 Gen. publ. services 1.0 2.4 21.3 39.0 gf02 Defence 0.2 0.0 12.0 0.2 gf03 Public order, safety 0.3 0.8 13.7 42.8 gf04 Economic affairs 0.9 1.9 23.4 48.7 0.3 0.7 25.5 50.4 0.2 12.0 gf05 Environment 0.4 0.6 57.2 82.8 0.1 0.2 65.4 84.5 -2.6 8.3 gf06 Housing 0.5 0.9 71.8 85.4 0.4 0.4 93.2 81.0 -2.3 3.2 gf07 Health 0.1 2.0 1.2 30.6 0.0 0.1 28.2 37.1 -11.9 10.9 gf08 Recreation, culture 0.4 0.8 43.2 71.9 0.1 0.2 57.9 81.1 -2.3 4.7 gf09 Education 2.2 3.3 54.8 62.8 0.1 0.3 58.8 84.0 -4.8 2.5 gf10 Social protection 0.5 3.0 4.1 16.3
Source: own calculations based on Eurostat data - Government expenditure by function (COFOG) – November 2009

229
7.10. MALTA
1. Background Decentralisation in Malta is a recent process that began in 1993 with the adoption of the first Maltese Local Government Act and the creation of 68 communes. In 1999, new competences were transferred to municipalities and in 2001, the Constitution was amended to include the principle of local self-government with elected deliberative bodies. Despite these developments, local governments in Malta have only limited autonomy.
2. Institutional organisation Malta does not have decentralised administrative bodies. The single-tier local government comprises 68 local councils (kunsilli lokali), 11 of them towns (città). The country is subdivided into three regions with no explicit administrative or executive functions. Xlokk covers the south-east of the largest island, Majjistral the north-east of the island and Gozo the two smaller islands.
3. Distribution of competences Local government has administrative responsibility – but with limited discretion over policy – for waste management, street cleaning and the maintenance of leisure and other facilities. It also has “shared” responsibility for public health, education and social welfare. Regional economic development and in particular the management of Structural Fund programmes is under the responsibility of the Prime Minister (Planning and Priorities Coordination Division).
4. Control, cooperation and consultation Consultation procedures are defined by the Local Councils’ Act and its Regulations and consultation is undertaken with both associations and individual local authorities on a monthly basis.
5. Facts and figures Malta has the smallest level of sub national government expenditure in the EU, amounting to less than 1% of GDP and less than 2% of the general government total (Table MT1). The only source of local revenue are transfers from central government.

230
Table MT1: Sub-national government revenue and expenditure in Malta average 2005-2007 % change (1995/97)-(2005/07) subnat. gov. %
GDP EU average subnat. gov. %
general gov. EU average subnat. gov. %
GDP subnat. gov. %
general gov. Total Expenditure 0.6 15.5 1.4 33.8 -4.8 -8.3 Current expenditure excluding interest charges 0.5 12.9 1.3 32.6 -1.0 -1.7 - Compensation, Intermediate consumption 0.5 8.8 2.4 51.3 -1.0 3.3 - Subsidies to companies 0.0 0.5 0.0 48.0 - Social benefits, transfers 0.0 3.6 0.0 16.9 Interest charges 0.0 0.4 0.0 14.9 Capital expenditure 0.2 2.2 3.6 60.7 -14.1 -17.3 - Gross fixed capital formation 0.2 1.6 3.7 68.8 -14.4 -33.3 - Capital transfers 0.0 0.6 0.1 47.1 Total Revenue 0.6 15.3 1.5 34.5 -3.7 -17.8 Direct revenues 0.0 8.6 0.1 19.9 134.7 106.8 - Fiscal receipts 0.0 6.6 0.0 16.8 - Sales of goods and services 0.0 1.5 1.8 65.7 649.5 835.8 - Other 0.0 0.6 0.1 30.1 -71.2 -50.6 Transfers 0.6 6.7 21.4 665.9 -7.1 -55.6
Source: own calculations based on Eurostat - Government revenue, expenditure and main aggregates – May 2009

231
Table MT2: Sub-national government expenditure by economic function in Malta Total government expenditure Development expenditure average (2005-2007) average (2005-2007)
subnat. gov % GDP
EU
subnat. gov %
general. gov.
EU subnat. gov % GDP
EU
subnat. gov %
general. gov.
EU
total Total 0.6 15.6 1.4 33.7 0.0 1.9 0.0 63.6 gf01 Gen. publ. services 0.4 2.4 5.4 39.0 gf02 Defence 0.0 0.0 0.0 0.2 gf03 Public order, safety 0.0 0.8 2.2 42.8 gf04 Economic affairs 0.1 1.9 0.9 48.7 0.0 0.7 0.0 50.4 gf05 Environment 0.2 0.6 10.2 82.8 0.0 0.2 0.0 84.5 gf06 Housing 0.0 0.9 0.0 85.4 0.0 0.4 0.0 81.0 gf07 Health 0.0 2.0 0.0 30.6 0.0 0.1 0.0 37.1 gf08 Recreation, culture 0.0 0.8 4.1 71.9 0.0 0.2 0.0 81.1 gf09 Education 0.0 3.3 0.0 62.8 0.0 0.3 0.0 84.0 gf10 Social protection 0.0 3.0 0.0 16.3
Source: own calculations based on Eurostat data - Government expenditure by function (COFOG) – November 2009

232
7.11. LATVIA
1. Background Latvia is a parliamentary Republic under the 1922 Constitution, which was reinstated after independence from the Soviet Union in 1990 and which has been revised several times since the beginning of the decentralisation process in 1993. The Local Government Act of 1994 constitutes the legal framework for sub-national government. Since 1998, there has been an ongoing process of reform to increase the size of municipalities so as to improve public service delivery at local level.
2. Institutional organisation Latvia is a unitary state with a two-tier system of sub-national government composed of - 26 districts (rajons)
- 527 local municipalities (vieteja pašvaldıba) sub-divided into 432 rural municipalities (pagasts), 53 towns (pilsetas) of 2,000 inhabitants or more, 35 “amalgamated” municipalities (novads) and 7 so-called “Republican towns” (republikas pilsetas) with special status
At regional level, there are no elected regional governments but five planning regions: Latgale, Vidzeme, Zemgale, Kurzeme and the Riga Region.
3. Distribution of competences Competences are allocated by national legislation. Sub-national governments have both administrative and regulatory powers. Planning regions are responsible for the design of regional development strategies and the implementation of programmes. Sub-national governments have both delegated and “own” responsibilities some of which are compulsory, others voluntary. Transfer of responsibility from central to sub-national government has to be accompanied by a transfer of funding. Most district responsibilities have been progressively transferred either to municipalities or to central government79, though districts remain responsible for the organisation of public transport (setting of schedules and fares) and for some health care services. Municipalities are responsible for education (to secondary level), social welfare, cultural and leisure facilities and local public utilities (water supply and sewerage, collection and processing of household waste).
4. Control, cooperation and consultation Associations of local and regional government80 are systematically consulted on the issues that concern them. Consultation on legislation takes place throughout the entire legislative process.
79 The relevance of this level is under discussion and it is envisaged to be abolished. 80 In Latvia, there are three different sub-national government associations:
- The Association of Local and Regional Governments of Latvia (LPS), which plays an important role in financial negotiations with central government since the amount of annual state transfers, borrowing ceilings and loan guarantees are negotiated in meetings between the two sides;
- The Associations of Big Cities of Latvia, which represents the interest of the seven republican cities;

233
5. Facts and figures Sub-national government expenditure amounts to 10% of GDP and 28% of the general government total, both less than the EU average (Table LT1) but similar to shares in the other EU12 countries. The main items of sub-national government expenditure are education (33%), general public services (20%) and health (11%). Development expenditure accounts for 17% of total sub-national expenditure, or 2.2% of GDP and 49% of general government expenditure on this.
- The Alliance of Latvian Towns, which represents the interest of and develops cooperation between
Latvian towns.

234
Table LV1: Sub-national government revenue and expenditure in Latvia average 2005-2007 % change (1995/97)-(2005/07) subnat. gov. %
GDP EU average subnat. gov. %
general gov. EU average subnat. gov. %
GDP subnat. gov. %
general gov. Total Expenditure 10.3 15.5 28.3 33.8 17.9 20.6 Current expenditure excluding interest charges 7.6 12.9 26.1 32.6 5.3 20.4 - Compensation, Intermediate consumption 7.0 8.8 41.3 51.3 15.7 26.5 - Subsidies to companies 0.0 0.5 4.6 48.0 - Social benefits, transfers 0.6 3.6 5.4 16.9 -48.0 -38.1 Interest charges 0.1 0.4 14.8 14.9 -55.5 -6.2 Capital expenditure 2.6 2.2 39.3 60.7 97.5 -21.0 - Gross fixed capital formation 2.1 1.6 43.6 68.8 143.3 -9.1 - Capital transfers 0.5 0.6 35.7 47.1 15.4 -32.9 Total Revenue 9.9 15.3 27.3 34.5 2.9 5.4 Direct revenues 6.3 8.6 18.9 19.9 -6.9 -3.9 - Fiscal receipts 5.2 6.6 17.6 16.8 -11.6 -5.0 - Sales of goods and services 1.0 1.5 35.0 65.7 27.0 -11.3 - Other 0.1 0.6 7.3 30.1 -4.2 -33.1 Transfers 3.6 6.7 138.0 665.9 26.8 16.9
Source: own calculations based on Eurostat - Government revenue, expenditure and main aggregates – May 2009

235
Table LV2: Sub-national government expenditure by economic function in Latvia Total government expenditure Development expenditure
average (2005-2007) average (2005-2007) % change p.a. (1995/97)-(2005/07)
subnat. gov % GDP
EU
subnat. gov %
general. gov.
EU subnat. gov % GDP
EU
subnat. gov %
general. gov.
EU subnat. gov % GDP
subnat. gov %
general. gov.
total Total 10.4 15.6 28.4 33.7 2.2 1.9 48.6 63.6 14.6 -0.6 gf01 Gen. publ. services 1.1 2.4 26.6 39.0 gf02 Defence 0.0 0.0 0.1 0.2 gf03 Public order, safety 0.2 0.8 6.0 42.8 gf04 Economic affairs 1.3 1.9 24.7 48.7 0.8 0.7 37.4 50.4 24.4 6.8 gf05 Environment 0.2 0.6 24.7 82.8 0.1 0.2 36.2 84.5 -7.0 -10.5 gf06 Housing 1.3 0.9 95.7 85.4 0.6 0.4 98.4 81.0 18.9 2.3 gf07 Health 0.9 2.0 19.4 30.6 0.1 0.1 16.9 37.1 21.7 -7.1 gf08 Recreation, culture 0.7 0.8 45.9 71.9 0.2 0.2 55.6 81.1 11.0 -2.0 gf09 Education 4.0 3.3 69.6 62.8 0.4 0.3 69.9 84.0 11.3 -0.7 gf10 Social protection 0.7 3.0 7.6 16.3
Source: own calculations based on Eurostat data - Government expenditure by function (COFOG) – November 2009

236
7.12. LITHUANIA
1. Background In 1990, the year of Lithuania’s independence, the right to have local self-government was established and local elections took place. Over the past decade, the number of municipalities, however, has been reduced significantly, though there is now a debate about increasing their number again in order to reduce their size. The future of counties (state territorial administrative units) is also under debate as their functions overlap with municipalities.
2. Institutional organisation Lithuania is a decentralised unitary state, which has a single-tier system of sub-national government. The 10 counties (aspkritys) are managed by an appointed governor responsible for the implementation of central government policies and coordination with municipalities (savivaldybés), of which there are 60 – 48 districts, 6 towns and 6 “municipalities without any specific territorial characteristic”. Below the municipal level, there are 548 elderships (seniunijos) based on earlier territorial divisions which have some responsibility for “services of proximity”. Only municipalities have self-governing statue.
3. Distribution of competences The division of responsibilities is fixed by law. Counties do not have own powers and largely carry out central government responsibilities. Municipalities have administrative competence but little policy discretion. Policies on education, health, social security and cultural facilities are decided by central government in consultation with local government. National guidelines also apply to local planning. Counties are responsible for the implementation of regional policy defined by central government. Regional Development Councils were created at county level in 2000, composed of representatives of the municipalities located there and the county governor. These are intended to take over increasing responsibility for regional development and the management of Structural Fund programmes. The main responsibilities of municipalities relate to education (to secondary level, including adult education and vocational training), social welfare, basic health care, cultural facilities, local public utilities (water supply and sewage, household waste), public transport, local roads and social housing.
4. Control, cooperation and consultation Consultation with local authorities usually takes place through the Association of Local Authorities in Lithuania (ALAL). Central government has legal obligation to consult individual municipalities on issues relating to property and finance. The frequency of consultation depends on the political agenda and takes place through the entire decision making process.
5. Facts and figures Sub-national government expenditure amounts to 8% of GDP and 24% of general government expenditure (Table LT1), both below the EU12 average (11% of GDP and 27% of general government expenditure). Both have declined over the past decade.

237
Sub-national government expenditure mainly goes on education (40%) and health (21%). Relatively little development expenditure is carried out by local government, accounting for only 36% of their total spending, less than 1% of GDP and half the EU average.

238
Table LT1: Sub-national government revenue and expenditure in Lithuania average 2005-2007 % change (2000/02)-(2005/07) subnat. gov. %
GDP EU average subnat. gov. %
general gov. EU average subnat. gov. %
GDP subnat. gov. %
general gov. Total Expenditure 8.3 15.5 24.4 33.8 -13.1 -6.5 Current expenditure excluding interest charges 7.1 12.9 24.9 32.6 -17.6 -10.8 - Compensation, Intermediate consumption 6.3 8.8 39.4 51.3 -14.2 -1.1 - Subsidies to companies 0.1 0.5 7.1 48.0 17.9 24.8 - Social benefits, transfers 0.8 3.6 6.6 16.9 -38.9 -39.4 Interest charges 0.0 0.4 2.0 14.9 -67.6 -34.1 Capital expenditure 1.2 2.2 24.8 60.7 31.2 16.6 - Gross fixed capital formation 1.3 1.6 29.3 68.8 44.9 -16.6 - Capital transfers 0.0 0.6 1.7 47.1 -81.0 -45.2 Total Revenue 8.1 15.3 24.2 34.5 -14.4 -13.0 Direct revenues 3.4 8.6 10.7 19.9 -35.3 -34.0 - Fiscal receipts 2.9 6.6 10.0 16.8 -39.1 -38.6 - Sales of goods and services 0.3 1.5 22.3 65.7 5.1 2.9 - Other 0.2 0.6 17.4 30.1 10.8 57.8 Transfers 4.7 6.7 225.2 665.9 11.1 7.9
Source: own calculations based on Eurostat - Government revenue, expenditure and main aggregates – May 2009

239
Table LT2: Sub-national government expenditure by economic function in Lithuania Total government expenditure Development expenditure
average (2005-2007) average (2005-2007) % change p.a. (2000/02)-(2005/07)
subnat. gov % GDP
EU
subnat. gov %
general. gov.
EU subnat. gov % GDP
EU
subnat. gov %
general. gov.
EU subnat. gov % GDP
subnat. gov %
general. gov.
total Total 8.3 15.6 24.4 33.7 1.2 1.9 35.7 63.6 9.3 0.3 gf01 Gen. publ. services 0.6 2.4 14.1 39.0 gf02 Defence 0.0 0.0 0.7 0.2 gf03 Public order, safety 0.1 0.8 3.1 42.8 gf04 Economic affairs 0.8 1.9 18.8 48.7 0.6 0.7 30.6 50.4 -6.2 -1.3 gf05 Environment 0.4 0.6 51.5 82.8 0.2 0.2 52.2 84.5 386.5 -19.5 gf06 Housing 0.3 0.9 96.6 85.4 0.1 0.4 99.8 81.0 -6.2 -0.1 gf07 Health 1.8 2.0 37.4 30.6 0.1 0.1 32.2 37.1 28.0 -5.5 gf08 Recreation, culture 0.4 0.8 40.6 71.9 0.1 0.2 33.6 81.1 70.1 -0.9 gf09 Education 3.3 3.3 61.4 62.8 0.1 0.3 33.9 84.0 36.4 -9.7 gf10 Social protection 0.8 3.0 7.5 16.3
Source: own calculations based on Eurostat data - Government expenditure by function (COFOG) – November 2009

240
7.13. ESTONIA
1. Background The first legislation on local self-government in Estonia dates back to 1918. After the Soviet era, Estonia adopted a two-tier system of sub-national government. In 1990, local governments were given the right to levy taxes via the Finance Act. The system was revised during the 1990s and in 1993 the Local Organisation Act abolished the local government status of counties which became part of the state territorial administration. Municipalities are now the only tier of local government.
2. Institutional organisation The state territorial administration is divided into 15 counties (maakonnad) run by a governor representing central government and 227 municipalities. The latter are sub-divided into 194 rural (vald) and 33 urban (linn) municipalities.
3. Distribution of competences In practice, the division of responsibilities of competences and tasks between the central and local governments is not always clear, but a significant part of the responsibility in main areas is assumed by the centre. Counties have administrative responsibility and are responsible for economic development and spatial planning. Municipalities have responsibility for social welfare, education (up to secondary level), leisure facilities, local public utilities, transport, local planning and the environment. The management and implementation of EU Cohesion Policy is carried out centrally by the Ministry for Financial Affairs, which has overall responsibility for management.
4. Control, cooperation and consultation Sub-national governments are consulted via two national associations81. Their approval of proposals directly concerning local interests is normally required. In 1994, the two associations created the joint “Cooperation Assembly of National Associations (EOKK)” body mainly responsible for budget negotiations.
5. Facts and figures Sub-national government expenditure amounts to around 10% of GDP and 28% of overall general government expenditures. During the past decade, local tax revenue increased in relation to GDP but transfers have been reduced by a similar proportion. The main areas of local government expenditure are education (45%), health care (14%) and economic affairs (12%). Development expenditure by sub-national government accounts for a quarter of the total and 2% of GDP, slightly above the EU average.
81 The Association of Estonian Cites and The Association of Municipalities of Estonia.

241
Table EE1: Sub-national government revenue and expenditure in Estonia average 2005-2007 % change (1995/97)-(2005/07) subnat. gov. %
GDP EU average subnat. gov. %
general gov. EU average subnat. gov. %
GDP subnat. gov. %
general gov. Total Expenditure 9.6 15.5 27.6 33.8 -8.8 3.2 Current expenditure excluding interest charges 7.6 12.9 26.0 32.6 -12.3 1.8 - Compensation, Intermediate consumption 6.8 8.8 41.0 51.3 -15.5 10.9 - Subsidies to companies 0.2 0.5 19.3 48.0 -24.0 -30.0 - Social benefits, transfers 0.6 3.6 5.4 16.9 59.4 53.9 Interest charges 0.1 0.4 50.7 14.9 60.3 259.0 Capital expenditure 1.9 2.2 36.0 60.7 5.8 -0.4 - Gross fixed capital formation 1.8 1.6 37.5 68.8 2.5 -4.8 - Capital transfers 0.1 0.6 18.4 47.1 Total Revenue 9.3 15.3 25.0 34.5 -8.3 -0.5 Direct revenues 5.1 8.6 14.5 19.9 14.9 27.3 - Fiscal receipts 4.2 6.6 13.4 16.8 28.3 42.1 - Sales of goods and services 0.8 1.5 33.2 65.7 -23.6 9.0 - Other 0.1 0.6 9.5 30.1 -15.7 -49.5 Transfers 4.1 6.7 229.8 665.9 -26.7 -52.9
Source: own calculations based on Eurostat - Government revenue, expenditure and main aggregates – May 2009

242
Table EE2: Sub-national government expenditure by economic function in Estonia Total government expenditure Development expenditure
average (2005-2007) average (2005-2007) % change p.a. (1995/97)-(2005/07)
subnat. gov % GDP
EU
subnat. gov %
general. gov.
EU subnat. gov % GDP
EU
subnat. gov %
general. gov.
EU subnat. gov % GDP
subnat. gov %
general. gov.
total Total 9.6 15.6 27.6 33.7 2.0 1.9 43.9 63.6 2.3 -0.5 gf01 Gen. publ. services 0.7 2.4 21.9 39.0 gf02 Defense 0.0 0.0 0.1 0.2 gf03 Public order, safety 0.0 0.8 0.8 42.8 gf04 Economic affairs 1.2 1.9 27.2 48.7 0.6 0.7 27.9 50.4 5.8 -2.8 gf05 Environment 0.4 0.6 47.3 82.8 0.1 0.2 58.0 84.5 -2.2 0.7 gf06 Housing 0.3 0.9 88.6 85.4 0.1 0.4 59.1 81.0 -18.8 -6.0 gf07 Health 1.4 2.0 33.0 30.6 0.2 0.1 40.2 37.1 58.6 51.3 gf08 Recreation, culture 1.0 0.8 46.4 71.9 0.4 0.2 54.8 81.1 2.6 -1.5 gf09 Education 3.9 3.3 63.6 62.8 0.7 0.3 65.7 84.0 2.5 4.6 gf10 Social protection 0.6 3.0 6.2 16.3
Source: own calculations based on Eurostat data - Government expenditure by function (COFOG) – November 2009

243
7.14. BULGARIA
1. Background After the fall of the communist regime, Bulgaria became a parliamentary Republic in 1991, with local self-government recognised in the Constitution. In the following years, the administrative organisation of sub-national government was modified and new fiscal regulations were adopted. Between 2002 and 2005, there was more fiscal decentralisation and the process is still underway with new reforms under discussion.
2. Institutional organisation At territorial level, there are 28 administrative districts (oblasti – also called “regions”, each run by a regional governor appointed by the central government who is responsible for the implementation of national policies. Bulgaria has a single level of sub-national self-government composed of 264 municipalities (obshtini), each sub-divided into mayoralties82 (kmetstva) or boroughs83 (rayoni) in the main cities. Six planning regions have been established for regional development purposes.
3. Distribution of competences Districts have no independent powers but simply administer national policies. The responsibilities assigned to municipalities are specified by the 1991 Act on Local Self-Government and Local Administration and are divided into two categories: - State delegated services which include education (up to secondary level), social welfare
and health84
- Local services which include local public utilities, roads and leisure facilities.
This distinction is linked to the source of funding: State delegated services are financed by transfers, while local services are financed by locally-raised revenue. The six planning regions are responsible for the implementation of regional development policy. Each region has a Regional Development Council bringing together the interests of municipalities, districts and the central government85. Although in recent years, local and regional bodies have become increasingly involved in regional policy-making, the overall responsibility for EU Cohesion Policy remains under the Ministry of Finance.
4. Control, cooperation and consultation Consultation is organised through the National Association of Municipalities in the Republic of Bulgaria (NAMRB), which is the legal representative of local governments at national level. The NAMRB interacts with the Ministerial Council and the Parliament on local authority issues and negotiates funding with the Ministry of Finances.
82 Mayoralties are settlements with at lest 250 inhabitants. On average, a municipality is sub-divided into 25 mayoralties. 83 Boroughs (also called wards) are sub-divisions of cities with a population over 100000 inhabitants. These are Sofia (24 boroughs), Plovdiv (5 boroughs) and Varna (5 boroughs). 84 Responsibilities in the health area have been limited since the 2001 reform of the health care system which turned municipal health care establishments into private companies. 85 The members of Regional Development Councils are representatives of ministries and national agencies which have an interest in regional policy, the prefects of the regions and representatives from municipalities (Source: Council of European Municipalities and Regions, 2007).

244
5. Facts and figures Sub-national government expenditure amounts to less than 7% of GDP and around 18% of general government expenditure (Table BG1), half the EU average. The figures have declined over recent years. Despite fiscal decentralisation, revenue raised locally has fallen relative to GDP while transfers have risen.

245
Table BG1:Sub-national government revenue and expenditure in Bulgaria average 2005-2007 % change (2000/02)-(2005/07) subnat. gov. %
GDP EU average subnat. gov. %
general gov. EU average subnat. gov. %
GDP subnat. gov. %
general gov. Total Expenditure 6.9 15.5 17.6 33.8 -8.8 -6.3 Current expenditure excluding interest charges 5.9 12.9 18.3 32.6 -14.3 -8.0 - Compensation, Intermediate consumption 5.5 8.8 31.8 51.3 -2.4 2.3 - Subsidies to companies 0.1 0.5 7.4 48.0 113.0 128.4 - Social benefits, transfers 0.3 3.6 2.0 16.9 -75.6 -73.1 Interest charges 0.0 0.4 0.6 14.9 -74.8 -57.2 Capital expenditure 1.0 2.2 18.0 60.7 47.1 -9.1 - Gross fixed capital formation 1.5 1.6 33.4 68.8 93.0 24.4 - Capital transfers 0.0 0.6 1.0 47.1 -16.2 -62.8 Total Revenue 6.8 15.3 16.8 34.5 -11.0 -13.8 Direct revenues 1.6 8.6 4.1 19.9 -64.6 -66.3 - Fiscal receipts 0.8 6.6 2.2 16.8 -76.3 -79.1 - Sales of goods and services 0.7 1.5 23.2 65.7 -38.4 -25.4 - Other 0.1 0.6 7.1 30.1 10.2 122.8 Transfers 5.2 6.7 281.2 665.9 66.6 122.4
Source: own calculations based on Eurostat - Government revenue, expenditure and main aggregates – May 2009

246
Table BG2: Sub-national government expenditure by economic function in Bulgaria Total government expenditure Development expenditure
average (2005-2007) average (2005-2007) % change p.a. (2000/02)-(2005/07)
subnat. gov % GDP
EU
subnat. gov %
general. gov.
EU subnat. gov % GDP
EU
subnat. gov %
general. gov.
EU subnat. gov % GDP
subnat. gov %
general. gov.
total Total 6.9 15.6 17.6 33.7 1.3 1.9 37.3 63.6 50.5 22.8 gf01 Gen. publ. services 0.7 2.4 11.3 39.0 gf02 Defense 0.1 0.0 3.9 0.2 gf03 Public order, safety 0.1 0.8 2.7 42.8 gf04 Economic affairs 0.9 1.9 18.2 48.7 0.2 0.7 13.3 50.4 76.4 45.9 gf05 Environment 0.8 0.6 69.2 82.8 0.3 0.2 71.6 84.5 18.4 10.0 gf06 Housing 0.7 0.9 74.1 85.4 0.5 0.4 73.2 81.0 97.9 36.3 gf07 Health 0.7 2.0 16.6 30.6 0.1 0.1 27.2 37.1 19.8 22.1 gf08 Recreation, culture 0.3 0.8 41.1 71.9 0.1 0.2 51.6 81.1 138.7 68.5 gf09 Education 2.2 3.3 56.4 62.8 0.1 0.3 30.9 84.0 49.6 0.9 gf10 Social protection 0.4 3.0 3.4 16.3
Source: own calculations based on Eurostat data - Government expenditure by function (COFOG) – November 2009

247
7.15. ROMANIA
1. Background Decentralisation in Romania began in 1991 with the adoption of a new Constitution, which recognises the principle of sub-national self-government. Local governments were gradually established through legislation. Sub-national financing system reform began in 1998 and local financing systems and the decentralisation of fiscal responsibilities have subsequently been consolidated in law.
2. Institutional organisation Central government at regional level is represented by 41 prefectures (prefecturi) managed by a prefect directly appointed by the government. Romania has a two-tiers sub-national government system, with: 42 counties (judete) and 3,173 “local authorities”, sub-divided into 2,854 rural municipalities (commune) and 319 urban municipalities. Bucharest has the dual status of county and municipality. Romania has no elected regional government but 8 development regions, with regional development councils representing counties.
3. Distribution of competences The division of responsibility between counties and municipalities is based on the principle of subidarity. Municipalities are responsible for basic local public services and counties have a coordinating role. Municipal competences cover roads, public transport, local and urban development services, social housing, education (remuneration of teaching staff), health care, social welfare services, and public order and safety. Counties are responsible for coordinating the activity of municipal and city councils in the delivery of public services. They are also responsible for county development, water supply, roads, social assistance to children and education. In practice, the division of responsibility between counties and municipalities, especially in rural areas, is not clear-cut. The development regions are not administrative but coordinating bodies. Each has a council for regional development composed of local and State representatives and is responsible for the design of regional development policies. In each region, regional development agencies are responsible for the implementation of development programmes, which are coordinated centrally by the National Council for Regional Development. Cohesion Policy is under the overall responsibility of the Ministry of Economy and Finance.
4. Control, cooperation and consultation In Romania, local interests are represented by three sub-national associations86, which have to be consulted on any matter affecting local governments or local interests. In practice, consultation is not systematic.
5. Facts and figures Sub-national government expenditure amounts to 9% of GDP and 24% of general government expenditure (Table RO1), both of which are below the EU12 average, though they have 86 The Romanian Municipalities Association, the Association of Romanian Towns and the Romanian Association of Communes.

248
increased over the past 5 years. Local government expenditure on fixed capital formation has risen considerably since 2000/02 to 2% of GDP which is above the EU average. Over the past few years, local tax receipts have also risen strongly and now make up over 80% of sub-national government revenue. Sub-national government expenditure mainly goes on education (31%), economic affairs (22%), and housing (13%) and social protection (13%). Development expenditure by local government is accounts for 38% of their total spending, which is 1.8% of GDP (Table RO2).

249
Table RO1: Sub-national government revenue and expenditure in Romania average 2005-2007 % change (2000/02)-(2005/07) subnat. gov. %
GDP EU average subnat. gov. %
general gov. EU average subnat. gov. %
GDP subnat. gov. %
general gov. Total Expenditure 8.5 15.5 24.1 33.8 30.4 43.8 Current expenditure excluding interest charges 6.4 12.9 22.8 32.6 13.3 26.9 - Compensation, Intermediate consumption 5.3 8.8 33.8 51.3 15.0 10.8 - Subsidies to companies 0.0 0.5 3.0 48.0 -81.2 -82.4 - Social benefits, transfers 1.1 3.6 10.2 16.9 32.5 81.2 Interest charges 0.1 0.4 8.5 14.9 810.7 2907.3 Capital expenditure 2.0 2.2 32.2 60.7 138.0 70.3 - Gross fixed capital formation 1.9 1.6 38.1 68.8 199.4 64.2 - Capital transfers 0.1 0.6 8.8 47.1 -48.1 -29.9 Total Revenue 8.4 15.3 25.4 34.5 28.7 43.0 Direct revenues 7.6 8.6 23.7 19.9 104.7 99.8 - Fiscal receipts 7.1 6.6 24.9 16.8 121.7 114.7 - Sales of goods and services 0.3 1.5 16.8 65.7 -15.8 -25.3 - Other 0.1 0.6 9.6 30.1 25.0 55.7 Transfers 0.8 6.7 73.6 665.9 -71.0 44.3
Source: own calculations based on Eurostat - Government revenue, expenditure and main aggregates – May 2009

250
Table RO2: Sub-national government expenditure by economic function in Romania Total government expenditure Development expenditure
average (2005-2007) average (2005-2007) % change p.a. (2002)-(2005/07)
subnat. gov % GDP
EU
subnat. gov %
general. gov.
EU subnat. gov % GDP
EU
subnat. gov %
general. gov.
EU subnat. gov % GDP
subnat. gov %
general. gov.
total Total 8.5 15.6 24.1 33.7 1.8 1.9 38.0 63.6 36.2 14.2 gf01 Gen. publ. services 1.0 2.4 27.8 39.0 gf02 Defense 0.0 0.0 0.1 0.2 gf03 Public order, safety 0.1 0.8 3.8 42.8 gf04 Economic affairs 1.9 1.9 29.8 48.7 0.8 0.7 30.0 50.4 49.3 10.0 gf05 Environment 0.2 0.6 64.3 82.8 0.1 0.2 61.5 84.5 gf06 Housing 1.1 0.9 69.5 85.4 0.5 0.4 57.1 81.0 12.1 -1.1 gf07 Health 0.0 2.0 1.1 30.6 0.0 0.1 5.8 37.1 121.1 166.6 gf08 Recreation, culture 0.5 0.8 64.6 71.9 0.1 0.2 75.1 81.1 45.6 30.1 gf09 Education 2.6 3.3 64.4 62.8 0.3 0.3 42.5 84.0 66.5 49.6 gf10 Social protection 1.0 3.0 10.7 16.3
Source: own calculations based on Eurostat data - Government expenditure by function (COFOG) – November 2009

251
7.16. CYPRUS
1. Background Cyprus became independent in 196087. The Constitution, dating from the same year, recognises the principle of local autonomy. In practice, however, local authorities have limited powers.
2. Institutional organisation The country is divided into six districts (eparchies) headed by a District Officer appointed by the government as its local representative. There are two types of local authority, governed by separate legislation: 33 (24)88 municipalities (dimarxia) in urban areas and 491 (354) communities in rural areas. The internal political organisation of both is similar.
3. Distribution of competences The Municipal Act (1985) stipulates that municipalities are responsible for carrying out “any function of local nature”. The Act also authorises the central government to delegate responsibility to the sub-national level. The main municipal responsibilities are for local roads and lighting, the disposal and treatment of waste and the environment. Water supply and sewerage are managed by specific agencies. Public health is a shared responsibility. Rural communities have similar responsibilities to municipalities, though but due to their limited resources, these are frequently assumed by district services.
4. Control, cooperation and consultation There is no formal system of consultation. In practice, the Union of Cyprus Municipalities (UCM) and the Union of Cyprus Communities are consulted on an ad hoc basis on issues of local concern by the Ministry of the Interior.
5. Facts and figures Cyprus has one of the lowest levels of sub-national government expenditure in the EU, amounting to only 2% of GDP and less than 5% of general government expenditures, though these figures have risen since 2000/02 (Table CY1). Most development expenditure is centrally administrated (Table CY2). Local government development expenditure represents only 14% of general government spending on this and just 0.4% of GDP. Half of such expenditure goes to housing.
87 When not indicated otherwise, the content of this section refers to the Greek-Cypriot part of the country. 88 The figures in brackets refer to the Republic of Cyprus (without the northern part of the country).

252
Table CY1: Sub-national government revenue and expenditure in Cyprus average 2005-2007 % change (2000/02)-(2005/07) subnat. gov. %
GDP EU average subnat. gov. %
general gov. EU average subnat. gov. %
GDP subnat. gov. %
general gov. Total Expenditure 2.1 15.5 4.8 33.8 27.2 13.2 Current expenditure excluding interest charges 1.3 12.9 3.5 32.6 23.1 7.6 - Compensation, Intermediate consumption 1.2 8.8 6.1 51.3 19.9 12.7 - Subsidies to companies 0.0 0.5 0.0 48.0 - Social benefits, transfers 0.1 3.6 0.3 16.9 225.0 140.9 Interest charges 0.1 0.4 4.5 14.9 71.9 72.8 Capital expenditure 0.7 2.2 17.7 60.7 27.8 20.4 - Gross fixed capital formation 0.7 1.6 21.7 68.8 27.8 24.7 - Capital transfers 0.0 0.6 0.0 47.1 Total Revenue 2.0 15.3 4.6 34.5 32.7 8.6 Direct revenues 1.0 8.6 2.4 19.9 3.9 -14.2 - Fiscal receipts 0.5 6.6 1.3 16.8 14.2 -7.1 - Sales of goods and services 0.4 1.5 14.8 65.7 -9.3 -20.6 - Other 0.1 0.6 5.6 30.1 63.9 92.9 Transfers 1.0 6.7 59.4 665.9 81.4 16.1
Source: own calculations based on Eurostat - Government revenue, expenditure and main aggregates – May 2009

253
Table CY2: Sub-national government expenditure by economic function in Cyprus Total government expenditure Development expenditure
average (2005-2007) average (2005-2007) % change p.a. (2000/02)-(2005/07)
subnat. gov % GDP
EU
subnat. gov %
general. gov.
EU subnat. gov % GDP
EU
subnat. gov %
general. gov.
EU subnat. gov % GDP
subnat. gov %
general. gov.
total Total 2.1 15.6 4.8 33.7 0.4 1.9 14.2 63.6 8.5 7.6 gf01 Gen. publ. services 0.9 2.4 8.9 39.0 gf02 Defense 0.0 0.0 0.0 0.2 gf03 Public order, safety 0.0 0.8 0.0 42.8 gf04 Economic affairs 0.0 1.9 0.0 48.7 0.0 0.7 0.0 50.4 gf05 Environment 0.3 0.6 91.7 82.8 0.1 0.2 95.8 84.5 8.8 0.2 gf06 Housing 0.6 0.9 24.1 85.4 0.2 0.4 19.0 81.0 8.3 2.9 gf07 Health 0.0 2.0 0.0 30.6 0.0 0.1 0.0 37.1 gf08 Recreation, culture 0.3 0.8 25.2 71.9 0.1 0.2 51.3 81.1 8.3 2.5 gf09 Education 0.0 3.3 0.0 62.8 0.0 0.3 0.0 84.0 gf10 Social protection 0.0 3.0 0.0 16.3
Source: own calculations based on Eurostat data - Government expenditure by function (COFOG) – November 2009

254
7.17. CZECH REPUBLIC
1. Background The current institutional setting of the Czech Republic derives from a series of reforms of the public administration. Three reforms that took place during the last 20 years can be considered particularly crucial: a renewal (reestablishment) of local self-governing units (municipalities) in 1990; a creation of higher self-governing units (krajs – NUTS3 regions), in 1997; the abolition of district authorities (former state administration bodies in territory), in 2002, and transfer their function both to the new regions (krajs) and municipalities with extended powers. These reforms have gradually reduced the tasks of the central administration through the formal transfer of competencies to lower levels of government.
2. Institutional organization Czech Republic is an unitary state with two tiers of sub-national self government structures (regions and municipalities). The central government legislates in all fields and devolves some competences to municipalities. The municipalities, obce, have own competences as regards water management, urban heating, waste management, health, social assistance, local streets and infrastructure, environmental protection and territorial planning etc. Moreover, certain municipalities have competences transferred from the central state such as primary education, local transport, agriculture, energy procurement, public safety and housing. Decentralisation towards local administration began in 1990 with the adoption of the Municipal Act conferring legal statute to municipalities, re-establishing local autonomy, defining municipal responsibilities and setting up municipal funding. The fourteen regions, krajs, are intermediate autonomous bodies set up in 2000, following the introduction of a constitutional law (no. 347/1997). They correspond to NUTS3 and have mostly a coordination role. These self-governing regions contribute to set up regional policy. They have their own budgets, coordinate their own development programmes and contribute to design, implement and monitor development programmes in the regions (law no. 248/2000). Krajs also assess intra-regional disparities and participate in the process of distribution of public funds for regional development. National authorities may issue guidelines to support Krajs in developing their programmes, however, given the independent competencies of these regions, the national level has only a very limited possibility to influence planning documents.
3. Distribution of competences Although institutional reforms have favoured an increasing devolution in relation to several responsibilities of the central government towards self-governing regions, a formal transfer of competencies has not yet been completed. In other words, Krajs’ access to financial resources remains highly regulated. For the purpose of the administration of Regional Operational Programmes, Krajs were aggregated into 8 Cohesion Regions at NUTS2 level. These are controlled by political representatives of participating Krajs. They started operating in 2008 after the approval of ROPs by the Czech Government and the EC. It is worth noting that, despite all the mentioned constraints, the real power of regions and municipalities to influence socioeconomic development is increasing because of absence any state authorities with some development responsibility in territory.

255
Exhibit 102 - Distribution of competences for regional development Central level Regional level Local level Public
corporations Basic infrastructure
Transport
Motorways, national/international roads (1st class), rail road, water road and water transport
Regional roads public transport, regional accessibility
Local roads, paths in town residential area municipal public transport
Czech Railroads, main provider still controlled by the central government Czech airlines undergoing a process of privatization
Telecommunications & information society
Only coordination, (the rest is in private hands)
May support in order to increase accessibility
May support in order to increase accessibility
Energy Strategic planning May support development of alternative resources
May support development of alternative resources
Czech energetic company, mixed ownership
Environment & water Pollution, biodiversity, pipelines
May support brownfield sites, revitalisation, biodiversity, landscape
Local environment, sewage system, provision of water, Brownfield sites, revitalisation
Health
Coordination of the health system, hospitals and special institutions
Regional (Krajs) hospitals
They may support municipal clinics, municipal hospitals
Human Resources
Education
Coordination of the whole education system, support public universities
Secondary school, educational establishment Arts and special interest schools, children's home etc.
Primary school
Training
Coordination Requalification (implemented by state bodies in territory – labour office)
May support
RTD
Coordination, indirect Czech Academy of Science, public universities (both autonomous)
May support May support
Productive environment
Industry Huge and diverse development programmes
May support May support
Services
Commercial services – Coordination Social services – establishing of several special social institutions
Commercial services - May support Social services – establishing and support of social institutions
Commercial services - May support Social services – establishing social utilities – rest home, stationary, social welfare institution, centres of social services etc.
Tourism Coordination Huge support May support

256
Others (housing, health, security) Coordination
Housing Security (municipal policy)
4. Control, cooperation and consultation In the Czech Republic there are no permanent institutions or arrangements that ensure dialogue and coordination between the different administrative levels. Except for some specific themes, where the power is divided among several stakeholders and coordination is guarantee by Government committee, responsibility to ensure dialog is entrusted to each public authority. In relation to dialogue, we can distinguish two formal consulting processes:
- Remark proceedings to Czech government is a formal aspect of decision making process which lead to a government decree. All central authorities may present their remarks. Also regions (kraj) may submit statements, but the central authority is not obliged to follow them. This process is very formal and in fact does not contain strong partnership aspect.
- Another mechanism is public consultation, which covers not only statements of all interested public authorities (central, regional, local – municipalities), but also representatives of civic society, interest self-government institutions (chambers, universities), representatives of interest group etc. This process is used, in particular, when new policies are designed or some crucial documents are produced (strategic plans, programmes).
On other side, the culture of “informal” and partnership consultation process was certainly strengthened by Cohesion Policy, particularly in the field of development policy. For instance, the National Strategic Reference Framework (NSRF) for 2007 - 2013 (and parent document -National Development Plan (NDP)) - was drafted while respecting the principle of partnership in line with the Article 11 of the Council Regulation No. 1083/2006, laying down general provisions on the European Regional Development Fund, the European Social Fund and the Cohesion Fund and repealing Regulation (EC) No. 1260/1999 (hereinafter "General Regulation"). The Ministry for Regional Development ensured the overall co-ordination of the preparation for the programming period of 2007 - 2013, including the preparation of the NDP and the NSRF. During this process, the attention was paid to ensure a functional partnership as one of the key preconditions for efficient use of the EU Structural Funds and the Cohesion Fund. The role of the Monitoring Committee of NSRF is fulfilled by the Management and Co-ordination Committee (MCC), established by MRD under Act No. 248/2000 Coll., on Regional Development Support. The role of MCC for the 2007 - 2013 programming period was determined in detail by the Government Resolution No. 245 of 2 March 2005. In line with the Statute, the MCC: • discusses and recommends the financial and factual modifications of the approved Operational Programmes; • discusses and approves the proposals and modifications of procedures and rules for the implementation of social and economic Cohesion Policy; • approves and submits to the Government measures to improve the efficient implementation of the NSRF and OPs; • discusses and approves the proposals for financial and factual modifications of the NSRF Commission's Decision. The MCC became the most important instrument for co-ordination which guarantees the involvement of all relevant stakeholders in the implementation of the SF and the CF. The Minister for Regional Development chairs the Committee, other members include representatives of relevant ministries, territorial self-government (represented by regions, including the Capital City of Prague

257
and representatives of the Union of Towns and Municipalities), economic and social partners, educational institutions and the non-profit sector. The meetings of the MCC are regularly attended by representatives of the Union of Czech and Moravian Production Co-operatives, the Agrarian Chamber of the CR and the Academy of Sciences of the CR as observers. Particular institutions nominated their representatives at a high enough level so that the MCC is able to adopt important decisions. Nominated representatives of partner organizations were actively involved in the preparation of strategic documents for the 2007 - 2013 programming period, mainly by commenting on the submitted versions of strategic and programming documents. The comments were presented at the meetings of the working groups. The comments were then incorporated into the relevant documents, subject to the final approval of the MCC. The partners are supposed to participate in the Monitoring committees and Working groups dealing with solution of individual issues related to implementation.
5. Facts and figures At the beginning of the 90ies, the central government expenditure was the dominant part of total government expenditure (84% in 1995). This share is still high but dropped significantly over time (in 2008 it was equal to 70%). Similar developments concern current expenditures and capital expenditures. The former actually experienced the strongest shift towards local government. Total expenditure share of local administration has started to steadily increase when public administration reform started to run in 2001. Therefore, we may conclude that local governments play important role in certain areas connected to their competencies and responsibilities given by legislation. These are especially the areas related directly to local development like health, social care, education or environmental protection. Local governments also influence public expenditure in transport or communication in considerable way. On the other hand most economic functions and functions with national influence like tertiary education are being almost solely financed by central government. Even though the analysis of formal arrangements and of expenditure data seem to confirm a trend of more decentralization towards local administrations, local administration revenues have remained low and several local governments and municipalities had to face “tight” budgets. While expenditure was increasing during the last decade, revenues did not increase to the same extent and many municipalities were forced to take bank loans and selling property; it seems that the situation has become more stable since 2007 when local levels gained budget surpluses. Exhibit 103 - Expenditure for development by administrative level
Administrative level 1995-1999
(annual average) % 2000-2007
(annual average) % Central government 5,536.1 53.2 7,607.0 42.9Local government 3,647.2 35.0 7,674.6 43.3Social security funds 1,223.3 11.8 2,453.1 13.8General government* 10,406.6 100.0 17,734.7 100.0(*) As sum of central, local and social security figures. Source: EUROSTAT, ČSÚ – National Statistics Office

258
8. ANNEX 2 - METHODOLOGICAL APPROACH: FINAL CLASSIFICATIONS AND TEMPLATES
8.1. INTRODUCTION This section of the report is meant to finalise the methodology for collecting and analysing public finance data, and to set out a common strategy for completing the study of competences in relation to regional development. The main features of the general trends observed in the distribution of competences in Europe during the last 10-15 years are examined in chapter 3 on the basis of Eurostat data. In relation to this part, a detailed overview of data availability in Eurostat and the related scope of the analysis were already presented in the inception report and no addition seems necessary. On the other hand, when the focus moves on from general features to competences in regional development and territorial differences in investment performance, further methodological remarks can be made.
8.2. MAIN IMPROVEMENTS TO THE METHODOLOGICAL APPROACH SPECIFIED IN THE INCEPTION PHASE A detailed check of available public finance data has been carried out in collaboration with national experts. Preliminary results of this check have already provided input into the inception report. This exploratory effort was concluded with a meeting with the experts held in Rome on the 8th of May. During the meeting, the problems to be resolved in each of the case study countries were discussed and a common strategy was agreed. All the experts from the 12 countries to be covered in depth were present, except three who, however, provided notes on the main issues to be considered in their specific cases. The fine-tuning of the methodological approach was mainly concerned with two issues: the definition of expenditure for development and the definition of the categories and functions to be used as a common foundation for the analysis in the country reports. In sum, the novel features of the methodology that deserve particular attention are the following:
• The definition of expenditure for development o is focused on capital expenditure for private and public investment as defined by
ESA95 and excludes capital flows which are mainly financial. o takes account of the table of correspondence with the COFOG classification
proposed by the DG REGIO. This entails considering COFOG level 2 wherever possible. When this is not feasible, a simplified version (COFOG level 1) will be used.
• A more detailed definition of the categories of expenditure and revenue in ESA 95 was agreed. A description of this is presented below (p. 262).
• When there is a trade-off in the available information and a choice is required between obtaining a high level of detail in terms of administrative levels, or alternatively, in terms of category of expenditure, the priority is administrative level. For example, if detailed data on fixed capital formation (e.g. P.51) is available only for general government, while only total capital expenditure is available for all administrative levels (s.1311, s.1312. s.1313), we choose the second.

259
Several approaches to the definition of development expenditure were examined. Any approach, such as for example that used for the assessment of additionality, has its own advantages and shortcomings. Even though it would be desirable to follow the same approach in each case, this would prove to be very difficult in practice since data availability for relevant categories of expenditure and revenues as well as methods for estimating them vary across countries and this greatly constraints the feasibility of any common approach. Therefore, it was agreed to follow a problem solving and flexible strategy which starts from a common basis but can be adjusted and improved as the work proceeds. The objective of achieving a territorial breakdown of public finance data represents a further complication which entails not only assessing how much is spent on development by the different levels of administration but also appraising differences between regions. In a number of countries this level of detail seems to be unattainable or it is possible only if total government expenditure is considered rather than regional development expenditure as such. In the cases where detailed data exist (e.g. for Italy or the UK), differences in the availability of data and in the methods used for estimation, make it unlikely that results which are comparable in absolute terms can be obtained. These caveats do not prevent, however, the analysis starting from common definitions and then the estimates being adjusted in each country according to the data available. Nor do they prevent expenditure on regional development being compared with the corresponding amount of support from the EU Cohesion Policy across regions. The strategy adopted for estimating territorial data, is, therefore, country specific as noted above, though the territorial dimension for which it is possible to obtain data, or to make estimates of expenditure, is likely to act as a further constraint on the analysis. In conclusion, national experts will start to collect data on the basis of common definitions that are, so far as possible, uniform in terms of detail, coverage and classification. However, they can apply a certain degree of flexibility when there are information constraints in order to provide the best possible approximation of regional development expenditure at different administrative levels as well as of the territorial breakdown. This flexible use of a shared method based on common definition, as noted above, means that caution will be needed when making comparisons across countries. Particular attention should be given, for instance, to structural differences between countries and regions (e.g. CONV vs. CRO).
8.3. DEFINITION OF MAIN CLASSIFICATIONS • Public expenditure and receipts – The following definitions of public expenditure and receipts
represent the common basis for collecting information across countries. The categories indicated relate to the ESA 95 classification.
EXPENDITURE Total Expenditure = P.2 + Intermediate consumption P.5 + Gross capital formation D.1P + Compensation of employees, payable D.29P + Other taxes on production, payable D.3P + Subsidies, payable D.4P + Property income, payable

260
D.5P + Current taxes on income, wealth etc., payable D.62P + Social benefits other than social transfers in kind, payable D.6311P + D.63121P + D.63131P + Social transfers in kind related to expenditure on products supplied to households via market producers D.7P + Other current transfers, payable D.8 + Adjustment for the change in net equity of households in pension funds reserves D.9P + Capital transfers, payable K.2 Acquisitions less disposals of non financial non-produced assets Total CURRRENT Expenditure = P.2 + Intermediate consumption D.1P + Compensation of employees, payable D.29P + Other taxes on production, payable D.3P + Subsidies, payable D.4P + Property income, payable D.5P + Current taxes on income, wealth etc., payable D.62P + Social benefits other than social transfers in kind, payable D.6311P + D.63121P + D.63131P + Social transfers in kind related to expenditure on products supplied to households via market producers D.7P + Other current transfers, payable D.8 + Adjustment for the change in net equity of households in pension funds reserves Total CAPITAL Expenditure = P.5 + Gross capital formation • P.51 Gross fixed capital formation • P.52 Changes in inventories • P.53 Acquisitions less disposals of valuables D.9P + Capital transfers, payable K.2 Acquisitions less disposals of non financial non-produced assets TOTAL CAPITAL EXPENDITURE FOR DEVELOPMENT P.51 + Gross fixed capital formation D.9P + Capital transfers, payable (only components oriented to the private sector) EXPENDITURE FOR REGIONAL DEVELOPMENT P.51 + Gross fixed capital formation D.9P + Capital transfers, payable (only components oriented to the private sector) Current expenditure for training REVENUES Total revenues P.11 + P.12 Market output and output for own final use P.131 + Payments for other non-market output D.2R + Taxes on production and imports, receivable D.39R + Other subsidies on production, receivable D.4R + Property income, receivable

261
D.5R + Current taxes on income, wealth etc., receivable D.61R + Social contributions, receivable D.7R + Other current transfers, receivable D.9R Capital transfers, receivable Total DIRECT revenues P.11 + P.12 Market output and output for own final use P.131 + Payments for other non-market output D.2R + Taxes on production and imports, receivable D.39R + Other subsidies on production, receivable D.4R + Property income, receivable D.5R + Current taxes on income, wealth etc., receivable D.61R + Social contributions, receivable Total INDIRECT revenues D.7R + Other current transfers, receivable D.9R Capital transfers, receivable
• Expenditure for regional development – The sum of capital expenditure (fixed investment
plus capital transfers) on certain functions or policy areas (see tables below) plus current expenditure for training is taken as the common basis for estimating the resources allocated to regional development. As a minimum, functions are defined at a simplified =COFOG 1-digit level (gross fixed capital formation and capital transfer to the private sector for economic affairs and environmental protection plus other functions where development expenditure in the country in question is known to be important, specifically, housing and community amenities and recreation, culture and religion, plus current expenditure on training) while a greater level of detail can be achieved when data at COFOG 2-digit level exists (see table below). If the latter is not possible, then national experts have been encouraged to provide data for an intermediate coverage between the two – i.e. COFOG 1-digit plus COFOG 2-digit where the data are available, the aim being to collect data at the most detailed level possible. The variation in the degree of detail of the functions, on which the analysis is focused across Member States, depending on the availability of the COFOG breakdown, implies that the development expenditure estimated at different administrative levels may well not be directly comparable across countries. Nevertheless, it seems worthwhile sacrificing some comparability in order to get as close as possible to a reasonable estimate of overall expenditure on regional development. At a later stage, it should be possible to estimate expenditure financed from the EU Cohesion Policy in each country in order to obtain a roughly comparable figure for the relative importance of this.

262
EXPENDITURE ON DEVELOPMENT – COFOG 1- DIGIT
EXPENDITURE ON DEVELOPMENT – COFOG 2-DIGIT
Type of expenditure
COFOG – 1 digit - division COFOG - 2 digit - groups
Gross fixed
capital formation
Capital transfer
to private sector
Current expenditure
4.1 - General economic, commercial and labour affairs YES YES NO
4.2 - Agriculture, forestry, fishing and hunting YES YES NO
4.3 - Fuel and energy YES YES NO 4.4 - Mining, manufacturing and construction YES YES NO
4.5 – Transport YES YES NO 4.6 – Communication YES YES NO
4 – Economic affairs
4.7 - Other industries YES YES NO 5 - Environmental protection
5 - TOTAL Environmental protection YES YES NO
6.1 - Housing development YES YES NO 6.2 - Community development YES YES NO 6.3 - Water supply YES YES NO
6 - Housing and community amenities
6.4 - Street lighting YES YES NO 7. Health 7.3 - Hospital Services YES NO NO
8.1 - Recreational and sporting services YES YES NO 8 - Recreation, culture and 8.2 - Cultural services YES YES NO
Type of expenditure
COFOG - 1 digit - division Gross fixed capital formation
Capital transfer to private
sectors
Current expenditure
1 - TOTAL General public services no no No 2 - TOTAL Defence no no No 3 - TOTAL Public order and safety no no No 4 - TOTAL Economic affairs yes yes No 5 - TOTAL Environmental protection yes yes No 6 - TOTAL Housing and community amenities yes yes No
7 - TOTAL Health yes no No 8 - TOTAL Recreation, culture and religion yes yes No
9 - TOTAL Education yes no yes only training
10 - TOTAL Social protection no no No
infrastructures support for enterprises training

263
religion 9.1 - Pre-primary and primary education YES NO NO 9.2 - Secondary education YES NO NO 9.3 - Post-secondary non-tertiary education YES NO NO 9.4 - Tertiary education YES NO NO 9 – Education
9.5 - Education not definable by level (training) YES YES YES
10 - Social protection 10.4 - Family and children YES NO NO
(R&D) 1.4; 4.8; 5.5; 6.5; 7.5; 8.5; 9.7 YES YES NO • Regions/Territorial distribution of the public expenditure – The possibility of calculating, or
estimating, budgetary indicators for each region of a country gives an insight into the national redistribution process and the role of the EU Cohesion Policy in the development of the different regions. This is important in countries with significant disparities between Convergence and Competitiveness objective regions (Spain, Italy, Germany). For the purpose of this study the most useful regionalisation of expenditure from one perspective, that of comparing expenditure financed by the EU Cohesion Policy with that financed from other sources, is at NUTS II level, but it is evident that for many (or most) countries it will not be possible to collect data at this level, nor in a number of cases – i.e. those where NUTS II regions do not correspond to administrative areas - is it relevant to do so (such as in Germany or the UK).
• Public sector and general government – The public sector includes general government and
public corporations. Where possible and, most importantly, where relevant (i.e. when they have a role in regional development), the public sector will be defined to include public corporations. Even though they are responsible for significant shares of investment in infrastructure and utilities (transport, water, etc.) in several countries, because they produce marketed goods and services, they hence are not included in the classification of the public sector adopted in the national accounts (ESA9589).
Given that public sector data are not always available in a detailed form, it was agreed: 1. to use the aggregate of Public sector (Public corporations + General government) where
the data exist but in this case also include the data for General Government; 2. to use General Government when Public Sector data including public corporations are not
available. • Proposed classification of administrative levels – According to ESA9590 general government
is divided into: 1. central government (S.1311)91. 2. state government (S.1312); 3. local government (S.1313); 4. social security funds (S.1314). The focus here is on the first three territorial levels.
89 (Eurostat, 2002) 90 Codes associated to the administrative levels are the ESA95 codes. 91 It generally includes: State (Ministries, Prime Minister’ Office, Fiscal agencies, Constitutional Bodies and the like); Research Bodies (Research institutes and experimental centres); Bodies producing economic services and public corporation; Independent administrative authorities.

264
• Regions and local government level - According to ESA95, “state government” includes only the “states” of the federal countries. Consequently, the regional administrative level – which is the most relevant in Cohesion Policy planning and implementation – is aggregated within a wider definition of “local government” including the lowest tiers of government. This aggregation prevents a complete multi-level analysis. Where possible in non federal states, it was therefore agreed to break down local government (S.1313) into: - regions (NUTS I or NUTS II as appropriate); - local authorities.
• Accrual/cash accounting – A cash system of accounting allows to be more coherent with EU
Cohesion Policy expenditure. However, the accrual method is adopted in national budgets or in the national accounts for general government in most cases. In line with the Commission expectations, the ESA 95 is the preferred system since it allows for comparisons.
• Grants between administrative levels – The data collected will be consolidated. In the cases
in which this is not fully possible, adequate explicative notes need to be introduced. In principle, when transfers between administrative levels are not available, these need to be estimated from a knowledge of the general direction of transfers (which is usually from the centre to the local or regional level).
• Expenditure financed by the EU Cohesion Policy – Information sources in DG Regio can
help in compiling data on this; the main source is the SFC data warehouse, which includes data on the allocation and expenditure of the EU Cohesion Policy. No information relating to the allocation of EU Cohesion Policy to specific administrative levels which actually spend the financial resources is available. This means that this allocation can be made only on the basis of the division of national expenditure on the same function, which might not be the case in practice but there is no other obvious solution.
Prices – Expenditure will be expressed at current prices throughout and related to GDP or total expenditure.
8.4. FINAL TEMPLATE FOR IN DEPTH COUNTRY ANALYSIS Synthesis (1-2 pages) This part will be written at the end of the study; it will summarise the main findings of the analysis as in an executive summary. Section 1 - National trends in public finance (2-3 pages) This section identifies the main trends in fiscal policy and public investment in the country over the past 15 years. The main reforms on the division of competences between institutions that took place during this period will be analysed to provide a framework of institutional arrangements and governance models. This analytical background will enable a better understanding to be gained of the present allocation of competences in development policies. The quantitative tables and analysis of this section will mainly be based on data available from Eurostat. The period considered is 1990-2008 (though this depends on the availability of data).

265
List of main tables (see Annex A) • Public deficit and public debt on GDP (public finance imbalance=) • Capital expenditure and public investment relative to total public expenditure and GDP
(investment92) • Public expenditure on development relative to total public expenditure and GDP (development
policy) • EU Cohesion Policy on public investment and public expenditure on development (EU
contribution to national development policy) Section 2 - Power and competences of the different administrative levels (4-5 pages) This section analyses the allocation of competences at the different administrative levels and the changes in this over the period 1994-2008. Experts will complete the synoptic table below and provide an analysis as well as a critical comment on the tables provided by the core team. a) Basic information on distribution of competences (synoptic table to be completed)
Central Regional /state Local Public corporations
Basic infrastructure x Xx Xxx Transport Telecommunications & information society
Energy Environment & water Health Human Resources Education Training RTD Productive environment Industry Services Tourism Others (access to employment, inclusion etc.)
b) Tables provided by the core team and analysed by the national expert (see annex A for guidelines): • Total public expenditure by administrative level = • Total public expenditure by function and by administrative level (role of each administrative
level in the different policy areas) • Direct revenues relative to the total and total expenditure by administrative level (apparent
autonomy of each administrative level) • Capital expenditure and public investment by administrative level (responsibility of each
administrative level for public investment) c) Commentary on: • institutional arrangements and multi-level governance in relation to the synoptic table
92 Defined as gross fixed capital formation of the General Government.

266
o distribution of institutional-legal and fiscal powers (over expenditure and direct revenues) among tiers
of government;
o main changes which occurred over the last 15 years, or since negotiations in relation to accession to the
EU began;
o present situation of the distribution of competences;
• arrangements for cooperation between tiers of government for shared competences.
Section 3 – National development policy and Cohesion Policy (6-8 pages) This step will deepen the analysis of expenditure on regional development (see Annex A pag.9) under the responsibility of the different administrative levels. The period covered will be 1994-2008, however the analysis will focus on the most recent years in particular. Experts will provide data and commentary. a) Tables: • Capital expenditure on the COFOG functions most relevant for regional development by
administrative level (role of each administrative level in strategic sectors, such as transport, support to firms, R&D, other infrastructure)
• Expenditure on development by administrative level (role of each administrative level in development policy)
b) Commentary on regional development • distribution of institutional-legal and fiscal powers (expenditure and direct revenues) between
tiers of government as regards regional development;
o main changes that have occurred over the past 15 years, or since negotiations in relation to accession
to the EU began;
o present distribution of competences;
• focus on competence for development policy and EU Cohesion Policy management, namely:
firms (sectoral), labour policies (training and human resources), infrastructure;
• arrangements for cooperation between tiers of government for shared competences.
• comparison between EU Cohesion Policy and national development policy expenditure by administrative level, even if approximate
Section 4 – Regionalisation of national policy for investment and development (4-5 pages) Where data allow, a territorial breakdown of expenditure will be made. The time period covered will be 2000-2008. Experts will provide data and commentary. a) Data (see annex A for guidelines) • Total capital expenditure or public investment relative to GDP by region • Capital expenditure or expenditure on development by administrative level and by region (role
of each administrative level for investment in the different regions)

267
• EU Cohesion Policy in total capital expenditure b) Commentary on territorial breakdown Conclusions 5 – Main findings from the previous sections (2-3 pages) The main findings of the previous sections will be summarised. To give an indication of the overall governance model (political, administrative, budgetary) in respect of development policies, the summary will cover trends in devolution and in revenue-raising powers and responsibility for expenditure of regional and local authorities; Where relevant and possible, bottlenecks and institutional/system shortcomings which had an impact on the institutional developments/evolution will be highlighted. Ongoing and planned reforms leading to further essential changes will be discussed.

268
9. ANNEX 3 - NOTE ON ACCOUNTING CONSIDERATIONS WITH SPECIAL REFERENCE TO THE UK BUT OF GENERAL APPLICABILITY There is another form of devolution which needs also to be taken into account in the study. This is the devolution of responsibility for the provision of certain goods and services, and of certain activities related to such provision, from the public to the private sector. This process of privatisation, which took off in the UK the early 1980s and accelerated rapidly for a decade or so, and which has continued since, if more cautiously and with some back-tracking in certain areas, has two main implications which are relevant here. The first is the effect on the provision of goods and services themselves and on the scale of public expenditure and of the size of the public sector more generally. The second is the effect on the government statistics which form the basis of much of this analysis in the study. There are two aspects to this. One is the fact that privatisation tends to change the form of public expenditure, or the economic categories to which expenditure is assigned. Instead of the provision of services being associated with the direct employment of staff or, in the case of, investment, with fixed capital formation, it tends to be associated instead with transfers to the organisations providing the service, or undertaking the investment, in the place of public authorities or agencies. Although the end result might be the same, in the sense that the same services are supplied, even perhaps to a similar standard, or the same investment is carried out, the way it is represented in the public sector accounts alters because the activity takes place in the private rather than public sector. This effect is similar, it should be noted, to that of shifting the perspective of analysis from the public sector to the General Government sector – i.e. from an accounting construct which incorporates public corporations and which, therefore, records the final expenditure of these, their fixed investment in particular, to one which excludes them and, therefore, includes in the accounts the transfers to them for carrying out the expenditure rather than the expenditure as such. In both cases, the general lesson to be drawn is that making a sharp distinction between transfers and final expenditure – between, in the present context, gross fixed capital formation and capital transfers – is of questionable meaningfulness, the more so if there is a change in the size of the public sector, or more accurately in the division between the public and private sector, over time. Although, therefore, the analysis presented here distinguishes between the two, it is arguably the sum of capital formation and capital transfers (i.e. total capital spending) which is most relevant for identifying overall expenditure on regional development in the UK as well as in other countries where the division between the public and private sector has changed. The other aspect which follows from the process of privatisation, or more generally from the greater exposure of the activities of public authorities to market forces, is the increased contribution of asset transactions and receipts from the sale of goods and services produced by public authorities to the funding of government expenditure. Indeed, part of the motive behind the move towards privatisation in the UK was precisely to generate the receipts concerned to help finance spending and take pressure off taxes and government borrowing. This motive was reinforced by the treatment of asset transactions and receipts from commercial activities in the public sector accounts. Instead of being treated as a means of funding public spending, therefore, they are treated as negative expenditure, as an offset to either current expenditure or capital formation which accordingly has the effect of reducing the published expenditure figures.

269
Accordingly, at a stroke, governments are able to report a reduction in public spending, and in the size of the public sector as conventionally measured, simply by selling off assets – such as a public corporation, or shares in one, an office block or a piece of land (such as a school playing field in the case of local authorities). Although these assets do not physically disappear but simply change ownership – indeed, in some cases, they might be leased back to the government or local authorities to use in much the same way as before – they are included in the accounts (in the national accounts as well as the public sector ones) as negative investment (or negative current expenditure in the case of receipts from the sale of goods and services. More than that, asset transactions and other such activities tend not to be shown separately but consolidated with (positive) expenditure so that only the net amount involved can be seen. This has major implications for the analysis here, which are perhaps more serious for the UK than for other countries, where the privatisation process has proceeded less far and, consequently, the scale of assets transactions – the receipts from the sales less purchases of assets – is smaller with a less pronounced effect on the published accounts. Once asset transactions become significant, the published figures, which are shown after these have been netted off, are no longer a meaningful measure of expenditure from the perspective of the present analysis. Although they might indicate the government outlays which need to be financed by either taxation or borrowing – which is one of the main purposes of the accounts – they no longer indicate the expenditure effort being made by government and its contribution to overall spending on economic development. This is most obvious in cases where, because of the scale of asset sales, the published expenditure figure becomes negative, which in the UK, once spending is broken down by function and by region, is not an infrequent occurrence. Before a meaningful analysis can be undertaken of government expenditure in the UK on economic development, of the way that it has tended to change over recent years and the contribution of the EU Cohesion Policy to funding it, it is essential that the published figures are corrected for assets transactions as well as for receipts from commercial activities. This effectively means adding the net receipts from these activities back on to the figures in the accounts in order to obtain a measure of gross expenditure – and, in particular, of gross fixed capital formation. The difficulty is, however, finding the relevant data to do this since the statistics in question are not typically published and, if they are, only at an aggregate level with no breakdown by function or region. The statistics that are presented in this study have involved a good deal of effort in sifting through the detailed government accounts of expenditure on different programmes in order to identify what are likely to be asset transactions. But since they are rarely labelled as such, the figures for gross expenditure which have been compiled from this process are inevitably approximate. In particular, there might be assets transactions or receipts from sales which have been missed, while there might also be purchases of assets which have been included (which like sales should be excluded because they do not involve new investment as such93). Nevertheless, the figures presented here should be reasonably close to actual government expenditure on development in the UK and unquestionably give a more reliable indication of this than the published data (whether by the UK Government or by Eurostat). The following exhibit sets out the estimates of gross capital expenditure which have been produced from the detailed public sector accounts data assembled by the UK Treasury – i.e. after making an adjustment for the sales less purchases of assets and other receipts which are netted off the 93 The same argument applies against including purchases of assets as against including sales, in the sense that all that has occurred is a change of ownership of an existing asset, which might not even involve a change in use, since the asset in question might have been leased before rather than owned. An office block is a good example.

270
published figures – in the policy areas which are eligible for Structural Fund support, which can be termed ‘development expenditure’. It also shows the division between gross fixed capital formation and capital transfers in these areas and how this has changed over time. Exhibit 104 - Public expenditure on capital formation and capital transfers in the UK, 2003-04 to 2008-09
2003-04 2004-05 2005-06 2006-07 2007-08 2008-09
Gross fixed capital formation4.1 Enterprise and economic development 1,561 1,839 1,538 1,808 2,007 2,2124.2 Science and technology 67 132 107 120 215 1674.3 Employment policies 268 101 298 119 7 274.4 Agriculture, fisheries and forestry 257 245 280 291 274 2544.5 Transport 5,202 5,524 6,347 6,733 7,017 7,3125. Environment protection 394 549 1,588 1,547 1,652 1,9166. Housing and community amenities 3,661 4,185 5,311 5,518 5,609 6,2447. Health 3,025 3,462 2,860 3,609 4,334 5,3648. Recreation, culture and religion 875 1,053 1,388 1,544 1,996 3,0249. Education 3,711 4,202 4,662 4,915 5,056 6,420Total gross fixed capital formation 19,020 21,291 24,380 26,205 28,168 32,942Capital transfers4.1 Enterprise and economic development 738 765 933 1,091 913 9974.2 Science and technology 439 382 576 509 583 4414.3 Employment policies 45 56 57 76 65 574.4 Agriculture, fisheries and forestry 53 42 65 99 84 1864.5 Transport 2,429 2,480 2,446 4,034 4,157 5,1575. Environment protection 365 370 622 688 623 7366. Housing and community amenities 2,916 3,351 3,399 4,125 4,751 5,1837. Health 293 256 256 277 247 2018. Recreation, culture and religion 681 454 396 376 405 3809. Education 1,333 1,524 2,005 2,041 2,197 2,532Total capital transfers 9,291 9,679 10,755 13,315 14,025 15,870Total gross capital expenditure4.1 Enterprise and economic development* 2,461 2,741 2,558 2,900 2,921 3,2094.2 Science and technology 505 514 683 630 798 6084.3 Employment policies 313 157 355 195 72 854.4 Agriculture, fisheries and forestry 310 286 345 391 358 4404.5 Transport 7,631 8,003 8,793 10,766 11,174 12,4695. Environment protection 758 918 2,209 2,235 2,275 2,6526. Housing and community amenities* 6,604 7,791 9,112 9,701 10,483 11,5567. Health 3,318 3,718 3,116 3,885 4,582 5,5668. Recreation, culture and religion 1,556 1,508 1,784 1,920 2,400 3,4049. Education 5,044 5,725 6,667 6,956 7,253 8,952Total gross captial expenditure 28,500 31,362 35,623 39,578 42,316 48,942
Gross fixed capital formation as % total4.1 Enterprise and economic development 63.4 67.1 60.1 62.4 68.7 68.94.2 Science and technology 13.2 25.7 15.7 19.1 26.9 27.44.3 Employment policies 85.7 64.2 83.9 61.1 9.9 32.14.4 Agriculture, fisheries and forestry 83.0 85.4 81.0 74.6 76.4 57.84.5 Transport 68.2 69.0 72.2 62.5 62.8 58.65. Environment protection 51.9 59.8 71.9 69.2 72.6 72.36. Housing and community amenities 55.4 53.7 58.3 56.9 53.5 54.07. Health 91.2 93.1 91.8 92.9 94.6 96.48. Recreation, culture and religion 56.2 69.9 77.8 80.4 83.1 88.89. Education 73.6 73.4 69.9 70.7 69.7 71.7Total 66.7 67.9 68.4 66.2 66.6 67.3
* Includes a small amount of stock-buildingNote: The figures involve some estimation to convert the published data in net terms to gross termsPublic expenditure refers here to the total expenditure managed by the UK Government and relates approximately to a General Government concept.Source: HM Treasury
£ million
% Total