Distribution of Belugas, Delphinapterus leucas, in Cook Inlet, Alaska ...
16
Distribution of Belugas, Delphinapterus leucas, in Cook Inlet, Alaska, During June/July 1993–2000 DAVID J. RUGH, KIM E. W. SHELDEN, and BARBARA A. MAHONEY Introduction Cook Inlet and the nearest stock in Bris- tol Bay (Laidre et al., 2000). Belugas in Belugas, Delphinapterus leucas, in- Cook Inlet are concentrated in the north- habit most of the Northern Hemisphere’s ern reaches of the inlet, at least during Arctic and subarctic seas (Gurevich, the spring (Huntington, 2000; Calkins 1 ), 1980). In U.S. waters in the summer, and their natal homing behavior may they are distributed around much of main- have kept them separated from other land Alaska from the Gulf of Alaska beluga stocks long enough to effect to the Beaufort Sea (Hazard, 1988), evolutionary differentiation (O’Corry- and five discrete stocks are recognized, Crowe et al., 1997). depending on their summer location: The geographic isolation of these Cook Inlet, Bristol Bay, Norton Sound, whales, in combination with their site the eastern Chukchi Sea, and the Beau- fidelity, makes this stock vulnerable to fort Sea (O’Corry-Crowe et al., 1997). impacts from large or persistent har- The most isolated is the Cook Inlet vests by Alaska Natives (Hill, 1996) and stock, separated from the others by the anthropogenic environmental hazards Alaska Peninsula (>900 km long), with (Moore et al., 2000; Calkins 2 ). A very virtually no whales reported between similar situation has occurred in the St. Lawrence River in eastern Canada, David Rugh ([email protected]) and Kim where a small, isolated stock of belugas Shelden are with the National Marine Mammal suffered an intense harvest in the past Laboratory, Alaska Fisheries Science Center, National Marine Fisheries Service, NOAA, 7600 Sand Point Way N.E., Seattle, WA 98115-6349. Barbara Mahoney is with the Western Alaska 1 Calkins, D. G. 1984. Belukha whale. Vol. IX Field Office, National Marine Fisheries Service, of Susitna hydroelectric project; final report; big NOAA, 222 W 7th Ave., Box 43, Anchorage, AK game studies. Alaska Dep. Fish Game. Doc. 99513-7577. 2328, 17 p. ABSTRACT—Aerial surveys of belugas, centration of belugas (151–288 whales by Delphinapterus leucas, in Cook Inlet were aerial count) was in the northern portion flown each year during June and/or July of upper Cook Inlet in the Susitna River from 1993 to 2000. This project was de- Delta and/or in Knik Arm. Another con- signed to delineate distribution and collect centration (17–49 whales) was consistently aerial counts, elements critical to the man- found between Chickaloon River and Point agement of this small, isolated stock that Possession. Smaller groups (generally <20 was subjected to a persistent harvest by whales) were occasionally found in Turn- Native hunters. The surveys provided a again Arm, Kachemak Bay, Redoubt Bay thorough, annual coverage of the coastal (Big River), and Trading Bay (McArthur areas of the inlet (1,350 km of shoreline) River) prior to 1995 but not thereafter. Over and included roughly 1,000 km of offshore the past three decades, summer distribution transects annually. Coastal transects were has shrunk such that sightings now only flown 1.4 km from the waterline, thus sur- rarely occur in lower Cook Inlet and in off- veying most of the area within 3 km of shore areas. In the 1990’s, most (96–100%) shore. These, along with offshore transects, of the sightings were concentrated in a few provided annual systematic searches of dense groups in shallow areas near river 13–33% of the entire inlet. The largest con- mouths in upper Cook Inlet. without leaving the area, and it is now vulnerable to anthropogenic contami- nants (Kingsley, 1998). Remarkable site tenacity despite hunting pressure was also demonstrated by belugas in a study conducted by Caron and Smith (1990) in eastern Hudson Bay, Canada. Concern for the management of the Cook Inlet stock led to a project begun in 1993 with funding from the Marine MammalAssessment Program of the Na- tional Oceanic and Atmospheric Admin- istration (NOAA). This project was con- ducted by NOAA’s National Marine Mammal Laboratory (NMML), Alaska Fisheries Science Center, National Marine Fisheries Service (NMFS), in cooperation with the NMFS Alaska Re- gional Office, the Alaska Beluga Whale Committee (ABWC), and the Cook Inlet Marine Mammal Council (CIMMC, which was established in 1994). Basic to the assessment of the Cook Inlet stock was the documentation of the distribution and abundance of these whales. Aerial surveys are the estab- lished method for collecting these data (e.g. Calkins 1 ; Klinkhart 3 ; Murray and Fay 4 ). Accordingly, the objectives of our 2 Calkins, D. G. 1983. Marine mammals of lower Cook Inlet and the potential for impact from Outer Continental Shelf oil and gas exploration, development, and transport. Research Unit 243; Final Rep. of Principal Investigators, Outer Con- tinental Shelf Environ. Assessment Program, U.S. Dep. Commer., NOAA, Natl. Ocean Serv., Off. Oceanogr. Mar. Serv., Ocean Assessments Div. 20:171–263. 3 Klinkhart, E. G. 1966. The beluga whale in Alaska. Alaska Dep. Fish Game, Juneau, Fed. Aid Wildl. Restor. Proj. Rep. Vol. VII, Proj. W-6-R and W-14-R, 11 p. 4 Murray, N. K., and F. H. Fay. 1979. The white whales or belukhas, Delphinapterus leucas, of Cook Inlet, Alaska. Unpubl. pap. SC/31/SM12 pres. to Int. Whal. Comm. Sci. Committee, 7 p. 6 Marine Fisheries Review
Transcript of Distribution of Belugas, Delphinapterus leucas, in Cook Inlet, Alaska ...
Distribution of Belugas, Delphinapterus leucas, in Cook Inlet, Alaska, During June/July 1993–2000
DAVID J. RUGH, KIM E. W. SHELDEN, and BARBARA A. MAHONEY
Introduction Cook Inlet and the nearest stock in Bristol Bay (Laidre et al., 2000). Belugas in
Belugas, Delphinapterus leucas, in- Cook Inlet are concentrated in the north-habit most of the Northern Hemisphere’s ern reaches of the inlet, at least during Arctic and subarctic seas (Gurevich, the spring (Huntington, 2000; Calkins1), 1980). In U.S. waters in the summer, and their natal homing behavior may they are distributed around much of main- have kept them separated from other land Alaska from the Gulf of Alaska beluga stocks long enough to effect to the Beaufort Sea (Hazard, 1988), evolutionary differentiation (O’Corryand five discrete stocks are recognized, Crowe et al., 1997). depending on their summer location: The geographic isolation of these Cook Inlet, Bristol Bay, Norton Sound, whales, in combination with their site the eastern Chukchi Sea, and the Beau-fidelity, makes this stock vulnerable to fort Sea (O’Corry-Crowe et al., 1997). impacts from large or persistent har-
The most isolated is the Cook Inlet vests by Alaska Natives (Hill, 1996) and stock, separated from the others by the anthropogenic environmental hazards Alaska Peninsula (>900 km long), with (Moore et al., 2000; Calkins2). A very virtually no whales reported between similar situation has occurred in the
St. Lawrence River in eastern Canada,
David Rugh ([email protected]) and Kim where a small, isolated stock of belugas
Shelden are with the National Marine Mammal suffered an intense harvest in the past Laboratory, Alaska Fisheries Science Center,National Marine Fisheries Service, NOAA, 7600 Sand Point Way N.E., Seattle, WA 98115-6349. Barbara Mahoney is with the Western Alaska 1 Calkins, D. G. 1984. Belukha whale. Vol. IX Field Office, National Marine Fisheries Service, of Susitna hydroelectric project; final report; big NOAA, 222 W 7th Ave., Box 43, Anchorage, AK game studies. Alaska Dep. Fish Game. Doc. 99513-7577. 2328, 17 p.
ABSTRACT—Aerial surveys of belugas, centration of belugas (151–288 whales by Delphinapterus leucas, in Cook Inlet were aerial count) was in the northern portion flown each year during June and/or July of upper Cook Inlet in the Susitna River from 1993 to 2000. This project was de- Delta and/or in Knik Arm. Another con-signed to delineate distribution and collect centration (17–49 whales) was consistently aerial counts, elements critical to the man- found between Chickaloon River and Point agement of this small, isolated stock that Possession. Smaller groups (generally <20 was subjected to a persistent harvest by whales) were occasionally found in Turn-Native hunters. The surveys provided a again Arm, Kachemak Bay, Redoubt Bay thorough, annual coverage of the coastal (Big River), and Trading Bay (McArthur areas of the inlet (1,350 km of shoreline) River) prior to 1995 but not thereafter. Over and included roughly 1,000 km of offshore the past three decades, summer distribution transects annually. Coastal transects were has shrunk such that sightings now only flown 1.4 km from the waterline, thus sur- rarely occur in lower Cook Inlet and in offveying most of the area within 3 km of shore areas. In the 1990’s, most (96–100%) shore. These, along with offshore transects, of the sightings were concentrated in a few provided annual systematic searches of dense groups in shallow areas near river 13–33% of the entire inlet. The largest con- mouths in upper Cook Inlet.
without leaving the area, and it is now vulnerable to anthropogenic contaminants (Kingsley, 1998). Remarkable site tenacity despite hunting pressure was also demonstrated by belugas in a study conducted by Caron and Smith (1990) in eastern Hudson Bay, Canada.
Concern for the management of the Cook Inlet stock led to a project begun in 1993 with funding from the Marine MammalAssessment Program of the National Oceanic and Atmospheric Administration (NOAA). This project was conducted by NOAA’s National Marine Mammal Laboratory (NMML), Alaska Fisheries Science Center, National Marine Fisheries Service (NMFS), in cooperation with the NMFS Alaska Regional Office, the Alaska Beluga Whale Committee (ABWC), and the Cook Inlet Marine Mammal Council (CIMMC, which was established in 1994).
Basic to the assessment of the Cook Inlet stock was the documentation of the distribution and abundance of these whales. Aerial surveys are the established method for collecting these data (e.g. Calkins1; Klinkhart3; Murray and Fay4). Accordingly, the objectives of our
2 Calkins, D. G. 1983. Marine mammals of lower Cook Inlet and the potential for impact from Outer Continental Shelf oil and gas exploration, development, and transport. Research Unit 243; Final Rep. of Principal Investigators, Outer Continental Shelf Environ. Assessment Program, U.S. Dep. Commer., NOAA, Natl. Ocean Serv., Off. Oceanogr. Mar. Serv., Ocean Assessments Div. 20:171–263. 3 Klinkhart, E. G. 1966. The beluga whale in Alaska. Alaska Dep. Fish Game, Juneau, Fed. Aid Wildl. Restor. Proj. Rep. Vol. VII, Proj. W-6-R and W-14-R, 11 p. 4 Murray, N. K., and F. H. Fay. 1979. The white whales or belukhas, Delphinapterus leucas, of Cook Inlet, Alaska. Unpubl. pap. SC/31/SM12 pres. to Int. Whal. Comm. Sci. Committee, 7 p.
6 Marine Fisheries Review
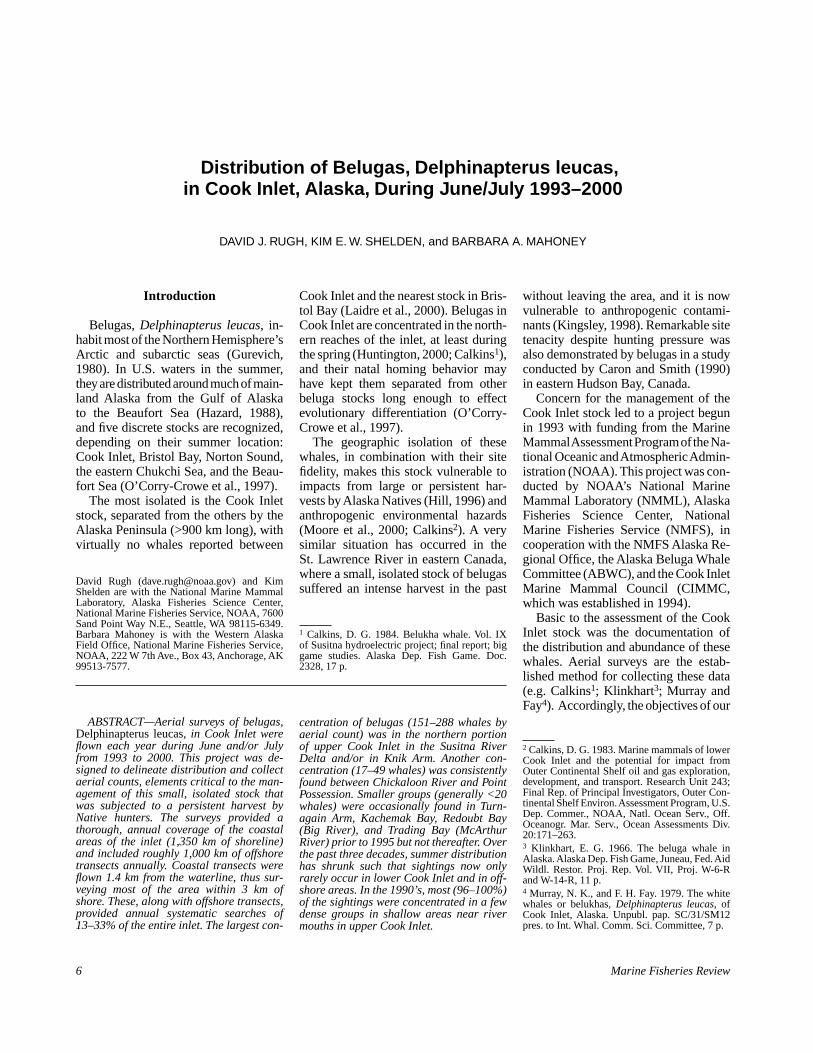
Figure 1.—Beluga groups seen 2–5 June 1993 during coastal and offshore aerial surveys of Cook Inlet, Alaska, with tracklines shown. In this and the subsequent maps, only one sampling from each area is represented, and poor viewing conditions were not included. Virtually all of the sightings were near shore or along the edge of mudflats in upper Cook Inlet, and 80% were between the Susitna Delta and Knik Arm.
field studies were to 1) make complete searches for belugas around the perimeter of Cook Inlet, 2) fly transects over the offshore waters of Cook Inlet, and 3) make systematic counts of belugas for aerial estimations of group sizes. Aerial survey procedures were refined from year to year, but the basic survey and counting methods were kept consistent.
The objectives of this paper are to: 1) describe distributional information on belugas in Cook Inlet during June/July, the optimal survey period (belugas out-side the inlet are reported by Laidre et al. (2000)), 2) compare recent distributional data to data collected in previous surveys, and 3) provide group size es
timates for calculations of stock size. Abundance estimates are presented in Hobbs et al. (2000a). These are based on summary counts from the aerial effort (reported here), in combination with correction factors using paired-observer effort (Hobbs et al., 2000b), video documentation (Hobbs et al., 2000b), and surfacing times of radio-tagged whales (Lerczak et al., 2000).
Methods
Study Area
The study area, Cook Inlet, is a major marine feature in south-central Alaska, covering approximately 20,000
km2 with 1,350 km of shoreline. The boundaries of this study area include all waters in the inlet north of an imaginary line from Elizabeth Island to Cape Douglas (Fig. 1) where belugas could occur, including rivers, shoals, and mud-flats where the water appeared to be deeper than about 1 m. An imaginary line between East and West Foreland (at lat. 60° 43′N) made a convenient break between upper and lower Cook Inlet. This provided a division of the inlet for comparisons to previous surveys. Anchorage, the largest city in Alaska, is in the northeastern portion of the inlet and served as a convenient base of operations for these aerial surveys. A descrip-
62(3), 2000 7
tion of beluga habitat in Cook Inlet can be found in Moore et al. (2000).
The extremely turbid inlet waters in areas where belugas occur means that the whales are visible only when at the surface, unlike in the clear waters of the Arctic where whales are sometimes visible well below the water surface when seen from an aircraft. The young, gray individuals are especially difficult to see in the brown water of Cook Inlet.
Survey Protocol
The survey aircraft used on most flights from 1993 to 2000 was an Aero Commander 680 FL5 with twin engines, high wings, 10-h flying capability, and seating capacity for five passengers and one pilot. The June 1997 survey was flown in a DeHavilland Twin Otter, which was larger but had similar characteristics to the Aero Commander. Both aircraft had large bubble windows at the forward observer positions. An intercom system allowed communication among the observers (2 on the left and 1 on the right), data recorder, and pilot. After 1993, a selective listening control-device was installed to aurally isolate the observers, who were also visually isolated from each other. This allowed for paired, independent observations as a check of sighting rates (Hobbs et al., 2000b). Most observers had previous experience on many marine mammal projects prior to flying with these surveys, and a core team flew on the Cook Inlet surveys for 7–8 seasons (see Acknowledgments).
Position data were collected from the aircraft’s Global Positioning System (GPS) interfaced with a laptop computer used to enter sighting data. Data entries included routine updates of time and location at 1-min intervals and manual entries of percent cloud cover, sea state (Beaufort scale), glare (for each observer), visibility (on the left and right), and each beginning and end of a transect leg. Visibility was categorized into 5 subjective classes graded from excellent to useless based on sea state, glare, avail-able light, and the condition of the ob-
5 Mention of trade names or commercial firms does not imply endorsement by the National Marine Fisheries Service, NOAA.
servation window (whether it had rain, fog, or reflections). When survey conditions were considered poor or use-less, they were treated in the analysis as unsampled areas. Observer seating positions were recorded each time they were changed, generally every 1–2 h, to minimize fatigue.
Tides
Tide heights in Cook Inlet were highly variable across the full geographical range of these surveys. No attempts were made to synchronize the flights with the predicted low tide, except in the Susitna Delta, because large groups of whales were found there consistently. The major advantage to surveying at low tide was that the effective survey area was greatly reduced in large parts of upper Cook Inlet dominated by extensive tidal flats.
Coastal Surveys
Coastal surveys were designed to maximize opportunities for finding belugas in shallow, nearshore waters where they typically range in summer (Calkins1). These surveys were conducted on a track-line about 1.4 km from the waterline. The trackline distance from shore was monitored by using an inclinometer to keep the water’s edge 10% below the horizon while the aircraft was at the standard altitude of 244 m (800 ft). We found this altitude and the 10% search area to be a good compromise between maximal visual range and optimal sighting cue size without resulting in any evident disturbance to the animals. Ground speed was generally 170– 185 km/h (90–100 kn), the minimum safe flying speed. Coastal surveys included searches of 5–20 km up each prominent river until the water appeared to be less than 1 m deep, based on the appearance of rapids or riffles. Distances flown up rivers were considered adequate according to Native hunters who flew with this project (see Acknowledgments).
Offshore Transects
In addition to the coastal surveys, off-shore transects were flown across the inlet in most years (depending on avail-able funds). A sawtooth pattern of track-lines was designed to cross shore at
points about 30 km apart starting from Anchorage and zigzagging to the south-ern limits of Cook Inlet, between Cape Douglas and Elizabeth Island (Fig.1–9). Observers searched primarily within 1.4 km of the aircraft, but viewing conditions were usually so good they allowed for searches well beyond that distance.
Circling Over Whales
After a group of belugas was found, it was flown over at perpendicular angles to determine the perimeters of the group. This provided an accurate location of the group for mapping as well as a measure of group density by later comparing the number of whales relative to the total area in which the group was found. Next, a series of straight-line aerial passes was made on either side of the group until one or two pairs of observers could make at least four good counts each. The pilot was directed to fly close enough to the whales to optimize counting conditions (while maintaining an altitude of 244 m) but far enough away to keep the entire group in view. On each aerial pass, time spent counting was synchronized among the observers and recorded to the second. These counts were kept confidential until the season was over. A video camera documented most counting passes over each group of whales; this provided images for later analysis (Hobbs et al., 2000b). The observation time averaged about 0.5 h per whale group. In Cook Inlet, belugas were usually very concentrated, generally making it easy to define each group; however, when there were loose aggregations of whales, groups were defined as a function of convenience for counting while circling over them. This usually meant all whales within 100 m of each other were treated as a group for counting purposes.
Analytical Methods
Aerial counts used in this report are the medians of all of the primary observers’ median counts made during multiple passes over a group. The process of using medians instead of means or maximum numbers reduces the effect of outliers (extreme counts) and makes the results more comparable to other surveys which lack multiple passes over whale
8 Marine Fisheries Review
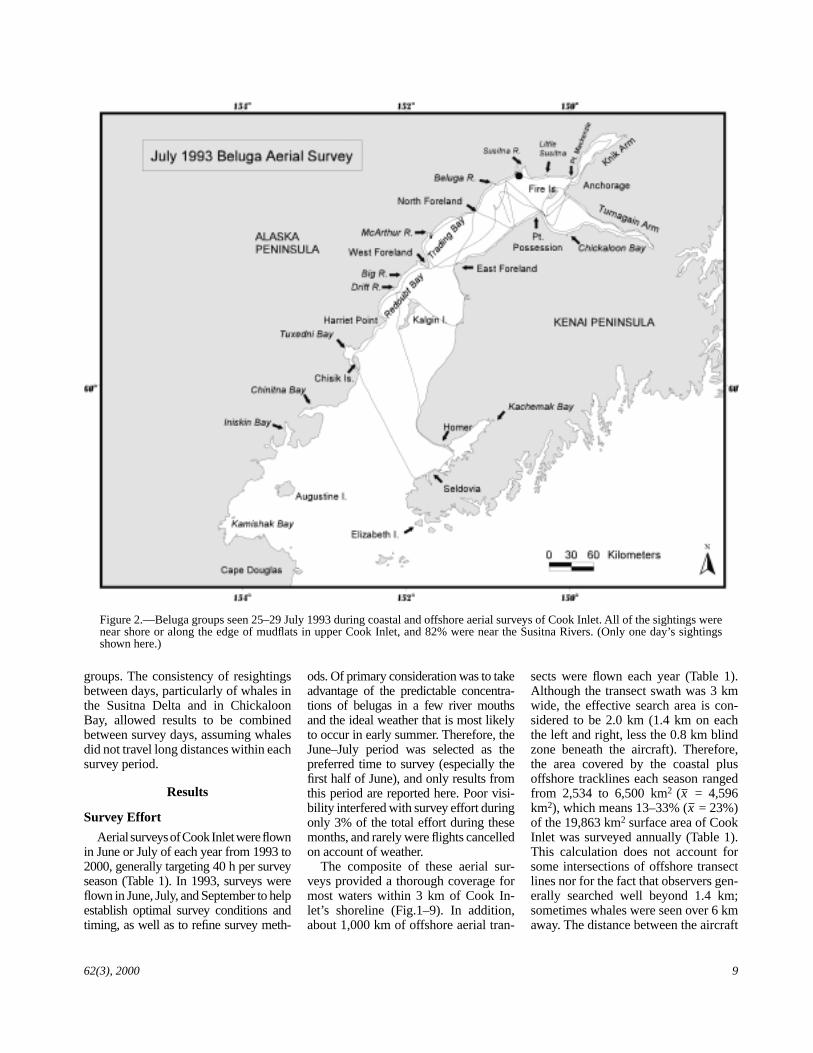
Figure 2.—Beluga groups seen 25–29 July 1993 during coastal and offshore aerial surveys of Cook Inlet. All of the sightings were near shore or along the edge of mudflats in upper Cook Inlet, and 82% were near the Susitna Rivers. (Only one day’s sightings shown here.)
groups. The consistency of resightings between days, particularly of whales in the Susitna Delta and in Chickaloon Bay, allowed results to be combined between survey days, assuming whales did not travel long distances within each survey period.
Results
Survey Effort
Aerial surveys of Cook Inlet were flown in June or July of each year from 1993 to 2000, generally targeting 40 h per survey season (Table 1). In 1993, surveys were flown in June, July, and September to help establish optimal survey conditions and timing, as well as to refine survey meth
ods. Of primary consideration was to take advantage of the predictable concentrations of belugas in a few river mouths and the ideal weather that is most likely to occur in early summer. Therefore, the June–July period was selected as the preferred time to survey (especially the first half of June), and only results from this period are reported here. Poor visibility interfered with survey effort during only 3% of the total effort during these months, and rarely were flights cancelled on account of weather.
The composite of these aerial surveys provided a thorough coverage for most waters within 3 km of Cook In-let’s shoreline (Fig.1–9). In addition, about 1,000 km of offshore aerial tran
sects were flown each year (Table 1). Although the transect swath was 3 km wide, the effective search area is considered to be 2.0 km (1.4 km on each the left and right, less the 0.8 km blind zone beneath the aircraft). Therefore, the area covered by the coastal plus offshore tracklines each season ranged from 2,534 to 6,500 km2 (x = 4,596 km2), which means 13–33% (x = 23%) of the 19,863 km2 surface area of Cook Inlet was surveyed annually (Table 1). This calculation does not account for some intersections of offshore transect lines nor for the fact that observers generally searched well beyond 1.4 km; sometimes whales were seen over 6 km away. The distance between the aircraft
62(3), 2000 9
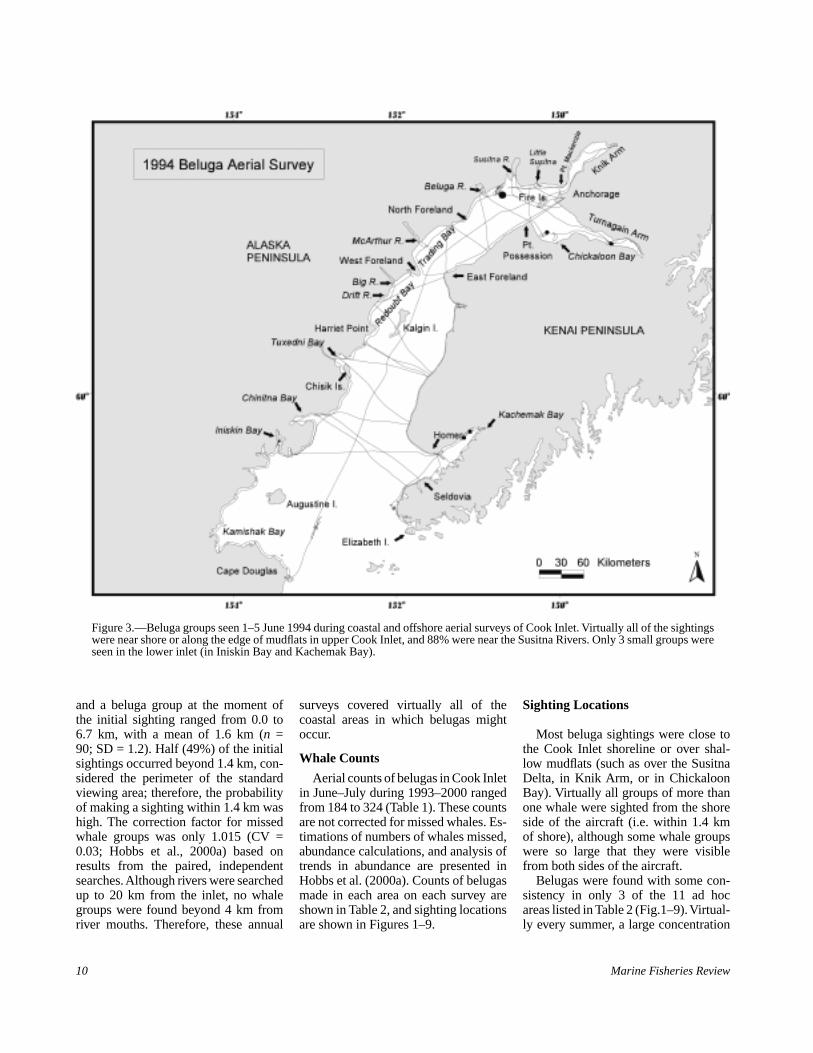
Figure 3.—Beluga groups seen 1–5 June 1994 during coastal and offshore aerial surveys of Cook Inlet. Virtually all of the sightings were near shore or along the edge of mudflats in upper Cook Inlet, and 88% were near the Susitna Rivers. Only 3 small groups were seen in the lower inlet (in Iniskin Bay and Kachemak Bay).
and a beluga group at the moment of surveys covered virtually all of the Sighting Locations the initial sighting ranged from 0.0 to coastal areas in which belugas might 6.7 km, with a mean of 1.6 km (n = occur. Most beluga sightings were close to 90; SD = 1.2). Half (49%) of the initial sightings occurred beyond 1.4 km, con- Whale Counts
the Cook Inlet shoreline or over shal-low mudflats (such as over the Susitna
sidered the perimeter of the standard Aerial counts of belugas in Cook Inlet Delta, in Knik Arm, or in Chickaloon viewing area; therefore, the probability in June–July during 1993–2000 ranged Bay). Virtually all groups of more than of making a sighting within 1.4 km was from 184 to 324 (Table 1). These counts one whale were sighted from the shore high. The correction factor for missed are not corrected for missed whales. Es- side of the aircraft (i.e. within 1.4 km whale groups was only 1.015 (CV = timations of numbers of whales missed, of shore), although some whale groups 0.03; Hobbs et al., 2000a) based on abundance calculations, and analysis of were so large that they were visible results from the paired, independent trends in abundance are presented in from both sides of the aircraft. searches. Although rivers were searched Hobbs et al. (2000a). Counts of belugas Belugas were found with some con-up to 20 km from the inlet, no whale made in each area on each survey are sistency in only 3 of the 11 ad hoc groups were found beyond 4 km from shown in Table 2, and sighting locations areas listed in Table 2 (Fig.1–9). Virtual-river mouths. Therefore, these annual are shown in Figures 1–9. ly every summer, a large concentration
10 Marine Fisheries Review
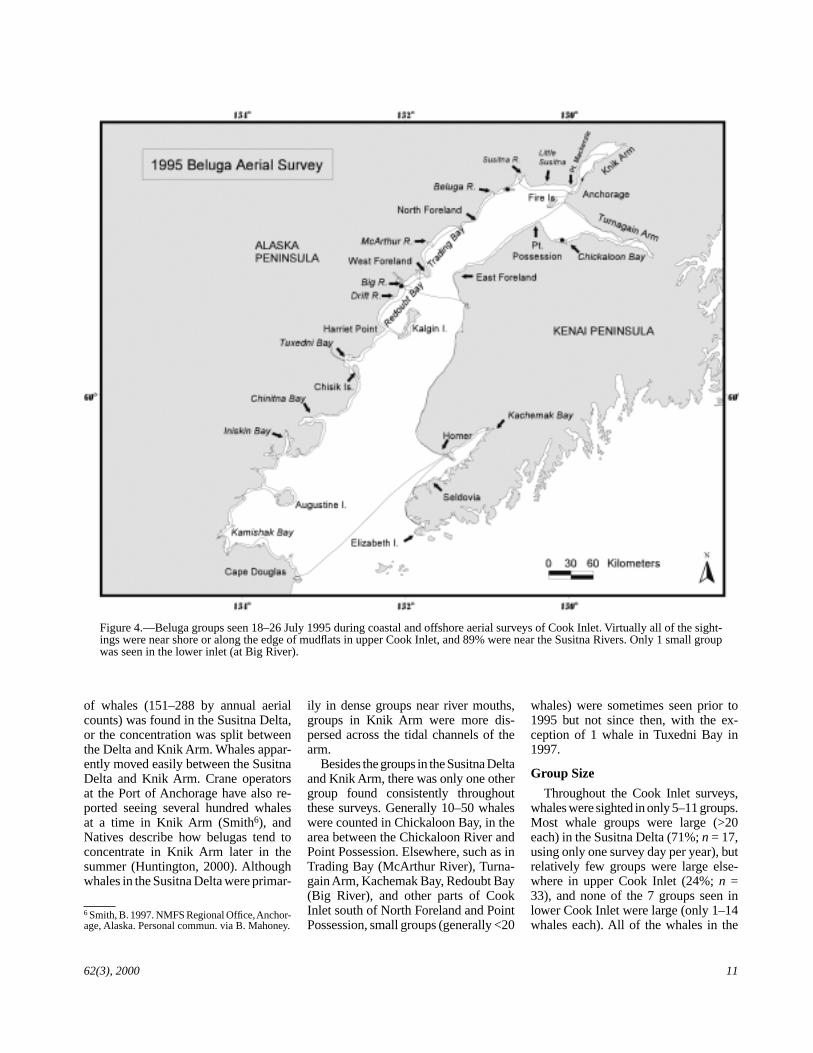
Figure 4.—Beluga groups seen 18–26 July 1995 during coastal and offshore aerial surveys of Cook Inlet. Virtually all of the sightings were near shore or along the edge of mudflats in upper Cook Inlet, and 89% were near the Susitna Rivers. Only 1 small group was seen in the lower inlet (at Big River).
of whales (151–288 by annual aerial ily in dense groups near river mouths, whales) were sometimes seen prior to counts) was found in the Susitna Delta, groups in Knik Arm were more dis- 1995 but not since then, with the ex-or the concentration was split between persed across the tidal channels of the ception of 1 whale in Tuxedni Bay in the Delta and Knik Arm. Whales appar- arm. 1997. ently moved easily between the Susitna Delta and Knik Arm. Crane operators
Besides the groups in the Susitna Delta and Knik Arm, there was only one other Group Size
at the Port of Anchorage have also re- group found consistently throughout Throughout the Cook Inlet surveys, ported seeing several hundred whales these surveys. Generally 10–50 whales whales were sighted in only 5–11 groups. at a time in Knik Arm (Smith6), and were counted in Chickaloon Bay, in the Most whale groups were large (>20 Natives describe how belugas tend to area between the Chickaloon River and each) in the Susitna Delta (71%; n = 17, concentrate in Knik Arm later in the Point Possession. Elsewhere, such as in using only one survey day per year), but summer (Huntington, 2000). Although Trading Bay (McArthur River), Turna- relatively few groups were large else-whales in the Susitna Delta were primar- gain Arm, Kachemak Bay, Redoubt Bay where in upper Cook Inlet (24%; n =
(Big River), and other parts of Cook 33), and none of the 7 groups seen in 6 Smith, B. 1997. NMFS Regional Office, Anchor-age, Alaska. Personal commun. via B. Mahoney.
Inlet south of North Foreland and Point Possession, small groups (generally <20
lower Cook Inlet were large (only 1–14 whales each). All of the whales in the
62(3), 2000 11
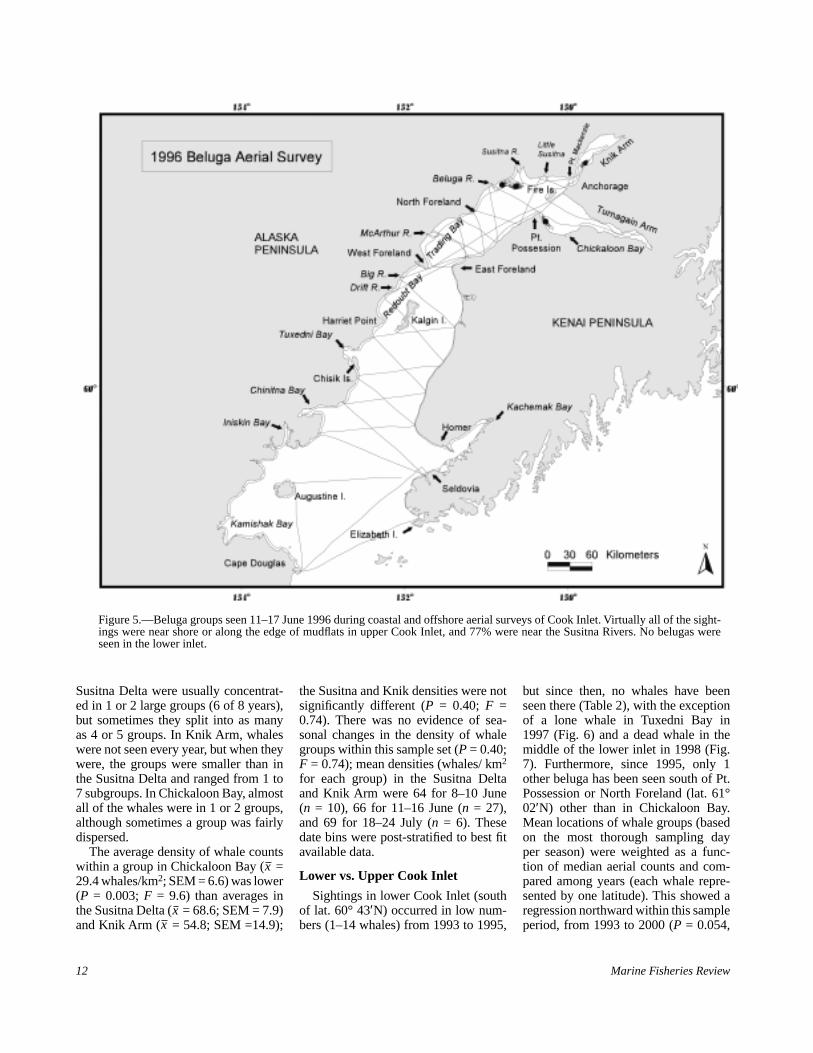
Figure 5.—Beluga groups seen 11–17 June 1996 during coastal and offshore aerial surveys of Cook Inlet. Virtually all of the sightings were near shore or along the edge of mudflats in upper Cook Inlet, and 77% were near the Susitna Rivers. No belugas were seen in the lower inlet.
Susitna Delta were usually concentrated in 1 or 2 large groups (6 of 8 years), but sometimes they split into as many as 4 or 5 groups. In Knik Arm, whales were not seen every year, but when they were, the groups were smaller than in the Susitna Delta and ranged from 1 to 7 subgroups. In Chickaloon Bay, almost all of the whales were in 1 or 2 groups, although sometimes a group was fairly dispersed.
The average density of whale counts within a group in Chickaloon Bay (x = 29.4 whales/km2; SEM = 6.6) was lower (P = 0.003; F = 9.6) than averages in the Susitna Delta (x = 68.6; SEM = 7.9) and Knik Arm (x = 54.8; SEM =14.9);
the Susitna and Knik densities were not significantly different (P = 0.40; F = 0.74). There was no evidence of seasonal changes in the density of whale groups within this sample set (P = 0.40; F = 0.74); mean densities (whales/ km2
for each group) in the Susitna Delta and Knik Arm were 64 for 8–10 June (n = 10), 66 for 11–16 June (n = 27), and 69 for 18–24 July (n = 6). These date bins were post-stratified to best fit available data.
Lower vs. Upper Cook Inlet
Sightings in lower Cook Inlet (south of lat. 60° 43′N) occurred in low numbers (1–14 whales) from 1993 to 1995,
but since then, no whales have been seen there (Table 2), with the exception of a lone whale in Tuxedni Bay in 1997 (Fig. 6) and a dead whale in the middle of the lower inlet in 1998 (Fig. 7). Furthermore, since 1995, only 1 other beluga has been seen south of Pt. Possession or North Foreland (lat. 61° 02′N) other than in Chickaloon Bay. Mean locations of whale groups (based on the most thorough sampling day per season) were weighted as a function of median aerial counts and compared among years (each whale represented by one latitude). This showed a regression northward within this sample period, from 1993 to 2000 (P = 0.054,
12 Marine Fisheries Review
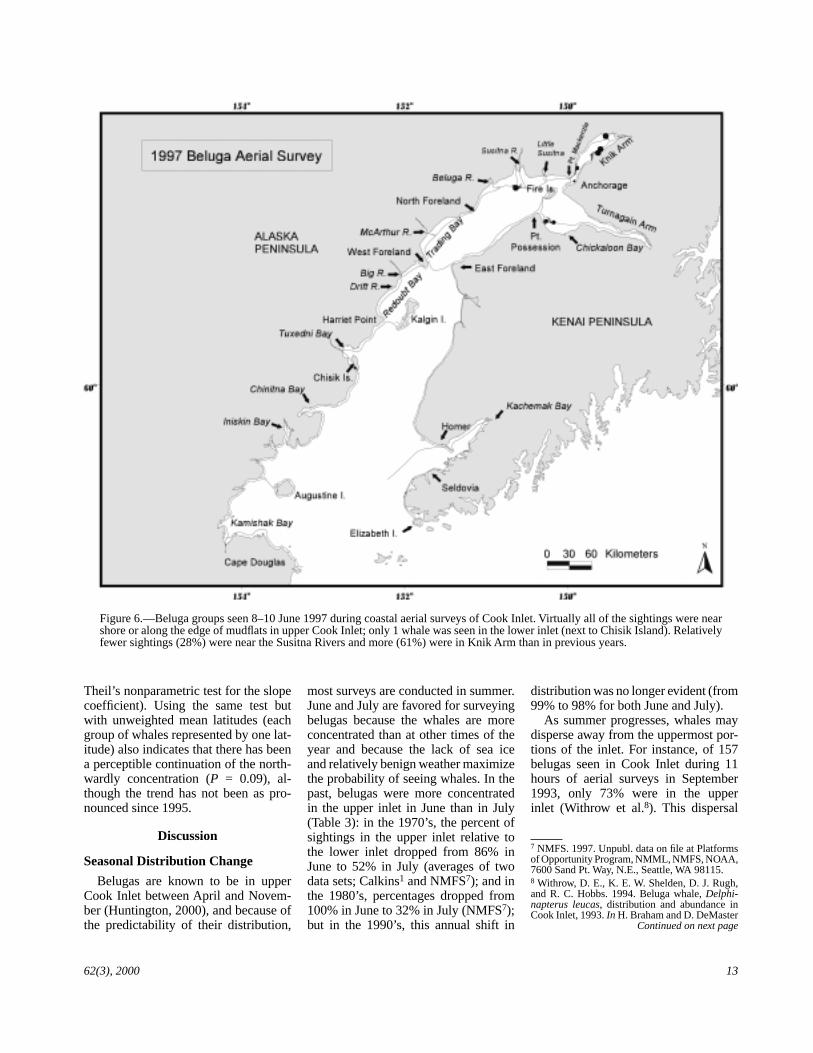
Figure 6.—Beluga groups seen 8–10 June 1997 during coastal aerial surveys of Cook Inlet. Virtually all of the sightings were near shore or along the edge of mudflats in upper Cook Inlet; only 1 whale was seen in the lower inlet (next to Chisik Island). Relatively fewer sightings (28%) were near the Susitna Rivers and more (61%) were in Knik Arm than in previous years.
Theil’s nonparametric test for the slope coefficient). Using the same test but with unweighted mean latitudes (each group of whales represented by one latitude) also indicates that there has been a perceptible continuation of the northwardly concentration (P = 0.09), although the trend has not been as pronounced since 1995.
Discussion
Seasonal Distribution Change
Belugas are known to be in upper Cook Inlet between April and November (Huntington, 2000), and because of the predictability of their distribution,
most surveys are conducted in summer. June and July are favored for surveying belugas because the whales are more concentrated than at other times of the year and because the lack of sea ice and relatively benign weather maximize the probability of seeing whales. In the past, belugas were more concentrated in the upper inlet in June than in July (Table 3): in the 1970’s, the percent of sightings in the upper inlet relative to the lower inlet dropped from 86% in June to 52% in July (averages of two data sets; Calkins1 and NMFS7); and in the 1980’s, percentages dropped from 100% in June to 32% in July (NMFS7); but in the 1990’s, this annual shift in
distribution was no longer evident (from 99% to 98% for both June and July).
As summer progresses, whales may disperse away from the uppermost portions of the inlet. For instance, of 157 belugas seen in Cook Inlet during 11 hours of aerial surveys in September 1993, only 73% were in the upper inlet (Withrow et al.8). This dispersal
7 NMFS. 1997. Unpubl. data on file at Platforms of Opportunity Program, NMML, NMFS, NOAA, 7600 Sand Pt. Way, N.E., Seattle, WA 98115. 8 Withrow, D. E., K. E. W. Shelden, D. J. Rugh, and R. C. Hobbs. 1994. Beluga whale, Delphinapterus leucas, distribution and abundance in Cook Inlet, 1993. In H. Braham and D. DeMaster
Continued on next page
62(3), 2000 13
14 Marine Fisheries Review
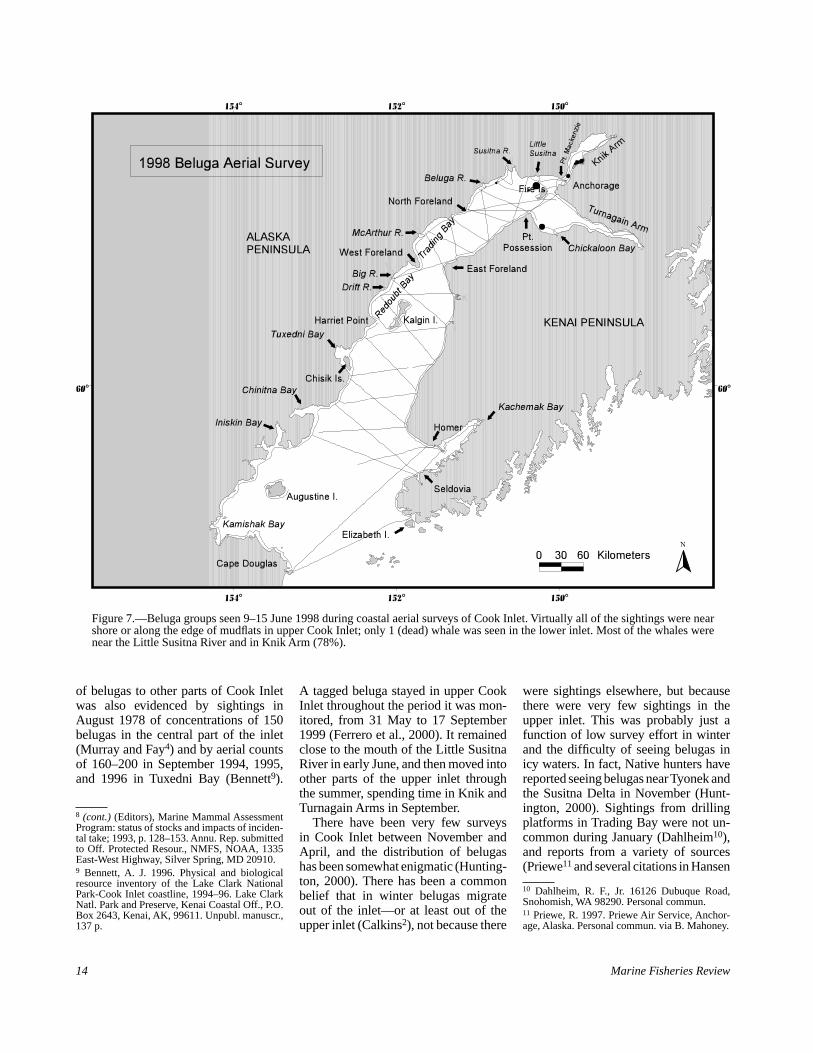
Figure 7.—Beluga groups seen 9–15 June 1998 during coastal aerial surveys of Cook Inlet. Virtually all of the sightings were near shore or along the edge of mudfl ats in upper Cook Inlet; only 1 (dead) whale was seen in the lower inlet. Most of the whales were near the Little Susitna River and in Knik Arm (78%).
8 (cont.) (Editors), Marine Mammal Assessment Program: status of stocks and impacts of inciden-tal take; 1993, p. 128–153. Annu. Rep. submitted to Off. Protected Resour., NMFS, NOAA, 1335 East-West Highway, Silver Spring, MD 20910.9 Bennett, A. J. 1996. Physical and biological resource inventory of the Lake Clark National Park-Cook Inlet coastline, 1994–96. Lake Clark Natl. Park and Preserve, Kenai Coastal Off., P.O. Box 2643, Kenai, AK, 99611. Unpubl. manuscr., 137 p.
of belugas to other parts of Cook Inlet was also evidenced by sightings in August 1978 of concentrations of 150 belugas in the central part of the inlet (Murray and Fay4) and by aerial counts of 160–200 in September 1994, 1995, and 1996 in Tuxedni Bay (Bennett9).
A tagged beluga stayed in upper Cook Inlet throughout the period it was mon-itored, from 31 May to 17 September 1999 (Ferrero et al., 2000). It remained close to the mouth of the Little Susitna River in early June, and then moved into other parts of the upper inlet through the summer, spending time in Knik and Turnagain Arms in September.
There have been very few surveys in Cook Inlet between November and April, and the distribution of belugas has been somewhat enigmatic (Hunting-ton, 2000). There has been a common belief that in winter belugas migrate out of the inlet—or at least out of the upper inlet (Calkins2), not because there
were sightings elsewhere, but because there were very few sightings in the upper inlet. This was probably just a function of low survey effort in winter and the diffi culty of seeing belugas in icy waters. In fact, Native hunters have reported seeing belugas near Tyonek and the Susitna Delta in November (Hunt -ington, 2000). Sightings from drilling platforms in Trading Bay were not un-common during January (Dahlheim10), and reports from a variety of sources (Priewe11 and several citations in Hansen
10 Dahlheim, R. F., Jr. 16126 Dubuque Road, Snohomish, WA 98290. Personal commun.11 Priewe, R. 1997. Priewe Air Service, Anchor-age, Alaska. Personal commun. via B. Mahoney.
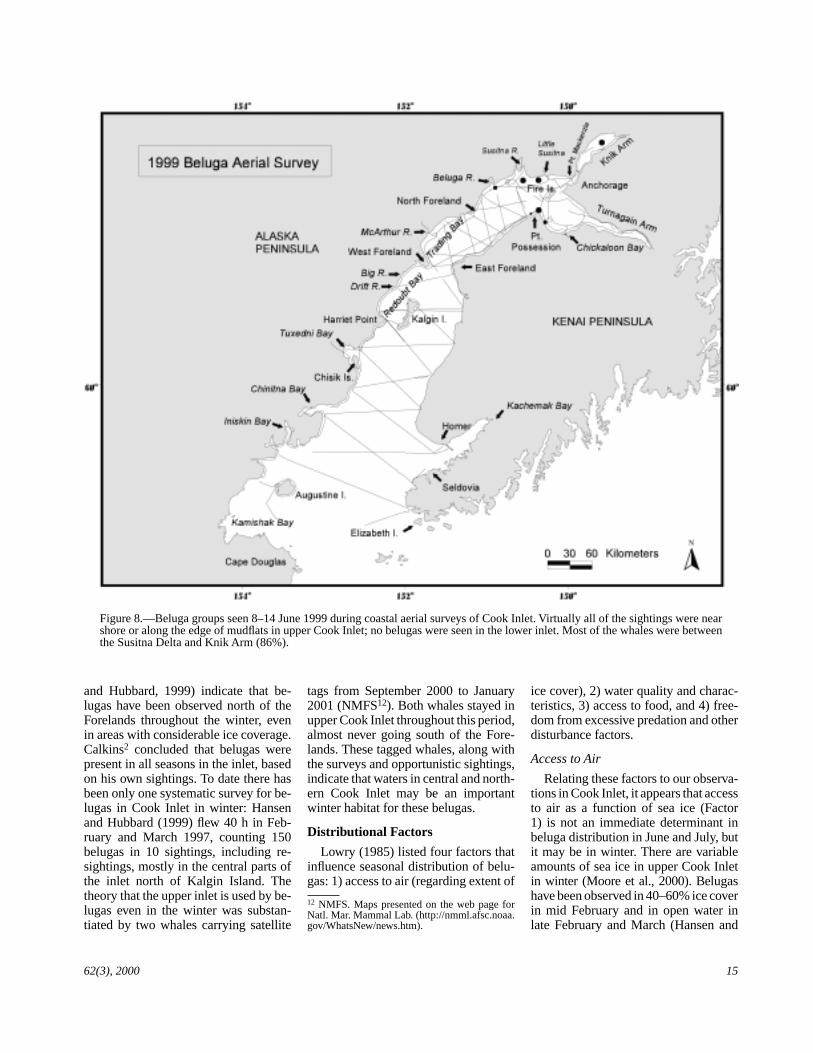
Figure 8.—Beluga groups seen 8–14 June 1999 during coastal aerial surveys of Cook Inlet. Virtually all of the sightings were near shore or along the edge of mudflats in upper Cook Inlet; no belugas were seen in the lower inlet. Most of the whales were between the Susitna Delta and Knik Arm (86%).
and Hubbard, 1999) indicate that belugas have been observed north of the Forelands throughout the winter, even in areas with considerable ice coverage. Calkins2 concluded that belugas were present in all seasons in the inlet, based on his own sightings. To date there has been only one systematic survey for belugas in Cook Inlet in winter: Hansen and Hubbard (1999) flew 40 h in February and March 1997, counting 150 belugas in 10 sightings, including resightings, mostly in the central parts of the inlet north of Kalgin Island. The theory that the upper inlet is used by belugas even in the winter was substantiated by two whales carrying satellite
tags from September 2000 to January 2001 (NMFS12). Both whales stayed in upper Cook Inlet throughout this period, almost never going south of the Fore-lands. These tagged whales, along with the surveys and opportunistic sightings, indicate that waters in central and north-ern Cook Inlet may be an important winter habitat for these belugas.
Distributional Factors
Lowry (1985) listed four factors that influence seasonal distribution of belugas: 1) access to air (regarding extent of
12 NMFS. Maps presented on the web page for Natl. Mar. Mammal Lab. (http://nmml.afsc.noaa. gov/WhatsNew/news.htm).
ice cover), 2) water quality and characteristics, 3) access to food, and 4) freedom from excessive predation and other disturbance factors.
Access to Air
Relating these factors to our observations in Cook Inlet, it appears that access to air as a function of sea ice (Factor 1) is not an immediate determinant in beluga distribution in June and July, but it may be in winter. There are variable amounts of sea ice in upper Cook Inlet in winter (Moore et al., 2000). Belugas have been observed in 40–60% ice cover in mid February and in open water in late February and March (Hansen and
62(3), 2000 15
16 Marine Fisheries Review
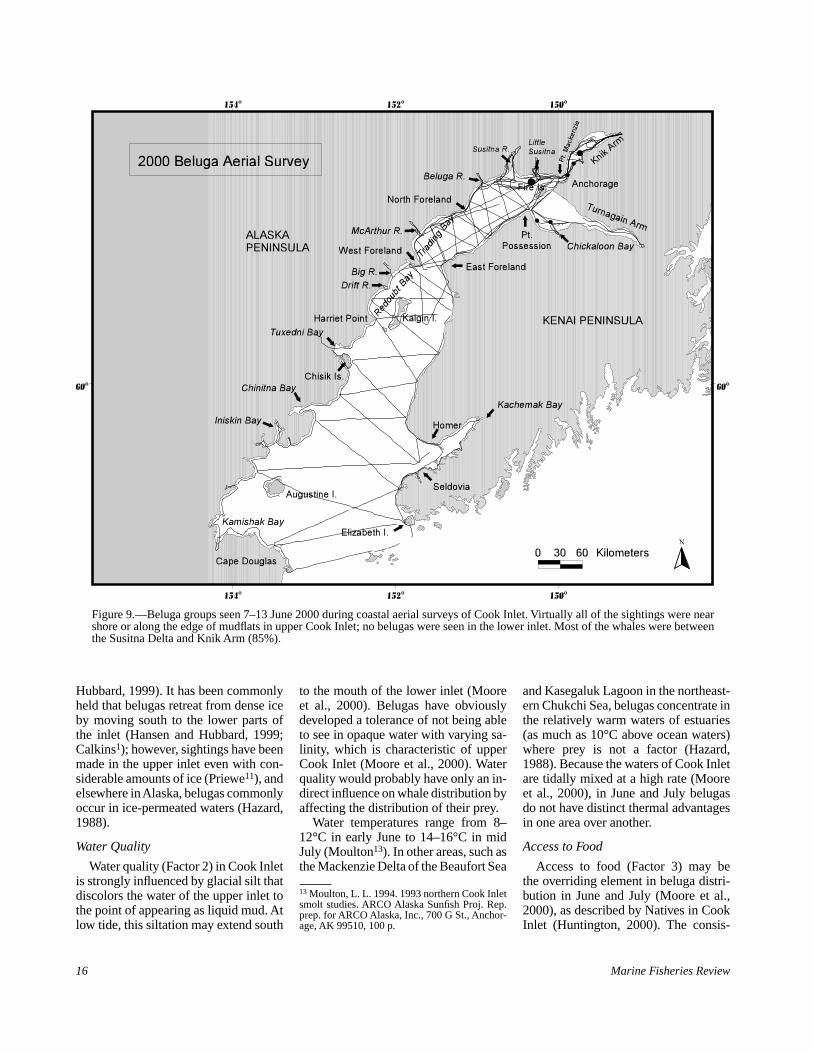
Figure 9.—Beluga groups seen 7–13 June 2000 during coastal aerial surveys of Cook Inlet. Virtually all of the sightings were near shore or along the edge of mudfl ats in upper Cook Inlet; no belugas were seen in the lower inlet. Most of the whales were between the Susitna Delta and Knik Arm (85%).
Hubbard, 1999). It has been commonly held that belugas retreat from dense ice by moving south to the lower parts of the inlet (Hansen and Hubbard, 1999; Calkins1); however, sightings have been made in the upper inlet even with con-siderable amounts of ice (Priewe11), and elsewhere in Alaska, belugas commonly occur in ice-permeated waters (Hazard, 1988).
Water Quality
Water quality (Factor 2) in Cook Inlet is strongly infl uenced by glacial silt that discolors the water of the upper inlet to the point of appearing as liquid mud. At low tide, this siltation may extend south
to the mouth of the lower inlet (Moore et al., 2000). Belugas have obviously developed a tolerance of not being able to see in opaque water with varying sa-linity, which is characteristic of upper Cook Inlet (Moore et al., 2000). Water quality would probably have only an in-direct infl uence on whale distribution by affecting the distribution of their prey.
Water temperatures range from 8–12°C in early June to 14–16°C in mid July (Moulton13). In other areas, such as the Mackenzie Delta of the Beaufort Sea
and Kasegaluk Lagoon in the northeast-ern Chukchi Sea, belugas concentrate in the relatively warm waters of estuaries (as much as 10°C above ocean waters) where prey is not a factor (Hazard, 1988). Because the waters of Cook Inlet are tidally mixed at a high rate (Moore et al., 2000), in June and July belugas do not have distinct thermal advantages in one area over another.
Access to Food
Access to food (Factor 3) may be the overriding element in beluga distri-bution in June and July (Moore et al., 2000), as described by Natives in Cook Inlet (Huntington, 2000). The consis-
13 Moulton, L. L. 1994. 1993 northern Cook Inlet smolt studies. ARCO Alaska Sunfi sh Proj. Rep. prep. for ARCO Alaska, Inc., 700 G St., Anchor-age, AK 99510, 100 p.
tency of whale concentrations at river mouths can best be explained as an efficient way for the whales to feed. These coastal concentrations apparently last from April until November (Huntington, 2000) and are very likely associated with the migration of anadromous fish, particularly eulachon, Thaleichthys pacificus, and Pacific salmon, Oncorhynchus spp. (Moulton, 1997; Huntington, 2000; Moore et al., 2000; Calkins1,14; Ben-nett9). However, it is unknown why belugas concentrate at only a few of the many rivers in Cook Inlet and why they are not found at other rivers where presumably fish runs are adequate for their needs.
Predation
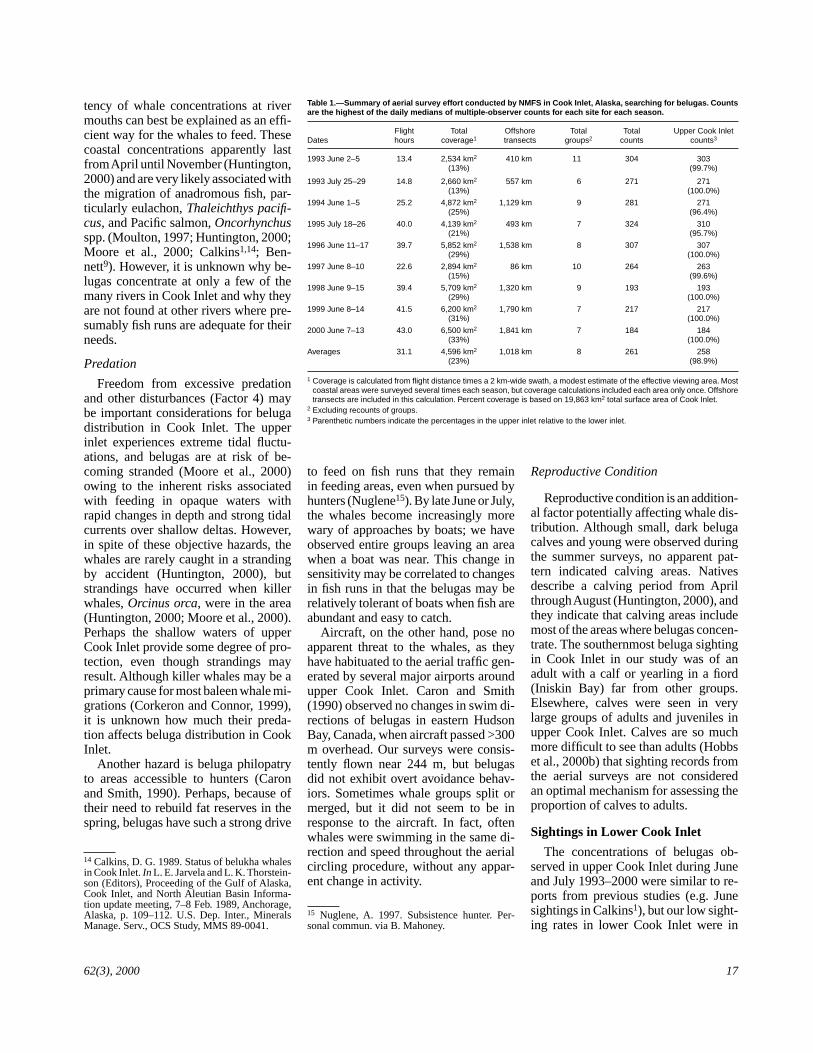
Table 1.—Summary of aerial survey effort conducted by NMFS in Cook Inlet, Alaska, searching for belugas. Counts are the highest of the daily medians of multiple-observer counts for each site for each season.
Flight Total Offshore Total Total Dates hours coverage1 transects groups2 counts counts3
Upper Cook Inlet
1993 June 2–5 13.4 2,534 km2 410 km 11 304 303 (13%) (99.7%)
1993 July 25–29 14.8 2,660 km2 557 km 6 271 271 (13%) (100.0%)
1994 June 1–5 25.2 4,872 km2 1,129 km 9 281 271 (25%) (96.4%)
1995 July 18–26 40.0 4,139 km2 493 km 7 324 310 (21%) (95.7%)
1996 June 11–17 39.7 5,852 km2 1,538 km 8 307 307 (29%) (100.0%)
1997 June 8–10 22.6 2,894 km2 86 km 10 264 263 (15%) (99.6%)
1998 June 9–15 39.4 5,709 km2 1,320 km 9 193 193 (29%) (100.0%)
1999 June 8–14 41.5 6,200 km2 1,790 km 7 217 217 (31%) (100.0%)
2000 June 7–13 43.0 6,500 km2 1,841 km 7 184 184 (33%) (100.0%)
Averages 31.1 4,596 km2 1,018 km 8 261 258 (23%) (98.9%)
Freedom from excessive predation and other disturbances (Factor 4) may be important considerations for beluga distribution in Cook Inlet. The upper inlet experiences extreme tidal fluctuations, and belugas are at risk of be-coming stranded (Moore et al., 2000) owing to the inherent risks associated with feeding in opaque waters with rapid changes in depth and strong tidal currents over shallow deltas. However, in spite of these objective hazards, the whales are rarely caught in a stranding by accident (Huntington, 2000), but strandings have occurred when killer whales, Orcinus orca, were in the area (Huntington, 2000; Moore et al., 2000). Perhaps the shallow waters of upper Cook Inlet provide some degree of protection, even though strandings may result. Although killer whales may be a primary cause for most baleen whale migrations (Corkeron and Connor, 1999), it is unknown how much their predation affects beluga distribution in Cook Inlet.
Another hazard is beluga philopatry to areas accessible to hunters (Caron and Smith, 1990). Perhaps, because of their need to rebuild fat reserves in the spring, belugas have such a strong drive
14 Calkins, D. G. 1989. Status of belukha whales in Cook Inlet. In L. E. Jarvela and L. K. Thorsteinson (Editors), Proceeding of the Gulf of Alaska, Cook Inlet, and North Aleutian Basin Information update meeting, 7–8 Feb. 1989, Anchorage, Alaska, p. 109–112. U.S. Dep. Inter., Minerals Manage. Serv., OCS Study, MMS 89-0041.
1 Coverage is calculated from flight distance times a 2 km-wide swath, a modest estimate of the effective viewing area. Most coastal areas were surveyed several times each season, but coverage calculations included each area only once. Offshore transects are included in this calculation. Percent coverage is based on 19,863 km2 total surface area of Cook Inlet.
2 Excluding recounts of groups. 3 Parenthetic numbers indicate the percentages in the upper inlet relative to the lower inlet.
to feed on fish runs that they remain in feeding areas, even when pursued by hunters (Nuglene15). By late June or July, the whales become increasingly more wary of approaches by boats; we have observed entire groups leaving an area when a boat was near. This change in sensitivity may be correlated to changes in fish runs in that the belugas may be relatively tolerant of boats when fish are abundant and easy to catch.
Aircraft, on the other hand, pose no apparent threat to the whales, as they have habituated to the aerial traffic generated by several major airports around upper Cook Inlet. Caron and Smith (1990) observed no changes in swim directions of belugas in eastern Hudson Bay, Canada, when aircraft passed >300 m overhead. Our surveys were consistently flown near 244 m, but belugas did not exhibit overt avoidance behaviors. Sometimes whale groups split or merged, but it did not seem to be in response to the aircraft. In fact, often whales were swimming in the same direction and speed throughout the aerial circling procedure, without any apparent change in activity.
15 Nuglene, A. 1997. Subsistence hunter. Personal commun. via B. Mahoney.
Reproductive Condition
Reproductive condition is an additional factor potentially affecting whale distribution. Although small, dark beluga calves and young were observed during the summer surveys, no apparent pat-tern indicated calving areas. Natives describe a calving period from April through August (Huntington, 2000), and they indicate that calving areas include most of the areas where belugas concentrate. The southernmost beluga sighting in Cook Inlet in our study was of an adult with a calf or yearling in a fiord (Iniskin Bay) far from other groups. Elsewhere, calves were seen in very large groups of adults and juveniles in upper Cook Inlet. Calves are so much more difficult to see than adults (Hobbs et al., 2000b) that sighting records from the aerial surveys are not considered an optimal mechanism for assessing the proportion of calves to adults.
Sightings in Lower Cook Inlet
The concentrations of belugas observed in upper Cook Inlet during June and July 1993–2000 were similar to re-ports from previous studies (e.g. June sightings in Calkins1), but our low sighting rates in lower Cook Inlet were in
62(3), 2000 17
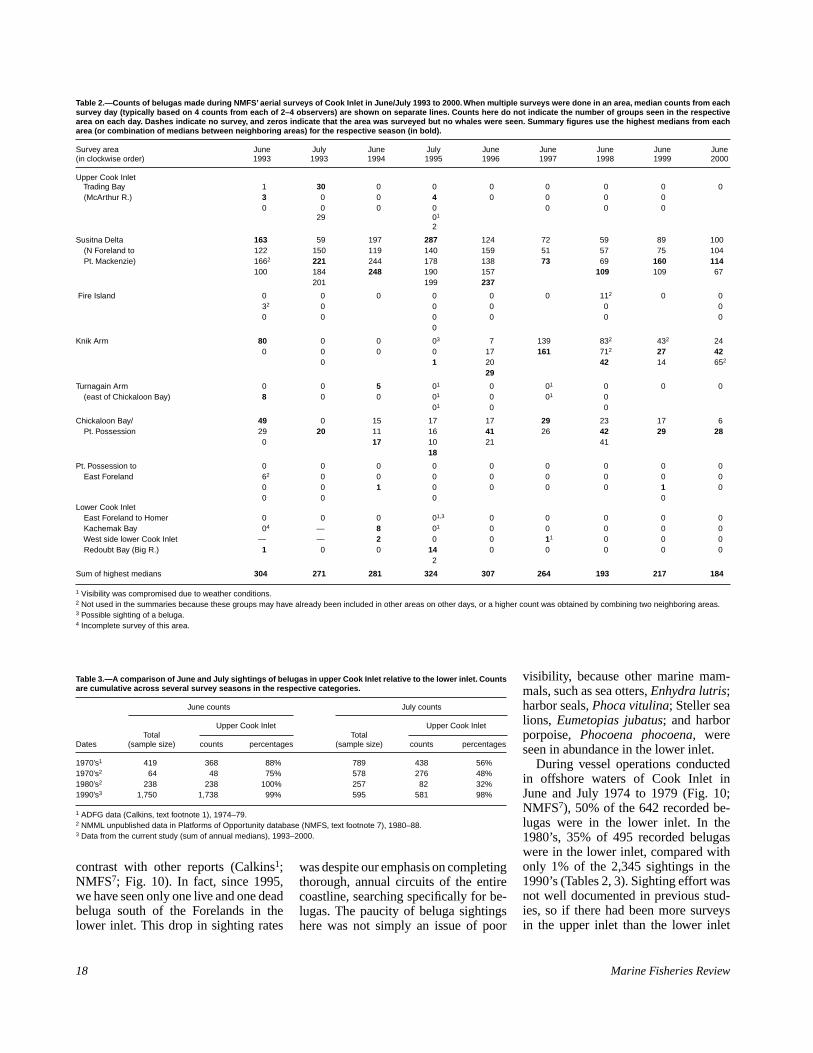
Table 2.—Counts of belugas made during NMFS’ aerial surveys of Cook Inlet in June/July 1993 to 2000. When multiple surveys were done in an area, median counts from each survey day (typically based on 4 counts from each of 2–4 observers) are shown on separate lines. Counts here do not indicate the number of groups seen in the respective area on each day. Dashes indicate no survey, and zeros indicate that the area was surveyed but no whales were seen. Summary figures use the highest medians from each area (or combination of medians between neighboring areas) for the respective season (in bold).
Survey area June July June July June June June June June (in clockwise order) 1993 1993 1994 1995 1996 1997 1998 1999 2000
Upper Cook Inlet Trading Bay (McArthur R.)
Susitna Delta (N Foreland to Pt. Mackenzie)
Fire Island
Knik Arm
Turnagain Arm (east of Chickaloon Bay)
Chickaloon Bay/ Pt. Possession
Pt. Possession to East Foreland
Lower Cook Inlet East Foreland to Homer Kachemak Bay West side lower Cook Inlet Redoubt Bay (Big R.)
Sum of highest medians
1 30 0 0 0 0 0 0 0 3 0 0 4 0 0 0 0 0 0 0 0 0 0 0
29 01
2
163 59 197 287 124 72 59 89 100 122 150 119 140 159 51 57 75 104 1662 221 244 178 138 73 69 160 114 100 184 248 190 157 109 109 67
201 199 237
0 0 0 0 0 0 112 0 0 32 0 0 0 0 0 0 0 0 0 0 0
0
80 0 0 03 7 139 832 432 24 0 0 0 0 17 161 712 27 42
0 1 20 42 14 652
29
0 0 5 01 0 01 0 0 0 8 0 0 01 0 01 0
01 0 0
49 0 15 17 17 29 23 17 6 29 20 11 16 41 26 42 29 28 0 17 10 21 41
18
0 0 0 0 0 0 0 0 0 62 0 0 0 0 0 0 0 0 0 0 1 0 0 0 0 1 0 0 0 0 0
0 0 0 01,3 0 0 0 0 0 04 — 8 01 0 0 0 0 0
— — 2 0 0 11 0 0 0 1 0 0 14 0 0 0 0 0
2
304 271 281 324 307 264 193 217 184
1 Visibility was compromised due to weather conditions.2 Not used in the summaries because these groups may have already been included in other areas on other days, or a higher count was obtained by combining two neighboring areas.3 Possible sighting of a beluga. 4 Incomplete survey of this area.
Table 3.—A comparison of June and July sightings of belugas in upper Cook Inlet relative to the lower inlet. Counts are cumulative across several survey seasons in the respective categories.
June counts July counts
Upper Cook Inlet Upper Cook Inlet Total Total
Dates (sample size) counts percentages (sample size) counts percentages
1970’s1 419 368 88% 789 438 56% 1970’s2 64 48 75% 578 276 48% 1980’s2 238 238 100% 257 82 32% 1990’s3 1,750 1,738 99% 595 581 98%
1 ADFG data (Calkins, text footnote 1), 1974–79.2 NMML unpublished data in Platforms of Opportunity database (NMFS, text footnote 7), 1980–88.3 Data from the current study (sum of annual medians), 1993–2000.
contrast with other reports (Calkins1; NMFS7; Fig. 10). In fact, since 1995, we have seen only one live and one dead beluga south of the Forelands in the lower inlet. This drop in sighting rates
was despite our emphasis on completing thorough, annual circuits of the entire coastline, searching specifically for belugas. The paucity of beluga sightings here was not simply an issue of poor
visibility, because other marine mammals, such as sea otters, Enhydra lutris; harbor seals, Phoca vitulina; Steller sea lions, Eumetopias jubatus; and harbor porpoise, Phocoena phocoena, were seen in abundance in the lower inlet.
During vessel operations conducted in offshore waters of Cook Inlet in June and July 1974 to 1979 (Fig. 10; NMFS7), 50% of the 642 recorded belugas were in the lower inlet. In the 1980’s, 35% of 495 recorded belugas were in the lower inlet, compared with only 1% of the 2,345 sightings in the 1990’s (Tables 2, 3). Sighting effort was not well documented in previous studies, so if there had been more surveys in the upper inlet than the lower inlet
18 Marine Fisheries Review
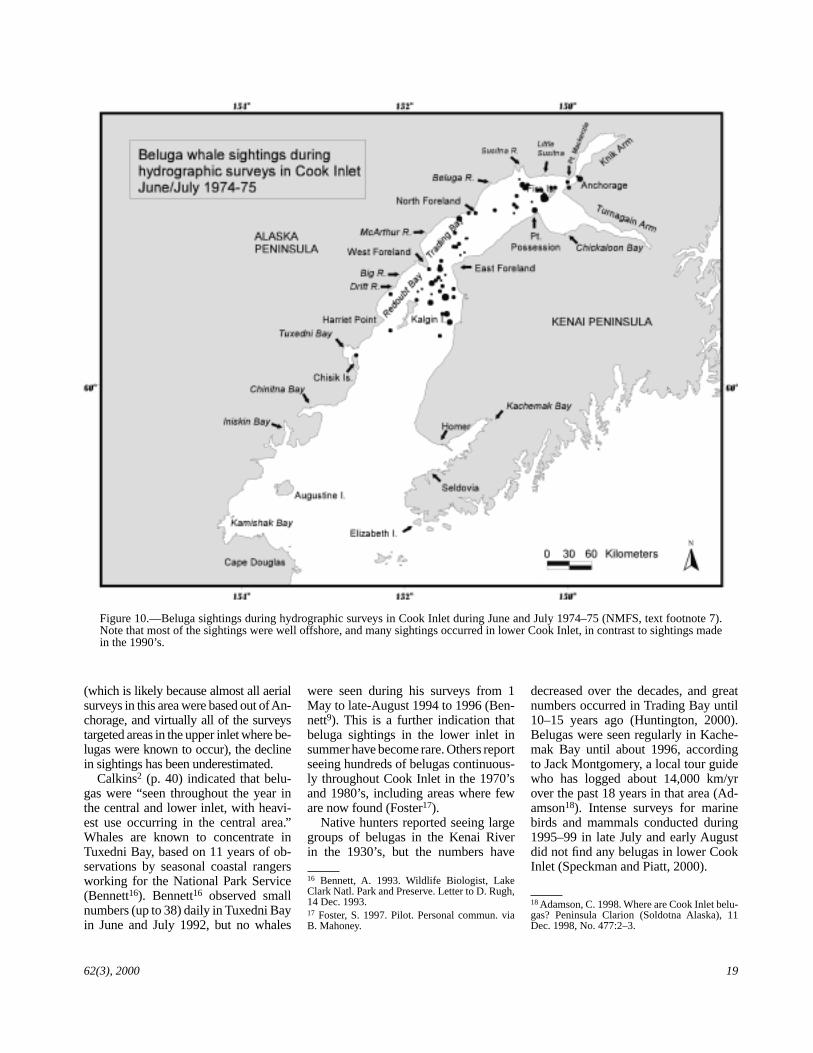
Figure 10.—Beluga sightings during hydrographic surveys in Cook Inlet during June and July 1974–75 (NMFS, text footnote 7). Note that most of the sightings were well offshore, and many sightings occurred in lower Cook Inlet, in contrast to sightings made in the 1990’s.
(which is likely because almost all aerial surveys in this area were based out of Anchorage, and virtually all of the surveys targeted areas in the upper inlet where belugas were known to occur), the decline in sightings has been underestimated.
Calkins2 (p. 40) indicated that belugas were “seen throughout the year in the central and lower inlet, with heaviest use occurring in the central area.” Whales are known to concentrate in Tuxedni Bay, based on 11 years of observations by seasonal coastal rangers working for the National Park Service (Bennett16). Bennett16 observed small numbers (up to 38) daily in Tuxedni Bay in June and July 1992, but no whales
were seen during his surveys from 1 May to late-August 1994 to 1996 (Ben-nett9). This is a further indication that beluga sightings in the lower inlet in summer have become rare. Others report seeing hundreds of belugas continuously throughout Cook Inlet in the 1970’s and 1980’s, including areas where few are now found (Foster17).
Native hunters reported seeing large groups of belugas in the Kenai River in the 1930’s, but the numbers have
16 Bennett, A. 1993. Wildlife Biologist, Lake Clark Natl. Park and Preserve. Letter to D. Rugh, 14 Dec. 1993. 17 Foster, S. 1997. Pilot. Personal commun. via B. Mahoney.
decreased over the decades, and great numbers occurred in Trading Bay until 10–15 years ago (Huntington, 2000). Belugas were seen regularly in Kachemak Bay until about 1996, according to Jack Montgomery, a local tour guide who has logged about 14,000 km/yr over the past 18 years in that area (Ad-amson18). Intense surveys for marine birds and mammals conducted during 1995–99 in late July and early August did not find any belugas in lower Cook Inlet (Speckman and Piatt, 2000).
18 Adamson, C. 1998. Where are Cook Inlet belugas? Peninsula Clarion (Soldotna Alaska), 11 Dec. 1998, No. 477:2–3.
62(3), 2000 19

Because there was poor or no documentation of effort in previous surveys of Cook Inlet, we used a simple, straightforward approach of comparing proportions of sightings north and south of the Forelands in the middle of the inlet. From casual observations, opportunistic records, and dedicated surveys, it was very apparent that many belugas were seen in the lower inlet in the past where currently almost none are found despite increased search intensity. The differences between reports from the 1970’s and 1980’s relative to the 1990’s, as well as our interannual data through the 1990’s, indicate that the distribution of belugas has declined significantly.
Sightings in Offshore Areas
Changes may have occurred in the offshore waters of the upper inlet as well. Some of Calkins’ 1 June sightings and most of his July sightings from 1974 to 1979 were well offshore. Also, NOAA data from June and July 1974–75 (Fig. 10) (NMFS7) show all but a few of the sightings were offshore. In part this is because the latter data were collected from vessel operations, but whales were also observed along the shore during these surveys (Segur19). In contrast, our surveys found almost no live belugas in the center of the inlet in spite of excellent viewing conditions and extensive offshore search efforts. Virtually all of our sightings were shoreward of the 10 fathom (18 m depth) line, whereas the preponderance of the reported sightings in the 1970’s (Calkins1; NMFS7) were beyond this depth.
Sightings Beyond Cook Inlet
There have been some sightings of belugas in the Gulf of Alaska outside of Cook Inlet (Laidre et al., 2000); however, considering the amount of effort expended by aerial surveys and extensive vessel operations in the Gulf of Alaska, it is remarkable how few beluga sightings have been recorded. The lack of
19 Segur, G. V. 1975. Marine Mammal Officer, NOAA Ship McArthur. Memo. to Chief, Fish. Br., PMC Operations Div., Seattle, Wash., 27 Aug. 1975.
sightings along the southern side of the Alaska Peninsula indicate that the Cook Inlet stock is not widely dispersed and is isolated from stocks in the Bering Sea. This hypothesis is sup-ported by mitochondrial DNA analyses which show distinct differences between belugas in Cook Inlet relative to other stocks around Alaska (O’Corry-Crowe et al., 1997). Native hunters have also remarked on how distinct the belugas in Cook Inlet are (Huntington, 2000).
Previous Beluga Counts
The number of whales counted during our aerial surveys (184–324) from 1993 to 2000 is roughly 60–80% of Klink-hart’s3 estimates of 300–400 in 1963 and 1964. Similar numbers (about 400) were seen in 1976–78 (Calkins2), with the highest count (479) made on 21 August 1979 (Calkins14). Murray and Fay4 counted only 150 on three consecutive days in the central inlet, but these counts did not include the upper inlet. Counts ranged up to 335 in the upper inlet in June and July 1982 and up to 176 in June and July 1983 (Calkins1). During a 40-h survey specifically searching for belugas throughout upper Cook Inlet in June 1991 (NMFS20), the highest one-day count was 242 whales. Counts of 200 in June 1991 and 255 in June 1992 were made during aerial surveys of upper Cook Inlet while survey teams were en route to or returning from other projects (NMFS21). However, prior to our surveys starting in 1993, most counts were not based on systematic surveys for belugas throughout the entire inlet (Calkins1). Current counts have resulted from more intensive and focused surveys than were previously conducted. Analysis of trends in recent abundance estimates (1994–2000) with corrections for missed whales are presented in Hobbs et al. (2000a). Declines evident in these abundance estimates are probably reflected in the declines in distribution reported here. There is no
20 NMFS. 1992. Status report on Cook Inlet belugas (Delphinapterus leucas). Rep. prep. by Alaska Reg., Natl. Mar. Fish. Serv., 222 W. 7th Ave., Anchorage, AK 99513-7577, 22 p. 21 NMFS. 1997. Unpubl. data on file at NMML, NMFS Alaska Fish. Sci. Cent., NOAA, 7600 Sand Point Way N.E., Seattle, WA 98115.
evidence that the belugas of Cook Inlet have dispersed to other areas (Laidre et al., 2000) in response to the persistent harvest by Native hunters (Mahoney and Shelden, 2000), so it is evident that this stock was in decline during this period.
Acknowledgments
Funding for this project was provided to the NMFS National Marine Mammal Laboratory by the NMFS Marine Mammal Assessment Program, as well as through funds and logistical sup-port from the NMFS Alaska Regional Office. Tom Blaesing of Commander NW, Ltd., our pilot each year from 1993 through 1996, more than met the requirements of flying these surveys; his ideas, aircraft modifications, and personal investment went a long way toward making this project successful. Pilots from NOAA’s Aircraft Operations Center were Jeff Hagan and John Longenecker in June 1997. Dave Weintraub, of Commander NW, Ltd., was our pilot from 1998 to 2000. Primary observers for this project, all NMFS employees or contractors, have been Robyn Angliss (1994–95), Douglas De-Master (1994–95), Rod Hobbs (parts of 1993 and 1996–99), Laura Litzky (1998–2000), Barbara Mahoney (1993– 96, 1998–2000), David Rugh (1993– 2000), Kim Shelden (1993, 1995–2000), Janice Waite (1996–97), and David Withrow (project leader in 1993). Other NOAA observers were Jeanne Hanson (1993), John Lewis (1993), Brad Smith (1993 and 1999), and Steve Thumm (1993). Representatives of the Cook Inlet Marine Mammal Council (CIMMC) joined the aerial team on one or more survey days in 1995 (Kuvlela Andrews, Josephine Dizon, Delice Calcote, and Ruth Cassidy), 1996 (Marc Lamoreux), 1997 (Joel Blatchford), 1998 (Earl Paniptchuk, Gilbert Paniptchuk, Clyde Eben, and Frank Anawrak), 1999 (Dan Alex [CIMMC], Percy Blatchford [Alaska Native Marine Mammal Hunters Committee, ANMMHC], Peter Merryman [Native Village of Tyonek], and Joel Blatchford [ANMMHC]), and 2000 (Leslie Green, Perry Dimmick, Daniel Alex, Floyd Kakaruk, and Gilbert Paniptchuk [CIMMC]). TheAlaska Beluga
20 Marine Fisheries Review
Whale Commission and NMFS Alaska Regional Office (AKR) provided partial support for some of the CIMMC observers. Kristin Laidre (NMML) provided data and sighting maps from NOAA’s Platforms of Opportunity Pro-gram and produced all of the maps used in this publication. Flights were conducted under Scientific Research Permits No. 791 (P771#63) and No. 782-1360. Document reviews were provided by Rod Hobbs (NMML), Brad Smith (AKR), Marcia Muto (NMML), David Withrow (NMML), Gary Duker (AFSC Publications Unit), and three anonymous reviewers.
Literature Cited Caron, L. M. J., and T. G. Smith. 1990. Philopatry
and site tenacity of belugas, Delphinapterus leucas, hunted by the Inuit at the Nastapoka estuary, eastern Hudson Bay. In T. G. Smith, D. J. St. Aubin, and J. R. Geraci (Editors), Advances in research on the beluga whale, Delphinapterus leucas, p. 69–79. Can. Bull. Fish. Aquat. Sci. 224.
Corkeron, P. J., and R. C. Connor. 1999. Why do baleen whales migrate? Mar. Mammal Sci. 15(4):1228–1245.
Ferrero, R. C., S. E. Moore, and R. C. Hobbs. 2000. Development of beluga, Delphinapterus
leucas, capture and satellite tagging protocol in Cook Inlet, Alaska. Mar. Fish. Rev. 62(3):112–123.
Gurevich, V. S. 1980. Worldwide distribution and migration patterns of the white whale (beluga), Delphinapterus leucas. Rep. Int. Whal. Comm. 30:465–480.
Hansen, D. J., and J. D. Hubbard. 1999. Distribution of Cook Inlet beluga whales (Delphinapterus leucas) in winter. U.S. Dep. Inter., Minerals Manage. Serv., Alaska OCS Region, Anchorage, Final Rep., OCS Study MMS 99-0024, var. pagin.
Hazard, K. 1988. Beluga whale, Delphinapterus leucas. In J. W. Lentfer (Editor), Selected marine mammals of Alaska: species accounts with research and management recommendations, p. 195–235. Mar. Mammal Comm., Wash., D.C., 275 p.
Hill, P. S. 1996. The Cook Inlet stock of beluga whales: a case for co-management. Univ. Wash., Seattle, M.S. thesis, 107 p.
Hobbs, R. C., D. J. Rugh, and D. P. DeMaster. 2000a. Abundance of belugas, Delphinapterus leucas, in Cook Inlet, Alaska, 1994–2000. Mar. Fish. Rev. 62(3):37–45.
________ , J. M. Waite, and D. J. Rugh. 2000b. Beluga, Delphinapterus leucas, group sizes in Cook Inlet, Alaska, based on observer counts and aerial video. Mar. Fish. Rev. 62(3):46–59.
Huntington, H. P. 2000. Traditional knowledge of the ecology of belugas, Delphinapterus leucas, in Cook Inlet, Alaska. Mar. Fish. Rev. 62(3):134–140.
Kingsley, M. C. S. 1998. Population index estimates for the St. Lawrence belugas, 1973–1995. Mar. Mammal Sci. 14(3):508–530.
Laidre, K. L., K. E. W. Shelden, D. J. Rugh, and B. A. Mahoney. 2000. Beluga, Delphinapterus leucas, distribution and survey effort in the Gulf of Alaska. Mar. Fish. Rev. 62(3):27–36.
Lerczak, J. A., K. E. W. Shelden, and R. C. Hobbs. 2000. Application of suction-cup-attached VHF transmitters to the study of beluga, Delphinapterus leucas, surfacing behavior in Cook Inlet, Alaska. Mar. Fish. Rev. 62(3):99–111.
Lowry, L. F. 1985. The belukha whale (Delphinapterus leucas). In J. J. Burns, K. J. Frost, and L. F. Lowry (Editors), Marine mammal species accounts, p. 3–13. Alaska Dep. Fish Game, Game Tech. Bull. 7.
Mahoney, B. A., and K. E. W. Shelden. 2000. Harvest history of belugas, Delphinapterus leucas, in Cook Inlet, Alaska. Mar. Fish. Rev. 62(3):124–133.
Moore, S. E., K. E. W. Shelden, L. K. Litzky, B. A. Mahoney, and D. J. Rugh. 2000. Beluga, Delphinapterus leucas, habitat associations in Cook Inlet, Alaska. Mar. Fish. Rev. 62(3): 60–80.
Moulton, L. L. 1997. Early marine residence, growth, and feeding by juvenile salmon in northern Cook Inlet, Alaska. Alaska Fish. Res. Bull. 4(2):154–177.
O’Corry-Crowe, G. M., R. S. Suydam, A. Rosenberg, K. J. Frost, and A. E. Dizon. 1997. Phylogeography, population structure and dispersal patterns of the beluga whale Delphinapterus leucas in the western Nearctic revealed by mitochondrial DNA. Mol. Ecol. 6:955–970.
Speckman, S. G., and J. F. Piatt. 2000. Historic and current use of lower Cook Inlet, Alaska by belugas, Delphinapterus leucas. Mar. Fish. Rev. 62(3):22–26.
62(3), 2000 21