
Distribution in a model-driven age · model portfolio use As centralized research groups...
12
Distribution in a model-driven age New survey reveals why financial advisors use model portfolios — and the implications for asset managers.
Transcript of Distribution in a model-driven age · model portfolio use As centralized research groups...

Distribution in a model-driven age New survey reveals why financial advisors use model portfolios — and the implications for asset managers.

EXECUTIVE SUMMARY
Model portfolios continue to shape the distribution landscape.
2 | BROADRIDGE
Broadridge conducted a survey of 500 financial advisors with at least $10M AUM, revealing:
THE RESEARCH
This survey is one component of a more comprehensive study that also includes proprietary model distribution data and interviews with distribution heads. The full report will be available this summer.
Why advisors choose model portfolios
How models impact relationships between asset managers and advisors
Whether and to what extent model portfolio use will grow
How client AUM affects model portfolio use
As centralized research groups increasingly select funds for model portfolios, asset managers are shifting focus to a smaller audience of professional buyers at the home office. But asset managers can’t lose sight of financial advisors.
One of the strongest forces currently reshaping the financial product distribution landscape is the increased usage of model portfolios. Understanding the forces that drive model adoption has profound implications for distribution strategies and resulting profitability.
This study provides insight into how and why financial advisors (FAs) use model portfolios. We found that asset manager resources are broadly relied upon to shape portfolios that are constructed and managed in-house. Moving forward, asset managers looking to capture model-driven fund and ETF assets will need to strengthen FA messaging, education and ongoing support.
Discover how asset managers can capitalize on this unfolding opportunity.

Model portfolios are not merely a trend—they’ve become industry standard. Here’s why:
Home offices can exert greater control over investment processes, helping to boost portfolio performance and improve asset retention.
Investors can access superior investment management at a comparatively lower cost.
Advisors can offload day-to-day asset management responsibility to focus on strengthening relationships and growing their business.
By the numbers:
BROADRIDGE | 3BROADRIDGE | 3
MODELS ARE FUELING OVERALL ETF GROWTH.
CAGR RETAIL 2016–2018
21%CAGR MODELS
2016–2018
37%
AUM IN MODELS$1T DIFFERENT MODELS IN THE MARKET10K+
ETFs:
OF RETAIL CHANNEL ASSETS 30% OF MODEL ASSETS 42%
(vs mutual funds 2018)
Broadridge’s unique vantage at the center of the financial services industry enables unmatched insight into mutual fund and ETF flows. Combined with our machine-learning algorithms, we provide visibility into $1T in model portfolio activity with segmentation down to the office level.

4 | BROADRIDGE
Most FAs employ a combination of custom and model portfolios.
Note: Venn diagram is a visual approximation, not mathematically derived.
More than half of advised assets are in model portfolios.
In-house custom
In-house using model
Outsource to home office (model)
Outsource to TAMP (model)
DISTRIBUTION OF INDUSTRY ASSETS
54% In models
10%16%
46% 28%
FAs can build each client portfolio
from scratch or take a more
standardized approach. Some
use new technologies to run their
own models, while others rely
on broker-dealer programs
(e.g. rep-as-portfolio manager)
or outsource to a third party.
62% of advisors outsource model portfolios to the home office or turnkey asset managementprograms (TAMPs).
15% rely exclusively on model portfolios.
15% rely exclusively on custom portfolios.
70% rely on some
combination of model and custom
portfolios.

Allocation to model portfolios
today
56%62%Expected 2 years from now
+6%Allocation to
model portfolios today
52% 55%Expected 2 years from now
+3%
“allows more time to spend on client-facing activities”
“allows more time for financial planning”
BROADRIDGE | 5
Advisors say model portfolios enable more efficient business growth.
“clients care more about planning, service and support than outperforming
the market”
78%
83%
91%
Top 5 reasons advisors cite for using models.
It’s not easy for advisors to balance business development with portfolio management. Rather than analyzing every position, a growing number of advisors rely on models to manage assets, so they can focus on client building and retention strategies.
In the next two years the use of models is expected to rise faster among advisors with lower AUM.
AUM $10M–<$100M AUM $100M+
Ability to leverage investment management expertise
2Business scalability
1Focus efforts on client acquisition/ retention
3Better address compliance/regulations
4More stringent manager due diligence
5

Models are the preferred approach for clients with lower AUM.
Asset managers should consider
creating more sophisticated models
that may attract higher-end investors.
PERCENTAGE WHO VIEW MODEL PORTFOLIOS AS PREFERRED APPROACH FOR MOST CLIENTS — BY CLIENT ASSET SIZE
Under $500K 73%
$500K-$999K 46%
Base: Use model portfolios
$1M+ 31%
Advisors who employ model portfolios are overwhelmingly satisfied with this approach.
PERCENTAGE AGREE WITH THE STATEMENT
“ I am happy with my decision to use models.”93%
“ Models have allowed me to devote more time to client-facing challenges.”
91%
Why do some advisors prefer custom portfolios as their business model?
“managing money is part of my value-add with clients”
59%
51%
“clients are paying for customized solutions”
6 | BROADRIDGE
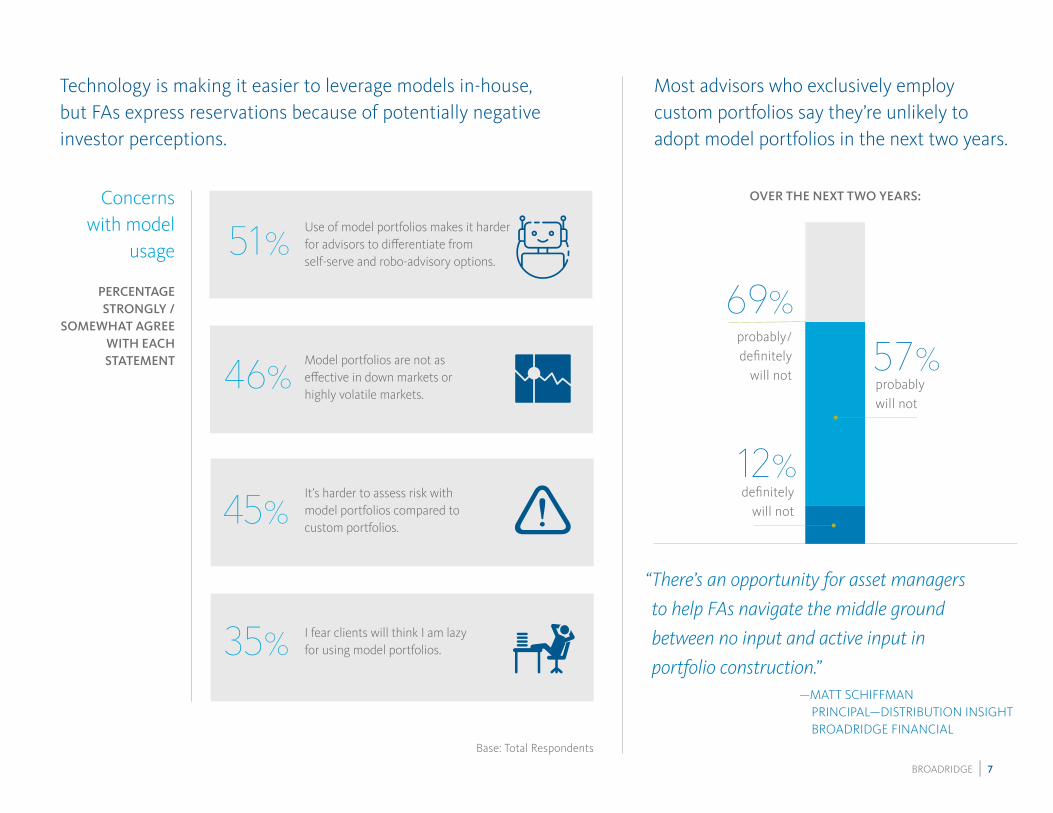
69% probably/ definitely
will not
Technology is making it easier to leverage models in-house, but FAs express reservations because of potentially negative investor perceptions.
BROADRIDGE | 7BROADRIDGE | 7
Model portfolios are not as effective in down markets or highly volatile markets.
46%
Use of model portfolios makes it harder for advisors to differentiate from self-serve and robo-advisory options.
51%
I fear clients will think I am lazy for using model portfolios.35%
It’s harder to assess risk with model portfolios compared to custom portfolios.
45%
Base: Total Respondents
Most advisors who exclusively employ custom portfolios say they’re unlikely to adopt model portfolios in the next two years.
“ There’s an opportunity for asset managers
to help FAs navigate the middle ground
between no input and active input in
portfolio construction.” —MATT SCHIFFMAN PRINCIPAL—DISTRIBUTION INSIGHT BROADRIDGE FINANCIAL
OVER THE NEXT TWO YEARS:Concerns with model
usage
PERCENTAGE STRONGLY /
SOMEWHAT AGREE WITH EACH STATEMENT 57%
probably will not
definitely will not
12%

8 | BROADRIDGE
Advisors say asset managers are their #1 resource when building model portfolios in-house.
RELIANCE ON ASSET MANAGERS FOR INVESTMENT MANAGEMENT SUPPORT (PAST THREE YEARS)
Asset Manager Resources
Morningstar
In-house, proprietary tools
BlackRock Aladdin
Riskalyze
Zephyr
Internal CIO
Dorsey Wright
Zacks
Envestnet
Other
74%
65%
55%
26%
15%
15%
13%
13%
6%
6%
11%
“ Capitalizing on this growing opportunity will require asset managers to rethink
their coverage model by executing better prospect segmentation and increasing
portfolio specialist support.”
— ANDREW GUILLETTE
SENIOR DIRECTOR —DISTRIBUTION INSIGHT BROADRIDGE FINANCIAL
In the past three years, reliance on asset manager support has grown faster among advisors who employ model portfolios.
31%Increase
FAs not using models
FAs using
models
50% Increase
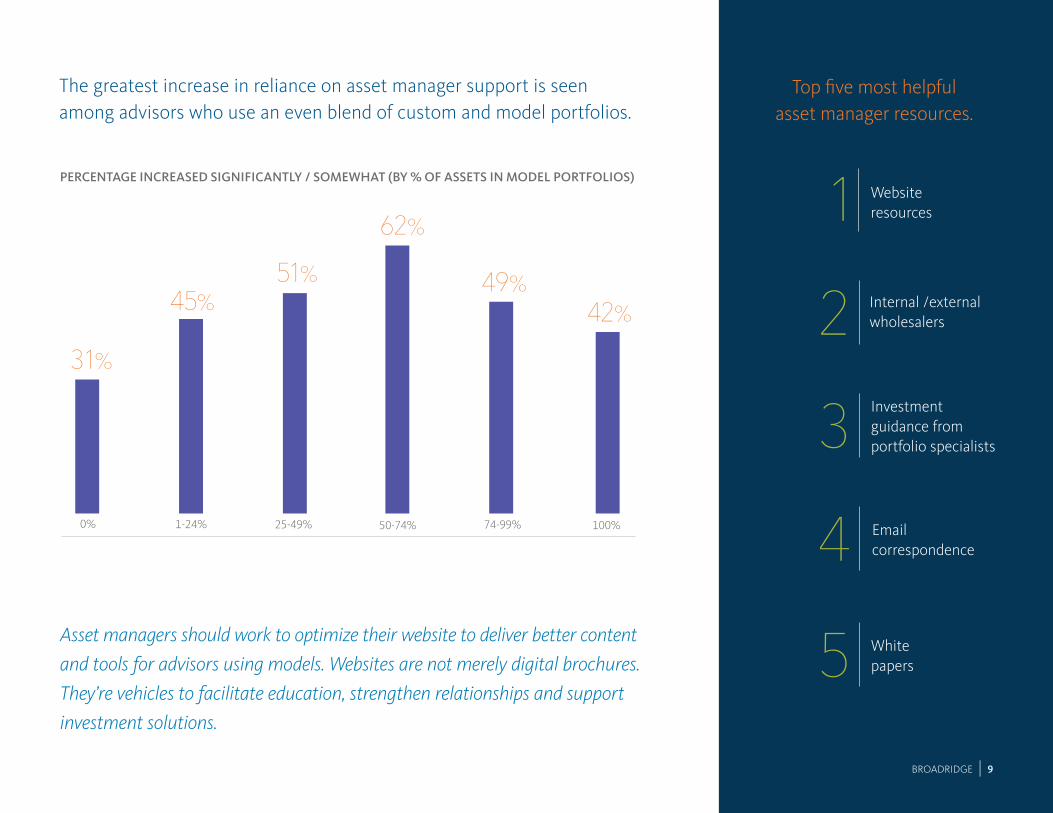
Asset managers should work to optimize their website to deliver better content
and tools for advisors using models. Websites are not merely digital brochures.
They’re vehicles to facilitate education, strengthen relationships and support
investment solutions.
BROADRIDGE | 9
Top five most helpful asset manager resources.
The greatest increase in reliance on asset manager support is seen among advisors who use an even blend of custom and model portfolios.
PERCENTAGE INCREASED SIGNIFICANTLY / SOMEWHAT (BY % OF ASSETS IN MODEL PORTFOLIOS)
31%
0%
42%
100%
49%
74-99%
62%
50-74%
51%
25-49%
45%
1-24%
Website resources1Internal /external wholesalers 2Investment guidance from portfolio specialists3Email correspondence 4White papers 5

Distribution Insight Navigate complex markets with confidence.
Broadridge Distribution Insight delivers the analytics and strategic expertise asset managers need to stay in front of fast-moving trends and make more informed, confident decisions. Track asset flows, measure market share, identify opportunities and benchmark sales performance across U.S. and global markets. Partnering side-by-side, we’ll help create a distribution strategy to execute on every opportunity.
Want more? Look for our full report this summer or contact [email protected].
10 | BROADRIDGE
THE COMPLETE PICTURE, DELIVERED.
$60T assets tracked globally
$13T U.S. fund and ETF assets by distributor and office
80K funds tracked globally
$1T model portfolio activity,
segmented to office level

BROADRIDGE | 11BROADRIDGE | 11
STUDY METHODOLOGY 500 financial advisors who met the following criteria:
• Work in Wire, Regional, IBD or RIA channel • $10M+ AUM • 25% of AUM is in mutual funds and/or ETFs • 50% of assets with individual retail investors • 25% of AUM in fee-based advisory
PROFILE RESPONDENTS Channel AUM (Millions)Wirehouse: 44% $10–$50: 18% IBD: 31% $50–$100: 22% RIA: 16% $100–$200: 24% Regional: 9% $200+: 36%
Average % fee-based: 74%Average % of AUM in MFs and ETFs: 73% Practice structure: Solo 37% • Group 63%Average age: 47 yearsAverage industry tenure: 18 years
Credentials CFP: 36%CFA: 5%CIMA: 4%
FIELD PERIOD MARCH 21 THROUGH APRIL 5, 2019

broadridge.com
© 2019 Broadridge Financial Solutions, Inc., Broadridge and the Broadridgelogo are registered trademarks of Broadridge Financial Solutions, Inc.
CommunicationsTechnologyData and Analytics
Broadridge, a global Fintech leader with over $4 billion in revenues and part of the S&P 500® Index, provides communications, technology, data and analytics. We help drive business transformation for our clients with solutions for enriching client engagement, navigating risk, optimizing efficiency and generating revenue growth.


![Class 8 The Capital Asset Pricing Model. Efficient Portfolios with Multiple Assets E[r] 0 Asset 1 Asset 2 Portfolios of Asset 1 and Asset 2 Portfolios.](https://static.fdocuments.us/doc/165x107/56649e505503460f94b4758c/class-8-the-capital-asset-pricing-model-efficient-portfolios-with-multiple.jpg)


