Distribution Future Energy Scenarios€¦ · Energy to develop a set of Distribution Future Energy...
72
Distribution Future Energy Scenarios Network-Level Outlook February 2020
Transcript of Distribution Future Energy Scenarios€¦ · Energy to develop a set of Distribution Future Energy...
Distribution Future Energy Scenarios
Network-Level Outlook February 2020

UK Power Networks Distribution Future Energy Scenarios
3
Executive Summary
The United Kingdom’s energy system is currently undergoing a revolution as it becomes increasingly decarbonised, decentralised and digitised. It is the role of the UK’s energy network operators to facilitate this transition to a smart green energy system whilst delivering value for their customers. As the electricity Distribution Network Operator (DNO) for the East of England, much of London and the Southeast of England, UK Power Networks is committed to delivering on these goals. A key part of this transition is the continued evolution of UK Power Networks to also acting as a Distribution System Operator (DSO), with an increasing role in managing a more flexible distribution network containing ever increasing amounts of distributed energy resources (DER). In order to cost-effectively deliver such a smart and green electricity distribution network it is essential that UK Power Networks plan for the changes that are going to occur in terms of both demand and generation across their network. Planning for this transition, however, is complicated by the fact that there remains considerable uncertainty regarding the nature and rate of the transition to a low carbon economy.
In order to model the uncertainties in the pathway to a low carbon economy, UK Power Networks engaged Element Energy to develop a set of Distribution Future Energy Scenarios (DFES) describing the evolution of demand and generation across UK Power Networks’ licence areas out to 2050. The scenarios produced seek to encompass the range of potential outcomes for a broad range of the key drivers of demand and generation on the networks over the period. UK Power Networks believe it is important to develop these regionally bespoke scenarios, as they better reflect the characteristics of their licence areas and the customers they serve. Furthermore, in this work we were able to produce scenarios resolved down to a highly granular level that provide the level of detail required to understand how these different futures might impact demand on UK Power Networks’ network. Throughout this document we detail how the scenarios were developed and then make comparison of the results to the National Grid Future Energy Scenarios so that stakeholders can understand how and why they may differ.
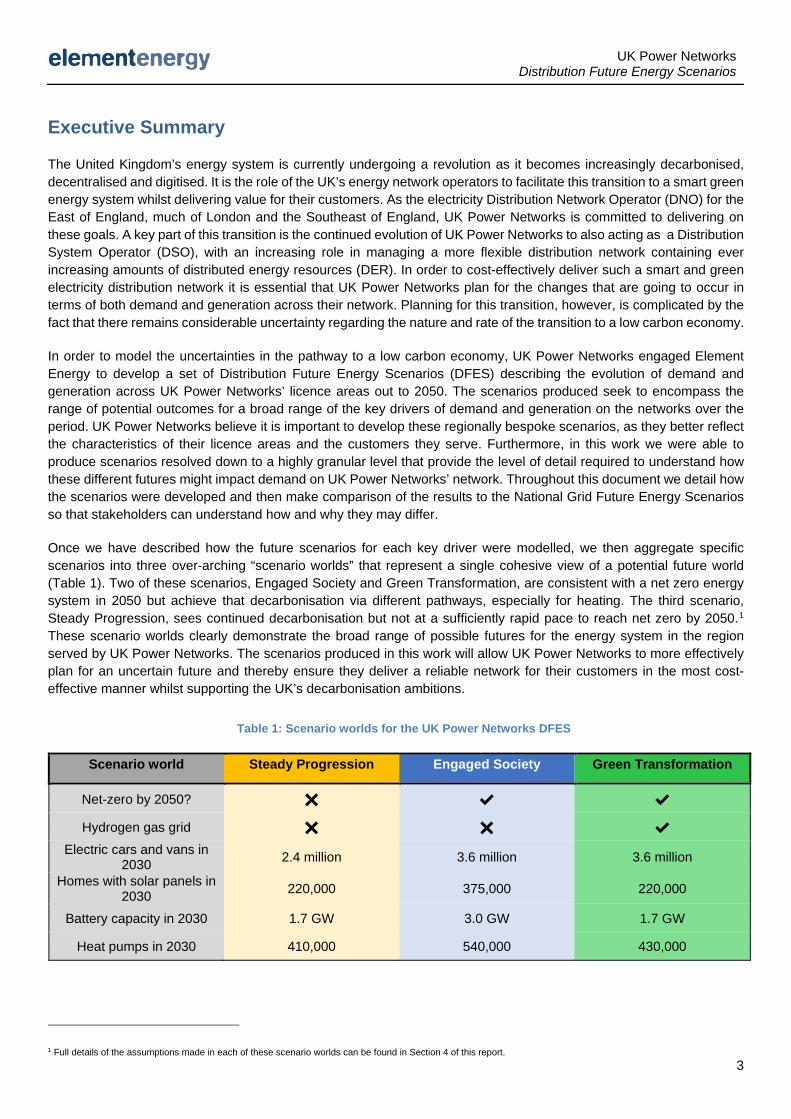
Once we have described how the future scenarios for each key driver were modelled, we then aggregate specific scenarios into three over-arching “scenario worlds” that represent a single cohesive view of a potential future world (Table 1). Two of these scenarios, Engaged Society and Green Transformation, are consistent with a net zero energy system in 2050 but achieve that decarbonisation via different pathways, especially for heating. The third scenario, Steady Progression, sees continued decarbonisation but not at a sufficiently rapid pace to reach net zero by 2050.1 These scenario worlds clearly demonstrate the broad range of possible futures for the energy system in the region served by UK Power Networks. The scenarios produced in this work will allow UK Power Networks to more effectively plan for an uncertain future and thereby ensure they deliver a reliable network for their customers in the most cost-effective manner whilst supporting the UK’s decarbonisation ambitions.
1 Full details of the assumptions made in each of these scenario worlds can be found in Section 4 of this report.
Scenario world Steady Progression Engaged Society Green Transformation
Net-zero by 2050? ✖ ✔ ✔
Hydrogen gas grid ✖ ✖ ✔ Electric cars and vans in
2030 2.4 million 3.6 million 3.6 million
Homes with solar panels in 2030 220,000 375,000 220,000
Battery capacity in 2030 1.7 GW 3.0 GW 1.7 GW
Heat pumps in 2030 410,000 540,000 430,000
Table 1: Scenario worlds for the UK Power Networks DFES
UK Power Networks Distribution Future Energy Scenarios
4
Contents
Executive Summary ...................................................................................................................................... 3
1 Introduction ............................................................................................................................................ 7
1.1 What the DFES are and why they are necessary ....................................................................... 7 1.2 Why UK Power Networks is developing its own DFES ............................................................... 7 1.3 Consistency with National Grid’s Future Energy Scenarios ....................................................... 7 1.4 Project scope ............................................................................................................................... 7 1.5 UK Power Networks’ licence areas and DFES datasets ............................................................ 8 1.6 Structure of the report ............................................................................................................... 10
2 Stakeholder engagement – validation of assumptions ........................................................................ 11
3 Scenario development ......................................................................................................................... 12
3.1 Core demand ............................................................................................................................. 12 3.2 Electric vehicles......................................................................................................................... 21 3.3 Decarbonised heating ............................................................................................................... 32 3.4 Distributed generation ............................................................................................................... 43 3.5 Battery storage .......................................................................................................................... 49 3.6 Flexibility .................................................................................................................................... 52
4 Scenarios Worlds ................................................................................................................................ 56
4.1 Scenario World Overview .......................................................................................................... 56
5 Conclusions and future work ............................................................................................................... 61
Appendix ..................................................................................................................................................... 62
Summary of roundtable sessions .............................................................................................. 62 EV uptake modelling assumptions ............................................................................................ 63 Uptake scenarios for other transport segments ........................................................................ 64 EV disaggregation methodology ............................................................................................... 68
List of figures and tables ............................................................................................................................. 69
UK Power Networks Distribution Future Energy Scenarios
5
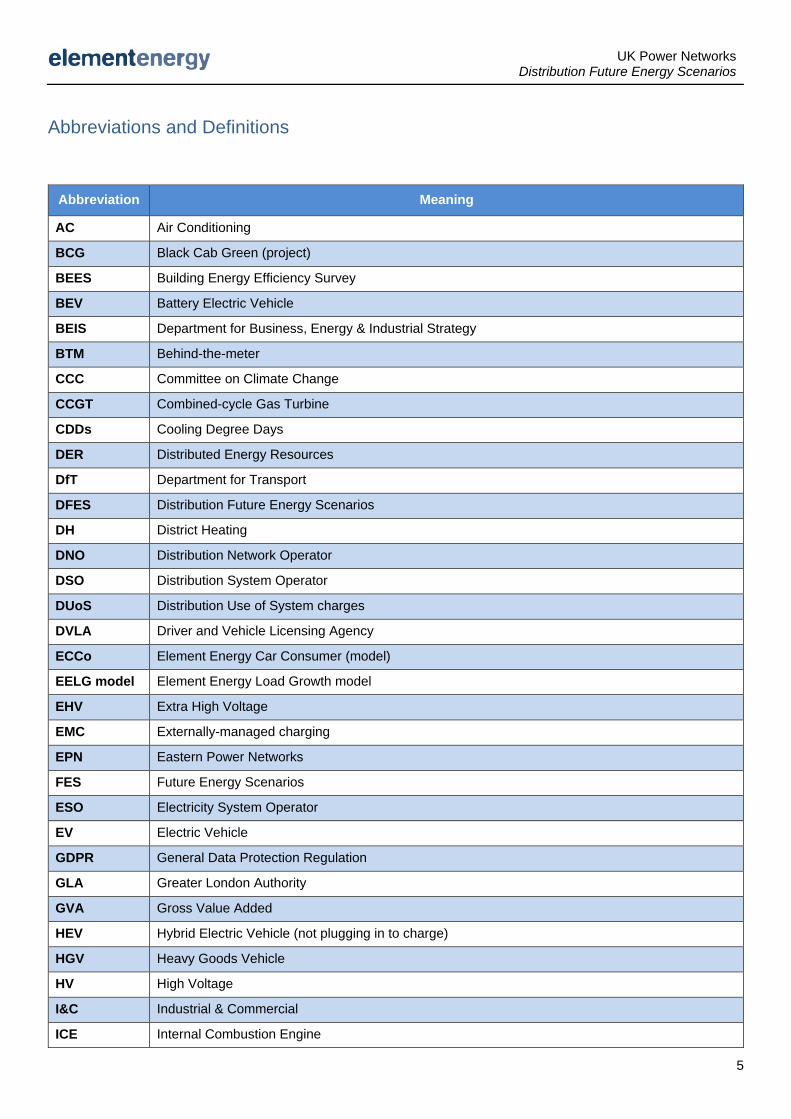
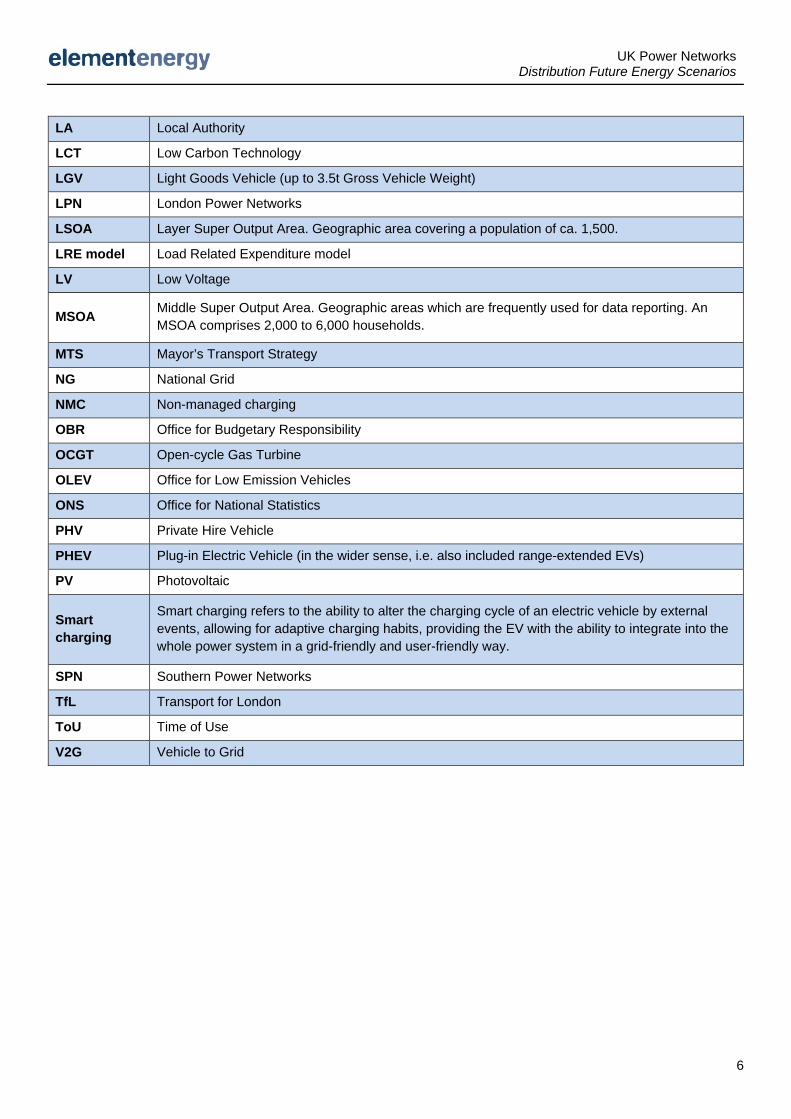
Abbreviations and Definitions
Abbreviation Meaning
AC Air Conditioning
BCG Black Cab Green (project)
BEES Building Energy Efficiency Survey
BEV Battery Electric Vehicle
BEIS Department for Business, Energy & Industrial Strategy
BTM Behind-the-meter
CCC Committee on Climate Change
CCGT Combined-cycle Gas Turbine
CDDs Cooling Degree Days
DER Distributed Energy Resources
DfT Department for Transport
DFES Distribution Future Energy Scenarios
DH District Heating
DNO Distribution Network Operator
DSO Distribution System Operator
DUoS Distribution Use of System charges
DVLA Driver and Vehicle Licensing Agency
ECCo Element Energy Car Consumer (model)
EELG model Element Energy Load Growth model
EHV Extra High Voltage
EMC Externally-managed charging
EPN Eastern Power Networks
FES Future Energy Scenarios
ESO Electricity System Operator
EV Electric Vehicle
GDPR General Data Protection Regulation
GLA Greater London Authority
GVA Gross Value Added
HEV Hybrid Electric Vehicle (not plugging in to charge)
HGV Heavy Goods Vehicle
HV High Voltage
I&C Industrial & Commercial
ICE Internal Combustion Engine
UK Power Networks Distribution Future Energy Scenarios
6
LA Local Authority
LCT Low Carbon Technology
LGV Light Goods Vehicle (up to 3.5t Gross Vehicle Weight)
LPN London Power Networks
LSOA Layer Super Output Area. Geographic area covering a population of ca. 1,500.
LRE model Load Related Expenditure model
LV Low Voltage
MSOA Middle Super Output Area. Geographic areas which are frequently used for data reporting. An MSOA comprises 2,000 to 6,000 households.
MTS Mayor’s Transport Strategy
NG National Grid
NMC Non-managed charging
OBR Office for Budgetary Responsibility
OCGT Open-cycle Gas Turbine
OLEV Office for Low Emission Vehicles
ONS Office for National Statistics
PHV Private Hire Vehicle
PHEV Plug-in Electric Vehicle (in the wider sense, i.e. also included range-extended EVs)
PV Photovoltaic
Smart charging
Smart charging refers to the ability to alter the charging cycle of an electric vehicle by external events, allowing for adaptive charging habits, providing the EV with the ability to integrate into the whole power system in a grid-friendly and user-friendly way.
SPN Southern Power Networks
TfL Transport for London
ToU Time of Use
V2G Vehicle to Grid
UK Power Networks Distribution Future Energy Scenarios
7
1 Introduction
1.1 What the DFES are and why they are necessary The Distribution Future Energy Scenarios (DFES) are designed to illustrate energy futures with different levels of decentralisation, decarbonisation, and digitalisation. They are constructed from a series of key drivers, which are thought to have significant impacts on energy demand and supply. Examples of these drivers include numbers of electric vehicles, number of new houses, or uptake of energy efficiency measures. The DFES are designed to provide UK Power Networks and its key stakeholders with an in-depth understanding of the way in which local electricity demand and generation will change in the future, so that they can plan efficient network capacity investment, whilst maintaining a secure supply of electricity to their customers, and facilitate continued electricity decarbonisation. With the recent passing into law of the United Kingdom’s ambition to be net zero in terms of greenhouse gas emissions by 2050, there is a significant impetus for a rapid transition to a decarbonised energy system. Despite this legally binding target, there is still significant uncertainty around how this ambitious goal will be achieved, particularly in sectors such as heating where there is a lack of clear policy and a broad range of different potential futures. This is the reason for creating a number of DFES, which accurately capture future uncertainty, and increase the robustness of UK Power Networks’ investment strategy.
1.2 Why UK Power Networks is developing its own DFES It is widely accepted that the uptake of low carbon technologies, such as electric vehicles, are unlikely to be evenly spread and are at least initially likely to cluster in certain geographic locations. Consequently, it is vital to develop forecasts that seek to capture, where practicable, the locations where these cluster are likely to occur. This granular understanding is vital to enable a better understanding of possible pinch points on Low Voltage (LV) and High Voltage (HV) assets, which service small numbers of customers. We also recognise that in order for this information to be useful for external stakeholders, they need to be able to see the data in a geographical representation that is meaningful to them. As we outline in Section 1.6 we have disaggregated the forecasts in a way that allows stakeholders to produce information that is relevant to them.
1.3 Consistency with National Grid’s Future Energy Scenarios While National Grid (NG), the Electricity System Operator (ESO), produce their own national-level FES, those scenarios do not provide the level of geospatial resolution or regional specificity that UK Power Networks requires for their business planning purposes. For the majority of the drivers of demand and generation considered here, we used a bottom-up approach that is regionally- and technology-specific. For transparency, given the importance of consistency of information across UK energy network operators, we compare our scenario outputs with National Grid’s (NG) FES. Generally, the scenarios developed in the work are consistent with the overarching views of the future considered in the NG FES. Where our model outputs vary significantly from NG’s scenario, the differences are discussed in this report. For some generation technologies, where disaggregating a national-level forecast was deemed to be the best approach to reconciling the regional and national installed capacities, we applied regionally- and technology-specific assumptions and disaggregation methodologies directly to the FES. To further improve consistency the output from this work will be provided to National Grid in a standardised format that has been agreed by National Grid and the DNOs. Additional work is also underway across the industry to explore other areas that could be standardised across the DFES and FES.
1.4 Project scope The scope of this work was to generate a range of uptake scenarios, typically three, for the likely key drivers of future demand and generation across UK Power Networks’ distribution network. A specific set of uptake scenarios has been developed for each of UK Power Networks’ licensed networks, including disaggregation to a high degree of geospatial resolution. These uptake scenarios provide projections for each of the drivers out to 2050. The key drivers for demand and generation across the distribution network for which scenarios were required are identified below:
UK Power Networks Distribution Future Energy Scenarios
8
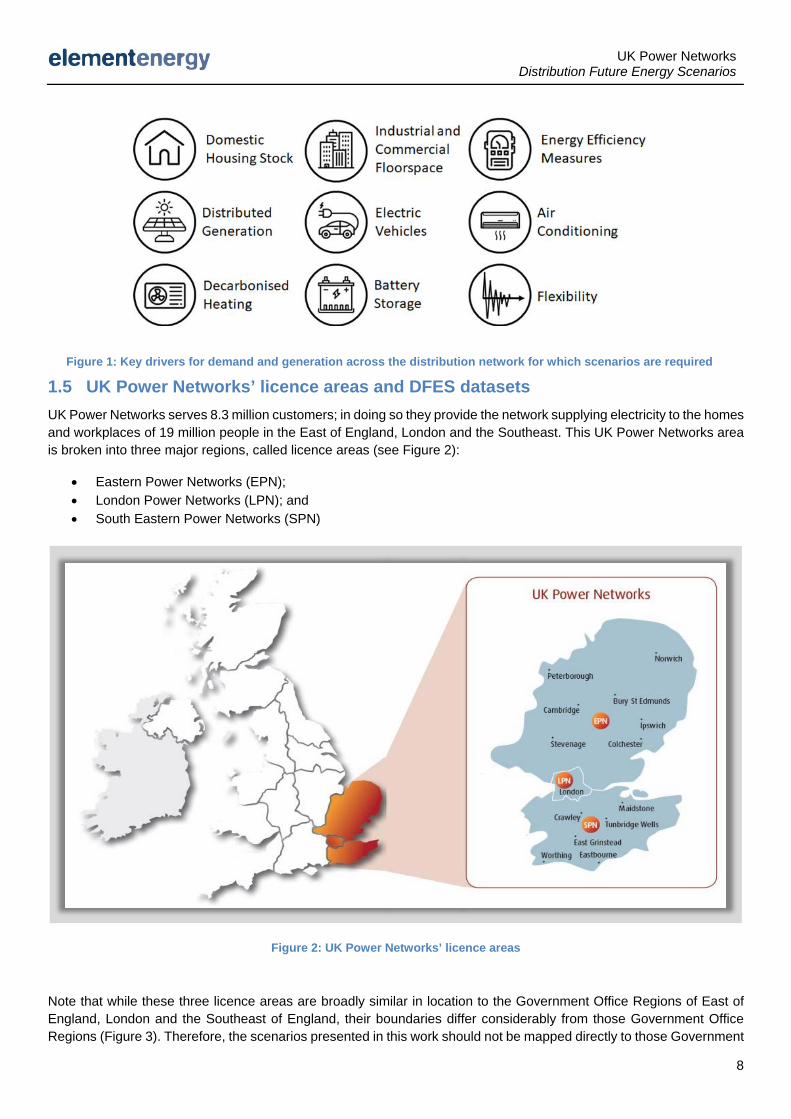
1.5 UK Power Networks’ licence areas and DFES datasets UK Power Networks serves 8.3 million customers; in doing so they provide the network supplying electricity to the homes and workplaces of 19 million people in the East of England, London and the Southeast. This UK Power Networks area is broken into three major regions, called licence areas (see Figure 2):
• Eastern Power Networks (EPN); • London Power Networks (LPN); and • South Eastern Power Networks (SPN)
Figure 2: UK Power Networks’ licence areas
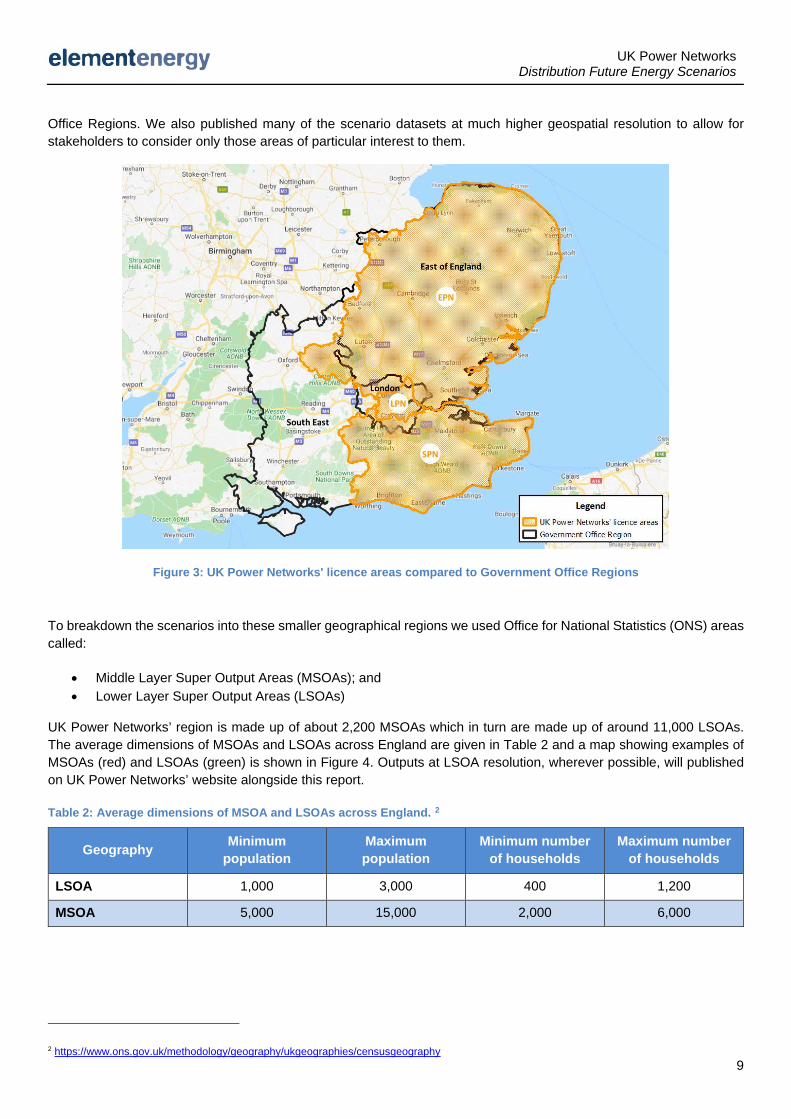
Note that while these three licence areas are broadly similar in location to the Government Office Regions of East of England, London and the Southeast of England, their boundaries differ considerably from those Government Office Regions (Figure 3). Therefore, the scenarios presented in this work should not be mapped directly to those Government
Figure 1: Key drivers for demand and generation across the distribution network for which scenarios are required
UK Power Networks Distribution Future Energy Scenarios
9
Office Regions. We also published many of the scenario datasets at much higher geospatial resolution to allow for stakeholders to consider only those areas of particular interest to them.
Figure 3: UK Power Networks' licence areas compared to Government Office Regions
To breakdown the scenarios into these smaller geographical regions we used Office for National Statistics (ONS) areas called:
• Middle Layer Super Output Areas (MSOAs); and • Lower Layer Super Output Areas (LSOAs)
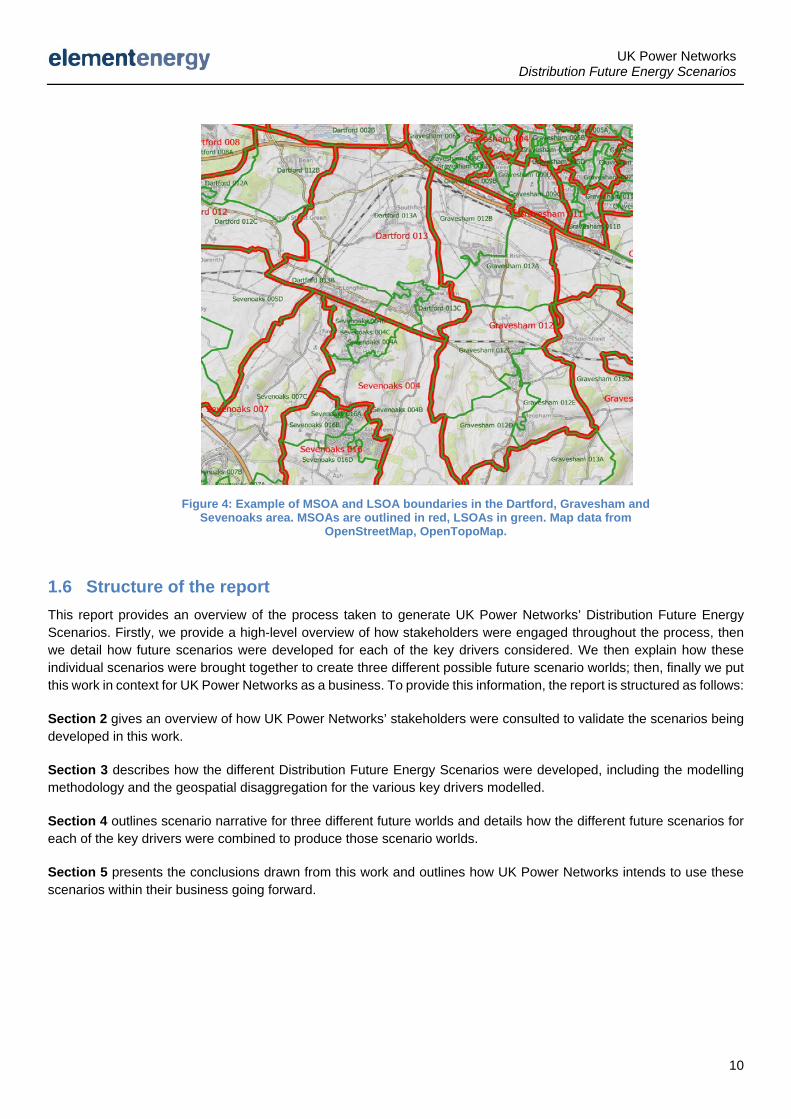
UK Power Networks’ region is made up of about 2,200 MSOAs which in turn are made up of around 11,000 LSOAs. The average dimensions of MSOAs and LSOAs across England are given in Table 2 and a map showing examples of MSOAs (red) and LSOAs (green) is shown in Figure 4. Outputs at LSOA resolution, wherever possible, will published on UK Power Networks’ website alongside this report.
Table 2: Average dimensions of MSOA and LSOAs across England. 2
Geography Minimum population
Maximum population
Minimum number of households
Maximum number of households
LSOA 1,000 3,000 400 1,200
MSOA 5,000 15,000 2,000 6,000
2 https://www.ons.gov.uk/methodology/geography/ukgeographies/censusgeography
UK Power Networks Distribution Future Energy Scenarios
10
1.6 Structure of the report This report provides an overview of the process taken to generate UK Power Networks’ Distribution Future Energy Scenarios. Firstly, we provide a high-level overview of how stakeholders were engaged throughout the process, then we detail how future scenarios were developed for each of the key drivers considered. We then explain how these individual scenarios were brought together to create three different possible future scenario worlds; then, finally we put this work in context for UK Power Networks as a business. To provide this information, the report is structured as follows:
Section 2 gives an overview of how UK Power Networks’ stakeholders were consulted to validate the scenarios being developed in this work.
Section 3 describes how the different Distribution Future Energy Scenarios were developed, including the modelling methodology and the geospatial disaggregation for the various key drivers modelled.
Section 4 outlines scenario narrative for three different future worlds and details how the different future scenarios for each of the key drivers were combined to produce those scenario worlds.
Section 5 presents the conclusions drawn from this work and outlines how UK Power Networks intends to use these scenarios within their business going forward.
Figure 4: Example of MSOA and LSOA boundaries in the Dartford, Gravesham and Sevenoaks area. MSOAs are outlined in red, LSOAs in green. Map data from
OpenStreetMap, OpenTopoMap.
UK Power Networks Distribution Future Energy Scenarios
11
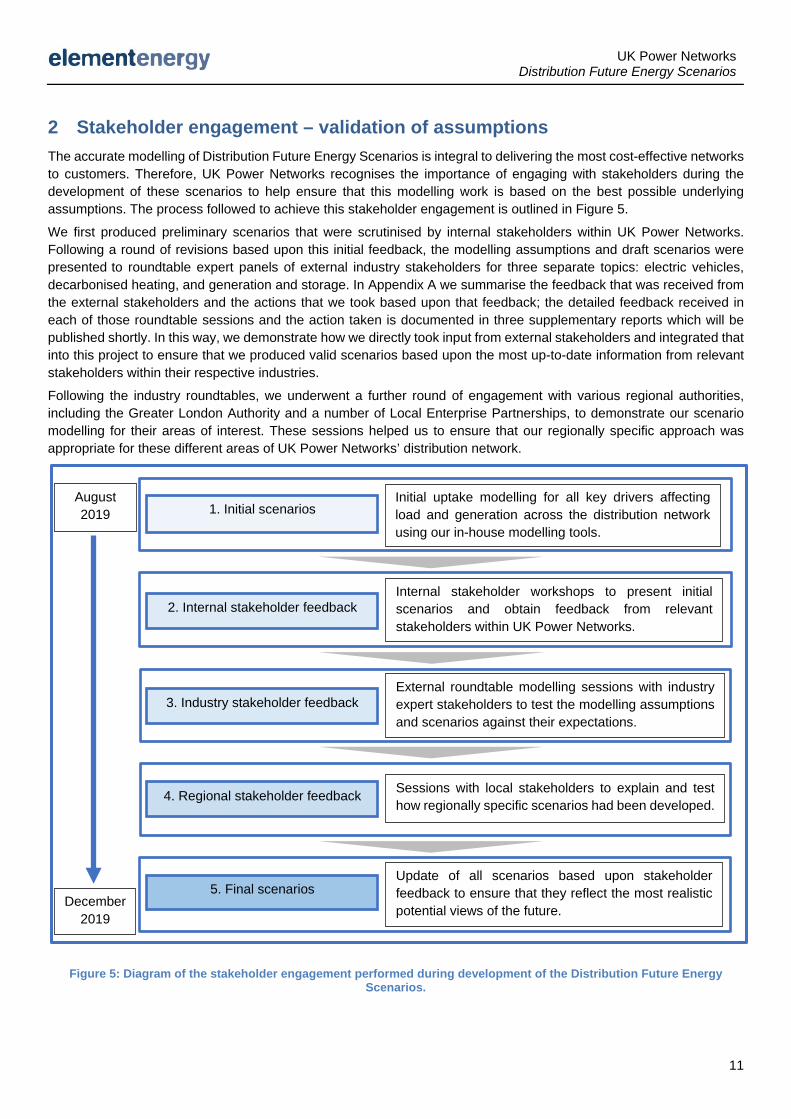
2 Stakeholder engagement – validation of assumptions The accurate modelling of Distribution Future Energy Scenarios is integral to delivering the most cost-effective networks to customers. Therefore, UK Power Networks recognises the importance of engaging with stakeholders during the development of these scenarios to help ensure that this modelling work is based on the best possible underlying assumptions. The process followed to achieve this stakeholder engagement is outlined in Figure 5.
We first produced preliminary scenarios that were scrutinised by internal stakeholders within UK Power Networks. Following a round of revisions based upon this initial feedback, the modelling assumptions and draft scenarios were presented to roundtable expert panels of external industry stakeholders for three separate topics: electric vehicles, decarbonised heating, and generation and storage. In Appendix A we summarise the feedback that was received from the external stakeholders and the actions that we took based upon that feedback; the detailed feedback received in each of those roundtable sessions and the action taken is documented in three supplementary reports which will be published shortly. In this way, we demonstrate how we directly took input from external stakeholders and integrated that into this project to ensure that we produced valid scenarios based upon the most up-to-date information from relevant stakeholders within their respective industries.
Following the industry roundtables, we underwent a further round of engagement with various regional authorities, including the Greater London Authority and a number of Local Enterprise Partnerships, to demonstrate our scenario modelling for their areas of interest. These sessions helped us to ensure that our regionally specific approach was appropriate for these different areas of UK Power Networks’ distribution network.
Figure 5: Diagram of the stakeholder engagement performed during development of the Distribution Future Energy Scenarios.
1. Initial scenarios
3. Industry stakeholder feedback
5. Final scenarios
Initial uptake modelling for all key drivers affecting load and generation across the distribution network using our in-house modelling tools.
Internal stakeholder workshops to present initial scenarios and obtain feedback from relevant stakeholders within UK Power Networks.
Update of all scenarios based upon stakeholder feedback to ensure that they reflect the most realistic potential views of the future.
August 2019
December 2019
4. Regional stakeholder feedback
2. Internal stakeholder feedback
External roundtable modelling sessions with industry expert stakeholders to test the modelling assumptions and scenarios against their expectations.
Sessions with local stakeholders to explain and test how regionally specific scenarios had been developed.
UK Power Networks Distribution Future Energy Scenarios
12
3 Scenario development
3.1 Core demand The majority of current electricity demand within UK Power Networks’ region can be divided into two categories, namely the underlying demand from either domestic customers or industrial and commercial (I&C) customers. Underlying demand here refers to all electricity usage relating to existing appliances, including electrical heating or cooling, but would exclude demand from new low carbon heating technologies such as electric vehicle charging or heat pumps. Collectively this underlying demand from these two sectors is referred to as the “core demand” on the network. Future core demand for these two sectors is primarily controlled by two key variables:
• The total number of customers connected to the network – assumed to be controlled by the size of the building stock; and
• The energy intensity of the customers within those properties.
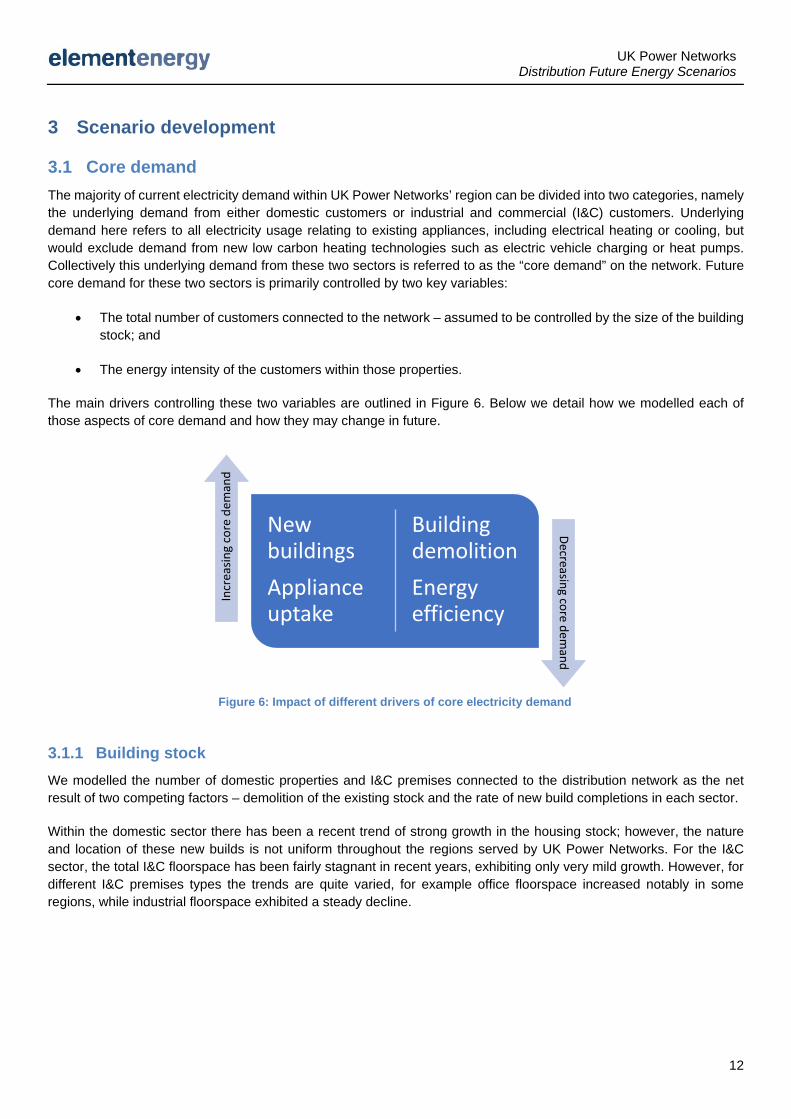
The main drivers controlling these two variables are outlined in Figure 6. Below we detail how we modelled each of those aspects of core demand and how they may change in future.
3.1.1 Building stock We modelled the number of domestic properties and I&C premises connected to the distribution network as the net result of two competing factors – demolition of the existing stock and the rate of new build completions in each sector.
Within the domestic sector there has been a recent trend of strong growth in the housing stock; however, the nature and location of these new builds is not uniform throughout the regions served by UK Power Networks. For the I&C sector, the total I&C floorspace has been fairly stagnant in recent years, exhibiting only very mild growth. However, for different I&C premises types the trends are quite varied, for example office floorspace increased notably in some regions, while industrial floorspace exhibited a steady decline.
New buildingsAppliance uptake
Building demolitionEnergy efficiency
Incr
easin
g co
re d
eman
dDecreasing core dem
and
Figure 6: Impact of different drivers of core electricity demand
UK Power Networks Distribution Future Energy Scenarios
13
Domestic building stock
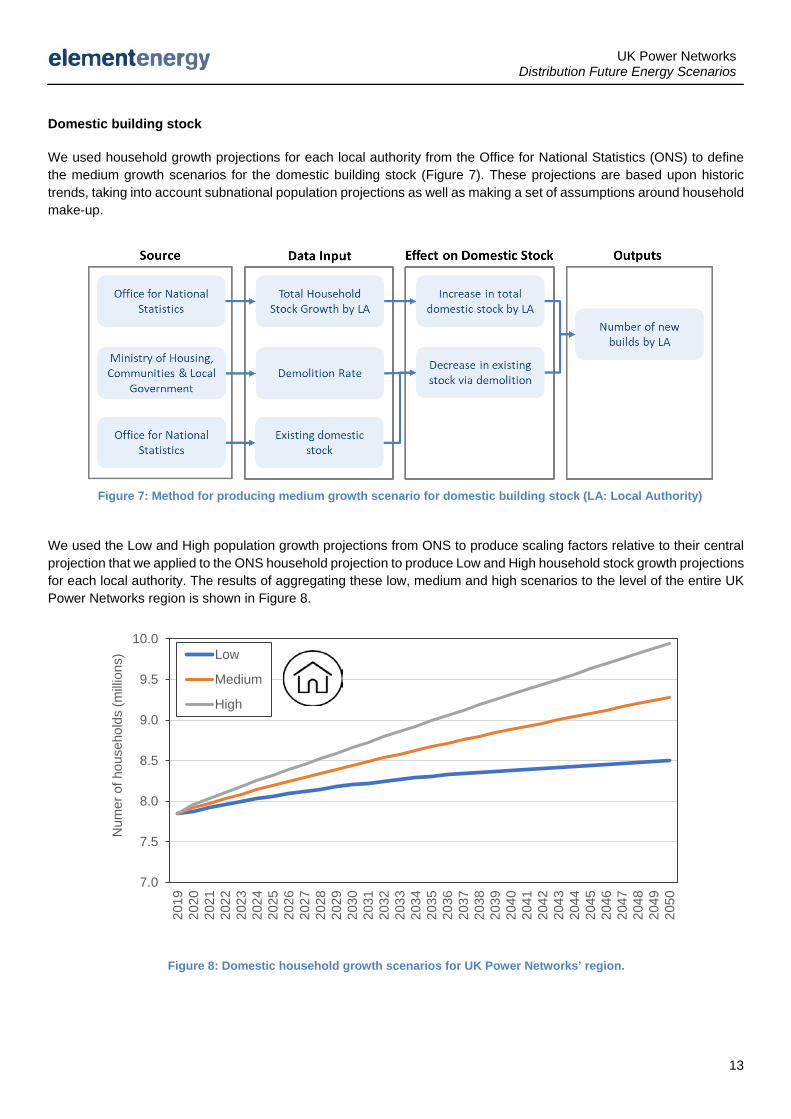
We used household growth projections for each local authority from the Office for National Statistics (ONS) to define the medium growth scenarios for the domestic building stock (Figure 7). These projections are based upon historic trends, taking into account subnational population projections as well as making a set of assumptions around household make-up.
We used the Low and High population growth projections from ONS to produce scaling factors relative to their central projection that we applied to the ONS household projection to produce Low and High household stock growth projections for each local authority. The results of aggregating these low, medium and high scenarios to the level of the entire UK Power Networks region is shown in Figure 8.
Figure 8: Domestic household growth scenarios for UK Power Networks’ region.
Figure 7: Method for producing medium growth scenario for domestic building stock (LA: Local Authority)
7.0
7.5
8.0
8.5
9.0
9.5
10.0
2019
2020
2021
2022
2023
2024
2025
2026
2027
2028
2029
2030
2031
2032
2033
2034
2035
2036
2037
2038
2039
2040
2041
2042
2043
2044
2045
2046
2047
2048
2049
2050
Num
er o
f hou
seho
lds
(milli
ons) Low
Medium
High
UK Power Networks Distribution Future Energy Scenarios
14
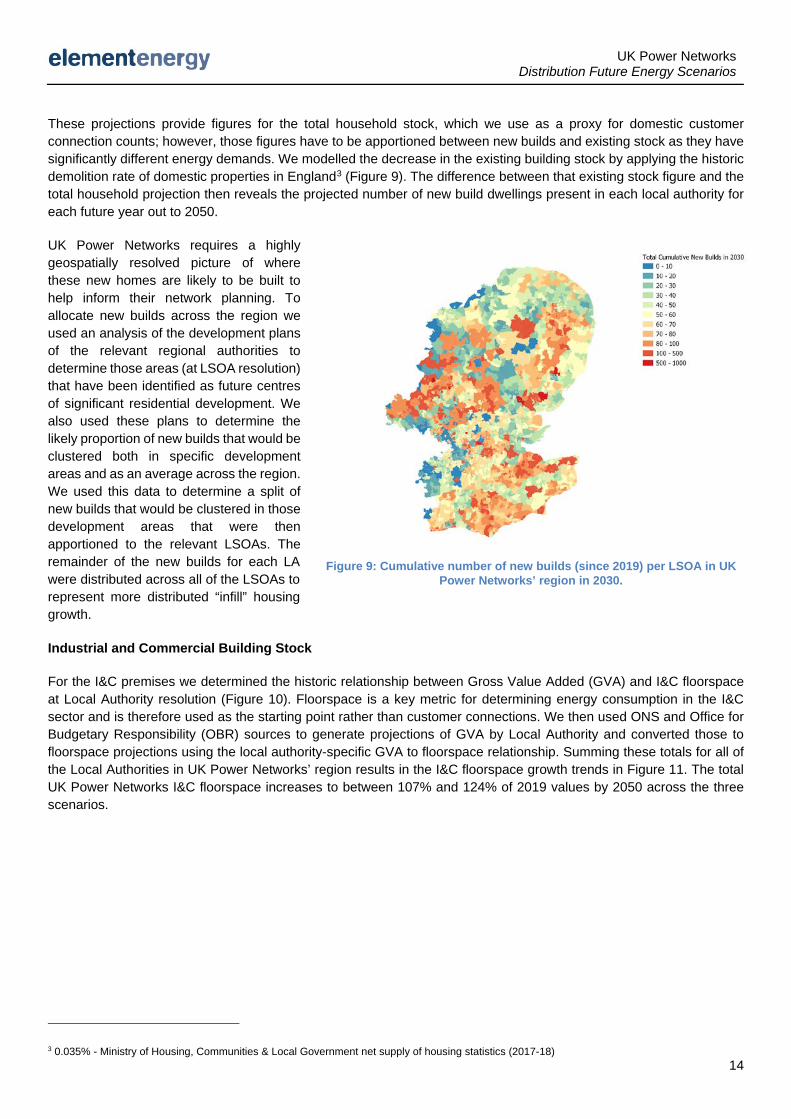
These projections provide figures for the total household stock, which we use as a proxy for domestic customer connection counts; however, those figures have to be apportioned between new builds and existing stock as they have significantly different energy demands. We modelled the decrease in the existing building stock by applying the historic demolition rate of domestic properties in England3 (Figure 9). The difference between that existing stock figure and the total household projection then reveals the projected number of new build dwellings present in each local authority for each future year out to 2050.
UK Power Networks requires a highly geospatially resolved picture of where these new homes are likely to be built to help inform their network planning. To allocate new builds across the region we used an analysis of the development plans of the relevant regional authorities to determine those areas (at LSOA resolution) that have been identified as future centres of significant residential development. We also used these plans to determine the likely proportion of new builds that would be clustered both in specific development areas and as an average across the region. We used this data to determine a split of new builds that would be clustered in those development areas that were then apportioned to the relevant LSOAs. The remainder of the new builds for each LA were distributed across all of the LSOAs to represent more distributed “infill” housing growth.
Industrial and Commercial Building Stock
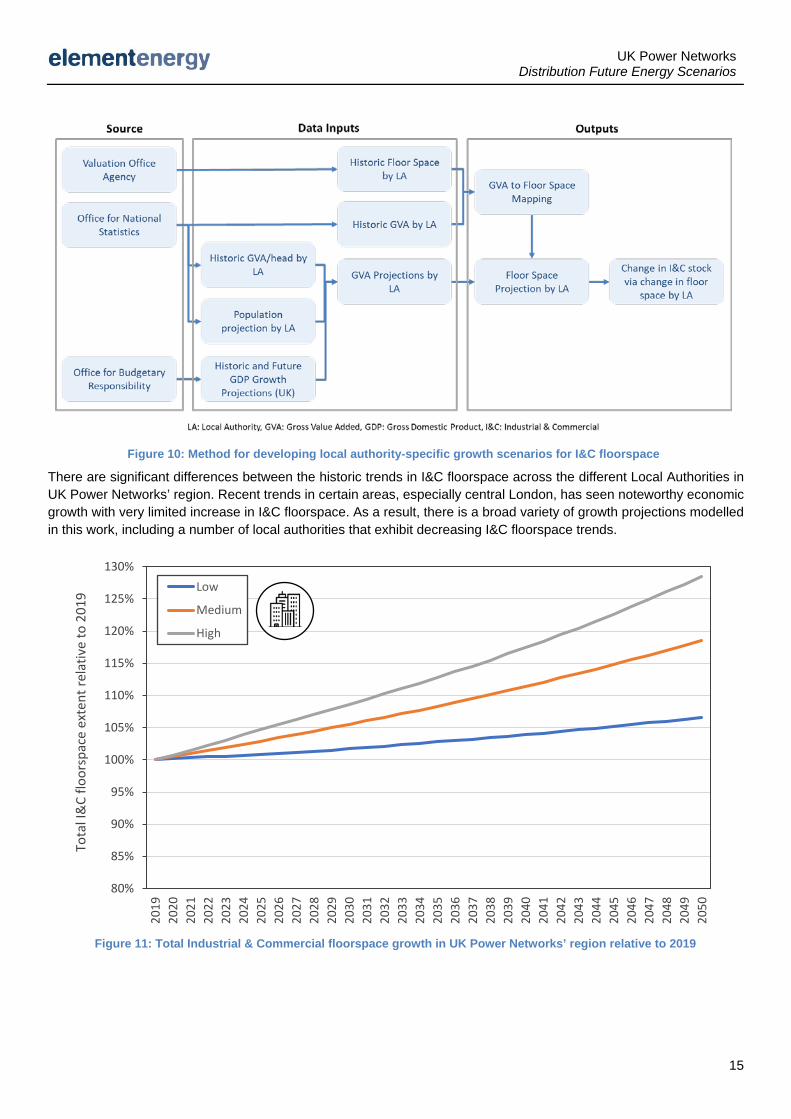
For the I&C premises we determined the historic relationship between Gross Value Added (GVA) and I&C floorspace at Local Authority resolution (Figure 10). Floorspace is a key metric for determining energy consumption in the I&C sector and is therefore used as the starting point rather than customer connections. We then used ONS and Office for Budgetary Responsibility (OBR) sources to generate projections of GVA by Local Authority and converted those to floorspace projections using the local authority-specific GVA to floorspace relationship. Summing these totals for all of the Local Authorities in UK Power Networks’ region results in the I&C floorspace growth trends in Figure 11. The total UK Power Networks I&C floorspace increases to between 107% and 124% of 2019 values by 2050 across the three scenarios.
3 0.035% - Ministry of Housing, Communities & Local Government net supply of housing statistics (2017-18)
Figure 9: Cumulative number of new builds (since 2019) per LSOA in UK Power Networks’ region in 2030.
UK Power Networks Distribution Future Energy Scenarios
15
There are significant differences between the historic trends in I&C floorspace across the different Local Authorities in UK Power Networks’ region. Recent trends in certain areas, especially central London, has seen noteworthy economic growth with very limited increase in I&C floorspace. As a result, there is a broad variety of growth projections modelled in this work, including a number of local authorities that exhibit decreasing I&C floorspace trends.
Figure 10: Method for developing local authority-specific growth scenarios for I&C floorspace
Figure 11: Total Industrial & Commercial floorspace growth in UK Power Networks’ region relative to 2019
80%
85%
90%
95%
100%
105%
110%
115%
120%
125%
130%
2019
2020
2021
2022
2023
2024
2025
2026
2027
2028
2029
2030
2031
2032
2033
2034
2035
2036
2037
2038
2039
2040
2041
2042
2043
2044
2045
2046
2047
2048
2049
2050
Tota
l I&
C flo
orsp
ace
exte
nt re
lativ
e to
201
9
Low
Medium
High
UK Power Networks Distribution Future Energy Scenarios
16
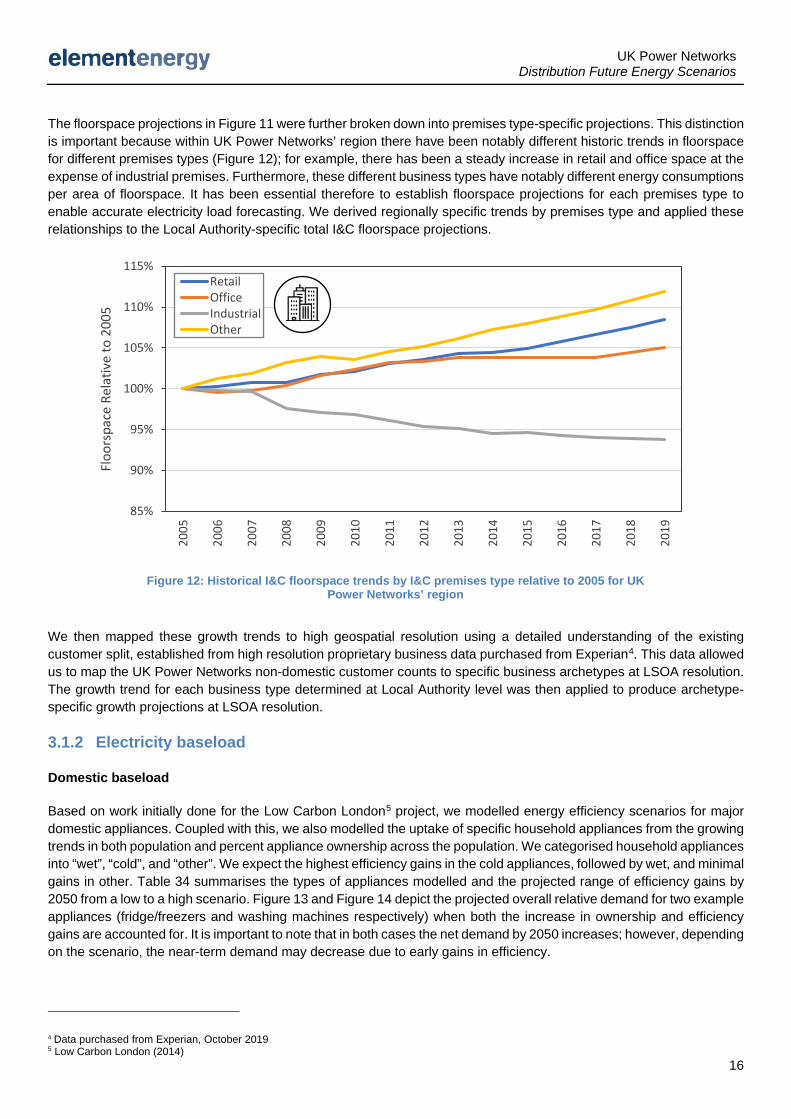
The floorspace projections in Figure 11 were further broken down into premises type-specific projections. This distinction is important because within UK Power Networks’ region there have been notably different historic trends in floorspace for different premises types (Figure 12); for example, there has been a steady increase in retail and office space at the expense of industrial premises. Furthermore, these different business types have notably different energy consumptions per area of floorspace. It has been essential therefore to establish floorspace projections for each premises type to enable accurate electricity load forecasting. We derived regionally specific trends by premises type and applied these relationships to the Local Authority-specific total I&C floorspace projections.
We then mapped these growth trends to high geospatial resolution using a detailed understanding of the existing customer split, established from high resolution proprietary business data purchased from Experian4. This data allowed us to map the UK Power Networks non-domestic customer counts to specific business archetypes at LSOA resolution. The growth trend for each business type determined at Local Authority level was then applied to produce archetype-specific growth projections at LSOA resolution.
3.1.2 Electricity baseload
Domestic baseload
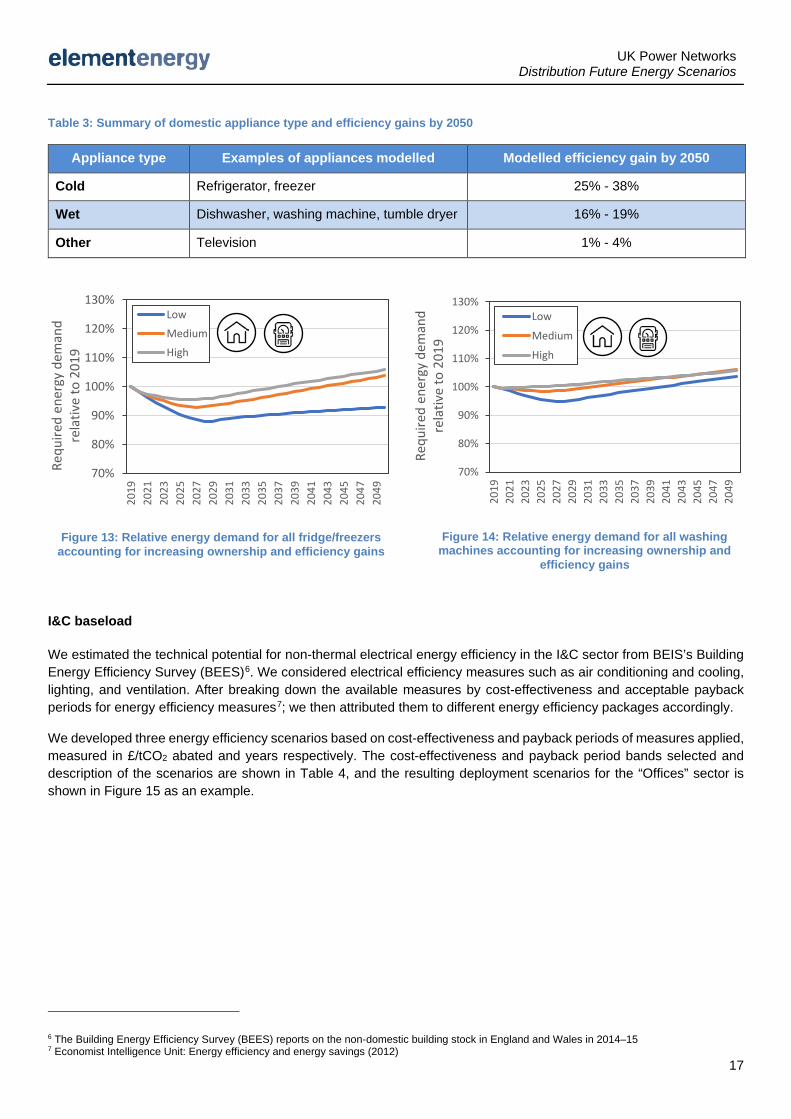
Based on work initially done for the Low Carbon London5 project, we modelled energy efficiency scenarios for major domestic appliances. Coupled with this, we also modelled the uptake of specific household appliances from the growing trends in both population and percent appliance ownership across the population. We categorised household appliances into “wet”, “cold”, and “other”. We expect the highest efficiency gains in the cold appliances, followed by wet, and minimal gains in other. Table 34 summarises the types of appliances modelled and the projected range of efficiency gains by 2050 from a low to a high scenario. Figure 13 and Figure 14 depict the projected overall relative demand for two example appliances (fridge/freezers and washing machines respectively) when both the increase in ownership and efficiency gains are accounted for. It is important to note that in both cases the net demand by 2050 increases; however, depending on the scenario, the near-term demand may decrease due to early gains in efficiency.
4 Data purchased from Experian, October 2019 5 Low Carbon London (2014)
Figure 12: Historical I&C floorspace trends by I&C premises type relative to 2005 for UK Power Networks’ region
85%
90%
95%
100%
105%
110%
115%
2005
2006
2007
2008
2009
2010
2011
2012
2013
2014
2015
2016
2017
2018
2019
Floo
rspa
ce R
elat
ive
to 2
005
RetailOfficeIndustrialOther
UK Power Networks Distribution Future Energy Scenarios
17
Table 3: Summary of domestic appliance type and efficiency gains by 2050
I&C baseload
We estimated the technical potential for non-thermal electrical energy efficiency in the I&C sector from BEIS’s Building Energy Efficiency Survey (BEES)6. We considered electrical efficiency measures such as air conditioning and cooling, lighting, and ventilation. After breaking down the available measures by cost-effectiveness and acceptable payback periods for energy efficiency measures7; we then attributed them to different energy efficiency packages accordingly.
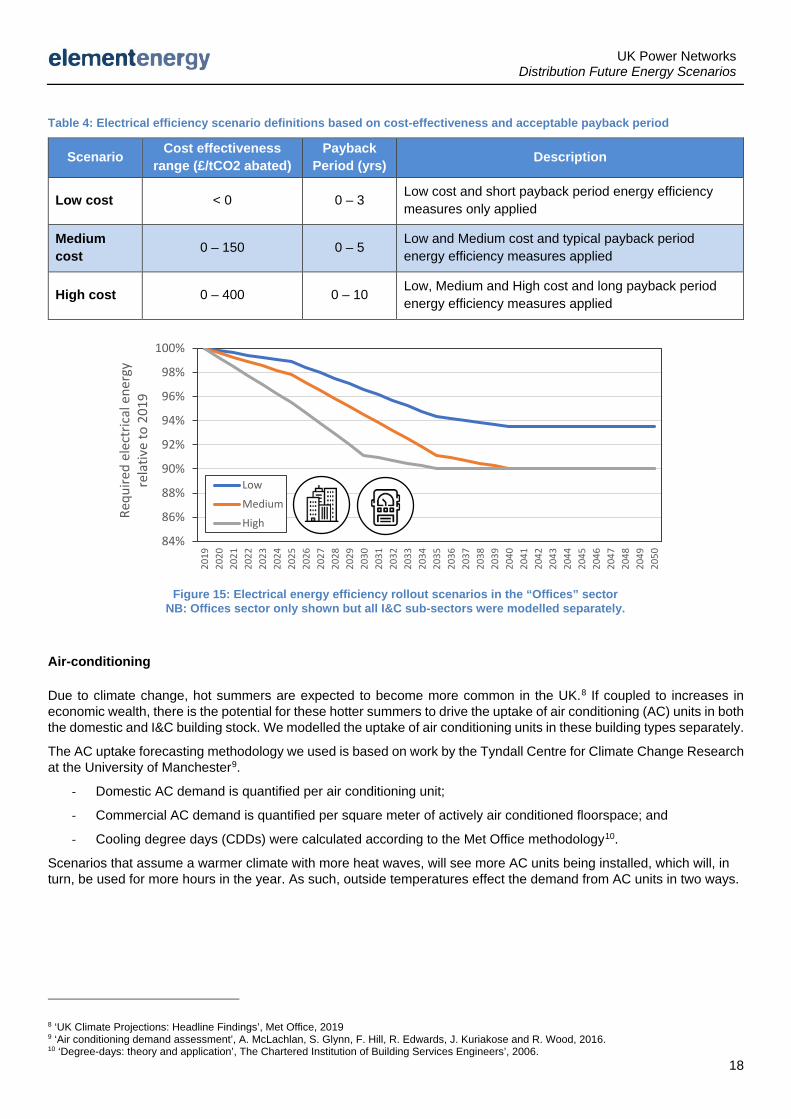
We developed three energy efficiency scenarios based on cost-effectiveness and payback periods of measures applied, measured in £/tCO2 abated and years respectively. The cost-effectiveness and payback period bands selected and description of the scenarios are shown in Table 4, and the resulting deployment scenarios for the “Offices” sector is shown in Figure 15 as an example.
6 The Building Energy Efficiency Survey (BEES) reports on the non-domestic building stock in England and Wales in 2014–15 7 Economist Intelligence Unit: Energy efficiency and energy savings (2012)
Appliance type Examples of appliances modelled Modelled efficiency gain by 2050
Cold Refrigerator, freezer 25% - 38%
Wet Dishwasher, washing machine, tumble dryer 16% - 19%
Other Television 1% - 4%
70%
80%
90%
100%
110%
120%
130%
2019
2021
2023
2025
2027
2029
2031
2033
2035
2037
2039
2041
2043
2045
2047
2049
Requ
ired
ener
gy d
eman
d re
lativ
e to
201
9
Low
Medium
High
70%
80%
90%
100%
110%
120%
130%
2019
2021
2023
2025
2027
2029
2031
2033
2035
2037
2039
2041
2043
2045
2047
2049
Requ
ired
ener
gy d
eman
d re
lativ
e to
201
9
Low
Medium
High
Figure 14: Relative energy demand for all washing machines accounting for increasing ownership and
efficiency gains
Figure 13: Relative energy demand for all fridge/freezers accounting for increasing ownership and efficiency gains
UK Power Networks Distribution Future Energy Scenarios
18
Table 4: Electrical efficiency scenario definitions based on cost-effectiveness and acceptable payback period
Scenario Cost effectiveness range (£/tCO2 abated)
Payback Period (yrs) Description
Low cost < 0 0 – 3 Low cost and short payback period energy efficiency measures only applied
Medium cost 0 – 150 0 – 5 Low and Medium cost and typical payback period
energy efficiency measures applied
High cost 0 – 400 0 – 10 Low, Medium and High cost and long payback period energy efficiency measures applied
Air-conditioning
Due to climate change, hot summers are expected to become more common in the UK.8 If coupled to increases in economic wealth, there is the potential for these hotter summers to drive the uptake of air conditioning (AC) units in both the domestic and I&C building stock. We modelled the uptake of air conditioning units in these building types separately.
The AC uptake forecasting methodology we used is based on work by the Tyndall Centre for Climate Change Research at the University of Manchester9.
- Domestic AC demand is quantified per air conditioning unit;
- Commercial AC demand is quantified per square meter of actively air conditioned floorspace; and
- Cooling degree days (CDDs) were calculated according to the Met Office methodology10.
Scenarios that assume a warmer climate with more heat waves, will see more AC units being installed, which will, in turn, be used for more hours in the year. As such, outside temperatures effect the demand from AC units in two ways.
8 ‘UK Climate Projections: Headline Findings’, Met Office, 2019 9 ‘Air conditioning demand assessment’, A. McLachlan, S. Glynn, F. Hill, R. Edwards, J. Kuriakose and R. Wood, 2016. 10 ‘Degree-days: theory and application’, The Chartered Institution of Building Services Engineers’, 2006.
Figure 15: Electrical energy efficiency rollout scenarios in the “Offices” sector NB: Offices sector only shown but all I&C sub-sectors were modelled separately.
84%
86%
88%
90%
92%
94%
96%
98%
100%
2019
2020
2021
2022
2023
2024
2025
2026
2027
2028
2029
2030
2031
2032
2033
2034
2035
2036
2037
2038
2039
2040
2041
2042
2043
2044
2045
2046
2047
2048
2049
2050
Requ
ired
elec
tric
al e
nerg
y re
lativ
e to
201
9
Low
Medium
High
UK Power Networks Distribution Future Energy Scenarios
19
Domestic sector
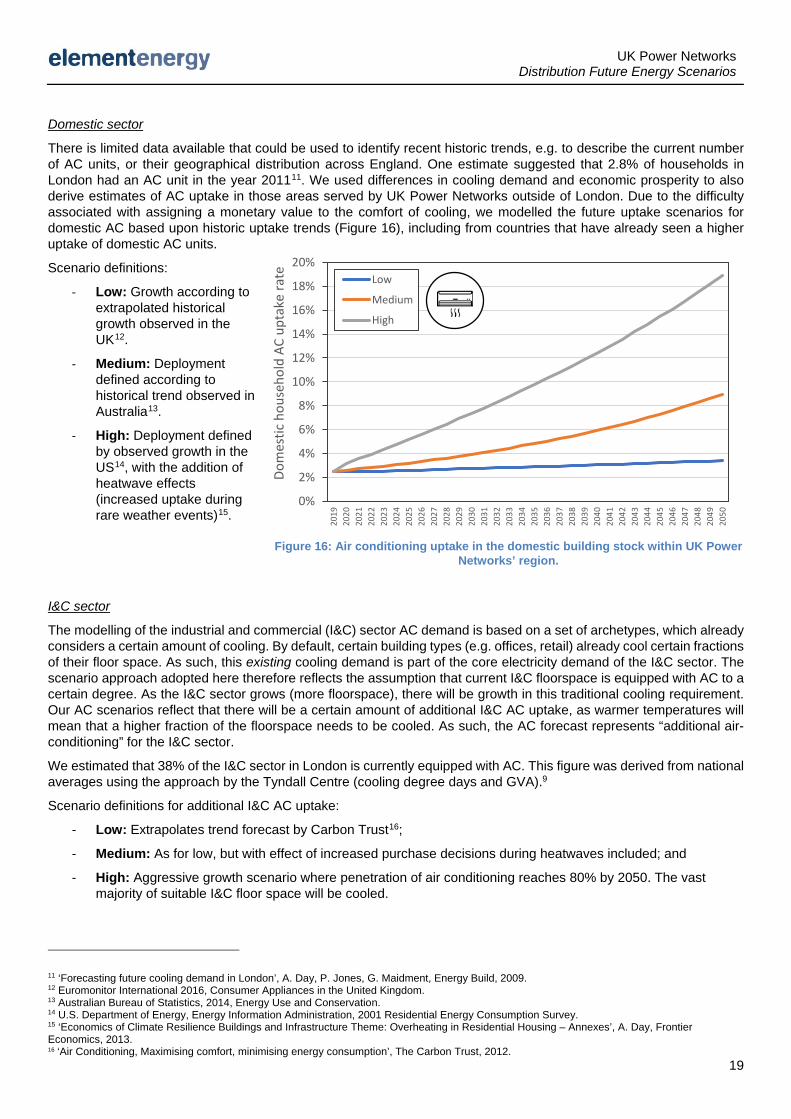
There is limited data available that could be used to identify recent historic trends, e.g. to describe the current number of AC units, or their geographical distribution across England. One estimate suggested that 2.8% of households in London had an AC unit in the year 201111. We used differences in cooling demand and economic prosperity to also derive estimates of AC uptake in those areas served by UK Power Networks outside of London. Due to the difficulty associated with assigning a monetary value to the comfort of cooling, we modelled the future uptake scenarios for domestic AC based upon historic uptake trends (Figure 16), including from countries that have already seen a higher uptake of domestic AC units.
Scenario definitions:
- Low: Growth according to extrapolated historical growth observed in the UK12.
- Medium: Deployment defined according to historical trend observed in Australia13.
- High: Deployment defined by observed growth in the US14, with the addition of heatwave effects (increased uptake during rare weather events)15.
I&C sector
The modelling of the industrial and commercial (I&C) sector AC demand is based on a set of archetypes, which already considers a certain amount of cooling. By default, certain building types (e.g. offices, retail) already cool certain fractions of their floor space. As such, this existing cooling demand is part of the core electricity demand of the I&C sector. The scenario approach adopted here therefore reflects the assumption that current I&C floorspace is equipped with AC to a certain degree. As the I&C sector grows (more floorspace), there will be growth in this traditional cooling requirement. Our AC scenarios reflect that there will be a certain amount of additional I&C AC uptake, as warmer temperatures will mean that a higher fraction of the floorspace needs to be cooled. As such, the AC forecast represents “additional air-conditioning” for the I&C sector.
We estimated that 38% of the I&C sector in London is currently equipped with AC. This figure was derived from national averages using the approach by the Tyndall Centre (cooling degree days and GVA).9
Scenario definitions for additional I&C AC uptake:
- Low: Extrapolates trend forecast by Carbon Trust16;
- Medium: As for low, but with effect of increased purchase decisions during heatwaves included; and
- High: Aggressive growth scenario where penetration of air conditioning reaches 80% by 2050. The vast majority of suitable I&C floor space will be cooled.
11 ‘Forecasting future cooling demand in London’, A. Day, P. Jones, G. Maidment, Energy Build, 2009. 12 Euromonitor International 2016, Consumer Appliances in the United Kingdom. 13 Australian Bureau of Statistics, 2014, Energy Use and Conservation. 14 U.S. Department of Energy, Energy Information Administration, 2001 Residential Energy Consumption Survey. 15 ‘Economics of Climate Resilience Buildings and Infrastructure Theme: Overheating in Residential Housing – Annexes’, A. Day, Frontier Economics, 2013. 16 ‘Air Conditioning, Maximising comfort, minimising energy consumption’, The Carbon Trust, 2012.
Figure 16: Air conditioning uptake in the domestic building stock within UK Power Networks’ region.
0%
2%
4%
6%
8%
10%
12%
14%
16%
18%
20%
2019
2020
2021
2022
2023
2024
2025
2026
2027
2028
2029
2030
2031
2032
2033
2034
2035
2036
2037
2038
2039
2040
2041
2042
2043
2044
2045
2046
2047
2048
2049
2050
Dom
estic
hou
seho
ld A
C up
take
rate Low
Medium
High
UK Power Networks Distribution Future Energy Scenarios
20
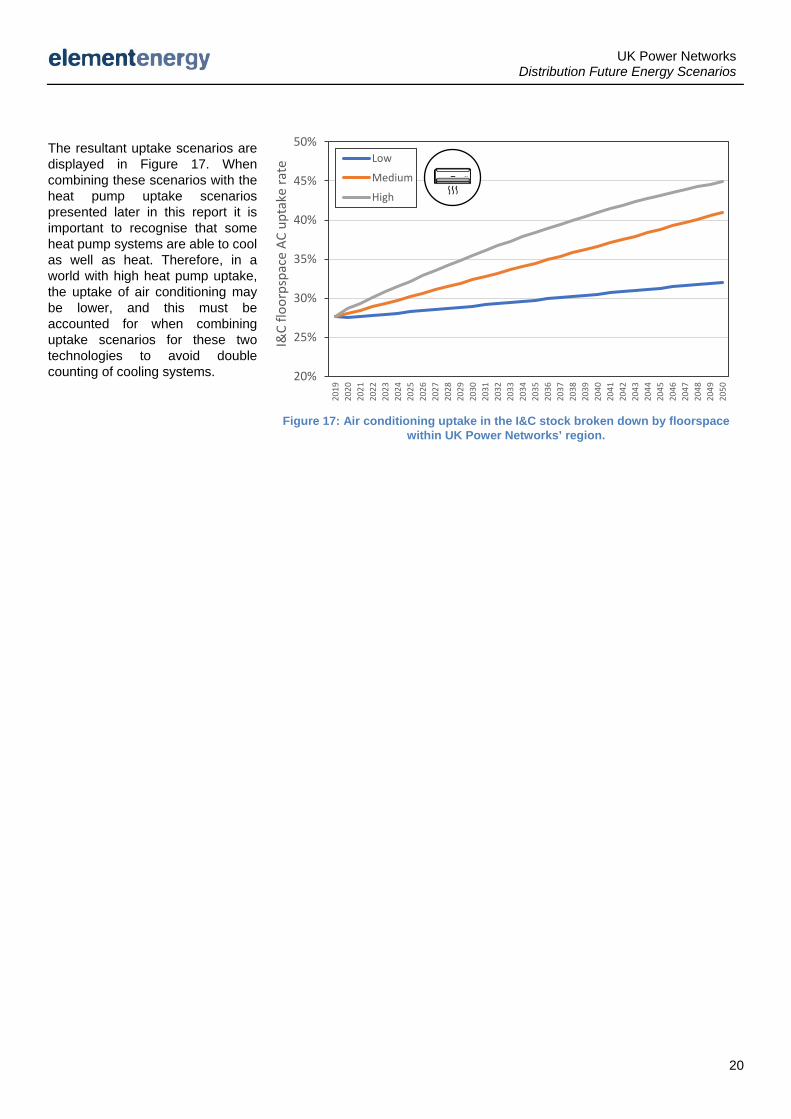
The resultant uptake scenarios are displayed in Figure 17. When combining these scenarios with the heat pump uptake scenarios presented later in this report it is important to recognise that some heat pump systems are able to cool as well as heat. Therefore, in a world with high heat pump uptake, the uptake of air conditioning may be lower, and this must be accounted for when combining uptake scenarios for these two technologies to avoid double counting of cooling systems.
Figure 17: Air conditioning uptake in the I&C stock broken down by floorspace within UK Power Networks’ region.
20%
25%
30%
35%
40%
45%
50%
2019
2020
2021
2022
2023
2024
2025
2026
2027
2028
2029
2030
2031
2032
2033
2034
2035
2036
2037
2038
2039
2040
2041
2042
2043
2044
2045
2046
2047
2048
2049
2050
I&C
floor
pspa
ce A
C up
take
rate
Low
Medium
High
UK Power Networks Distribution Future Energy Scenarios
21
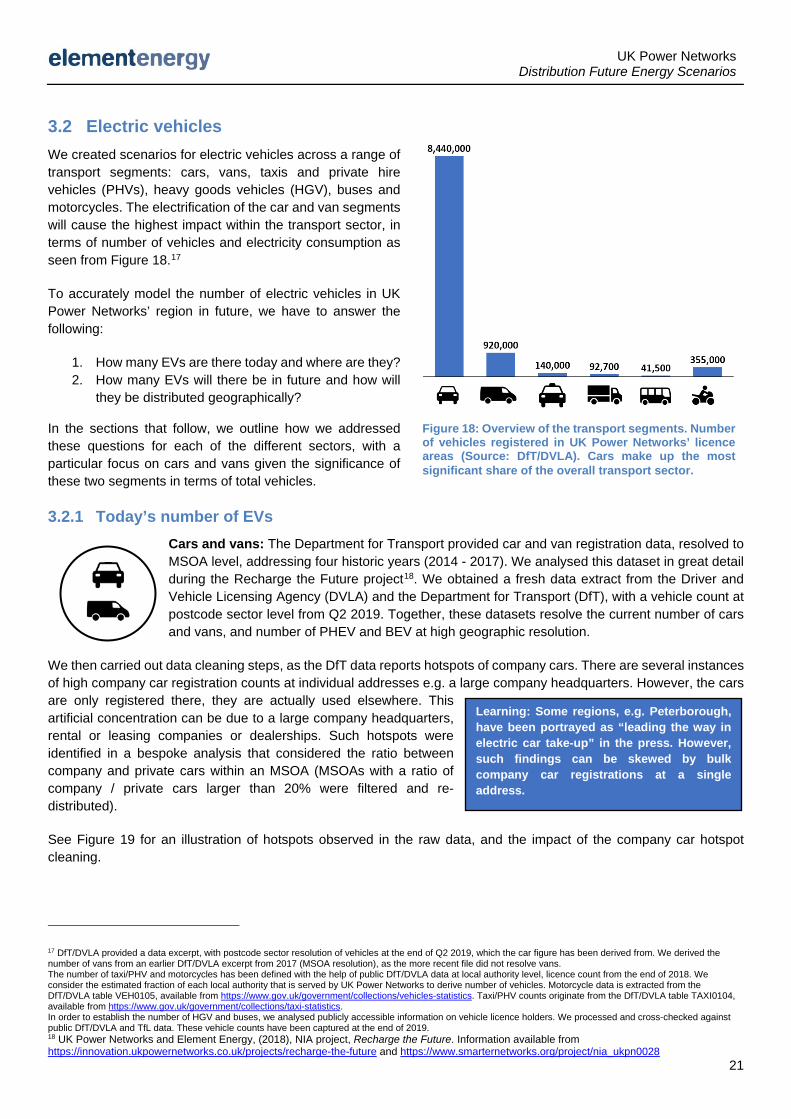
3.2 Electric vehicles We created scenarios for electric vehicles across a range of transport segments: cars, vans, taxis and private hire vehicles (PHVs), heavy goods vehicles (HGV), buses and motorcycles. The electrification of the car and van segments will cause the highest impact within the transport sector, in terms of number of vehicles and electricity consumption as seen from Figure 18.17
To accurately model the number of electric vehicles in UK Power Networks’ region in future, we have to answer the following:
1. How many EVs are there today and where are they? 2. How many EVs will there be in future and how will
they be distributed geographically?
In the sections that follow, we outline how we addressed these questions for each of the different sectors, with a particular focus on cars and vans given the significance of these two segments in terms of total vehicles.
3.2.1 Today’s number of EVs Cars and vans: The Department for Transport provided car and van registration data, resolved to MSOA level, addressing four historic years (2014 - 2017). We analysed this dataset in great detail during the Recharge the Future project18. We obtained a fresh data extract from the Driver and Vehicle Licensing Agency (DVLA) and the Department for Transport (DfT), with a vehicle count at postcode sector level from Q2 2019. Together, these datasets resolve the current number of cars and vans, and number of PHEV and BEV at high geographic resolution.
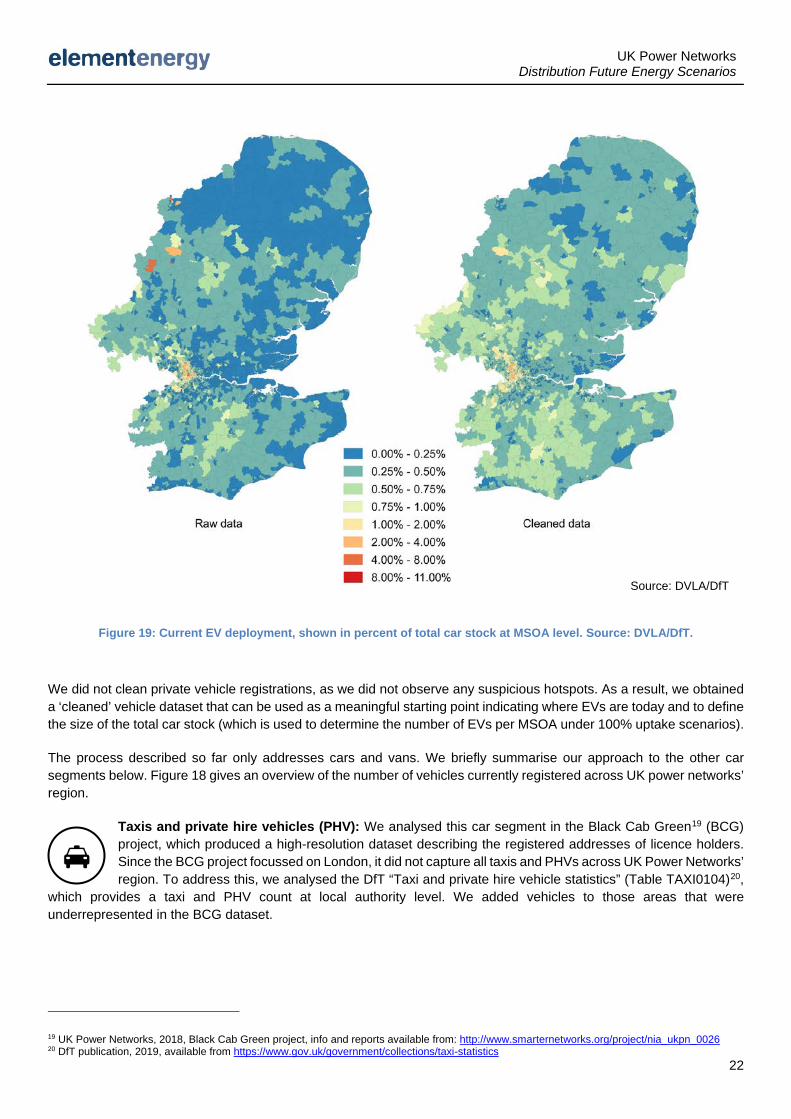
We then carried out data cleaning steps, as the DfT data reports hotspots of company cars. There are several instances of high company car registration counts at individual addresses e.g. a large company headquarters. However, the cars are only registered there, they are actually used elsewhere. This artificial concentration can be due to a large company headquarters, rental or leasing companies or dealerships. Such hotspots were identified in a bespoke analysis that considered the ratio between company and private cars within an MSOA (MSOAs with a ratio of company / private cars larger than 20% were filtered and re-distributed).
See Figure 19 for an illustration of hotspots observed in the raw data, and the impact of the company car hotspot cleaning.
17 DfT/DVLA provided a data excerpt, with postcode sector resolution of vehicles at the end of Q2 2019, which the car figure has been derived from. We derived the number of vans from an earlier DfT/DVLA excerpt from 2017 (MSOA resolution), as the more recent file did not resolve vans. The number of taxi/PHV and motorcycles has been defined with the help of public DfT/DVLA data at local authority level, licence count from the end of 2018. We consider the estimated fraction of each local authority that is served by UK Power Networks to derive number of vehicles. Motorcycle data is extracted from the DfT/DVLA table VEH0105, available from https://www.gov.uk/government/collections/vehicles-statistics. Taxi/PHV counts originate from the DfT/DVLA table TAXI0104, available from https://www.gov.uk/government/collections/taxi-statistics. In order to establish the number of HGV and buses, we analysed publicly accessible information on vehicle licence holders. We processed and cross-checked against public DfT/DVLA and TfL data. These vehicle counts have been captured at the end of 2019. 18 UK Power Networks and Element Energy, (2018), NIA project, Recharge the Future. Information available from https://innovation.ukpowernetworks.co.uk/projects/recharge-the-future and https://www.smarternetworks.org/project/nia_ukpn0028
Learning: Some regions, e.g. Peterborough, have been portrayed as “leading the way in electric car take-up” in the press. However, such findings can be skewed by bulk company car registrations at a single address.
Figure 18: Overview of the transport segments. Number of vehicles registered in UK Power Networks’ licence areas (Source: DfT/DVLA). Cars make up the most significant share of the overall transport sector.
UK Power Networks Distribution Future Energy Scenarios
22
Figure 19: Current EV deployment, shown in percent of total car stock at MSOA level. Source: DVLA/DfT.
We did not clean private vehicle registrations, as we did not observe any suspicious hotspots. As a result, we obtained a ‘cleaned’ vehicle dataset that can be used as a meaningful starting point indicating where EVs are today and to define the size of the total car stock (which is used to determine the number of EVs per MSOA under 100% uptake scenarios).
The process described so far only addresses cars and vans. We briefly summarise our approach to the other car segments below. Figure 18 gives an overview of the number of vehicles currently registered across UK power networks’ region.
Taxis and private hire vehicles (PHV): We analysed this car segment in the Black Cab Green19 (BCG) project, which produced a high-resolution dataset describing the registered addresses of licence holders. Since the BCG project focussed on London, it did not capture all taxis and PHVs across UK Power Networks’ region. To address this, we analysed the DfT “Taxi and private hire vehicle statistics” (Table TAXI0104)20,
which provides a taxi and PHV count at local authority level. We added vehicles to those areas that were underrepresented in the BCG dataset.
19 UK Power Networks, 2018, Black Cab Green project, info and reports available from: http://www.smarternetworks.org/project/nia_ukpn_0026 20 DfT publication, 2019, available from https://www.gov.uk/government/collections/taxi-statistics
Source: DVLA/DfT
UK Power Networks Distribution Future Energy Scenarios
23
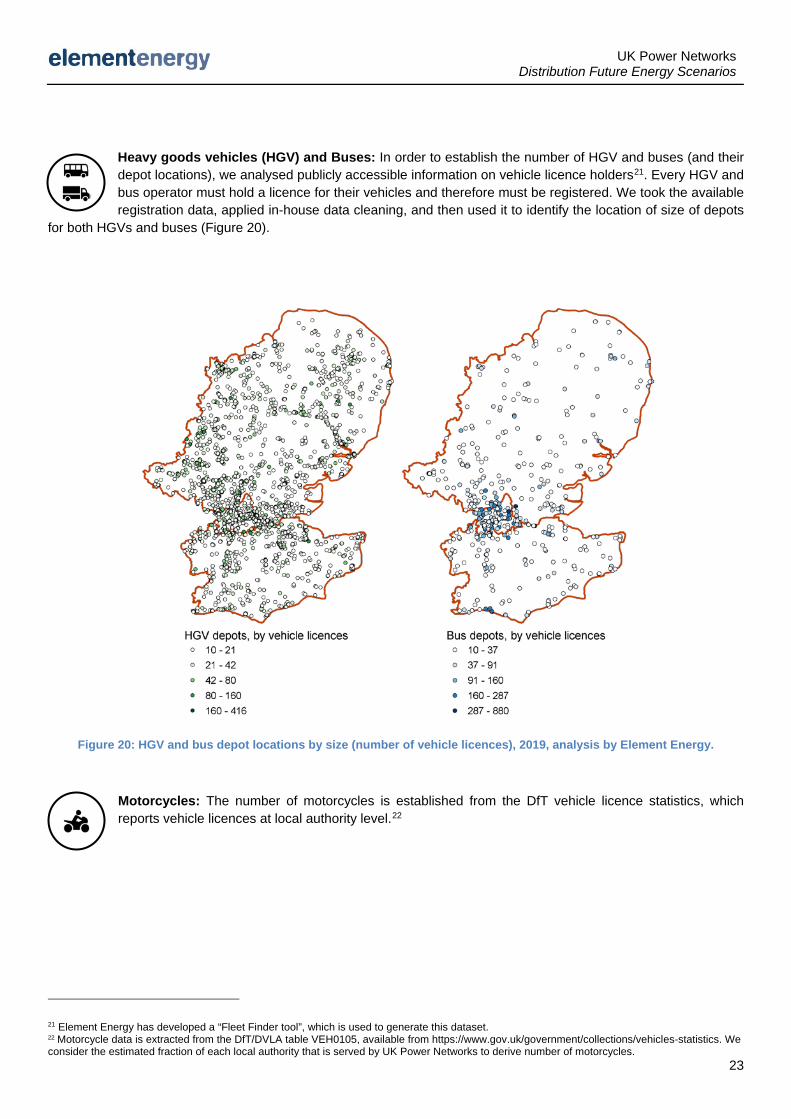
Heavy goods vehicles (HGV) and Buses: In order to establish the number of HGV and buses (and their depot locations), we analysed publicly accessible information on vehicle licence holders21. Every HGV and bus operator must hold a licence for their vehicles and therefore must be registered. We took the available registration data, applied in-house data cleaning, and then used it to identify the location of size of depots
for both HGVs and buses (Figure 20).
Figure 20: HGV and bus depot locations by size (number of vehicle licences), 2019, analysis by Element Energy.
Motorcycles: The number of motorcycles is established from the DfT vehicle licence statistics, which reports vehicle licences at local authority level.22
21 Element Energy has developed a “Fleet Finder tool”, which is used to generate this dataset. 22 Motorcycle data is extracted from the DfT/DVLA table VEH0105, available from https://www.gov.uk/government/collections/vehicles-statistics. We consider the estimated fraction of each local authority that is served by UK Power Networks to derive number of motorcycles.
UK Power Networks Distribution Future Energy Scenarios
24
3.2.2 Modelling future uptake scenarios Uptake scenarios present different outlooks on how the rate of electrification might develop in future years. Figure 18 shows the total vehicle potential for electrification; although this is also influenced by a potential future change in the vehicle stock size.
Cars and vans
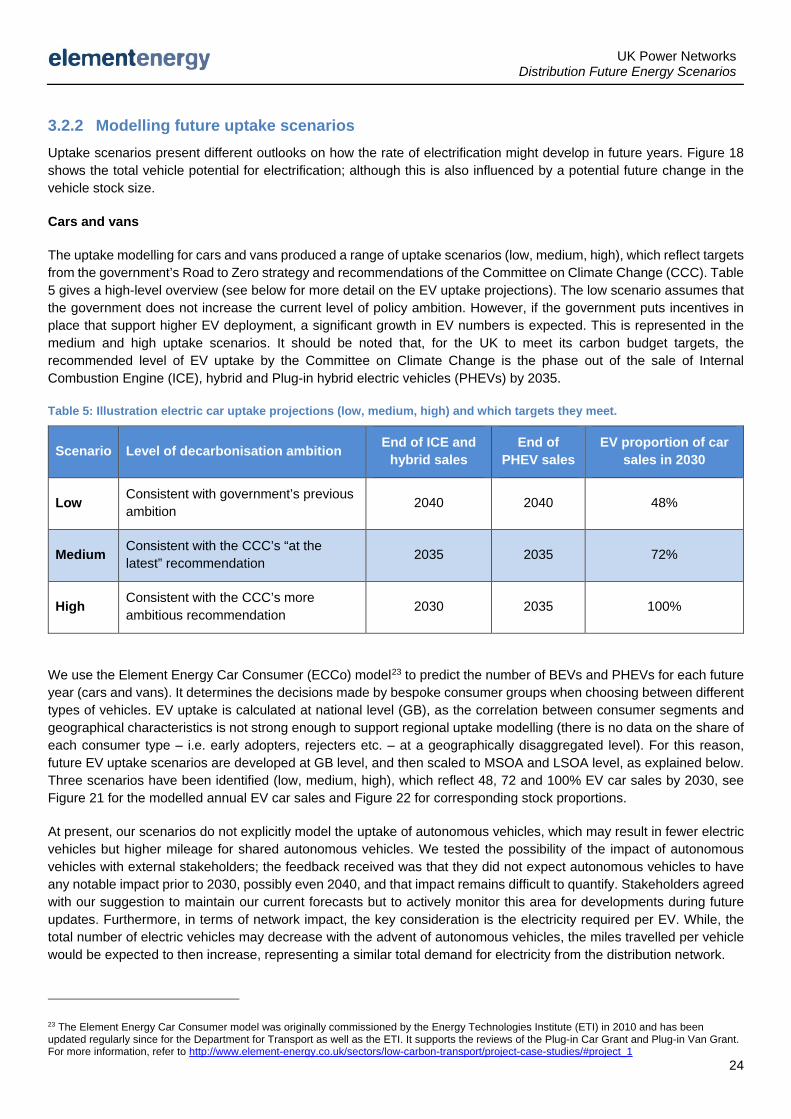
The uptake modelling for cars and vans produced a range of uptake scenarios (low, medium, high), which reflect targets from the government’s Road to Zero strategy and recommendations of the Committee on Climate Change (CCC). Table 5 gives a high-level overview (see below for more detail on the EV uptake projections). The low scenario assumes that the government does not increase the current level of policy ambition. However, if the government puts incentives in place that support higher EV deployment, a significant growth in EV numbers is expected. This is represented in the medium and high uptake scenarios. It should be noted that, for the UK to meet its carbon budget targets, the recommended level of EV uptake by the Committee on Climate Change is the phase out of the sale of Internal Combustion Engine (ICE), hybrid and Plug-in hybrid electric vehicles (PHEVs) by 2035.
Table 5: Illustration electric car uptake projections (low, medium, high) and which targets they meet.
Scenario Level of decarbonisation ambition End of ICE and hybrid sales
End of PHEV sales
EV proportion of car sales in 2030
Low Consistent with government’s previous ambition 2040 2040 48%
Medium Consistent with the CCC’s “at the latest” recommendation 2035 2035 72%
High Consistent with the CCC’s more ambitious recommendation 2030 2035 100%
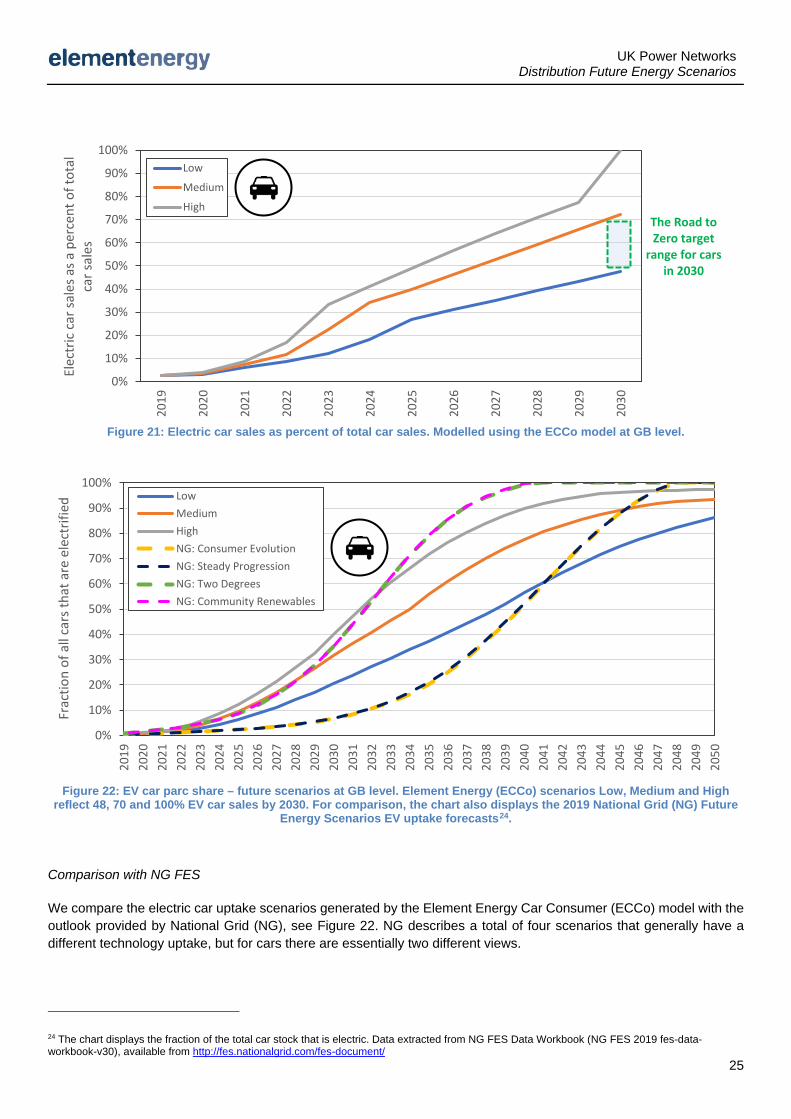
We use the Element Energy Car Consumer (ECCo) model23 to predict the number of BEVs and PHEVs for each future year (cars and vans). It determines the decisions made by bespoke consumer groups when choosing between different types of vehicles. EV uptake is calculated at national level (GB), as the correlation between consumer segments and geographical characteristics is not strong enough to support regional uptake modelling (there is no data on the share of each consumer type – i.e. early adopters, rejecters etc. – at a geographically disaggregated level). For this reason, future EV uptake scenarios are developed at GB level, and then scaled to MSOA and LSOA level, as explained below. Three scenarios have been identified (low, medium, high), which reflect 48, 72 and 100% EV car sales by 2030, see Figure 21 for the modelled annual EV car sales and Figure 22 for corresponding stock proportions.
At present, our scenarios do not explicitly model the uptake of autonomous vehicles, which may result in fewer electric vehicles but higher mileage for shared autonomous vehicles. We tested the possibility of the impact of autonomous vehicles with external stakeholders; the feedback received was that they did not expect autonomous vehicles to have any notable impact prior to 2030, possibly even 2040, and that impact remains difficult to quantify. Stakeholders agreed with our suggestion to maintain our current forecasts but to actively monitor this area for developments during future updates. Furthermore, in terms of network impact, the key consideration is the electricity required per EV. While, the total number of electric vehicles may decrease with the advent of autonomous vehicles, the miles travelled per vehicle would be expected to then increase, representing a similar total demand for electricity from the distribution network.
23 The Element Energy Car Consumer model was originally commissioned by the Energy Technologies Institute (ETI) in 2010 and has been updated regularly since for the Department for Transport as well as the ETI. It supports the reviews of the Plug-in Car Grant and Plug-in Van Grant. For more information, refer to http://www.element-energy.co.uk/sectors/low-carbon-transport/project-case-studies/#project_1
UK Power Networks Distribution Future Energy Scenarios
25
Figure 21: Electric car sales as percent of total car sales. Modelled using the ECCo model at GB level.
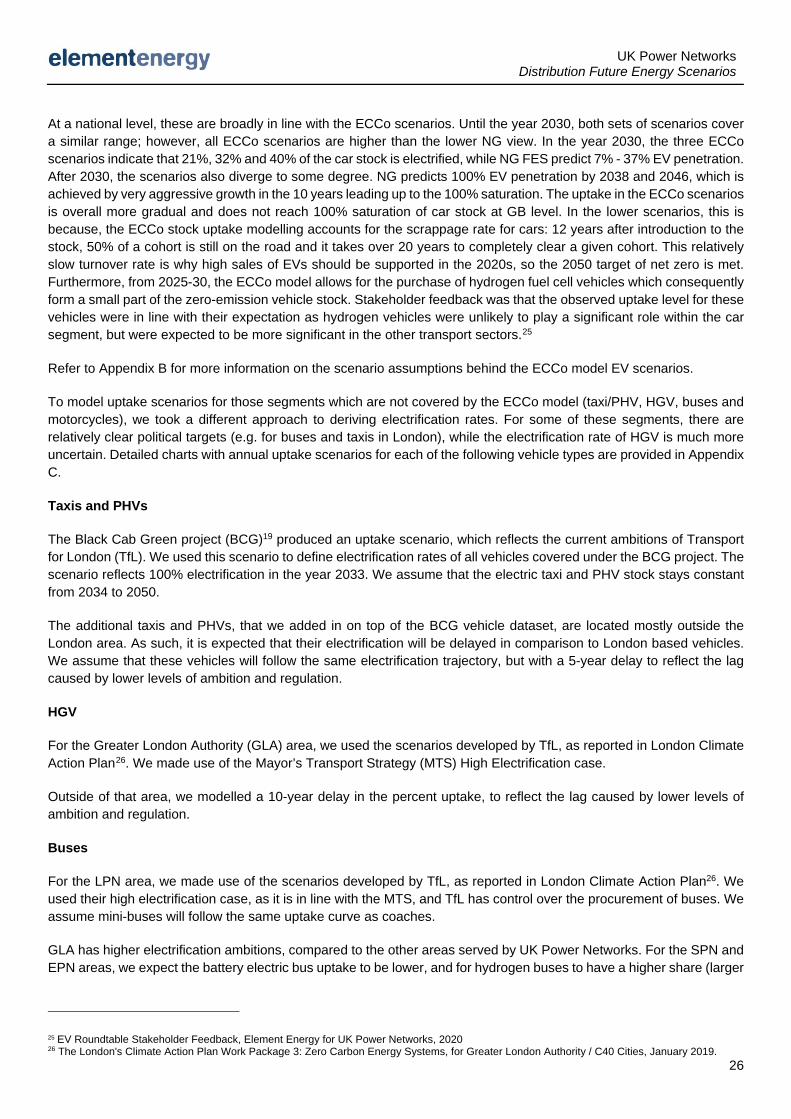
Figure 22: EV car parc share – future scenarios at GB level. Element Energy (ECCo) scenarios Low, Medium and High reflect 48, 70 and 100% EV car sales by 2030. For comparison, the chart also displays the 2019 National Grid (NG) Future
Energy Scenarios EV uptake forecasts24.
Comparison with NG FES
We compare the electric car uptake scenarios generated by the Element Energy Car Consumer (ECCo) model with the outlook provided by National Grid (NG), see Figure 22. NG describes a total of four scenarios that generally have a different technology uptake, but for cars there are essentially two different views.
24 The chart displays the fraction of the total car stock that is electric. Data extracted from NG FES Data Workbook (NG FES 2019 fes-data-workbook-v30), available from http://fes.nationalgrid.com/fes-document/
0%
10%
20%
30%
40%
50%
60%
70%
80%
90%
100%20
19
2020
2021
2022
2023
2024
2025
2026
2027
2028
2029
2030
Elec
tric
car
sale
s as a
per
cent
of t
otal
ca
r sal
es
Low
Medium
HighThe Road to Zero target
range for cars in 2030
0%
10%
20%
30%
40%
50%
60%
70%
80%
90%
100%
2019
2020
2021
2022
2023
2024
2025
2026
2027
2028
2029
2030
2031
2032
2033
2034
2035
2036
2037
2038
2039
2040
2041
2042
2043
2044
2045
2046
2047
2048
2049
2050
Frac
tion
of a
ll ca
rs th
at a
re e
lect
rifie
d LowMediumHighNG: Consumer EvolutionNG: Steady ProgressionNG: Two DegreesNG: Community Renewables
UK Power Networks Distribution Future Energy Scenarios
26
At a national level, these are broadly in line with the ECCo scenarios. Until the year 2030, both sets of scenarios cover a similar range; however, all ECCo scenarios are higher than the lower NG view. In the year 2030, the three ECCo scenarios indicate that 21%, 32% and 40% of the car stock is electrified, while NG FES predict 7% - 37% EV penetration. After 2030, the scenarios also diverge to some degree. NG predicts 100% EV penetration by 2038 and 2046, which is achieved by very aggressive growth in the 10 years leading up to the 100% saturation. The uptake in the ECCo scenarios is overall more gradual and does not reach 100% saturation of car stock at GB level. In the lower scenarios, this is because, the ECCo stock uptake modelling accounts for the scrappage rate for cars: 12 years after introduction to the stock, 50% of a cohort is still on the road and it takes over 20 years to completely clear a given cohort. This relatively slow turnover rate is why high sales of EVs should be supported in the 2020s, so the 2050 target of net zero is met. Furthermore, from 2025-30, the ECCo model allows for the purchase of hydrogen fuel cell vehicles which consequently form a small part of the zero-emission vehicle stock. Stakeholder feedback was that the observed uptake level for these vehicles were in line with their expectation as hydrogen vehicles were unlikely to play a significant role within the car segment, but were expected to be more significant in the other transport sectors.25
Refer to Appendix B for more information on the scenario assumptions behind the ECCo model EV scenarios.
To model uptake scenarios for those segments which are not covered by the ECCo model (taxi/PHV, HGV, buses and motorcycles), we took a different approach to deriving electrification rates. For some of these segments, there are relatively clear political targets (e.g. for buses and taxis in London), while the electrification rate of HGV is much more uncertain. Detailed charts with annual uptake scenarios for each of the following vehicle types are provided in Appendix C.
Taxis and PHVs
The Black Cab Green project (BCG)19 produced an uptake scenario, which reflects the current ambitions of Transport for London (TfL). We used this scenario to define electrification rates of all vehicles covered under the BCG project. The scenario reflects 100% electrification in the year 2033. We assume that the electric taxi and PHV stock stays constant from 2034 to 2050.
The additional taxis and PHVs, that we added in on top of the BCG vehicle dataset, are located mostly outside the London area. As such, it is expected that their electrification will be delayed in comparison to London based vehicles. We assume that these vehicles will follow the same electrification trajectory, but with a 5-year delay to reflect the lag caused by lower levels of ambition and regulation.
HGV
For the Greater London Authority (GLA) area, we used the scenarios developed by TfL, as reported in London Climate Action Plan26. We made use of the Mayor’s Transport Strategy (MTS) High Electrification case.
Outside of that area, we modelled a 10-year delay in the percent uptake, to reflect the lag caused by lower levels of ambition and regulation.
Buses
For the LPN area, we made use of the scenarios developed by TfL, as reported in London Climate Action Plan26. We used their high electrification case, as it is in line with the MTS, and TfL has control over the procurement of buses. We assume mini-buses will follow the same uptake curve as coaches.
GLA has higher electrification ambitions, compared to the other areas served by UK Power Networks. For the SPN and EPN areas, we expect the battery electric bus uptake to be lower, and for hydrogen buses to have a higher share (larger
25 EV Roundtable Stakeholder Feedback, Element Energy for UK Power Networks, 2020 26 The London's Climate Action Plan Work Package 3: Zero Carbon Energy Systems, for Greater London Authority / C40 Cities, January 2019.
UK Power Networks Distribution Future Energy Scenarios
27
distances required). We will track progress of other plans (governments, stakeholders) in future annual updates to ensure this aspect is reflected in the scenarios.
For buses, we adopt the scenario we originally developed for the West Yorkshire Combined Authority in 2019, in consultation with bus operators. Coaches and minibuses lag in the uptake, to capture the fact they are harder to electrify.
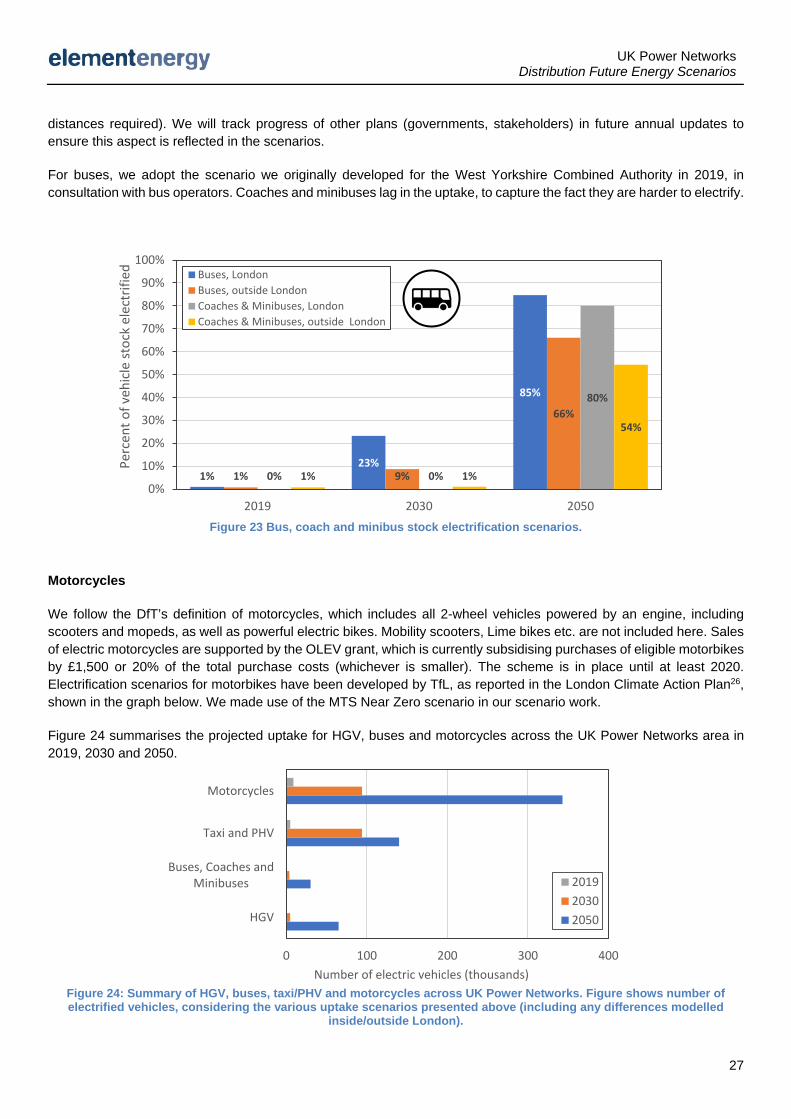
Figure 23 Bus, coach and minibus stock electrification scenarios.
Motorcycles
We follow the DfT’s definition of motorcycles, which includes all 2-wheel vehicles powered by an engine, including scooters and mopeds, as well as powerful electric bikes. Mobility scooters, Lime bikes etc. are not included here. Sales of electric motorcycles are supported by the OLEV grant, which is currently subsidising purchases of eligible motorbikes by £1,500 or 20% of the total purchase costs (whichever is smaller). The scheme is in place until at least 2020. Electrification scenarios for motorbikes have been developed by TfL, as reported in the London Climate Action Plan26, shown in the graph below. We made use of the MTS Near Zero scenario in our scenario work.
Figure 24 summarises the projected uptake for HGV, buses and motorcycles across the UK Power Networks area in 2019, 2030 and 2050.
Figure 24: Summary of HGV, buses, taxi/PHV and motorcycles across UK Power Networks. Figure shows number of electrified vehicles, considering the various uptake scenarios presented above (including any differences modelled
inside/outside London).
1%23%
85%
1% 9%
66%
0% 0%
80%
1% 1%
54%
0%
10%
20%
30%
40%
50%
60%
70%
80%
90%
100%
2019 2030 2050
Perc
ent o
f veh
icle
stoc
k el
ectr
ified Buses, London
Buses, outside LondonCoaches & Minibuses, LondonCoaches & Minibuses, outside London
0 100 200 300 400
HGV
Buses, Coaches andMinibuses
Taxi and PHV
Motorcycles
Number of electric vehicles (thousands)
201920302050
UK Power Networks Distribution Future Energy Scenarios
28
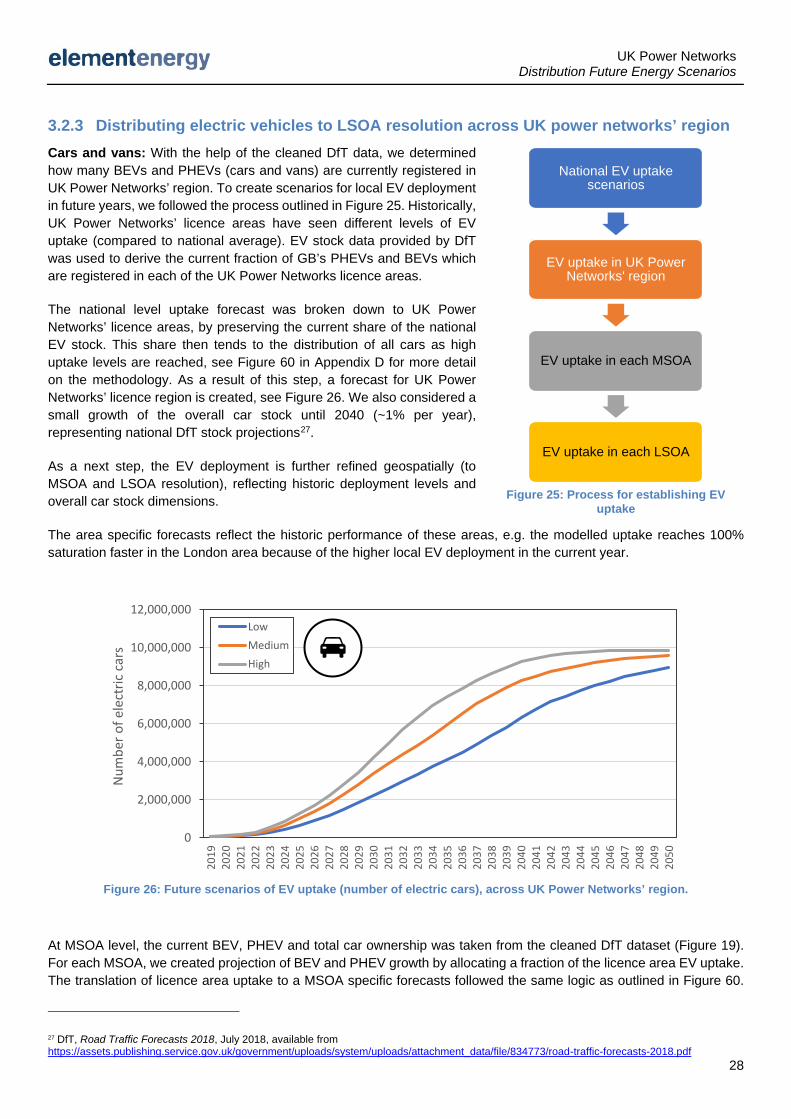
3.2.3 Distributing electric vehicles to LSOA resolution across UK power networks’ region Cars and vans: With the help of the cleaned DfT data, we determined how many BEVs and PHEVs (cars and vans) are currently registered in UK Power Networks’ region. To create scenarios for local EV deployment in future years, we followed the process outlined in Figure 25. Historically, UK Power Networks’ licence areas have seen different levels of EV uptake (compared to national average). EV stock data provided by DfT was used to derive the current fraction of GB’s PHEVs and BEVs which are registered in each of the UK Power Networks licence areas.
The national level uptake forecast was broken down to UK Power Networks’ licence areas, by preserving the current share of the national EV stock. This share then tends to the distribution of all cars as high uptake levels are reached, see Figure 60 in Appendix D for more detail on the methodology. As a result of this step, a forecast for UK Power Networks’ licence region is created, see Figure 26. We also considered a small growth of the overall car stock until 2040 (~1% per year), representing national DfT stock projections27.
As a next step, the EV deployment is further refined geospatially (to MSOA and LSOA resolution), reflecting historic deployment levels and overall car stock dimensions.
The area specific forecasts reflect the historic performance of these areas, e.g. the modelled uptake reaches 100% saturation faster in the London area because of the higher local EV deployment in the current year.
Figure 26: Future scenarios of EV uptake (number of electric cars), across UK Power Networks’ region.
At MSOA level, the current BEV, PHEV and total car ownership was taken from the cleaned DfT dataset (Figure 19). For each MSOA, we created projection of BEV and PHEV growth by allocating a fraction of the licence area EV uptake. The translation of licence area uptake to a MSOA specific forecasts followed the same logic as outlined in Figure 60.
27 DfT, Road Traffic Forecasts 2018, July 2018, available from https://assets.publishing.service.gov.uk/government/uploads/system/uploads/attachment_data/file/834773/road-traffic-forecasts-2018.pdf
National EV uptake scenarios
EV uptake in UK Power Networks' region
EV uptake in each MSOA
EV uptake in each LSOA
Figure 25: Process for establishing EV uptake
0
2,000,000
4,000,000
6,000,000
8,000,000
10,000,000
12,000,000
2019
2020
2021
2022
2023
2024
2025
2026
2027
2028
2029
2030
2031
2032
2033
2034
2035
2036
2037
2038
2039
2040
2041
2042
2043
2044
2045
2046
2047
2048
2049
2050
Num
ber o
f ele
ctric
car
s
LowMediumHigh
UK Power Networks Distribution Future Energy Scenarios
29
An MSOA that has historically received a high fraction of the overall GB EV deployment continues to receive above average shares of the future EV uptake until the “early adopter market” is saturated. Afterwards, any new EVs are distributed according to the total car stock distribution (which reflects mass market conditions).
Finally, we distributed the EV stock within each MSOA across all contained LSOAs. This is done with the help of the UK Power Networks network topology information, which describes the number and location of domestic customers. We also considered the building type characteristics within each LSOA (e.g. areas that consist mainly of flats likely have a lower car density compared to detached houses). We allocated EVs to LSOAs by distributing the MSOA uptake figures in proportion to the domestic customer count and dwelling properties.
For the other transport segments (taxis/PHV, HGV, buses and motorcycles), the regional disaggregation of current and future deployment follows a different methodology, due to the different data availability:
Taxis and PHVs: The Black Cab Green project created a dataset with a detailed licence holder distribution. This data is aggregated to LSOA level. Furthermore, additional taxis/PHVs are added into the dataset (in those local authorities that were under-represented in the BCG project (see Section 3.2.1 above)). The data defined at local authority level is disaggregated to MSOAs in proportion to the total MSOA car stock. Then, the taxi/PHV count is further disaggregated across LSOAs according to the domestic customer counts.
HGVs and buses: HGV and buses are assigned to the depot locations identified above (see Figure 20). The depots are essentially point coordinates. EV are apportioned according to the number of licences assigned to each depot.
Motorcycles: The number of motorcycles (defined at local authority level) is distributed across MSOAs in proportion to the total car stock. Then, to disaggregate further to LSOA level, the domestic customer count is considered.
As there is currently not sufficient information available on where these vehicle types will be electrified first (in contrast to cars and vans), a geo-specific approach to varying uptake within each licence area is currently not feasible. We do, however, reflect that certain vehicle types are electrified faster in London, which is reflected in the uptake scenarios (for taxis/PHV, HGV and buses).
UK Power Networks Distribution Future Energy Scenarios
30
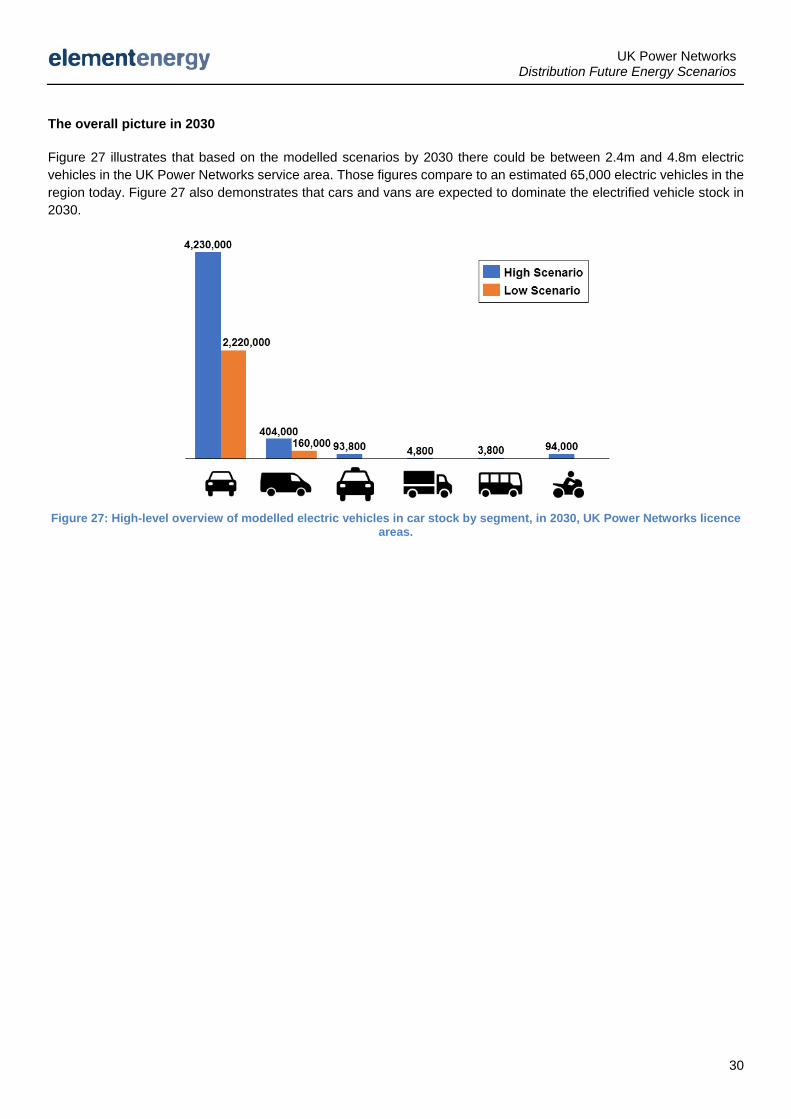
The overall picture in 2030
Figure 27 illustrates that based on the modelled scenarios by 2030 there could be between 2.4m and 4.8m electric vehicles in the UK Power Networks service area. Those figures compare to an estimated 65,000 electric vehicles in the region today. Figure 27 also demonstrates that cars and vans are expected to dominate the electrified vehicle stock in 2030.
Figure 27: High-level overview of modelled electric vehicles in car stock by segment, in 2030, UK Power Networks licence areas.
UK Power Networks Strategic Forecasting Distribution Future Energy Scenarios
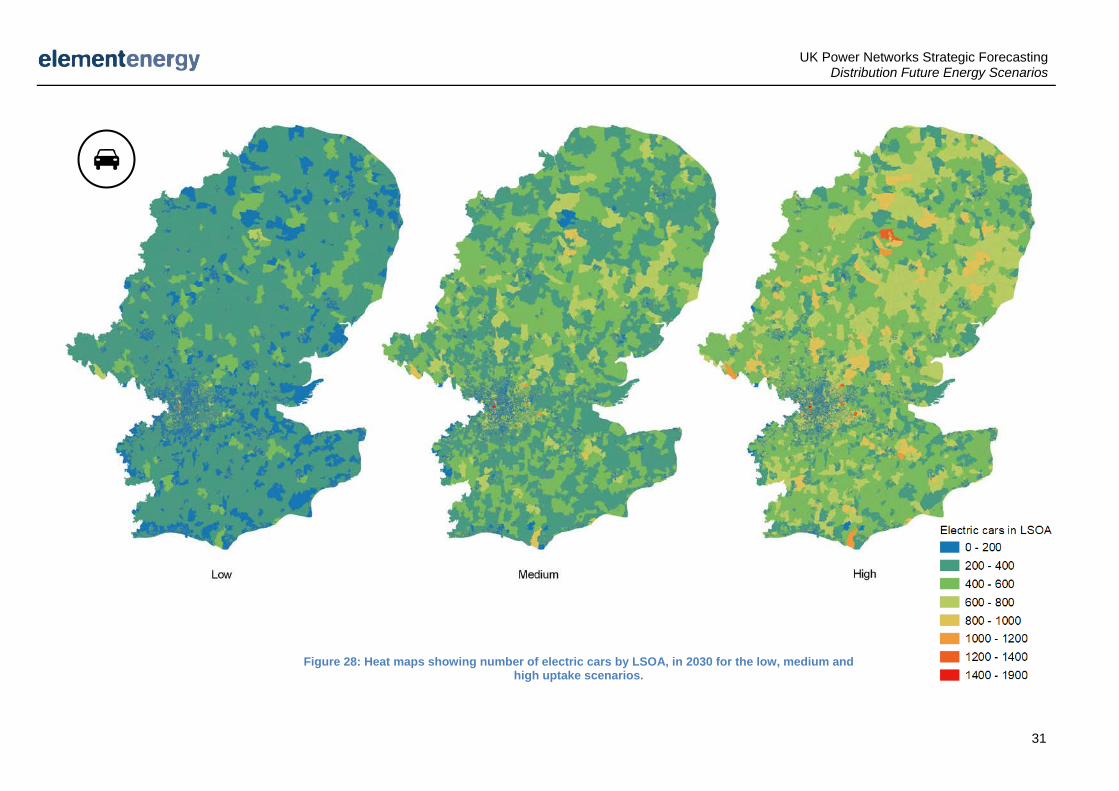
31
Figure 28: Heat maps showing number of electric cars by LSOA, in 2030 for the low, medium and high uptake scenarios.

UK Power Networks Distribution Future Energy Scenarios
32
3.3 Decarbonised heating There are two main pathways to decarbonise heat, each relies on varying levels of electrification and gas decarbonisation. We describe the key themes in each of these pathways in Figure 29.
Figure 29: Heat pathway diagram.
We developed scenarios for the following key drivers of the transition to low carbon heating:
- Thermal efficiency; - Heating technologies; and - District heat.
For each driver, we have generated three to four scenarios that represent different levels of ambition of uptake, generally: Low, Medium and High, with a fourth variant for heating technologies.
The High electrification and Decarbonised gas scenarios represent two extremes of the future; in reality, the pathway for heat decarbonisation in the UK could be a mix of these components, with different regions opting for different technological solutions. In section 4, we discuss the most likely mix in UK Power Networks’ region via the concept of ‘Scenario Worlds’. This discussion has been informed by the views of our stakeholders as well as our expert judgement.
3.3.1 Modelling approach Our modelling approach to determine the uptake of each driver was bottom-up. First, we developed two stock models of buildings in UK Power Networks’ three licence areas:
In the stock model, which is resolved to LSOA-level, we consider the Domestic and I&C (Industrial & Commercial) sectors separately. The stock model formed the basis for modelling the uptake of each of the key drivers for decarbonised heating. The modelling approach for each is presented below:
UK Power Networks Distribution Future Energy Scenarios
33
Thermal energy efficiency in the domestic sector – This work drew on our recent analysis28 for the Committee on Climate Change which contributed to the CCC’s Net Zero report29. We tailored the UK-wide building stock model created for the CCC to UK Power Networks’ region. We then developed a comprehensive list of thermal energy efficiency measures for each building archetype, including components such as loft, wall and floor insulation, as well as window glazing. We generated three packages for energy efficiency based on the cost-effectiveness of each measure for each building archetype, taking into account the capital cost to install the measure as well as fuel cost savings over its lifetime. We based the deployment trajectories for each package on our work for the National Infrastructure Commission30, and also adapted them based on the views of UK Power Networks’ stakeholders who were consulted as part of this work.
Thermal energy efficiency in the I&C sector – We estimated the technical potential for thermal energy efficiency in the I&C sector from the Department for Business Energy and Industrial Strategy’s (BEIS’s) Building Energy Efficiency Survey (BEES)31. We considered thermal efficiency measures such as building fabric and instrumentation & control. As in the Domestic sector, we broke down measures by cost-effectiveness and attributed them to different energy efficiency packages accordingly. This process was also informed by our prior study for the National Infrastructure Commission and tailored to reflect the views of UK Power Networks’ stakeholders.
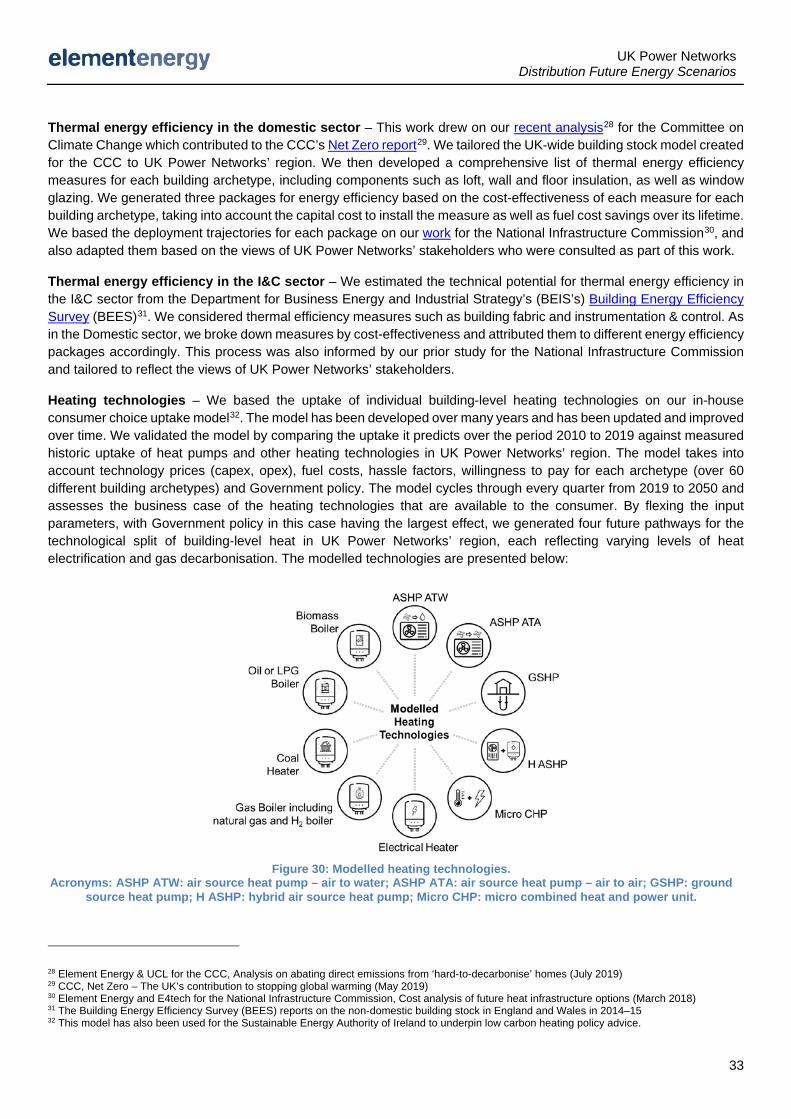
Heating technologies – We based the uptake of individual building-level heating technologies on our in-house consumer choice uptake model32. The model has been developed over many years and has been updated and improved over time. We validated the model by comparing the uptake it predicts over the period 2010 to 2019 against measured historic uptake of heat pumps and other heating technologies in UK Power Networks’ region. The model takes into account technology prices (capex, opex), fuel costs, hassle factors, willingness to pay for each archetype (over 60 different building archetypes) and Government policy. The model cycles through every quarter from 2019 to 2050 and assesses the business case of the heating technologies that are available to the consumer. By flexing the input parameters, with Government policy in this case having the largest effect, we generated four future pathways for the technological split of building-level heat in UK Power Networks’ region, each reflecting varying levels of heat electrification and gas decarbonisation. The modelled technologies are presented below:
28 Element Energy & UCL for the CCC, Analysis on abating direct emissions from ‘hard-to-decarbonise’ homes (July 2019) 29 CCC, Net Zero – The UK’s contribution to stopping global warming (May 2019) 30 Element Energy and E4tech for the National Infrastructure Commission, Cost analysis of future heat infrastructure options (March 2018) 31 The Building Energy Efficiency Survey (BEES) reports on the non-domestic building stock in England and Wales in 2014–15 32 This model has also been used for the Sustainable Energy Authority of Ireland to underpin low carbon heating policy advice.
Figure 30: Modelled heating technologies. Acronyms: ASHP ATW: air source heat pump – air to water; ASHP ATA: air source heat pump – air to air; GSHP: ground
source heat pump; H ASHP: hybrid air source heat pump; Micro CHP: micro combined heat and power unit.
UK Power Networks Distribution Future Energy Scenarios
34
District heat (DH) – Our approach for modelling the uptake of DH is closely aligned to the approach used in our 2018 study for London’s Climate Action Plan commissioned by the Greater London Authority (GLA) and C40 Cities33. In the work for the GLA, areas with higher heat demand density were assumed to be better suited to district heating. We first estimated the heat density of UK Power Networks’ region at LSOA-level resolution using gas demand as a proxy for heat demand, making the assumption that the gas grid serves the most heat dense areas. We tiered the heat demand density based on thresholds outlined in the GLA work for LSOAs inside the GLA, and we selected lower thresholds for areas outside the GLA. These tiered thresholds formed the basis of the scenario development by allowing heat networks to be constructed in LSOAs with lower heat demand for the scenarios that promote a higher level of heat network deployment. Finally, we assumed that the connection fraction of buildings connected to heat networks increases at different rates depending on the scenario; the rates are consistent with those used in our study for the GLA.
In sections 3.3.2 to 3.3.4 we consider each of these drivers separately. We describe the main assumptions that define each scenario and present the uptake graphs.
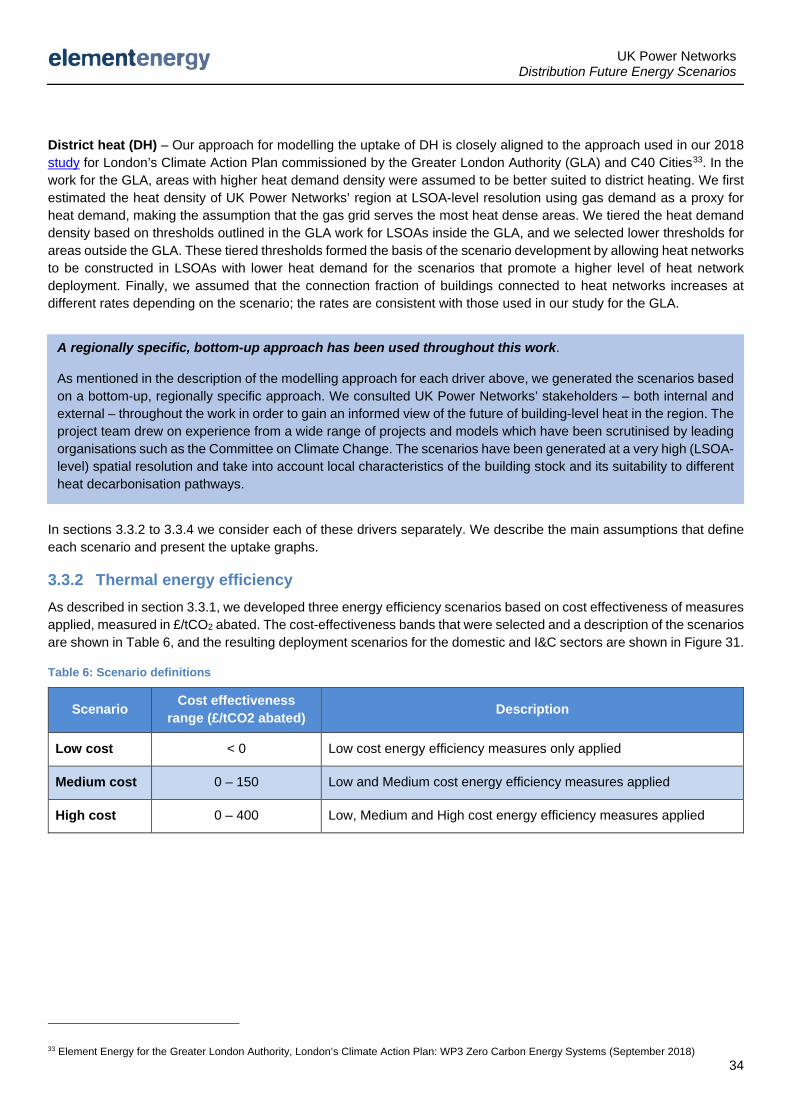
3.3.2 Thermal energy efficiency As described in section 3.3.1, we developed three energy efficiency scenarios based on cost effectiveness of measures applied, measured in £/tCO2 abated. The cost-effectiveness bands that were selected and a description of the scenarios are shown in Table 6, and the resulting deployment scenarios for the domestic and I&C sectors are shown in Figure 31.
Table 6: Scenario definitions
Scenario Cost effectiveness range (£/tCO2 abated) Description
Low cost < 0 Low cost energy efficiency measures only applied
Medium cost 0 – 150 Low and Medium cost energy efficiency measures applied
High cost 0 – 400 Low, Medium and High cost energy efficiency measures applied
33 Element Energy for the Greater London Authority, London’s Climate Action Plan: WP3 Zero Carbon Energy Systems (September 2018)
A regionally specific, bottom-up approach has been used throughout this work.
As mentioned in the description of the modelling approach for each driver above, we generated the scenarios based on a bottom-up, regionally specific approach. We consulted UK Power Networks’ stakeholders – both internal and external – throughout the work in order to gain an informed view of the future of building-level heat in the region. The project team drew on experience from a wide range of projects and models which have been scrutinised by leading organisations such as the Committee on Climate Change. The scenarios have been generated at a very high (LSOA-level) spatial resolution and take into account local characteristics of the building stock and its suitability to different heat decarbonisation pathways.
UK Power Networks Distribution Future Energy Scenarios
35
When we engaged our stakeholders, they suggested that the deepest energy efficiency measures may be slow to implement, particularly in hard to decarbonise homes. However, they felt that measures could be rolled out relatively quickly in the commercial sector. Based on this feedback, we reduced the rate of rollout of energy efficiency in the High scenario (domestic sector only).
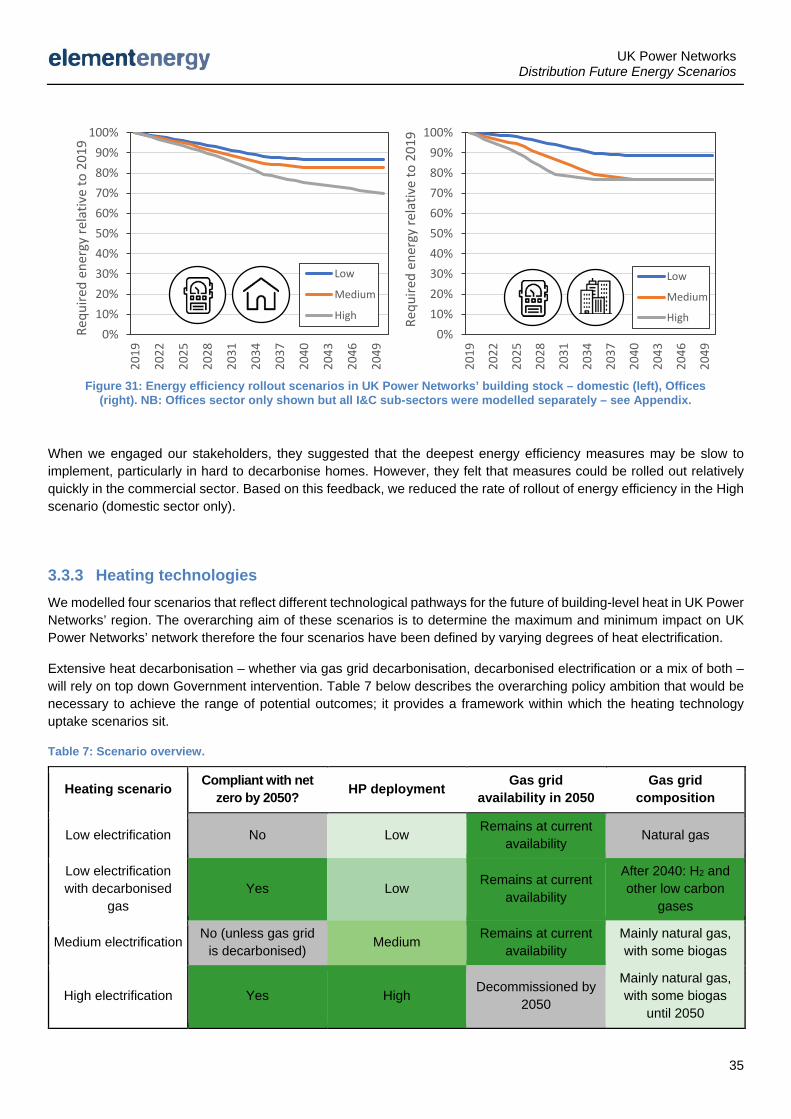
3.3.3 Heating technologies We modelled four scenarios that reflect different technological pathways for the future of building-level heat in UK Power Networks’ region. The overarching aim of these scenarios is to determine the maximum and minimum impact on UK Power Networks’ network therefore the four scenarios have been defined by varying degrees of heat electrification.
Extensive heat decarbonisation – whether via gas grid decarbonisation, decarbonised electrification or a mix of both – will rely on top down Government intervention. Table 7 below describes the overarching policy ambition that would be necessary to achieve the range of potential outcomes; it provides a framework within which the heating technology uptake scenarios sit.
Table 7: Scenario overview.
Heating scenario Compliant with net zero by 2050? HP deployment Gas grid
availability in 2050 Gas grid
composition
Low electrification No Low Remains at current availability Natural gas
Low electrification with decarbonised
gas Yes Low Remains at current
availability
After 2040: H2 and other low carbon
gases
Medium electrification No (unless gas grid is decarbonised) Medium Remains at current
availability Mainly natural gas, with some biogas
High electrification Yes High Decommissioned by 2050
Mainly natural gas, with some biogas
until 2050
0%10%20%30%40%50%60%70%80%90%
100%20
19
2022
2025
2028
2031
2034
2037
2040
2043
2046
2049
Requ
ired
ener
gy re
lativ
e to
201
9
Low
Medium
High
0%10%20%30%40%50%60%70%80%90%
100%
2019
2022
2025
2028
2031
2034
2037
2040
2043
2046
2049
Requ
ired
ener
gy re
lativ
e to
201
9
Low
Medium
High
Figure 31: Energy efficiency rollout scenarios in UK Power Networks’ building stock – domestic (left), Offices (right). NB: Offices sector only shown but all I&C sub-sectors were modelled separately – see Appendix.
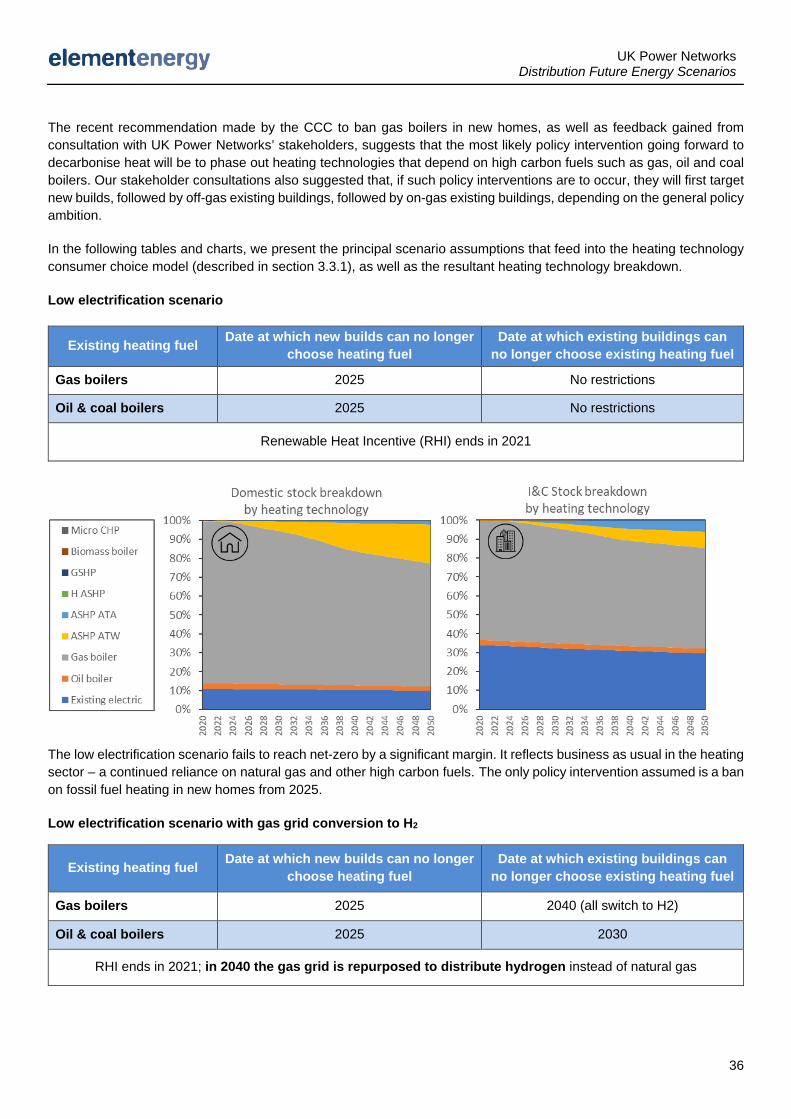
UK Power Networks Distribution Future Energy Scenarios
36
The recent recommendation made by the CCC to ban gas boilers in new homes, as well as feedback gained from consultation with UK Power Networks’ stakeholders, suggests that the most likely policy intervention going forward to decarbonise heat will be to phase out heating technologies that depend on high carbon fuels such as gas, oil and coal boilers. Our stakeholder consultations also suggested that, if such policy interventions are to occur, they will first target new builds, followed by off-gas existing buildings, followed by on-gas existing buildings, depending on the general policy ambition.
In the following tables and charts, we present the principal scenario assumptions that feed into the heating technology consumer choice model (described in section 3.3.1), as well as the resultant heating technology breakdown.
Low electrification scenario
Existing heating fuel Date at which new builds can no longer choose heating fuel
Date at which existing buildings can no longer choose existing heating fuel
Gas boilers 2025 No restrictions
Oil & coal boilers 2025 No restrictions
Renewable Heat Incentive (RHI) ends in 2021
The low electrification scenario fails to reach net-zero by a significant margin. It reflects business as usual in the heating sector – a continued reliance on natural gas and other high carbon fuels. The only policy intervention assumed is a ban on fossil fuel heating in new homes from 2025.
Low electrification scenario with gas grid conversion to H2
Existing heating fuel Date at which new builds can no longer choose heating fuel
Date at which existing buildings can no longer choose existing heating fuel
Gas boilers 2025 2040 (all switch to H2)
Oil & coal boilers 2025 2030
RHI ends in 2021; in 2040 the gas grid is repurposed to distribute hydrogen instead of natural gas
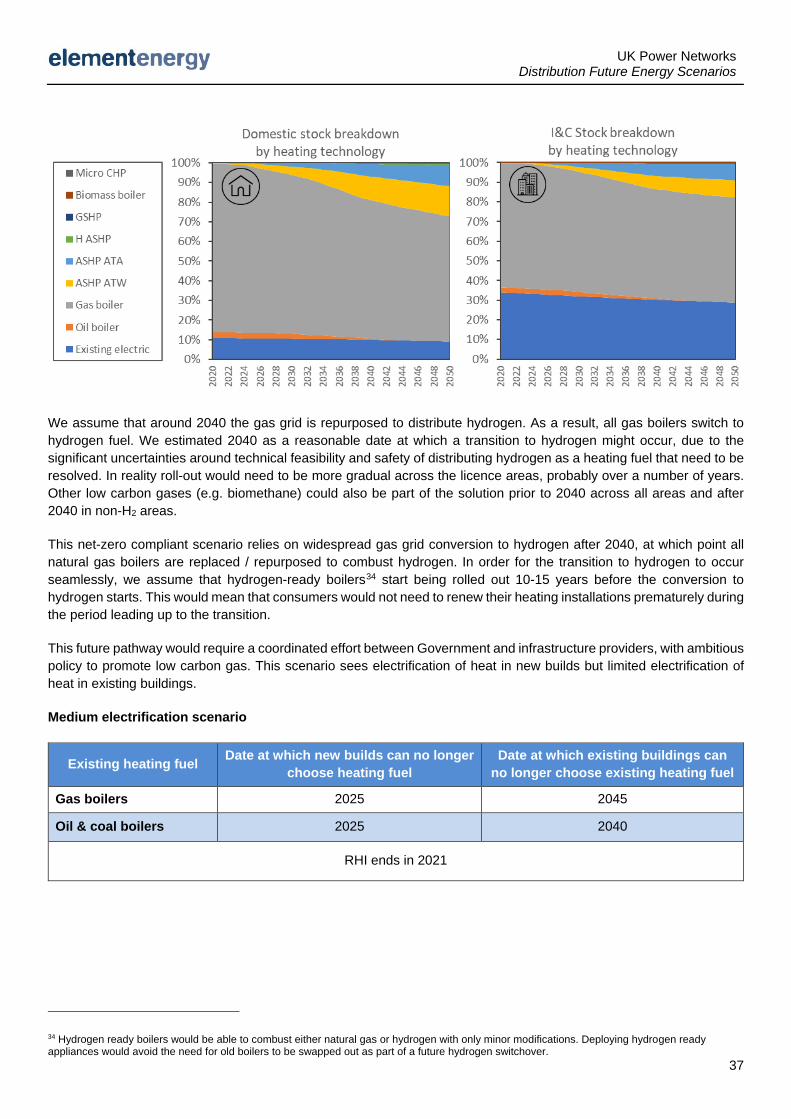
UK Power Networks Distribution Future Energy Scenarios
37
We assume that around 2040 the gas grid is repurposed to distribute hydrogen. As a result, all gas boilers switch to hydrogen fuel. We estimated 2040 as a reasonable date at which a transition to hydrogen might occur, due to the significant uncertainties around technical feasibility and safety of distributing hydrogen as a heating fuel that need to be resolved. In reality roll-out would need to be more gradual across the licence areas, probably over a number of years. Other low carbon gases (e.g. biomethane) could also be part of the solution prior to 2040 across all areas and after 2040 in non-H2 areas.
This net-zero compliant scenario relies on widespread gas grid conversion to hydrogen after 2040, at which point all natural gas boilers are replaced / repurposed to combust hydrogen. In order for the transition to hydrogen to occur seamlessly, we assume that hydrogen-ready boilers34 start being rolled out 10-15 years before the conversion to hydrogen starts. This would mean that consumers would not need to renew their heating installations prematurely during the period leading up to the transition.
This future pathway would require a coordinated effort between Government and infrastructure providers, with ambitious policy to promote low carbon gas. This scenario sees electrification of heat in new builds but limited electrification of heat in existing buildings.
Medium electrification scenario
Existing heating fuel Date at which new builds can no longer choose heating fuel
Date at which existing buildings can no longer choose existing heating fuel
Gas boilers 2025 2045
Oil & coal boilers 2025 2040
RHI ends in 2021
34 Hydrogen ready boilers would be able to combust either natural gas or hydrogen with only minor modifications. Deploying hydrogen ready appliances would avoid the need for old boilers to be swapped out as part of a future hydrogen switchover.
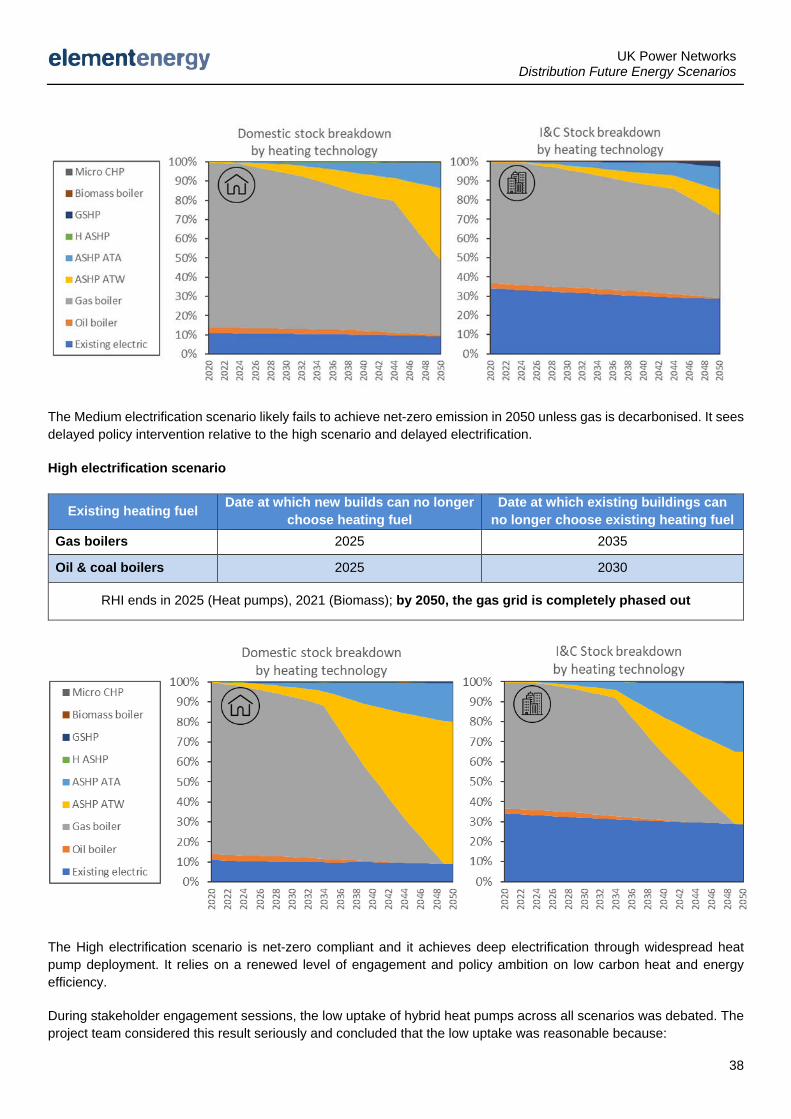
UK Power Networks Distribution Future Energy Scenarios
38
The Medium electrification scenario likely fails to achieve net-zero emission in 2050 unless gas is decarbonised. It sees delayed policy intervention relative to the high scenario and delayed electrification.
High electrification scenario
Existing heating fuel Date at which new builds can no longer choose heating fuel
Date at which existing buildings can no longer choose existing heating fuel
Gas boilers 2025 2035
Oil & coal boilers 2025 2030
RHI ends in 2025 (Heat pumps), 2021 (Biomass); by 2050, the gas grid is completely phased out
The High electrification scenario is net-zero compliant and it achieves deep electrification through widespread heat pump deployment. It relies on a renewed level of engagement and policy ambition on low carbon heat and energy efficiency.
During stakeholder engagement sessions, the low uptake of hybrid heat pumps across all scenarios was debated. The project team considered this result seriously and concluded that the low uptake was reasonable because:
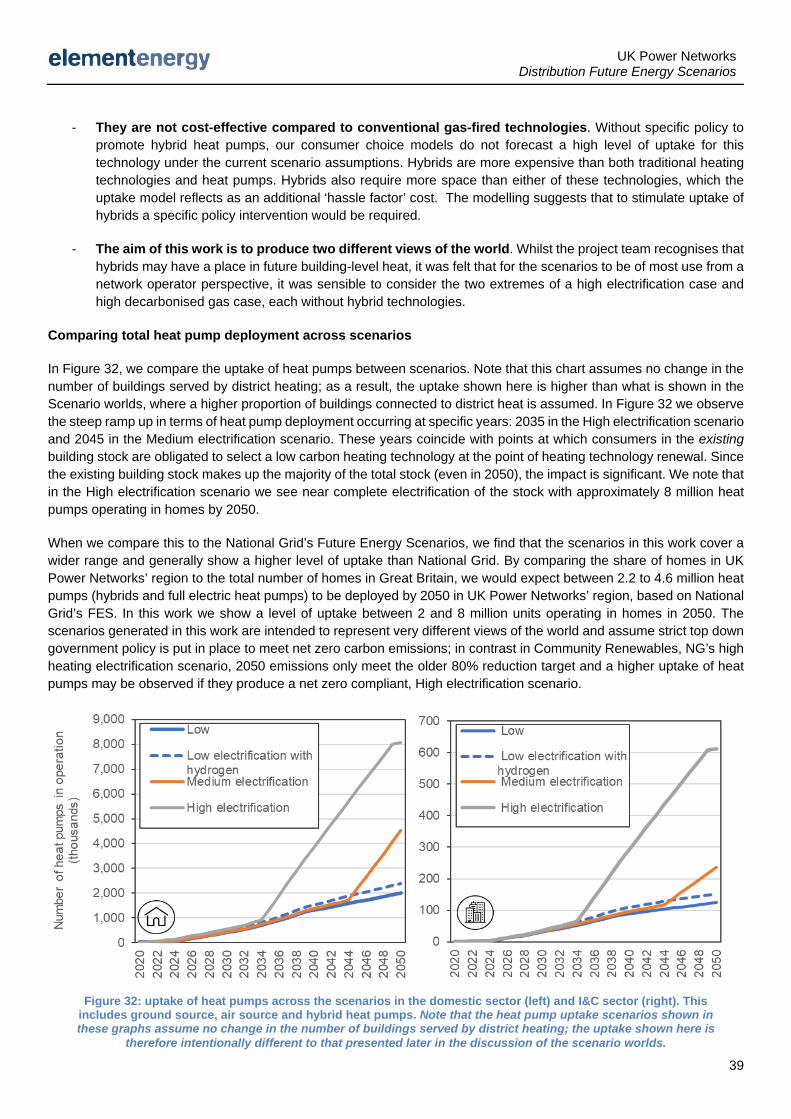
UK Power Networks Distribution Future Energy Scenarios
39
- They are not cost-effective compared to conventional gas-fired technologies. Without specific policy to promote hybrid heat pumps, our consumer choice models do not forecast a high level of uptake for this technology under the current scenario assumptions. Hybrids are more expensive than both traditional heating technologies and heat pumps. Hybrids also require more space than either of these technologies, which the uptake model reflects as an additional ‘hassle factor’ cost. The modelling suggests that to stimulate uptake of hybrids a specific policy intervention would be required.
- The aim of this work is to produce two different views of the world. Whilst the project team recognises that hybrids may have a place in future building-level heat, it was felt that for the scenarios to be of most use from a network operator perspective, it was sensible to consider the two extremes of a high electrification case and high decarbonised gas case, each without hybrid technologies.
Comparing total heat pump deployment across scenarios
In Figure 32, we compare the uptake of heat pumps between scenarios. Note that this chart assumes no change in the number of buildings served by district heating; as a result, the uptake shown here is higher than what is shown in the Scenario worlds, where a higher proportion of buildings connected to district heat is assumed. In Figure 32 we observe the steep ramp up in terms of heat pump deployment occurring at specific years: 2035 in the High electrification scenario and 2045 in the Medium electrification scenario. These years coincide with points at which consumers in the existing building stock are obligated to select a low carbon heating technology at the point of heating technology renewal. Since the existing building stock makes up the majority of the total stock (even in 2050), the impact is significant. We note that in the High electrification scenario we see near complete electrification of the stock with approximately 8 million heat pumps operating in homes by 2050.
When we compare this to the National Grid’s Future Energy Scenarios, we find that the scenarios in this work cover a wider range and generally show a higher level of uptake than National Grid. By comparing the share of homes in UK Power Networks’ region to the total number of homes in Great Britain, we would expect between 2.2 to 4.6 million heat pumps (hybrids and full electric heat pumps) to be deployed by 2050 in UK Power Networks’ region, based on National Grid’s FES. In this work we show a level of uptake between 2 and 8 million units operating in homes in 2050. The scenarios generated in this work are intended to represent very different views of the world and assume strict top down government policy is put in place to meet net zero carbon emissions; in contrast in Community Renewables, NG’s high heating electrification scenario, 2050 emissions only meet the older 80% reduction target and a higher uptake of heat pumps may be observed if they produce a net zero compliant, High electrification scenario.
Figure 32: uptake of heat pumps across the scenarios in the domestic sector (left) and I&C sector (right). This
includes ground source, air source and hybrid heat pumps. Note that the heat pump uptake scenarios shown in these graphs assume no change in the number of buildings served by district heating; the uptake shown here is
therefore intentionally different to that presented later in the discussion of the scenario worlds.
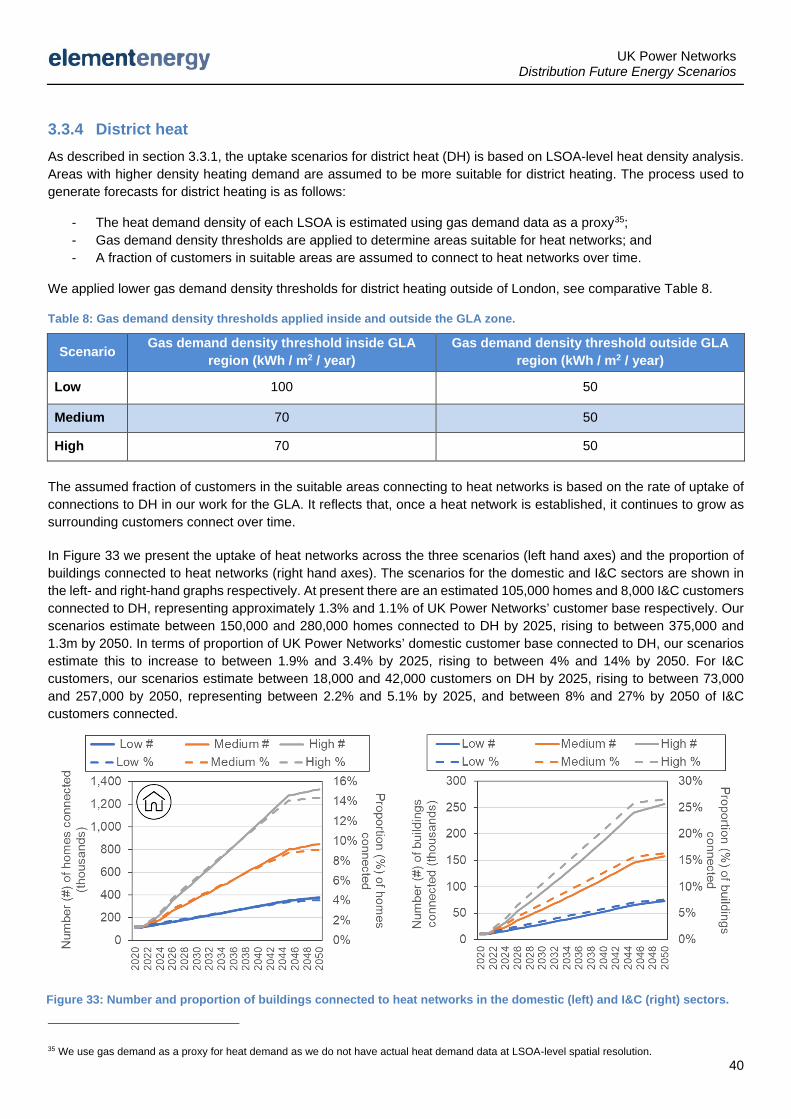
UK Power Networks Distribution Future Energy Scenarios
40
3.3.4 District heat As described in section 3.3.1, the uptake scenarios for district heat (DH) is based on LSOA-level heat density analysis. Areas with higher density heating demand are assumed to be more suitable for district heating. The process used to generate forecasts for district heating is as follows:
- The heat demand density of each LSOA is estimated using gas demand data as a proxy35; - Gas demand density thresholds are applied to determine areas suitable for heat networks; and - A fraction of customers in suitable areas are assumed to connect to heat networks over time.
We applied lower gas demand density thresholds for district heating outside of London, see comparative Table 8.
Table 8: Gas demand density thresholds applied inside and outside the GLA zone.
Scenario Gas demand density threshold inside GLA region (kWh / m2 / year)
Gas demand density threshold outside GLA region (kWh / m2 / year)
Low 100 50
Medium 70 50
High 70 50
The assumed fraction of customers in the suitable areas connecting to heat networks is based on the rate of uptake of connections to DH in our work for the GLA. It reflects that, once a heat network is established, it continues to grow as surrounding customers connect over time.
In Figure 33 we present the uptake of heat networks across the three scenarios (left hand axes) and the proportion of buildings connected to heat networks (right hand axes). The scenarios for the domestic and I&C sectors are shown in the left- and right-hand graphs respectively. At present there are an estimated 105,000 homes and 8,000 I&C customers connected to DH, representing approximately 1.3% and 1.1% of UK Power Networks’ customer base respectively. Our scenarios estimate between 150,000 and 280,000 homes connected to DH by 2025, rising to between 375,000 and 1.3m by 2050. In terms of proportion of UK Power Networks’ domestic customer base connected to DH, our scenarios estimate this to increase to between 1.9% and 3.4% by 2025, rising to between 4% and 14% by 2050. For I&C customers, our scenarios estimate between 18,000 and 42,000 customers on DH by 2025, rising to between 73,000 and 257,000 by 2050, representing between 2.2% and 5.1% by 2025, and between 8% and 27% by 2050 of I&C customers connected.
35 We use gas demand as a proxy for heat demand as we do not have actual heat demand data at LSOA-level spatial resolution.
Figure 33: Number and proportion of buildings connected to heat networks in the domestic (left) and I&C (right) sectors.
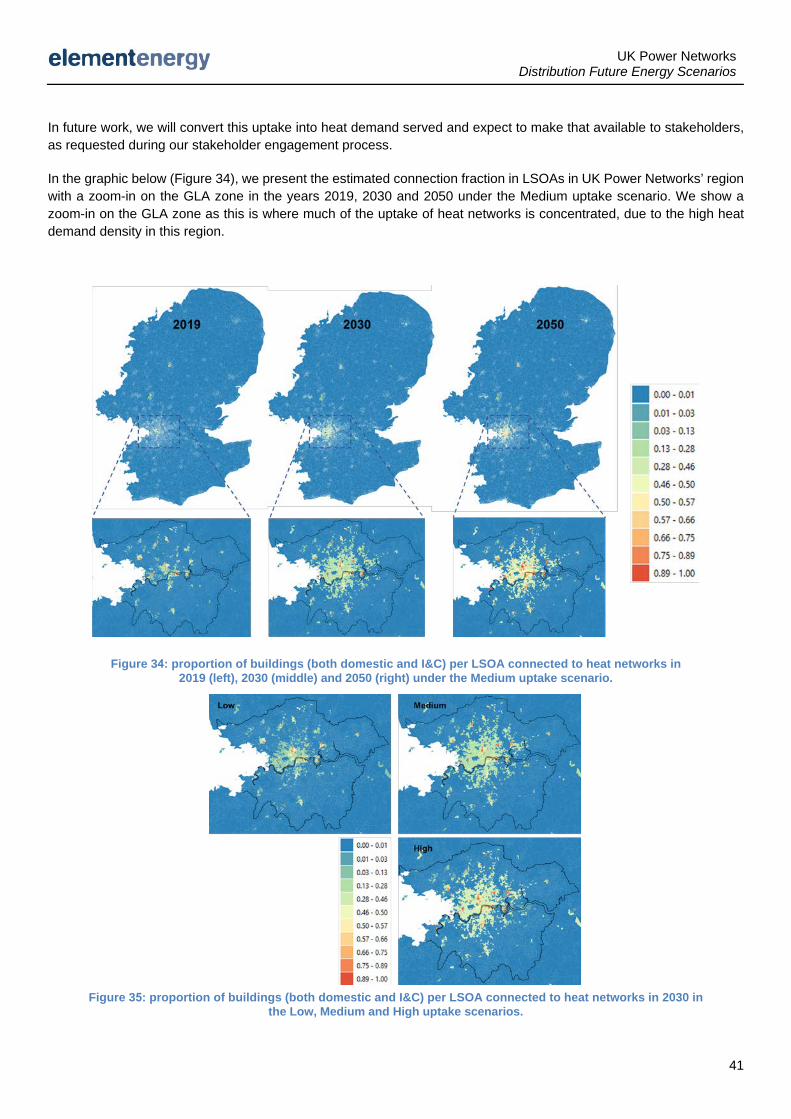
UK Power Networks Distribution Future Energy Scenarios
41
In future work, we will convert this uptake into heat demand served and expect to make that available to stakeholders, as requested during our stakeholder engagement process.
In the graphic below (Figure 34), we present the estimated connection fraction in LSOAs in UK Power Networks’ region with a zoom-in on the GLA zone in the years 2019, 2030 and 2050 under the Medium uptake scenario. We show a zoom-in on the GLA zone as this is where much of the uptake of heat networks is concentrated, due to the high heat demand density in this region.
Figure 34: proportion of buildings (both domestic and I&C) per LSOA connected to heat networks in 2019 (left), 2030 (middle) and 2050 (right) under the Medium uptake scenario.
Figure 35: proportion of buildings (both domestic and I&C) per LSOA connected to heat networks in 2030 in the Low, Medium and High uptake scenarios.
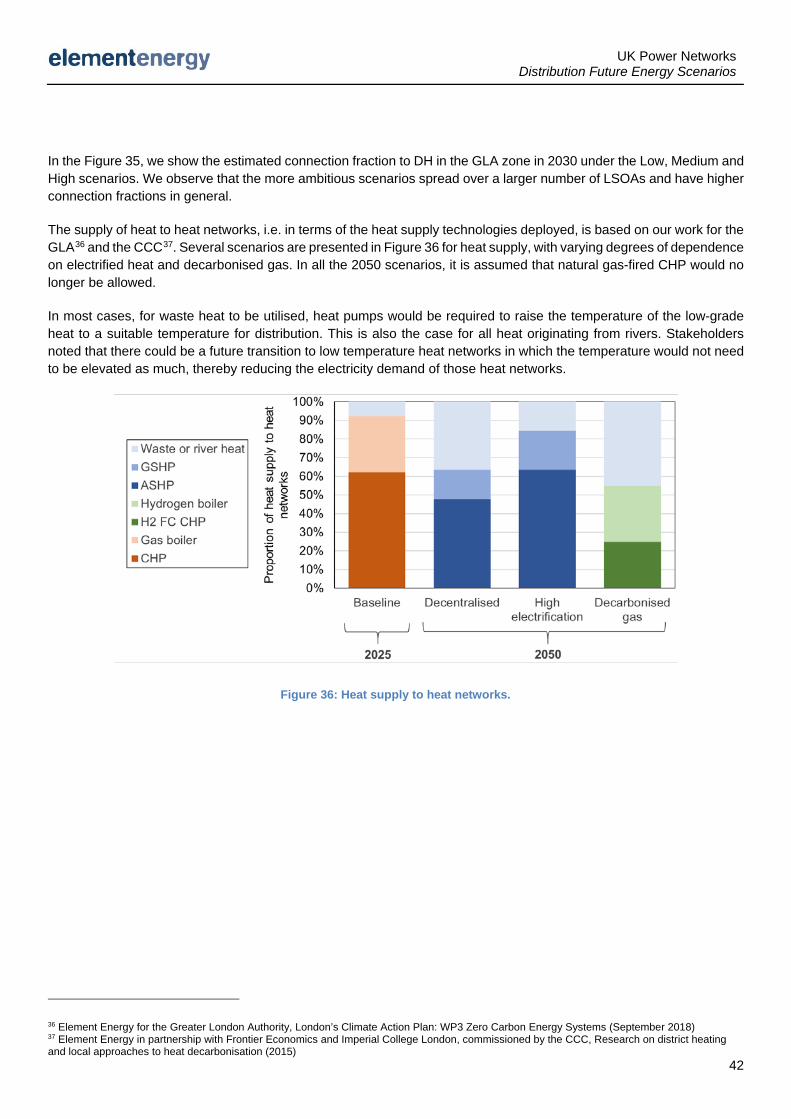
UK Power Networks Distribution Future Energy Scenarios
42
In the Figure 35, we show the estimated connection fraction to DH in the GLA zone in 2030 under the Low, Medium and High scenarios. We observe that the more ambitious scenarios spread over a larger number of LSOAs and have higher connection fractions in general.
The supply of heat to heat networks, i.e. in terms of the heat supply technologies deployed, is based on our work for the GLA36 and the CCC37. Several scenarios are presented in Figure 36 for heat supply, with varying degrees of dependence on electrified heat and decarbonised gas. In all the 2050 scenarios, it is assumed that natural gas-fired CHP would no longer be allowed.
In most cases, for waste heat to be utilised, heat pumps would be required to raise the temperature of the low-grade heat to a suitable temperature for distribution. This is also the case for all heat originating from rivers. Stakeholders noted that there could be a future transition to low temperature heat networks in which the temperature would not need to be elevated as much, thereby reducing the electricity demand of those heat networks.
36 Element Energy for the Greater London Authority, London’s Climate Action Plan: WP3 Zero Carbon Energy Systems (September 2018) 37 Element Energy in partnership with Frontier Economics and Imperial College London, commissioned by the CCC, Research on district heating and local approaches to heat decarbonisation (2015)
Figure 36: Heat supply to heat networks.
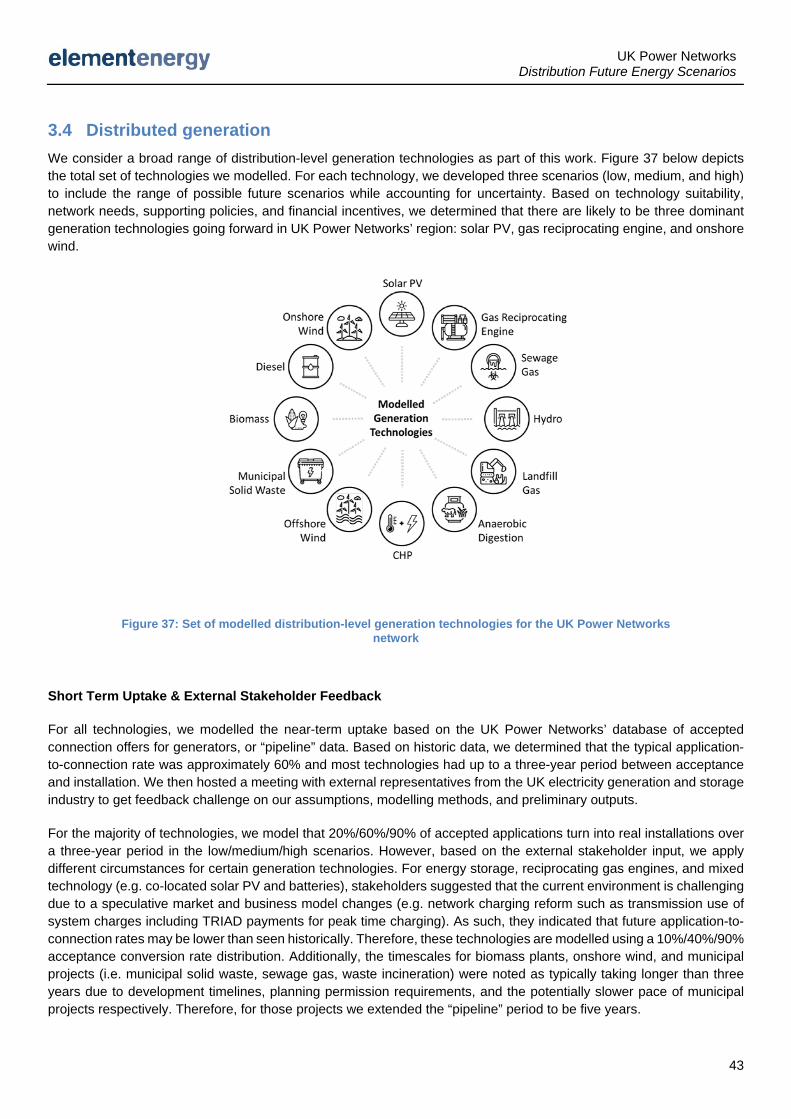
UK Power Networks Distribution Future Energy Scenarios
43
3.4 Distributed generation We consider a broad range of distribution-level generation technologies as part of this work. Figure 37 below depicts the total set of technologies we modelled. For each technology, we developed three scenarios (low, medium, and high) to include the range of possible future scenarios while accounting for uncertainty. Based on technology suitability, network needs, supporting policies, and financial incentives, we determined that there are likely to be three dominant generation technologies going forward in UK Power Networks’ region: solar PV, gas reciprocating engine, and onshore wind.
Short Term Uptake & External Stakeholder Feedback
For all technologies, we modelled the near-term uptake based on the UK Power Networks’ database of accepted connection offers for generators, or “pipeline” data. Based on historic data, we determined that the typical application-to-connection rate was approximately 60% and most technologies had up to a three-year period between acceptance and installation. We then hosted a meeting with external representatives from the UK electricity generation and storage industry to get feedback challenge on our assumptions, modelling methods, and preliminary outputs.
For the majority of technologies, we model that 20%/60%/90% of accepted applications turn into real installations over a three-year period in the low/medium/high scenarios. However, based on the external stakeholder input, we apply different circumstances for certain generation technologies. For energy storage, reciprocating gas engines, and mixed technology (e.g. co-located solar PV and batteries), stakeholders suggested that the current environment is challenging due to a speculative market and business model changes (e.g. network charging reform such as transmission use of system charges including TRIAD payments for peak time charging). As such, they indicated that future application-to-connection rates may be lower than seen historically. Therefore, these technologies are modelled using a 10%/40%/90% acceptance conversion rate distribution. Additionally, the timescales for biomass plants, onshore wind, and municipal projects (i.e. municipal solid waste, sewage gas, waste incineration) were noted as typically taking longer than three years due to development timelines, planning permission requirements, and the potentially slower pace of municipal projects respectively. Therefore, for those projects we extended the “pipeline” period to be five years.
Figure 37: Set of modelled distribution-level generation technologies for the UK Power Networks network
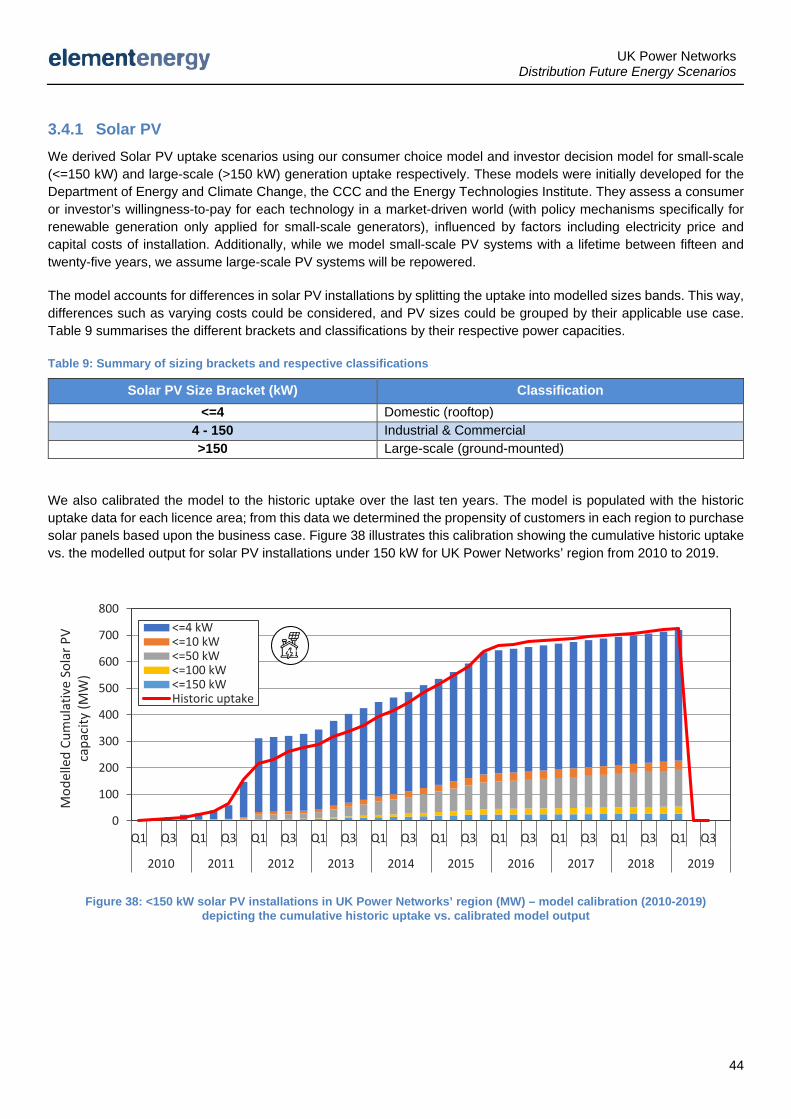
UK Power Networks Distribution Future Energy Scenarios
44
3.4.1 Solar PV We derived Solar PV uptake scenarios using our consumer choice model and investor decision model for small-scale (<=150 kW) and large-scale (>150 kW) generation uptake respectively. These models were initially developed for the Department of Energy and Climate Change, the CCC and the Energy Technologies Institute. They assess a consumer or investor’s willingness-to-pay for each technology in a market-driven world (with policy mechanisms specifically for renewable generation only applied for small-scale generators), influenced by factors including electricity price and capital costs of installation. Additionally, while we model small-scale PV systems with a lifetime between fifteen and twenty-five years, we assume large-scale PV systems will be repowered.
The model accounts for differences in solar PV installations by splitting the uptake into modelled sizes bands. This way, differences such as varying costs could be considered, and PV sizes could be grouped by their applicable use case. Table 9 summarises the different brackets and classifications by their respective power capacities.
Table 9: Summary of sizing brackets and respective classifications
Solar PV Size Bracket (kW) Classification <=4 Domestic (rooftop)
4 - 150 Industrial & Commercial >150 Large-scale (ground-mounted)
We also calibrated the model to the historic uptake over the last ten years. The model is populated with the historic uptake data for each licence area; from this data we determined the propensity of customers in each region to purchase solar panels based upon the business case. Figure 38 illustrates this calibration showing the cumulative historic uptake vs. the modelled output for solar PV installations under 150 kW for UK Power Networks’ region from 2010 to 2019.
0
100
200
300
400
500
600
700
800
Q1 Q3 Q1 Q3 Q1 Q3 Q1 Q3 Q1 Q3 Q1 Q3 Q1 Q3 Q1 Q3 Q1 Q3 Q1 Q3
2010 2011 2012 2013 2014 2015 2016 2017 2018 2019
Mod
elle
d Cu
mul
ativ
e So
lar P
V ca
paci
ty (M
W)
<=4 kW<=10 kW<=50 kW<=100 kW<=150 kWHistoric uptake
Figure 38: <150 kW solar PV installations in UK Power Networks’ region (MW) – model calibration (2010-2019) depicting the cumulative historic uptake vs. calibrated model output

UK Power Networks Distribution Future Energy Scenarios
45
Small-scale Solar PV
As the capital costs for rooftop PV installations continue to decline, we model the uptake of small-scale solar PV to increase. In the early-to-mid 2030s, there may be an initial dip (as we model in the low and medium scenarios) of overall capacity as prior feed-in-tariff installations come to the end of their lifetimes and are potentially not replaced. However, from then onwards, we expect an increasing rate of uptake towards 2050. Figure 39 and Figure 40 depict the uptake of small-scale
solar PV across UK Power Networks’ licence areas from 2019 to 2050 in a medium growth scenario for domestic and I&C installations respectively.
Large-scale Solar PV
Similar to the trends found in small-scale solar, we expect significant capacity increases in large-scale ground mounted solar arrays. NG’s FES estimates between two-fold and four-fold increase of decentralised solar capacity by 2050. Our projections are within this range as well. However, we expect higher increases in areas which are particularly suitable for solar such as EPN where we expect solar PV to continue to outstrip some other regions of the UK as it has done so far. For other
areas, such as LPN, we expect significantly lower increases due to higher land values. Figure 41 illustrates the uptake of large-scale solar PV across our three licence areas.
Figure 39: Number of small-scale domestic rooftop solar installations (<4 kW) in UK Power Networks’ region, for a
medium growth scenario, reaches ~600,000 by 2050
Figure 40: Capacity of small-scale I&C solar installations (4 – 150 kW) in UK Power Networks’ region, for a medium growth
scenario, reaches ~1,350 MW by 2050
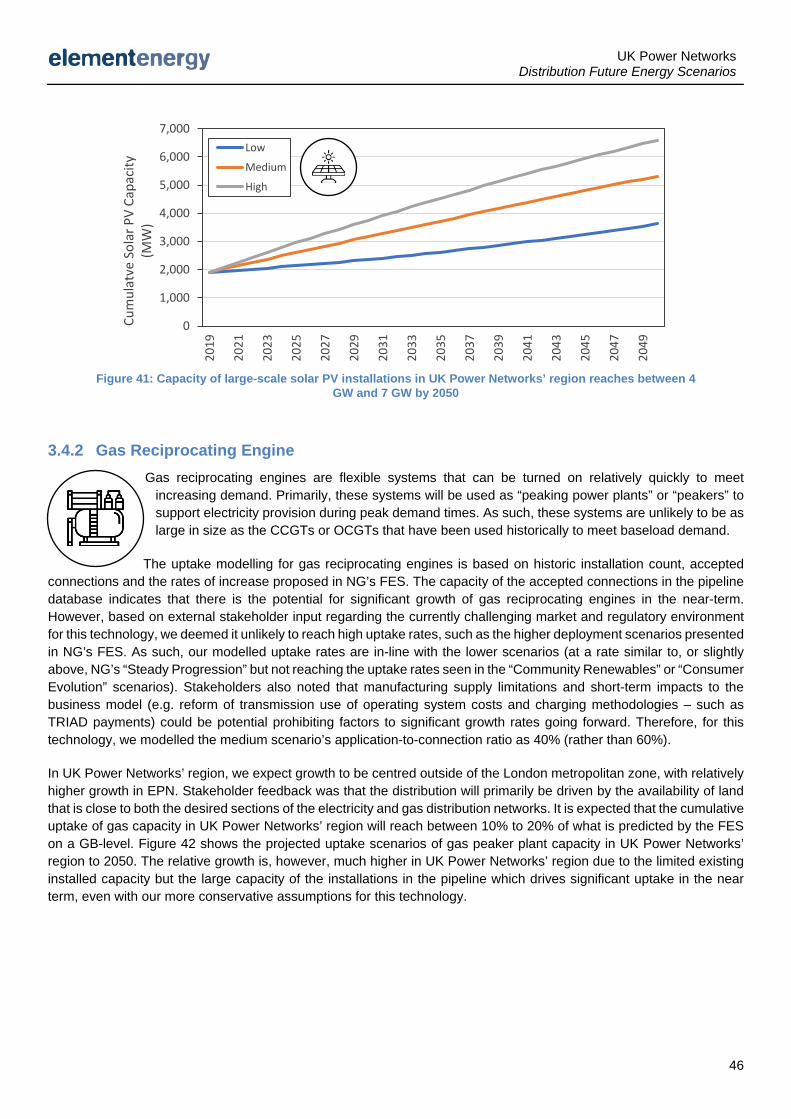
UK Power Networks Distribution Future Energy Scenarios
46
3.4.2 Gas Reciprocating Engine Gas reciprocating engines are flexible systems that can be turned on relatively quickly to meet
increasing demand. Primarily, these systems will be used as “peaking power plants” or “peakers” to support electricity provision during peak demand times. As such, these systems are unlikely to be as large in size as the CCGTs or OCGTs that have been used historically to meet baseload demand.
The uptake modelling for gas reciprocating engines is based on historic installation count, accepted connections and the rates of increase proposed in NG’s FES. The capacity of the accepted connections in the pipeline database indicates that there is the potential for significant growth of gas reciprocating engines in the near-term. However, based on external stakeholder input regarding the currently challenging market and regulatory environment for this technology, we deemed it unlikely to reach high uptake rates, such as the higher deployment scenarios presented in NG’s FES. As such, our modelled uptake rates are in-line with the lower scenarios (at a rate similar to, or slightly above, NG’s “Steady Progression” but not reaching the uptake rates seen in the “Community Renewables” or “Consumer Evolution” scenarios). Stakeholders also noted that manufacturing supply limitations and short-term impacts to the business model (e.g. reform of transmission use of operating system costs and charging methodologies – such as TRIAD payments) could be potential prohibiting factors to significant growth rates going forward. Therefore, for this technology, we modelled the medium scenario’s application-to-connection ratio as 40% (rather than 60%).
In UK Power Networks’ region, we expect growth to be centred outside of the London metropolitan zone, with relatively higher growth in EPN. Stakeholder feedback was that the distribution will primarily be driven by the availability of land that is close to both the desired sections of the electricity and gas distribution networks. It is expected that the cumulative uptake of gas capacity in UK Power Networks’ region will reach between 10% to 20% of what is predicted by the FES on a GB-level. Figure 42 shows the projected uptake scenarios of gas peaker plant capacity in UK Power Networks’ region to 2050. The relative growth is, however, much higher in UK Power Networks’ region due to the limited existing installed capacity but the large capacity of the installations in the pipeline which drives significant uptake in the near term, even with our more conservative assumptions for this technology.
Figure 41: Capacity of large-scale solar PV installations in UK Power Networks’ region reaches between 4 GW and 7 GW by 2050
0
1,000
2,000
3,000
4,000
5,000
6,000
7,000
2019
2021
2023
2025
2027
2029
2031
2033
2035
2037
2039
2041
2043
2045
2047
2049
Cum
ulat
ve S
olar
PV
Capa
city
(M
W)
Low
Medium
High
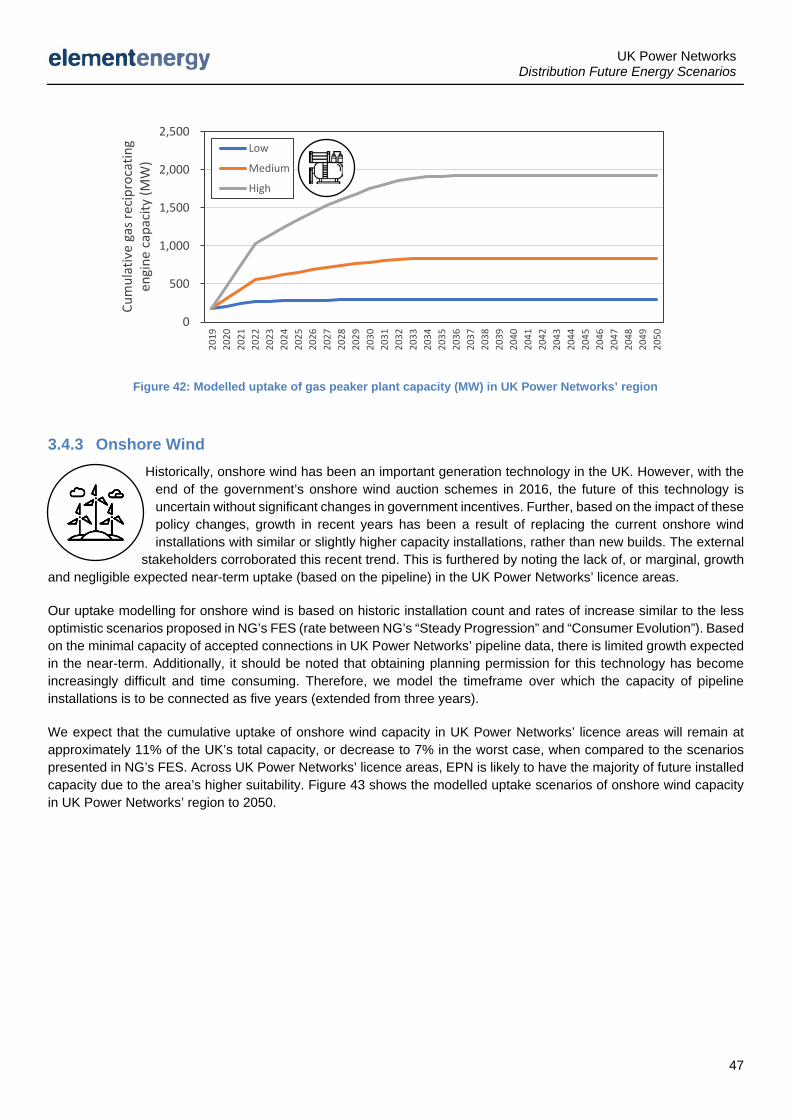
UK Power Networks Distribution Future Energy Scenarios
47
3.4.3 Onshore Wind Historically, onshore wind has been an important generation technology in the UK. However, with the
end of the government’s onshore wind auction schemes in 2016, the future of this technology is uncertain without significant changes in government incentives. Further, based on the impact of these policy changes, growth in recent years has been a result of replacing the current onshore wind installations with similar or slightly higher capacity installations, rather than new builds. The external
stakeholders corroborated this recent trend. This is furthered by noting the lack of, or marginal, growth and negligible expected near-term uptake (based on the pipeline) in the UK Power Networks’ licence areas.
Our uptake modelling for onshore wind is based on historic installation count and rates of increase similar to the less optimistic scenarios proposed in NG’s FES (rate between NG’s “Steady Progression” and “Consumer Evolution”). Based on the minimal capacity of accepted connections in UK Power Networks’ pipeline data, there is limited growth expected in the near-term. Additionally, it should be noted that obtaining planning permission for this technology has become increasingly difficult and time consuming. Therefore, we model the timeframe over which the capacity of pipeline installations is to be connected as five years (extended from three years).
We expect that the cumulative uptake of onshore wind capacity in UK Power Networks’ licence areas will remain at approximately 11% of the UK’s total capacity, or decrease to 7% in the worst case, when compared to the scenarios presented in NG’s FES. Across UK Power Networks’ licence areas, EPN is likely to have the majority of future installed capacity due to the area’s higher suitability. Figure 43 shows the modelled uptake scenarios of onshore wind capacity in UK Power Networks’ region to 2050.
Figure 42: Modelled uptake of gas peaker plant capacity (MW) in UK Power Networks’ region
0
500
1,000
1,500
2,000
2,500
2019
2020
2021
2022
2023
2024
2025
2026
2027
2028
2029
2030
2031
2032
2033
2034
2035
2036
2037
2038
2039
2040
2041
2042
2043
2044
2045
2046
2047
2048
2049
2050
Cum
ulat
ive
gas r
ecip
roca
ting
engi
ne c
apac
ity (M
W)
Low
Medium
High
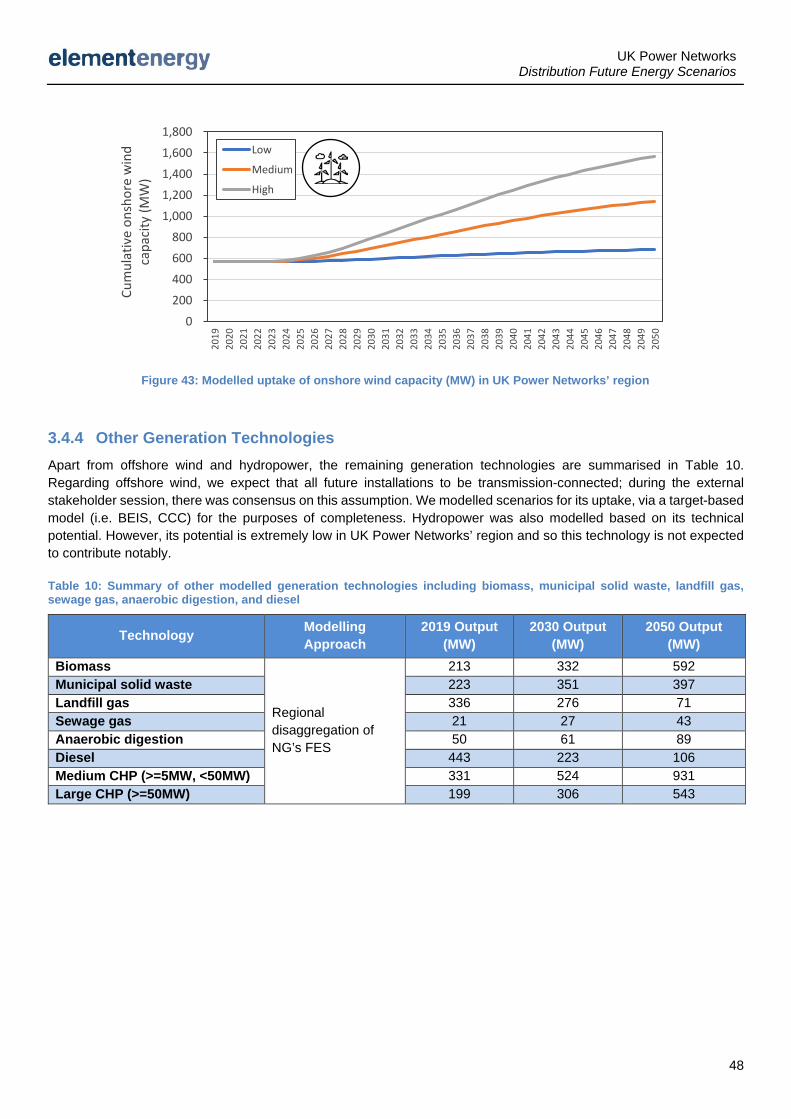
UK Power Networks Distribution Future Energy Scenarios
48
3.4.4 Other Generation Technologies Apart from offshore wind and hydropower, the remaining generation technologies are summarised in Table 10. Regarding offshore wind, we expect that all future installations to be transmission-connected; during the external stakeholder session, there was consensus on this assumption. We modelled scenarios for its uptake, via a target-based model (i.e. BEIS, CCC) for the purposes of completeness. Hydropower was also modelled based on its technical potential. However, its potential is extremely low in UK Power Networks’ region and so this technology is not expected to contribute notably.
Table 10: Summary of other modelled generation technologies including biomass, municipal solid waste, landfill gas, sewage gas, anaerobic digestion, and diesel
Technology Modelling Approach
2019 Output (MW)
2030 Output (MW)
2050 Output (MW)
Biomass
Regional disaggregation of NG’s FES
213 332 592 Municipal solid waste 223 351 397 Landfill gas 336 276 71 Sewage gas 21 27 43 Anaerobic digestion 50 61 89 Diesel 443 223 106 Medium CHP (>=5MW, <50MW) 331 524 931 Large CHP (>=50MW) 199 306 543
Figure 43: Modelled uptake of onshore wind capacity (MW) in UK Power Networks’ region
0
200
400
600
800
1,000
1,200
1,400
1,600
1,800
2019
2020
2021
2022
2023
2024
2025
2026
2027
2028
2029
2030
2031
2032
2033
2034
2035
2036
2037
2038
2039
2040
2041
2042
2043
2044
2045
2046
2047
2048
2049
2050
Cum
ulat
ive
onsh
ore
win
d ca
paci
ty (M
W)
Low
Medium
High
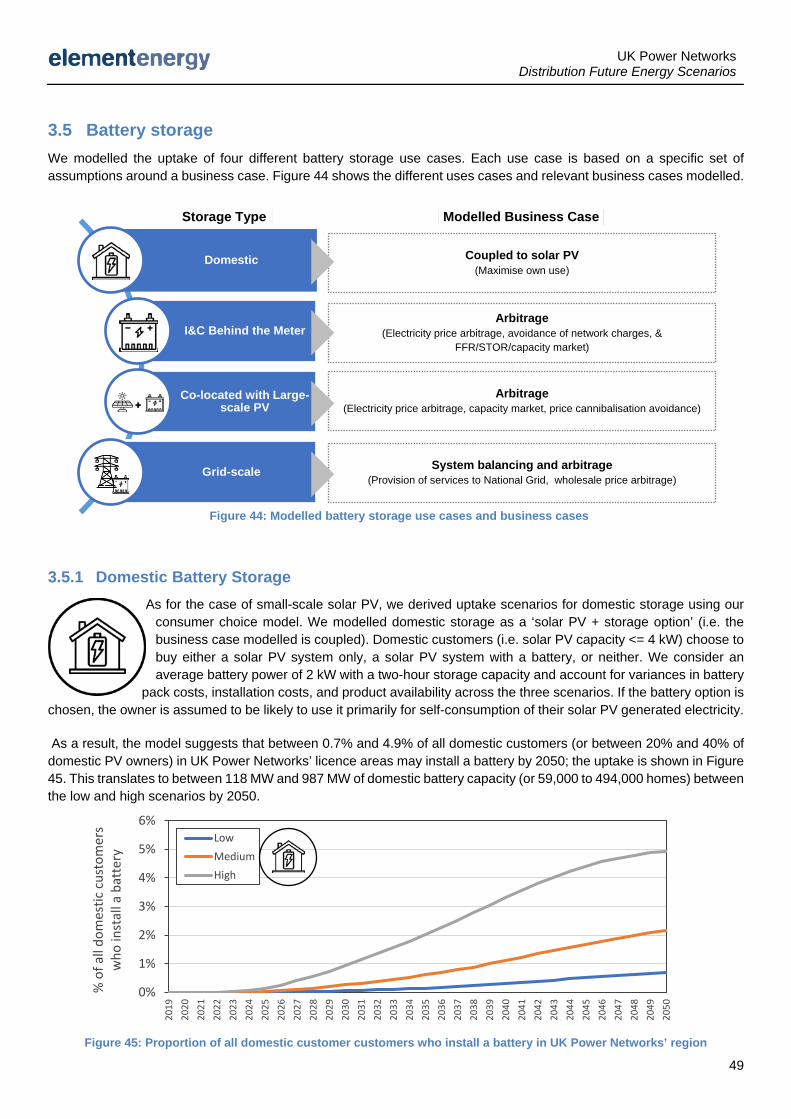
UK Power Networks Distribution Future Energy Scenarios
49
3.5 Battery storage We modelled the uptake of four different battery storage use cases. Each use case is based on a specific set of assumptions around a business case. Figure 44 shows the different uses cases and relevant business cases modelled.
3.5.1 Domestic Battery Storage As for the case of small-scale solar PV, we derived uptake scenarios for domestic storage using our
consumer choice model. We modelled domestic storage as a ‘solar PV + storage option’ (i.e. the business case modelled is coupled). Domestic customers (i.e. solar PV capacity <= 4 kW) choose to buy either a solar PV system only, a solar PV system with a battery, or neither. We consider an average battery power of 2 kW with a two-hour storage capacity and account for variances in battery
pack costs, installation costs, and product availability across the three scenarios. If the battery option is chosen, the owner is assumed to be likely to use it primarily for self-consumption of their solar PV generated electricity.
As a result, the model suggests that between 0.7% and 4.9% of all domestic customers (or between 20% and 40% of domestic PV owners) in UK Power Networks’ licence areas may install a battery by 2050; the uptake is shown in Figure 45. This translates to between 118 MW and 987 MW of domestic battery capacity (or 59,000 to 494,000 homes) between the low and high scenarios by 2050.
Figure 44: Modelled battery storage use cases and business cases
Figure 45: Proportion of all domestic customer customers who install a battery in UK Power Networks’ region
Domestic
I&C Behind the Meter
Co-located with Large-scale PV
Grid-scale
Coupled to solar PV (Maximise own use)
Arbitrage (Electricity price arbitrage, avoidance of network charges, &
FFR/STOR/capacity market)
Arbitrage (Electricity price arbitrage, capacity market, price cannibalisation avoidance)
System balancing and arbitrage (Provision of services to National Grid, wholesale price arbitrage)
Storage Type Modelled Business Case
0%
1%
2%
3%
4%
5%
6%
2019
2020
2021
2022
2023
2024
2025
2026
2027
2028
2029
2030
2031
2032
2033
2034
2035
2036
2037
2038
2039
2040
2041
2042
2043
2044
2045
2046
2047
2048
2049
2050
% o
f all
dom
estic
cus
tom
ers
who
inst
all a
bat
tery
LowMediumHigh
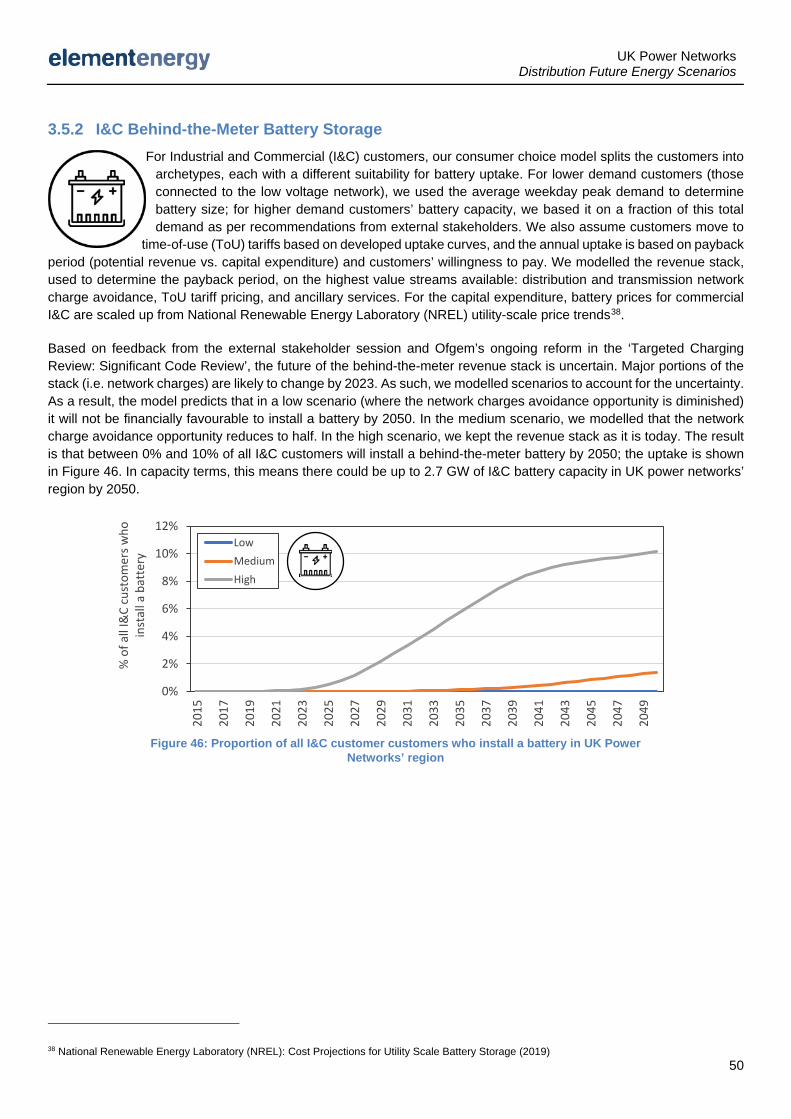
UK Power Networks Distribution Future Energy Scenarios
50
3.5.2 I&C Behind-the-Meter Battery Storage For Industrial and Commercial (I&C) customers, our consumer choice model splits the customers into
archetypes, each with a different suitability for battery uptake. For lower demand customers (those connected to the low voltage network), we used the average weekday peak demand to determine battery size; for higher demand customers’ battery capacity, we based it on a fraction of this total demand as per recommendations from external stakeholders. We also assume customers move to
time-of-use (ToU) tariffs based on developed uptake curves, and the annual uptake is based on payback period (potential revenue vs. capital expenditure) and customers’ willingness to pay. We modelled the revenue stack, used to determine the payback period, on the highest value streams available: distribution and transmission network charge avoidance, ToU tariff pricing, and ancillary services. For the capital expenditure, battery prices for commercial I&C are scaled up from National Renewable Energy Laboratory (NREL) utility-scale price trends38.
Based on feedback from the external stakeholder session and Ofgem’s ongoing reform in the ‘Targeted Charging Review: Significant Code Review’, the future of the behind-the-meter revenue stack is uncertain. Major portions of the stack (i.e. network charges) are likely to change by 2023. As such, we modelled scenarios to account for the uncertainty. As a result, the model predicts that in a low scenario (where the network charges avoidance opportunity is diminished) it will not be financially favourable to install a battery by 2050. In the medium scenario, we modelled that the network charge avoidance opportunity reduces to half. In the high scenario, we kept the revenue stack as it is today. The result is that between 0% and 10% of all I&C customers will install a behind-the-meter battery by 2050; the uptake is shown in Figure 46. In capacity terms, this means there could be up to 2.7 GW of I&C battery capacity in UK power networks’ region by 2050.
38 National Renewable Energy Laboratory (NREL): Cost Projections for Utility Scale Battery Storage (2019)
0%
2%
4%
6%
8%
10%
12%
2015
2017
2019
2021
2023
2025
2027
2029
2031
2033
2035
2037
2039
2041
2043
2045
2047
2049
% o
f all
I&C
cust
omer
s who
in
stal
l a b
atte
ry
LowMediumHigh
Figure 46: Proportion of all I&C customer customers who install a battery in UK Power Networks’ region
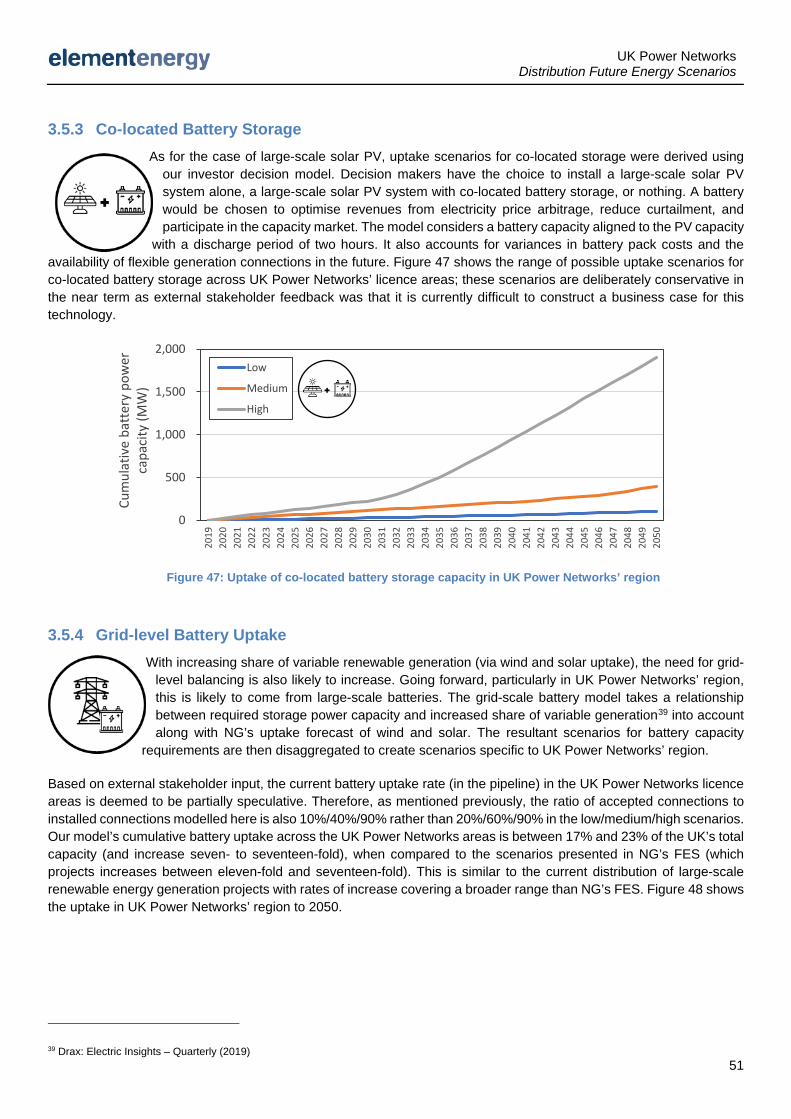
UK Power Networks Distribution Future Energy Scenarios
51
3.5.3 Co-located Battery Storage As for the case of large-scale solar PV, uptake scenarios for co-located storage were derived using
our investor decision model. Decision makers have the choice to install a large-scale solar PV system alone, a large-scale solar PV system with co-located battery storage, or nothing. A battery would be chosen to optimise revenues from electricity price arbitrage, reduce curtailment, and participate in the capacity market. The model considers a battery capacity aligned to the PV capacity
with a discharge period of two hours. It also accounts for variances in battery pack costs and the availability of flexible generation connections in the future. Figure 47 shows the range of possible uptake scenarios for co-located battery storage across UK Power Networks’ licence areas; these scenarios are deliberately conservative in the near term as external stakeholder feedback was that it is currently difficult to construct a business case for this technology.
3.5.4 Grid-level Battery Uptake With increasing share of variable renewable generation (via wind and solar uptake), the need for grid-
level balancing is also likely to increase. Going forward, particularly in UK Power Networks’ region, this is likely to come from large-scale batteries. The grid-scale battery model takes a relationship between required storage power capacity and increased share of variable generation39 into account along with NG’s uptake forecast of wind and solar. The resultant scenarios for battery capacity
requirements are then disaggregated to create scenarios specific to UK Power Networks’ region.
Based on external stakeholder input, the current battery uptake rate (in the pipeline) in the UK Power Networks licence areas is deemed to be partially speculative. Therefore, as mentioned previously, the ratio of accepted connections to installed connections modelled here is also 10%/40%/90% rather than 20%/60%/90% in the low/medium/high scenarios. Our model’s cumulative battery uptake across the UK Power Networks areas is between 17% and 23% of the UK’s total capacity (and increase seven- to seventeen-fold), when compared to the scenarios presented in NG’s FES (which projects increases between eleven-fold and seventeen-fold). This is similar to the current distribution of large-scale renewable energy generation projects with rates of increase covering a broader range than NG’s FES. Figure 48 shows the uptake in UK Power Networks’ region to 2050.
39 Drax: Electric Insights – Quarterly (2019)
Figure 47: Uptake of co-located battery storage capacity in UK Power Networks’ region
0
500
1,000
1,500
2,000
2019
2020
2021
2022
2023
2024
2025
2026
2027
2028
2029
2030
2031
2032
2033
2034
2035
2036
2037
2038
2039
2040
2041
2042
2043
2044
2045
2046
2047
2048
2049
2050
Cum
ulat
ive
batt
ery
pow
er
capa
city
(MW
)
Low
Medium
High
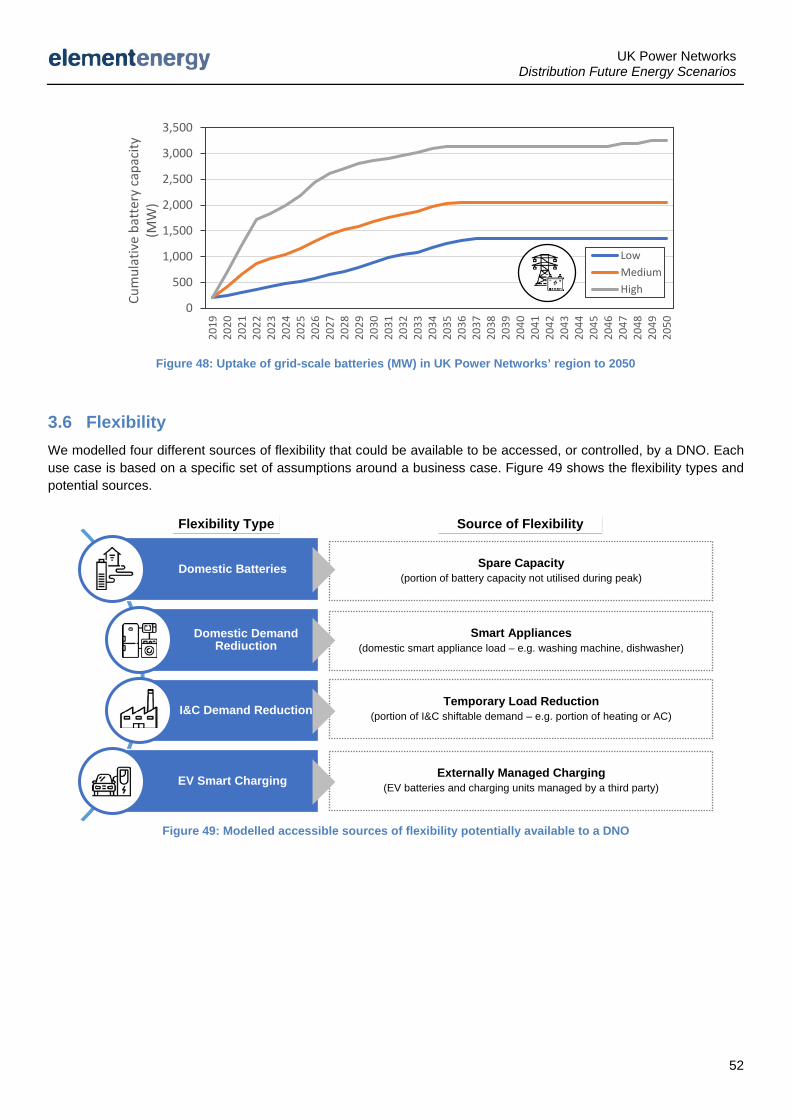
UK Power Networks Distribution Future Energy Scenarios
52
3.6 Flexibility We modelled four different sources of flexibility that could be available to be accessed, or controlled, by a DNO. Each use case is based on a specific set of assumptions around a business case. Figure 49 shows the flexibility types and potential sources.
Domestic Batteries
Domestic Demand Rediuction
I&C Demand Reduction
EV Smart Charging
Figure 49: Modelled accessible sources of flexibility potentially available to a DNO
Figure 48: Uptake of grid-scale batteries (MW) in UK Power Networks’ region to 2050
Spare Capacity (portion of battery capacity not utilised during peak)
Smart Appliances (domestic smart appliance load – e.g. washing machine, dishwasher)
Temporary Load Reduction (portion of I&C shiftable demand – e.g. portion of heating or AC)
Externally Managed Charging (EV batteries and charging units managed by a third party)
Flexibility Type Source of Flexibility
0
500
1,000
1,500
2,000
2,500
3,000
3,500
2019
2020
2021
2022
2023
2024
2025
2026
2027
2028
2029
2030
2031
2032
2033
2034
2035
2036
2037
2038
2039
2040
2041
2042
2043
2044
2045
2046
2047
2048
2049
2050
Cum
ulat
ive
batt
ery
capa
city
(M
W)
LowMediumHigh
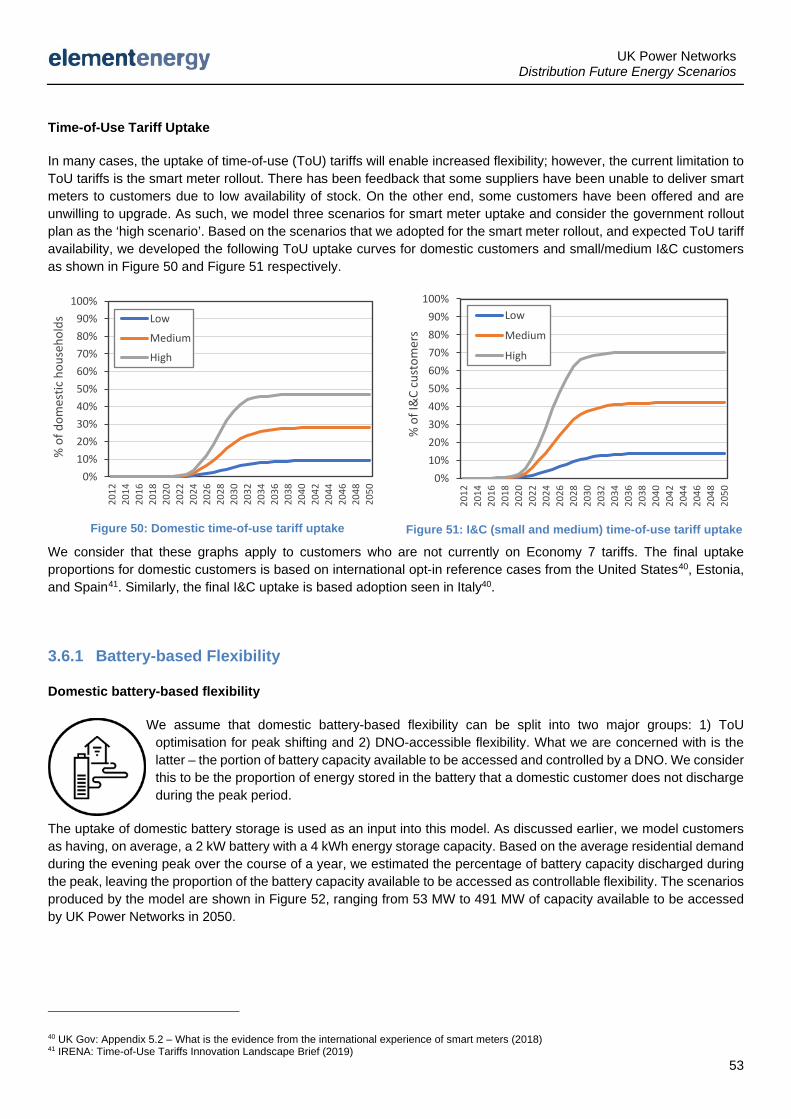
UK Power Networks Distribution Future Energy Scenarios
53
Time-of-Use Tariff Uptake
In many cases, the uptake of time-of-use (ToU) tariffs will enable increased flexibility; however, the current limitation to ToU tariffs is the smart meter rollout. There has been feedback that some suppliers have been unable to deliver smart meters to customers due to low availability of stock. On the other end, some customers have been offered and are unwilling to upgrade. As such, we model three scenarios for smart meter uptake and consider the government rollout plan as the ‘high scenario’. Based on the scenarios that we adopted for the smart meter rollout, and expected ToU tariff availability, we developed the following ToU uptake curves for domestic customers and small/medium I&C customers as shown in Figure 50 and Figure 51 respectively.
We consider that these graphs apply to customers who are not currently on Economy 7 tariffs. The final uptake proportions for domestic customers is based on international opt-in reference cases from the United States40, Estonia, and Spain41. Similarly, the final I&C uptake is based adoption seen in Italy40.
3.6.1 Battery-based Flexibility
Domestic battery-based flexibility
We assume that domestic battery-based flexibility can be split into two major groups: 1) ToU optimisation for peak shifting and 2) DNO-accessible flexibility. What we are concerned with is the latter – the portion of battery capacity available to be accessed and controlled by a DNO. We consider this to be the proportion of energy stored in the battery that a domestic customer does not discharge during the peak period.
The uptake of domestic battery storage is used as an input into this model. As discussed earlier, we model customers as having, on average, a 2 kW battery with a 4 kWh energy storage capacity. Based on the average residential demand during the evening peak over the course of a year, we estimated the percentage of battery capacity discharged during the peak, leaving the proportion of the battery capacity available to be accessed as controllable flexibility. The scenarios produced by the model are shown in Figure 52, ranging from 53 MW to 491 MW of capacity available to be accessed by UK Power Networks in 2050.
40 UK Gov: Appendix 5.2 – What is the evidence from the international experience of smart meters (2018) 41 IRENA: Time-of-Use Tariffs Innovation Landscape Brief (2019)
0%10%20%30%40%50%60%70%80%90%
100%
2012
2014
2016
2018
2020
2022
2024
2026
2028
2030
2032
2034
2036
2038
2040
2042
2044
2046
2048
2050
% o
f I&
C cu
stom
ers
Low
Medium
High
0%10%20%30%40%50%60%70%80%90%
100%
2012
2014
2016
2018
2020
2022
2024
2026
2028
2030
2032
2034
2036
2038
2040
2042
2044
2046
2048
2050
% o
f dom
estic
hou
seho
lds Low
Medium
High
Figure 50: Domestic time-of-use tariff uptake Figure 51: I&C (small and medium) time-of-use tariff uptake
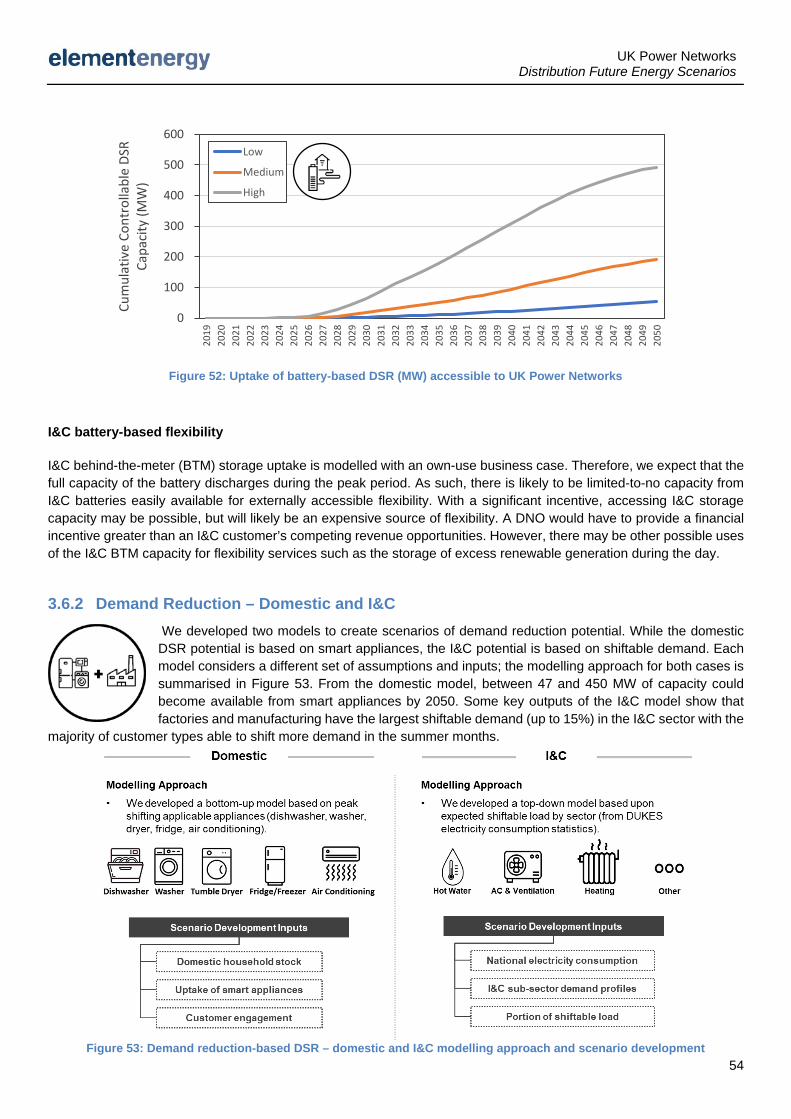
UK Power Networks Distribution Future Energy Scenarios
54
I&C battery-based flexibility
I&C behind-the-meter (BTM) storage uptake is modelled with an own-use business case. Therefore, we expect that the full capacity of the battery discharges during the peak period. As such, there is likely to be limited-to-no capacity from I&C batteries easily available for externally accessible flexibility. With a significant incentive, accessing I&C storage capacity may be possible, but will likely be an expensive source of flexibility. A DNO would have to provide a financial incentive greater than an I&C customer’s competing revenue opportunities. However, there may be other possible uses of the I&C BTM capacity for flexibility services such as the storage of excess renewable generation during the day.
3.6.2 Demand Reduction – Domestic and I&C We developed two models to create scenarios of demand reduction potential. While the domestic DSR potential is based on smart appliances, the I&C potential is based on shiftable demand. Each model considers a different set of assumptions and inputs; the modelling approach for both cases is summarised in Figure 53. From the domestic model, between 47 and 450 MW of capacity could become available from smart appliances by 2050. Some key outputs of the I&C model show that factories and manufacturing have the largest shiftable demand (up to 15%) in the I&C sector with the
majority of customer types able to shift more demand in the summer months.
Figure 52: Uptake of battery-based DSR (MW) accessible to UK Power Networks
Figure 53: Demand reduction-based DSR – domestic and I&C modelling approach and scenario development
0
100
200
300
400
500
600
2019
2020
2021
2022
2023
2024
2025
2026
2027
2028
2029
2030
2031
2032
2033
2034
2035
2036
2037
2038
2039
2040
2041
2042
2043
2044
2045
2046
2047
2048
2049
2050
Cum
ulat
ive
Cont
rolla
ble
DSR
Capa
city
(MW
)Low
Medium
High
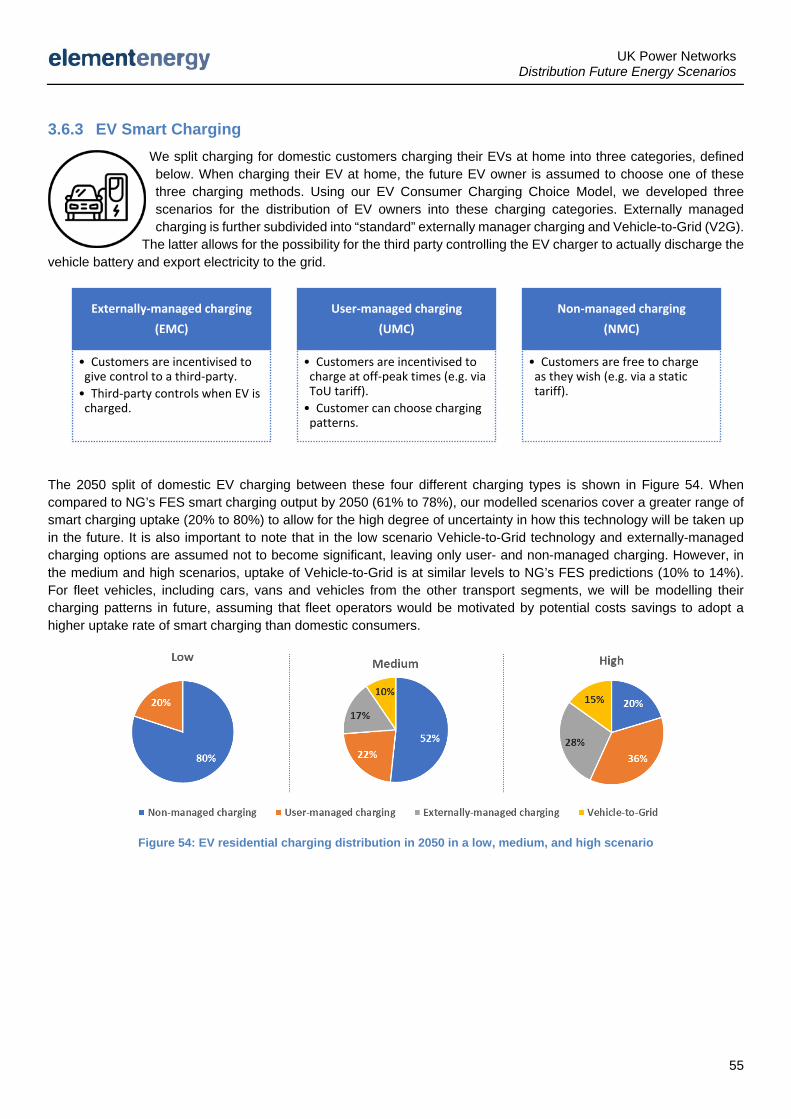
UK Power Networks Distribution Future Energy Scenarios
55
3.6.3 EV Smart Charging We split charging for domestic customers charging their EVs at home into three categories, defined
below. When charging their EV at home, the future EV owner is assumed to choose one of these three charging methods. Using our EV Consumer Charging Choice Model, we developed three scenarios for the distribution of EV owners into these charging categories. Externally managed charging is further subdivided into “standard” externally manager charging and Vehicle-to-Grid (V2G).
The latter allows for the possibility for the third party controlling the EV charger to actually discharge the vehicle battery and export electricity to the grid.
The 2050 split of domestic EV charging between these four different charging types is shown in Figure 54. When compared to NG’s FES smart charging output by 2050 (61% to 78%), our modelled scenarios cover a greater range of smart charging uptake (20% to 80%) to allow for the high degree of uncertainty in how this technology will be taken up in the future. It is also important to note that in the low scenario Vehicle-to-Grid technology and externally-managed charging options are assumed not to become significant, leaving only user- and non-managed charging. However, in the medium and high scenarios, uptake of Vehicle-to-Grid is at similar levels to NG’s FES predictions (10% to 14%). For fleet vehicles, including cars, vans and vehicles from the other transport segments, we will be modelling their charging patterns in future, assuming that fleet operators would be motivated by potential costs savings to adopt a higher uptake rate of smart charging than domestic consumers.
Externally-managed charging(EMC)
• Customers are incentivised to give control to a third-party.
• Third-party controls when EV is charged.
User-managed charging(UMC)
• Customers are incentivised to charge at off-peak times (e.g. via ToU tariff).
• Customer can choose charging patterns.
Non-managed charging(NMC)
• Customers are free to charge as they wish (e.g. via a static tariff).
Figure 54: EV residential charging distribution in 2050 in a low, medium, and high scenario
UK Power Networks Distribution Future Energy Scenarios
56
4 Scenarios Worlds
4.1 Scenario World Overview We produced the scenarios for each of the key drivers outlined above to try and capture the broad range of different possible futures for demand and generation across UK Power Networks’ region. By developing bespoke scenarios, rather than using the National Grid Future Scenarios we are able to more accurately reflect the current UK Power Networks region, the customers within this region and the existing uptake of low carbon technologies. We took a bottom up approach to modelling that aims to understand the types of customers across the network and thereby reflect the regional differences that may arise as part of the transition to a low carbon society. Given the lack of certainty around what policy may be implemented to achieve this decarbonisation, we then developed three different overarching scenario worlds that take the individual scenarios for each key driver and create a holistic view of the future. Two of these are consistent with a net zero energy system by 2050, reflecting the significant uncertainty in key areas such as the decarbonisation of heating, and a third scenario that sees delayed policy action resulting in slower decarbonisation and, therefore, failure to meet the 2050 net zero target. The three scenario worlds are structured as follows:
1. Steady Progression: General progress towards decarbonisation continues; however, the rate of change is not sufficient to meet net zero carbon emissions in 2050;
2. Engaged Society: Meets net zero emission in 2050 with significant engagement at an individual level and a high degree of electrification; and
3. Green Transformation: Meets net zero driven primarily by centralised initiatives and transformation of existing infrastructure, including the production of low carbon hydrogen, requiring less change for individuals.
Whilst many more scenario worlds could be developed, through our consultation with UK Power Networks we determined that these three views of the future are likely to provide a sensible range of possible outcomes for analysing the resultant impact upon the distribution network. In the absence of clear policy direction in sectors such as heating, it’s necessary to reflect the broad range of outcomes that could constitute a net zero compliant system in 2050. Meanwhile, Steady Progression reflects the rate of progress in a world that sees less ambitious policy come forward, particularly in the near term.
At present, we have not modelled a whole scenario world that achieves Net Zero faster than 2050; however, due to the regionally specific aspects of the disaggregation, certain sectors will reach net zero earlier than 2050 in regions that are decarbonising more rapidly. For example, passenger vehicles will fully electrify in areas that have already seen accelerated uptake significantly before 2050. Furthermore, in other sectors, such as heating there remains significant uncertainty around how a 2050 net zero target will be achieved; therefore, at present we did not feel it appropriate to assign a faster rate of decarbonisation at this stage. We will continue to monitor progress in regional decarbonisation plans in future updates of this work and adapt scenarios to reflect those plans as appropriate.
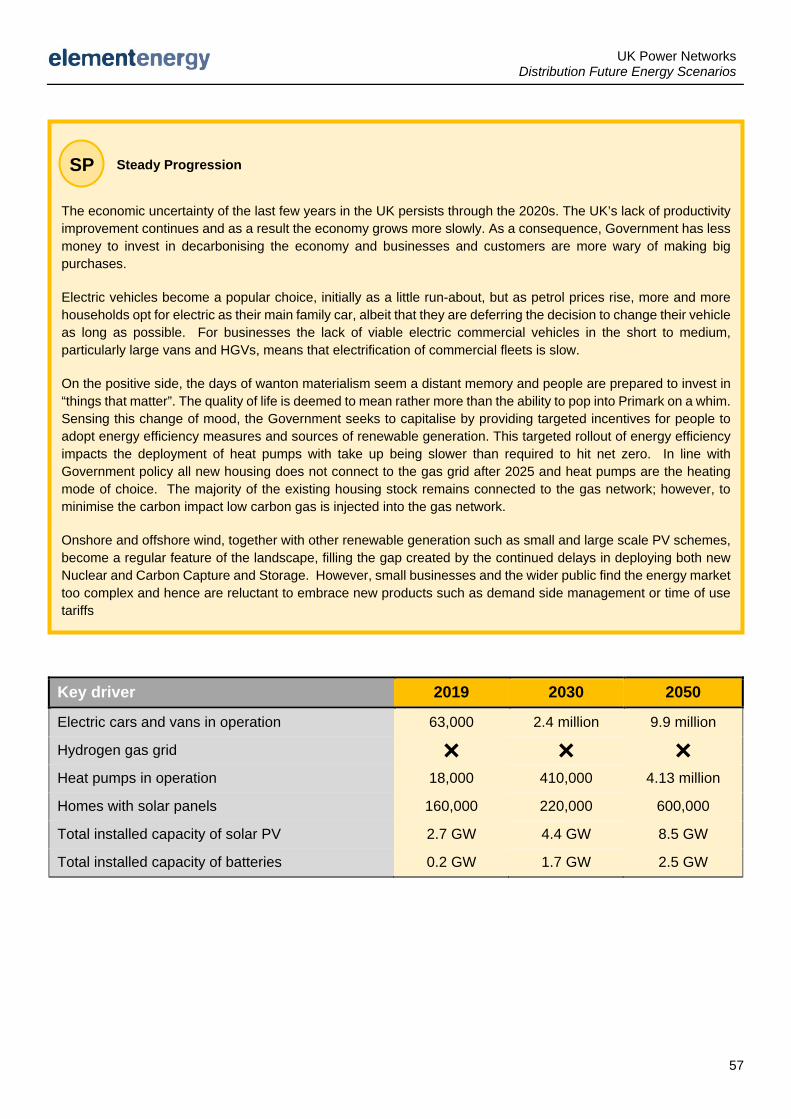
UK Power Networks Distribution Future Energy Scenarios
57
Key driver 2019 2030 2050
Electric cars and vans in operation 63,000 2.4 million 9.9 million
Hydrogen gas grid ✖ ✖ ✖
Heat pumps in operation 18,000 410,000 4.13 million
Homes with solar panels 160,000 220,000 600,000
Total installed capacity of solar PV 2.7 GW 4.4 GW 8.5 GW
Total installed capacity of batteries 0.2 GW 1.7 GW 2.5 GW
Steady Progression
The economic uncertainty of the last few years in the UK persists through the 2020s. The UK’s lack of productivity improvement continues and as a result the economy grows more slowly. As a consequence, Government has less money to invest in decarbonising the economy and businesses and customers are more wary of making big purchases.
Electric vehicles become a popular choice, initially as a little run-about, but as petrol prices rise, more and more households opt for electric as their main family car, albeit that they are deferring the decision to change their vehicle as long as possible. For businesses the lack of viable electric commercial vehicles in the short to medium, particularly large vans and HGVs, means that electrification of commercial fleets is slow.
On the positive side, the days of wanton materialism seem a distant memory and people are prepared to invest in “things that matter”. The quality of life is deemed to mean rather more than the ability to pop into Primark on a whim. Sensing this change of mood, the Government seeks to capitalise by providing targeted incentives for people to adopt energy efficiency measures and sources of renewable generation. This targeted rollout of energy efficiency impacts the deployment of heat pumps with take up being slower than required to hit net zero. In line with Government policy all new housing does not connect to the gas grid after 2025 and heat pumps are the heating mode of choice. The majority of the existing housing stock remains connected to the gas network; however, to minimise the carbon impact low carbon gas is injected into the gas network.
Onshore and offshore wind, together with other renewable generation such as small and large scale PV schemes, become a regular feature of the landscape, filling the gap created by the continued delays in deploying both new Nuclear and Carbon Capture and Storage. However, small businesses and the wider public find the energy market too complex and hence are reluctant to embrace new products such as demand side management or time of use tariffs
SP
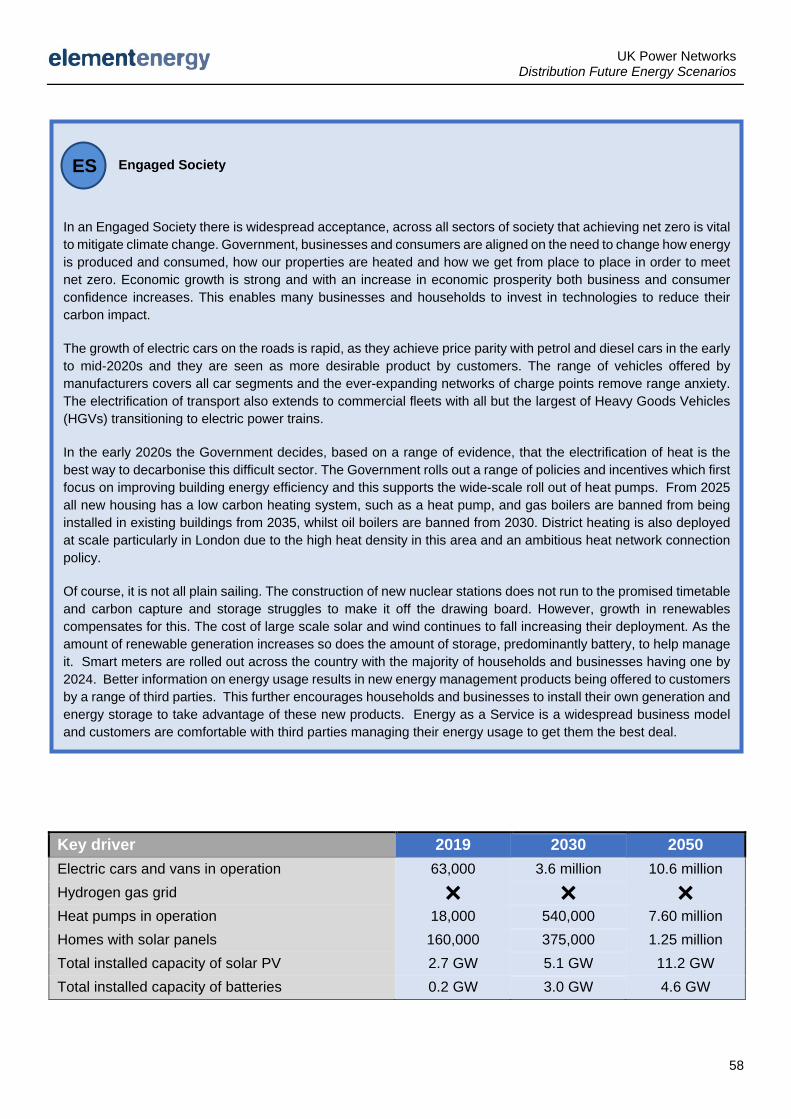
UK Power Networks Distribution Future Energy Scenarios
58
Key driver 2019 2030 2050 Electric cars and vans in operation 63,000 3.6 million 10.6 million Hydrogen gas grid ✖ ✖ ✖
Heat pumps in operation 18,000 540,000 7.60 million Homes with solar panels 160,000 375,000 1.25 million Total installed capacity of solar PV 2.7 GW 5.1 GW 11.2 GW Total installed capacity of batteries 0.2 GW 3.0 GW 4.6 GW
Engaged Society
In an Engaged Society there is widespread acceptance, across all sectors of society that achieving net zero is vital to mitigate climate change. Government, businesses and consumers are aligned on the need to change how energy is produced and consumed, how our properties are heated and how we get from place to place in order to meet net zero. Economic growth is strong and with an increase in economic prosperity both business and consumer confidence increases. This enables many businesses and households to invest in technologies to reduce their carbon impact.
The growth of electric cars on the roads is rapid, as they achieve price parity with petrol and diesel cars in the early to mid-2020s and they are seen as more desirable product by customers. The range of vehicles offered by manufacturers covers all car segments and the ever-expanding networks of charge points remove range anxiety. The electrification of transport also extends to commercial fleets with all but the largest of Heavy Goods Vehicles (HGVs) transitioning to electric power trains.
In the early 2020s the Government decides, based on a range of evidence, that the electrification of heat is the best way to decarbonise this difficult sector. The Government rolls out a range of policies and incentives which first focus on improving building energy efficiency and this supports the wide-scale roll out of heat pumps. From 2025 all new housing has a low carbon heating system, such as a heat pump, and gas boilers are banned from being installed in existing buildings from 2035, whilst oil boilers are banned from 2030. District heating is also deployed at scale particularly in London due to the high heat density in this area and an ambitious heat network connection policy.
Of course, it is not all plain sailing. The construction of new nuclear stations does not run to the promised timetable and carbon capture and storage struggles to make it off the drawing board. However, growth in renewables compensates for this. The cost of large scale solar and wind continues to fall increasing their deployment. As the amount of renewable generation increases so does the amount of storage, predominantly battery, to help manage it. Smart meters are rolled out across the country with the majority of households and businesses having one by 2024. Better information on energy usage results in new energy management products being offered to customers by a range of third parties. This further encourages households and businesses to install their own generation and energy storage to take advantage of these new products. Energy as a Service is a widespread business model and customers are comfortable with third parties managing their energy usage to get them the best deal.
ES
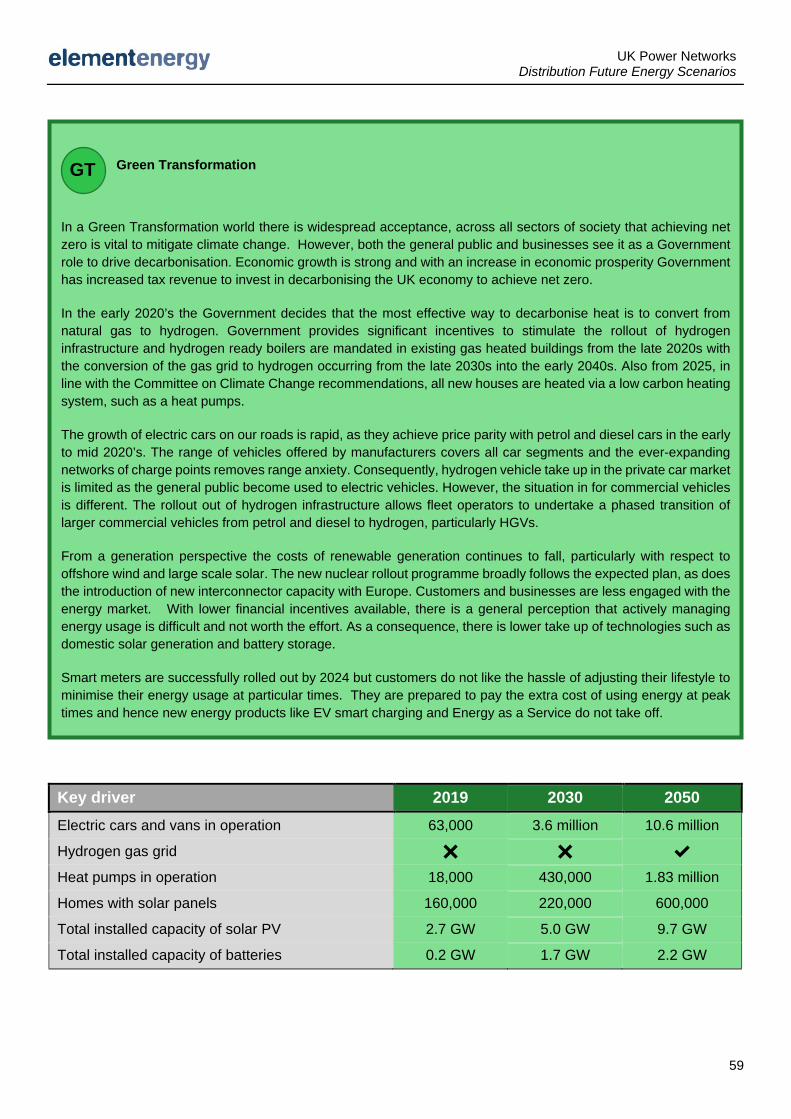
UK Power Networks Distribution Future Energy Scenarios
59
Key driver 2019 2030 2050 Electric cars and vans in operation 63,000 3.6 million 10.6 million
Hydrogen gas grid ✖ ✖ ✔
Heat pumps in operation 18,000 430,000 1.83 million
Homes with solar panels 160,000 220,000 600,000
Total installed capacity of solar PV 2.7 GW 5.0 GW 9.7 GW
Total installed capacity of batteries 0.2 GW 1.7 GW 2.2 GW
Green Transformation
In a Green Transformation world there is widespread acceptance, across all sectors of society that achieving net zero is vital to mitigate climate change. However, both the general public and businesses see it as a Government role to drive decarbonisation. Economic growth is strong and with an increase in economic prosperity Government has increased tax revenue to invest in decarbonising the UK economy to achieve net zero.
In the early 2020’s the Government decides that the most effective way to decarbonise heat is to convert from natural gas to hydrogen. Government provides significant incentives to stimulate the rollout of hydrogen infrastructure and hydrogen ready boilers are mandated in existing gas heated buildings from the late 2020s with the conversion of the gas grid to hydrogen occurring from the late 2030s into the early 2040s. Also from 2025, in line with the Committee on Climate Change recommendations, all new houses are heated via a low carbon heating system, such as a heat pumps.
The growth of electric cars on our roads is rapid, as they achieve price parity with petrol and diesel cars in the early to mid 2020’s. The range of vehicles offered by manufacturers covers all car segments and the ever-expanding networks of charge points removes range anxiety. Consequently, hydrogen vehicle take up in the private car market is limited as the general public become used to electric vehicles. However, the situation in for commercial vehicles is different. The rollout out of hydrogen infrastructure allows fleet operators to undertake a phased transition of larger commercial vehicles from petrol and diesel to hydrogen, particularly HGVs.
From a generation perspective the costs of renewable generation continues to fall, particularly with respect to offshore wind and large scale solar. The new nuclear rollout programme broadly follows the expected plan, as does the introduction of new interconnector capacity with Europe. Customers and businesses are less engaged with the energy market. With lower financial incentives available, there is a general perception that actively managing energy usage is difficult and not worth the effort. As a consequence, there is lower take up of technologies such as domestic solar generation and battery storage.
Smart meters are successfully rolled out by 2024 but customers do not like the hassle of adjusting their lifestyle to minimise their energy usage at particular times. They are prepared to pay the extra cost of using energy at peak times and hence new energy products like EV smart charging and Energy as a Service do not take off.
GT
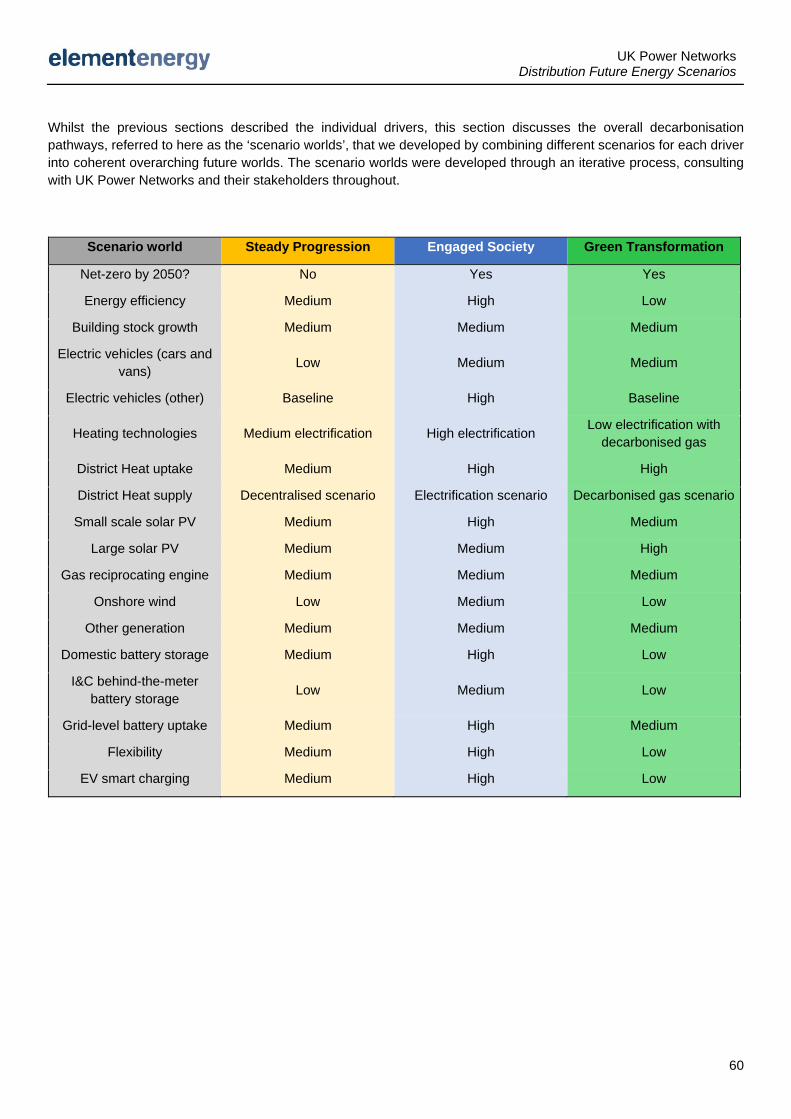
UK Power Networks Distribution Future Energy Scenarios
60
Whilst the previous sections described the individual drivers, this section discusses the overall decarbonisation pathways, referred to here as the ‘scenario worlds’, that we developed by combining different scenarios for each driver into coherent overarching future worlds. The scenario worlds were developed through an iterative process, consulting with UK Power Networks and their stakeholders throughout.
Scenario world Steady Progression Engaged Society Green Transformation
Net-zero by 2050? No Yes Yes
Energy efficiency Medium High Low
Building stock growth Medium Medium Medium
Electric vehicles (cars and vans) Low Medium Medium
Electric vehicles (other) Baseline High Baseline
Heating technologies Medium electrification High electrification Low electrification with decarbonised gas
District Heat uptake Medium High High
District Heat supply Decentralised scenario Electrification scenario Decarbonised gas scenario
Small scale solar PV Medium High Medium
Large solar PV Medium Medium High
Gas reciprocating engine Medium Medium Medium
Onshore wind Low Medium Low
Other generation Medium Medium Medium
Domestic battery storage Medium High Low
I&C behind-the-meter battery storage Low Medium Low
Grid-level battery uptake Medium High Medium
Flexibility Medium High Low
EV smart charging Medium High Low
UK Power Networks Distribution Future Energy Scenarios
61
5 Conclusions and future work In this work we produced scenarios that reflect different possible futures for the ‘key drivers’ of demand and generation within UK Power Networks’ three distribution licence areas. We then developed three proposed visions for the evolution of the energy system over the period to 2050 by combining different uptake scenarios for the individual drivers of the transition into ‘scenario worlds’.
We believe the work constitutes the most comprehensive and rigorously researched view of the range of future outcomes for the uptake of demand and generation technologies in UK Power Networks’ region, given the current uncertainties. We highlight the following key features of the work and the scenarios developed that support this view:
- The work benefitted from an intensive period of stakeholder consultation, ranging from industry-leading market experts to local Government organisations. This stakeholder consultation period means that the assumptions made in the development of the scenarios have been validated by a wide range of individuals and organisations. Market experts gave valuable feedback on the business cases for the each of the technologies and the barriers to deploying technologies on the ground, whilst local Government organisations, being deeply involved in the policy levers necessary to make the transition a reality, gave their views on the how the transition is expected to roll-out in their regions, given the direction of the local and national policy framework;
- The uptake scenarios were developed down to a very high level of spatial resolution. This has improved the accuracy of the work by allowing strong local effects to be accounted for. In addition, the output of this work is in a format that can be aggregated to suit the requirements of all of UK Power Networks’ stakeholders; and
- The scenarios were generated in a flexible manner, allowing for iterative annual updates to be made as certain technologies become more mature, new policy is implemented and current uncertainties are resolved.
Going forward, UK Power Networks will continue to engage with its stakeholders on these themes and the scenarios will be updated accordingly.
More generally, this work will feed into the development of UK Power Networks’ Strategic Forecasting System (SFS), an integrated set of software tools that will enable improved forecasting of load growth on the networks under different scenarios and analysis of what this means for network operation and investment, over RIIO-ED2 and beyond.
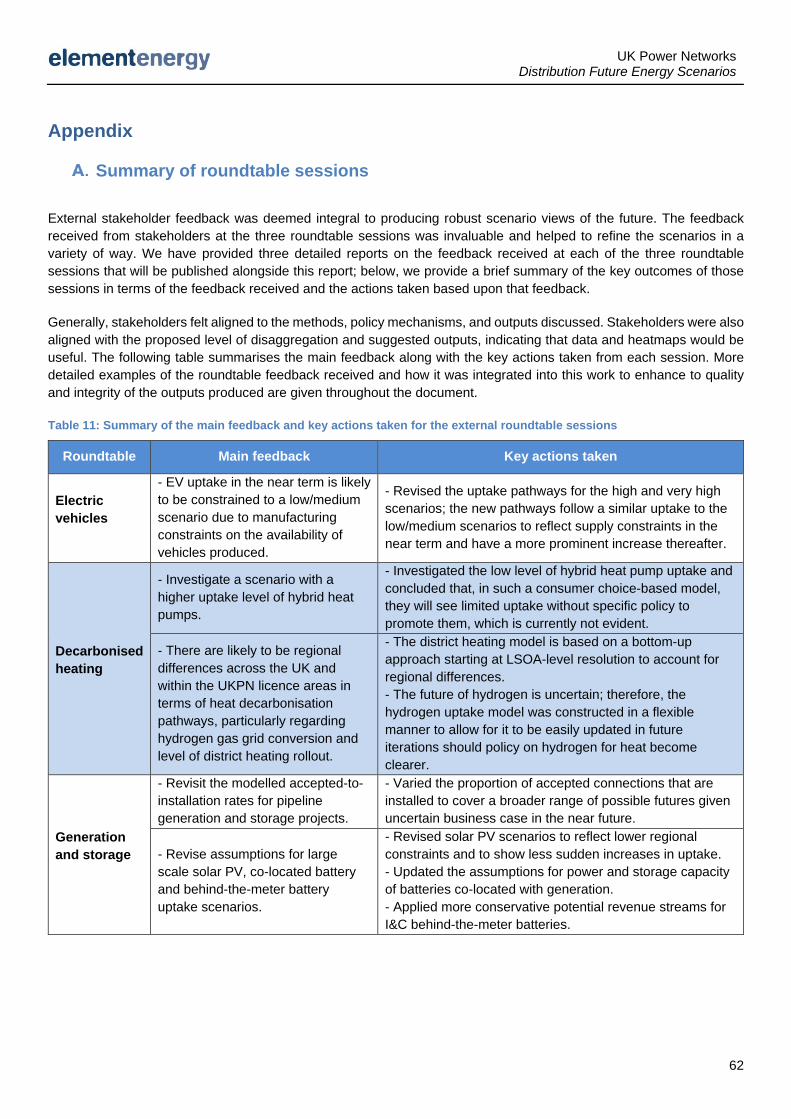
UK Power Networks Distribution Future Energy Scenarios
62
Appendix
Summary of roundtable sessions External stakeholder feedback was deemed integral to producing robust scenario views of the future. The feedback received from stakeholders at the three roundtable sessions was invaluable and helped to refine the scenarios in a variety of way. We have provided three detailed reports on the feedback received at each of the three roundtable sessions that will be published alongside this report; below, we provide a brief summary of the key outcomes of those sessions in terms of the feedback received and the actions taken based upon that feedback.
Generally, stakeholders felt aligned to the methods, policy mechanisms, and outputs discussed. Stakeholders were also aligned with the proposed level of disaggregation and suggested outputs, indicating that data and heatmaps would be useful. The following table summarises the main feedback along with the key actions taken from each session. More detailed examples of the roundtable feedback received and how it was integrated into this work to enhance to quality and integrity of the outputs produced are given throughout the document.
Table 11: Summary of the main feedback and key actions taken for the external roundtable sessions
Roundtable Main feedback Key actions taken
Electric vehicles
- EV uptake in the near term is likely to be constrained to a low/medium scenario due to manufacturing constraints on the availability of vehicles produced.
- Revised the uptake pathways for the high and very high scenarios; the new pathways follow a similar uptake to the low/medium scenarios to reflect supply constraints in the near term and have a more prominent increase thereafter.
Decarbonised heating
- Investigate a scenario with a higher uptake level of hybrid heat pumps.
- Investigated the low level of hybrid heat pump uptake and concluded that, in such a consumer choice-based model, they will see limited uptake without specific policy to promote them, which is currently not evident.
- There are likely to be regional differences across the UK and within the UKPN licence areas in terms of heat decarbonisation pathways, particularly regarding hydrogen gas grid conversion and level of district heating rollout.
- The district heating model is based on a bottom-up approach starting at LSOA-level resolution to account for regional differences. - The future of hydrogen is uncertain; therefore, the hydrogen uptake model was constructed in a flexible manner to allow for it to be easily updated in future iterations should policy on hydrogen for heat become clearer.
Generation and storage
- Revisit the modelled accepted-to-installation rates for pipeline generation and storage projects.
- Varied the proportion of accepted connections that are installed to cover a broader range of possible futures given uncertain business case in the near future.
- Revise assumptions for large scale solar PV, co-located battery and behind-the-meter battery uptake scenarios.
- Revised solar PV scenarios to reflect lower regional constraints and to show less sudden increases in uptake. - Updated the assumptions for power and storage capacity of batteries co-located with generation. - Applied more conservative potential revenue streams for I&C behind-the-meter batteries.
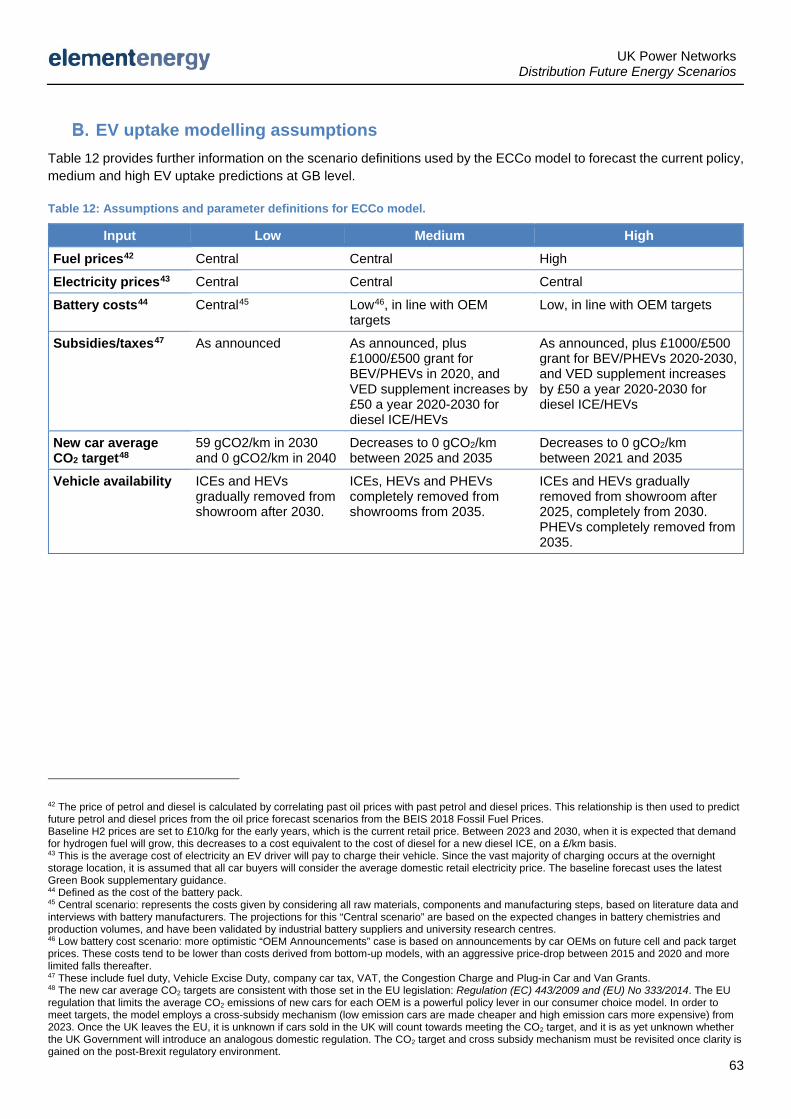
UK Power Networks Distribution Future Energy Scenarios
63
EV uptake modelling assumptions Table 12 provides further information on the scenario definitions used by the ECCo model to forecast the current policy, medium and high EV uptake predictions at GB level.
Table 12: Assumptions and parameter definitions for ECCo model.
Input Low Medium High
Fuel prices42 Central Central High
Electricity prices43 Central Central Central
Battery costs44 Central45 Low46, in line with OEM targets
Low, in line with OEM targets
Subsidies/taxes47 As announced As announced, plus £1000/£500 grant for BEV/PHEVs in 2020, and VED supplement increases by £50 a year 2020-2030 for diesel ICE/HEVs
As announced, plus £1000/£500 grant for BEV/PHEVs 2020-2030, and VED supplement increases by £50 a year 2020-2030 for diesel ICE/HEVs
New car average CO2 target48
59 gCO2/km in 2030 and 0 gCO2/km in 2040
Decreases to 0 gCO2/km between 2025 and 2035
Decreases to 0 gCO2/km between 2021 and 2035
Vehicle availability ICEs and HEVs gradually removed from showroom after 2030.
ICEs, HEVs and PHEVs completely removed from showrooms from 2035.
ICEs and HEVs gradually removed from showroom after 2025, completely from 2030. PHEVs completely removed from 2035.
42 The price of petrol and diesel is calculated by correlating past oil prices with past petrol and diesel prices. This relationship is then used to predict future petrol and diesel prices from the oil price forecast scenarios from the BEIS 2018 Fossil Fuel Prices. Baseline H2 prices are set to £10/kg for the early years, which is the current retail price. Between 2023 and 2030, when it is expected that demand for hydrogen fuel will grow, this decreases to a cost equivalent to the cost of diesel for a new diesel ICE, on a £/km basis. 43 This is the average cost of electricity an EV driver will pay to charge their vehicle. Since the vast majority of charging occurs at the overnight storage location, it is assumed that all car buyers will consider the average domestic retail electricity price. The baseline forecast uses the latest Green Book supplementary guidance. 44 Defined as the cost of the battery pack. 45 Central scenario: represents the costs given by considering all raw materials, components and manufacturing steps, based on literature data and interviews with battery manufacturers. The projections for this “Central scenario” are based on the expected changes in battery chemistries and production volumes, and have been validated by industrial battery suppliers and university research centres. 46 Low battery cost scenario: more optimistic “OEM Announcements” case is based on announcements by car OEMs on future cell and pack target prices. These costs tend to be lower than costs derived from bottom-up models, with an aggressive price-drop between 2015 and 2020 and more limited falls thereafter. 47 These include fuel duty, Vehicle Excise Duty, company car tax, VAT, the Congestion Charge and Plug-in Car and Van Grants. 48 The new car average CO2 targets are consistent with those set in the EU legislation: Regulation (EC) 443/2009 and (EU) No 333/2014. The EU regulation that limits the average CO2 emissions of new cars for each OEM is a powerful policy lever in our consumer choice model. In order to meet targets, the model employs a cross-subsidy mechanism (low emission cars are made cheaper and high emission cars more expensive) from 2023. Once the UK leaves the EU, it is unknown if cars sold in the UK will count towards meeting the CO2 target, and it is as yet unknown whether the UK Government will introduce an analogous domestic regulation. The CO2 target and cross subsidy mechanism must be revisited once clarity is gained on the post-Brexit regulatory environment.
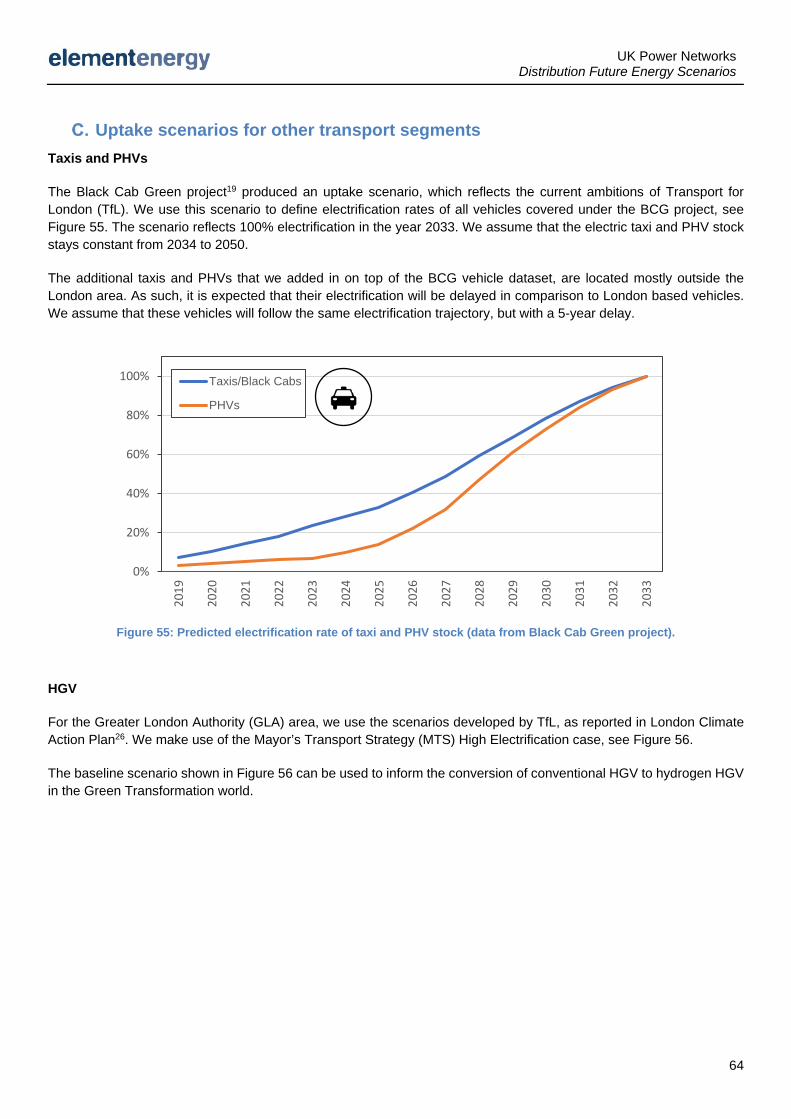
UK Power Networks Distribution Future Energy Scenarios
64
Uptake scenarios for other transport segments Taxis and PHVs
The Black Cab Green project19 produced an uptake scenario, which reflects the current ambitions of Transport for London (TfL). We use this scenario to define electrification rates of all vehicles covered under the BCG project, see Figure 55. The scenario reflects 100% electrification in the year 2033. We assume that the electric taxi and PHV stock stays constant from 2034 to 2050.
The additional taxis and PHVs that we added in on top of the BCG vehicle dataset, are located mostly outside the London area. As such, it is expected that their electrification will be delayed in comparison to London based vehicles. We assume that these vehicles will follow the same electrification trajectory, but with a 5-year delay.
Figure 55: Predicted electrification rate of taxi and PHV stock (data from Black Cab Green project).
HGV
For the Greater London Authority (GLA) area, we use the scenarios developed by TfL, as reported in London Climate Action Plan26. We make use of the Mayor’s Transport Strategy (MTS) High Electrification case, see Figure 56.
The baseline scenario shown in Figure 56 can be used to inform the conversion of conventional HGV to hydrogen HGV in the Green Transformation world.
0%
20%
40%
60%
80%
100%
2019
2020
2021
2022
2023
2024
2025
2026
2027
2028
2029
2030
2031
2032
2033
Taxis/Black Cabs
PHVs
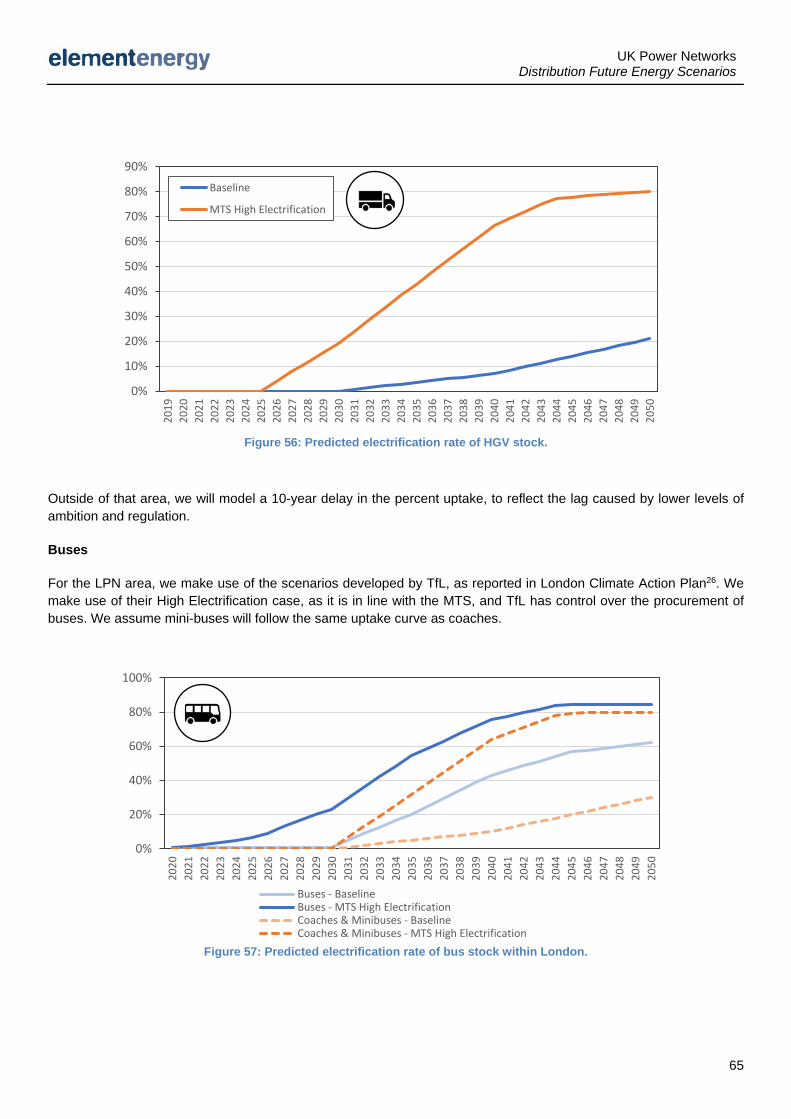
UK Power Networks Distribution Future Energy Scenarios
65
Figure 56: Predicted electrification rate of HGV stock.
Outside of that area, we will model a 10-year delay in the percent uptake, to reflect the lag caused by lower levels of ambition and regulation.
Buses
For the LPN area, we make use of the scenarios developed by TfL, as reported in London Climate Action Plan26. We make use of their High Electrification case, as it is in line with the MTS, and TfL has control over the procurement of buses. We assume mini-buses will follow the same uptake curve as coaches.
Figure 57: Predicted electrification rate of bus stock within London.
0%
10%
20%
30%
40%
50%
60%
70%
80%
90%20
1920
2020
2120
2220
2320
2420
2520
2620
2720
2820
2920
3020
3120
3220
3320
3420
3520
3620
3720
3820
3920
4020
4120
4220
4320
4420
4520
4620
4720
4820
4920
50
Baseline
MTS High Electrification
0%
20%
40%
60%
80%
100%
2020
2021
2022
2023
2024
2025
2026
2027
2028
2029
2030
2031
2032
2033
2034
2035
2036
2037
2038
2039
2040
2041
2042
2043
2044
2045
2046
2047
2048
2049
2050
Buses - BaselineBuses - MTS High ElectrificationCoaches & Minibuses - BaselineCoaches & Minibuses - MTS High Electrification
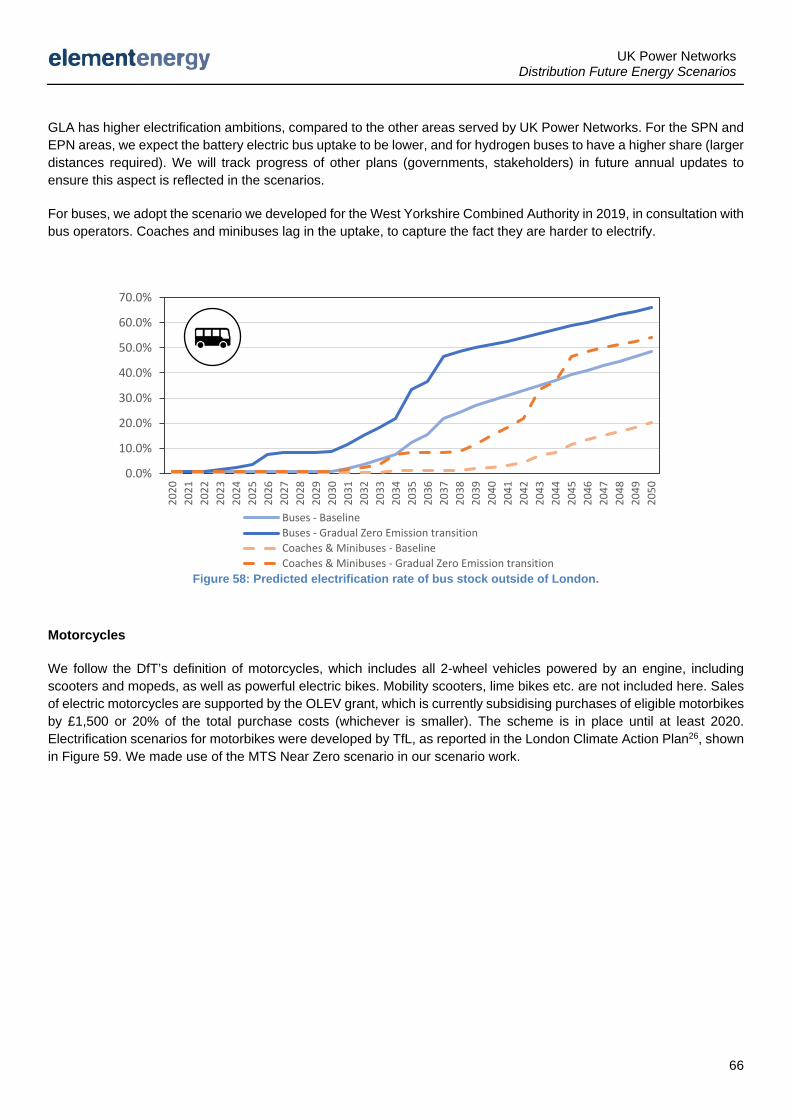
UK Power Networks Distribution Future Energy Scenarios
66
GLA has higher electrification ambitions, compared to the other areas served by UK Power Networks. For the SPN and EPN areas, we expect the battery electric bus uptake to be lower, and for hydrogen buses to have a higher share (larger distances required). We will track progress of other plans (governments, stakeholders) in future annual updates to ensure this aspect is reflected in the scenarios.
For buses, we adopt the scenario we developed for the West Yorkshire Combined Authority in 2019, in consultation with bus operators. Coaches and minibuses lag in the uptake, to capture the fact they are harder to electrify.
Figure 58: Predicted electrification rate of bus stock outside of London.
Motorcycles
We follow the DfT’s definition of motorcycles, which includes all 2-wheel vehicles powered by an engine, including scooters and mopeds, as well as powerful electric bikes. Mobility scooters, lime bikes etc. are not included here. Sales of electric motorcycles are supported by the OLEV grant, which is currently subsidising purchases of eligible motorbikes by £1,500 or 20% of the total purchase costs (whichever is smaller). The scheme is in place until at least 2020. Electrification scenarios for motorbikes were developed by TfL, as reported in the London Climate Action Plan26, shown in Figure 59. We made use of the MTS Near Zero scenario in our scenario work.
0.0%
10.0%
20.0%
30.0%
40.0%
50.0%
60.0%
70.0%
2020
2021
2022
2023
2024
2025
2026
2027
2028
2029
2030
2031
2032
2033
2034
2035
2036
2037
2038
2039
2040
2041
2042
2043
2044
2045
2046
2047
2048
2049
2050
Buses - BaselineBuses - Gradual Zero Emission transitionCoaches & Minibuses - BaselineCoaches & Minibuses - Gradual Zero Emission transition
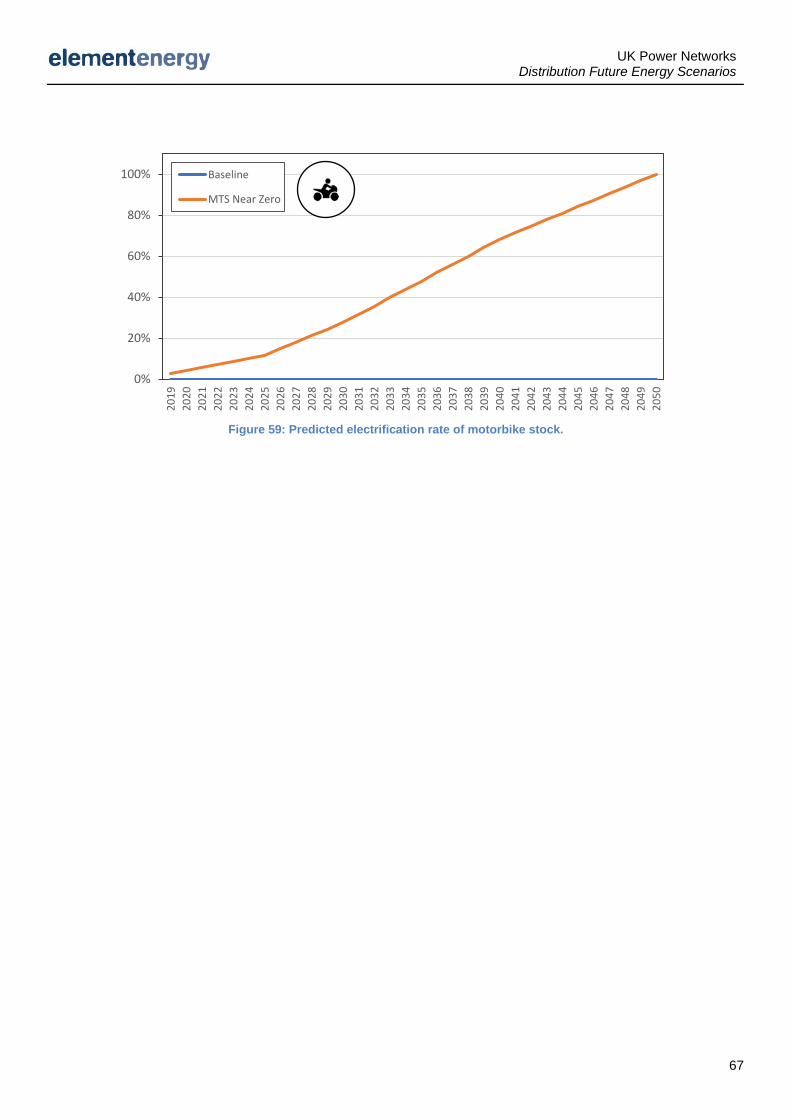
UK Power Networks Distribution Future Energy Scenarios
67
Figure 59: Predicted electrification rate of motorbike stock.
0%
20%
40%
60%
80%
100%20
1920
2020
2120
2220
2320
2420
2520
2620
2720
2820
2920
3020
3120
3220
3320
3420
3520
3620
3720
3820
3920
4020
4120
4220
4320
4420
4520
4620
4720
4820
4920
50
Baseline
MTS Near Zero
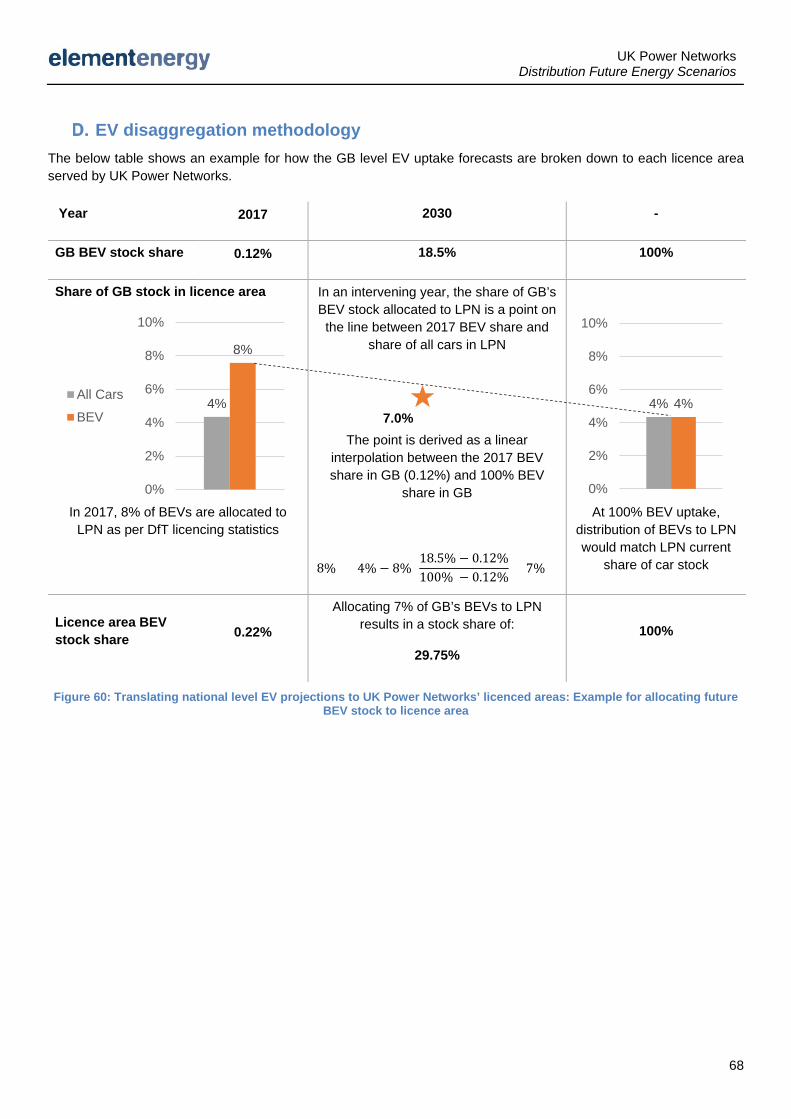
UK Power Networks Distribution Future Energy Scenarios
68
EV disaggregation methodology The below table shows an example for how the GB level EV uptake forecasts are broken down to each licence area served by UK Power Networks.
Year 2017 2030 -
GB BEV stock share 0.12% 18.5% 100%
Share of GB stock in licence area
In 2017, 8% of BEVs are allocated to LPN as per DfT licencing statistics
In an intervening year, the share of GB’s BEV stock allocated to LPN is a point on the line between 2017 BEV share and
share of all cars in LPN
The point is derived as a linear interpolation between the 2017 BEV share in GB (0.12%) and 100% BEV
share in GB
At 100% BEV uptake, distribution of BEVs to LPN would match LPN current
share of car stock
Licence area BEV stock share 0.22%
Allocating 7% of GB’s BEVs to LPN results in a stock share of:
29.75%
100%
Figure 60: Translating national level EV projections to UK Power Networks’ licenced areas: Example for allocating future BEV stock to licence area
4% 4%
0%
2%
4%
6%
8%
10%
4%
8%
0%
2%
4%
6%
8%
10%
All Cars
BEV
8% + (4% − 8%)18.5% − 0.12%100% − 0.12%
= 7%
7.0%
UK Power Networks Distribution Future Energy Scenarios
69
List of figures and tables
Figures
Figure 1: key drivers for demand and generation across the distribution network for which scenarios are required ....... 8
Figure 2: UK Power Networks’ licence areas .................................................................................................................... 8
Figure 3: UK Power Networks' licence areas compared to Government Office Regions ................................................. 9
Figure 4: Example of MSOA and LSOA boundaries in the Dartford, Gravesham and Sevenoaks area. MSOAs are outlined in red, LSOAs in green. Map data from OpenStreetMap, OpenTopoMap. ....................................................... 10
Figure 5: Diagram of the stakeholder engagement performed during development of the Distribution Future Energy Scenarios. ....................................................................................................................................................................... 11
Figure 6: Impact of different drivers of core electricity demand ...................................................................................... 12
Figure 7: Method for producing medium growth scenario for domestic building stock (LA: Local Authority) ................. 13
Figure 8: Domestic household growth scenarios for UK Power Networks’ region. ........................................................ 13
Figure 9: Cumulative number of new builds (since 2019) per LSOA in UK Power Networks’ region in 2030. ............... 14
Figure 10: Method for developing local authority-specific growth scenarios for I&C floorspace .................................... 15
Figure 11: Total Industrial & Commercial floorspace growth in UK Power Networks’ region relative to 2019 ............... 15
Figure 12: Historical I&C floorspace trends by I&C premises type relative to 2005 for UK Power Networks’ region ..... 16
Figure 13: Relative energy demand for all washing machines accounting for increasing ownership and efficiency gains ........................................................................................................................................................................................ 17
Figure 14: Relative energy demand for all fridge/freezers accounting for increasing ownership and efficiency gains .. 17
Figure 15: Electrical energy efficiency rollout scenarios in the “Offices” sector NB: Offices sector only shown but all I&C sub-sectors were modelled separately. .......................................................................................................................... 18
Figure 16: Air conditioning uptake in the domestic building stock within UK Power Networks’ region. .......................... 19
Figure 17: Air conditioning uptake in the I&C stock broken down by floorspace within UK Power Networks’ region. ... 20
Figure 18: Overview of the transport segments. Number of vehicles registered in UK Power Networks’ licence areas (Source: DfT/DVLA). Cars make up the most significant share of the overall transport sector. ..................................... 21
Figure 19: Current EV deployment, shown in percent of total car stock at MSOA level. Source: DVLA/DfT. ................ 22
Figure 20: HGV and bus depot locations by size (number of vehicle licences). 2019, analysis by Element Energy. .... 23
Figure 21: Electric car sales as percent of total car sales. Modelled using the ECCo model at GB level. ..................... 25
Figure 22: EV car parc share – future scenarios at GB level. Element Energy (ECCo) scenarios Low, Medium and High reflect 48, 70 and 100% EV car sales by 2030. For comparison, the chart also displays the 2019 National Grid (NG) Future Energy Scenarios EV uptake forecasts. .............................................................................................................. 25
Figure 23 Bus, coach and minibus stock electrification scenarios. ................................................................................. 27
UK Power Networks Distribution Future Energy Scenarios
70
Figure 24: Summary of HGV, buses, taxi/PHV and motorcycles across UK Power Networks. Figure shows number of electrified vehicles, considering the various uptake scenarios presented above (including any differences modelled inside/outside London). ................................................................................................................................................... 27
Figure 25: Process for establishing EV uptake ............................................................................................................... 28
Figure 26: Future scenarios of EV uptake (number of electric cars), across UK Power Networks’ region. ................... 28
Figure 27: High-level overview of modelled electric vehicles in car stock by segment, in 2030, UK Power Networks licence areas. .................................................................................................................................................................. 30
Figure 28: Heat maps showing number of electric cars by LSOA, in 2030 for the low, medium and high uptake scenarios. ........................................................................................................................................................................................ 31
Figure 29: heat pathway diagram. .................................................................................................................................. 32
Figure 30: Modelled heating technologies. Acronyms: ASHP ATW: air source heat pump – air to water; ASHP ATA: air source heat pump – air to air; GSHP: ground source heat pump; H ASHP: hybrid air source heat pump; Micro CHP: micro combined heat and power unit. ............................................................................................................................. 33
Figure 31: Energy efficiency rollout scenarios in UK Power Networks’ building stock – domestic (left), Offices (right). NB: Offices sector only shown but all I&C sub-sectors were modelled separately – see Appendix. .................................... 35
Figure 32: uptake of heat pumps across the scenarios in the domestic sector (left) and I&C sector (right). This includes ground source, air source and hybrid heat pumps.......................................................................................................... 39
Figure 33: Number and proportion of buildings connected to heat networks in the domestic (left) and I&C (right) sectors. ........................................................................................................................................................................................ 40
Figure 34: proportion of buildings (both domestic and I&C) per LSOA connected to heat networks in 2019 (left), 2030 (middle) and 2050 (right) under the Medium uptake scenario. ....................................................................................... 41
Figure 35: proportion of buildings (both domestic and I&C) per LSOA connected to heat networks in 2030 in the Low, Medium and High uptake scenarios. ............................................................................................................................... 41
Figure 36: Heat supply to heat networks. ....................................................................................................................... 42
Figure 37: Set of modelled distribution-level generation technologies for the UK Power Networks network ................. 43
Figure 38: <150 kW solar PV installations in UK Power Networks’ region (MW) – model calibration (2010-2019) depicting the cumulative historic uptake vs. calibrated model output ............................................................................................ 44
Figure 39: Number of small-scale domestic rooftop solar installations (<4 kW) in UK Power Networks’ region, for a medium growth scenario, reaches ~600,000 by 2050 .................................................................................................... 45
Figure 40: Capacity of small-scale I&C solar installations (4 – 150 kW) in UK Power Networks’ region, for a medium growth scenario, reaches ~1,350 MW by 2050 .............................................................................................................. 45
Figure 41: Capacity of large-scale solar PV installations in UK Power Networks’ region reaches between 4 GW and 7 GW by 2050 .................................................................................................................................................................... 46
Figure 42: Modelled uptake of gas peaker plant capacity (MW) in UK Power Networks’ region ................................... 47
Figure 43: Modelled uptake of onshore wind capacity (MW) in UK Power Networks’ region ......................................... 48
Figure 44: Modelled battery storage use cases and business cases ............................................................................. 49
Figure 45: Proportion of all domestic customer customers who install a battery in UK Power Networks’ region .......... 49
UK Power Networks Distribution Future Energy Scenarios
71
Figure 46: Proportion of all I&C customer customers who install a battery in UK Power Networks’ region ................... 50
Figure 47: Uptake of co-located battery storage capacity in UK Power Networks’ region ............................................. 51
Figure 48: Uptake of grid-scale batteries (MW) in UK Power Networks’ region to 2050 ................................................ 52
Figure 49: Modelled accessible sources of flexibility potentially available to a DNO ..................................................... 52
Figure 50: Domestic time-of-use tariff uptake ................................................................................................................. 53
Figure 51: I&C (small and medium) time-of-use tariff uptake ......................................................................................... 53
Figure 52: Uptake of battery-based DSR (MW) accessible to UK Power Networks ....................................................... 54
Figure 53: Demand reduction-based DSR – domestic and I&C modelling approach and scenario development ......... 54
Figure 54: EV residential charging distribution in 2050 in a low, medium, and high scenario ........................................ 55
Figure 55: Predicted electrification rate of taxi and PHV stock (data from Black Cab Green project). ........................... 64
Figure 56: Predicted electrification rate of HGV stock. ................................................................................................... 65
Figure 57: Predicted electrification rate of bus stock within London. .............................................................................. 65
Figure 58: Predicted electrification rate of bus stock outside of London. ....................................................................... 66
Figure 59: Predicted electrification rate of motorbike stock. ........................................................................................... 67
Figure 60: Translating national level EV projections to UK Power Networks’ licenced areas: Example for allocating future BEV stock to licence area ............................................................................................................................................... 68
Tables Table 1: Scenario worlds for the UK Power Networks DFES ........................................................................................... 3
Table 2: Average dimensions of MSOA and LSOAs across England. ............................................................................ 9
Table 3: Summary of domestic appliance type and efficiency gains by 2050 ................................................................ 17
Table 4: Electrical efficiency scenario definitions based on cost-effectiveness and acceptable payback period .......... 18
Table 5: Illustration electric car uptake projections (low, medium, high) and which targets they meet. ......................... 24
Table 6: Scenario definitions ........................................................................................................................................... 34
Table 7: Scenario overview. ............................................................................................................................................ 35
Table 8: Gas demand density thresholds applied inside and outside the GLA zone. .................................................... 40
Table 9: Summary of sizing brackets and respective classifications .............................................................................. 44
Table 10: Summary of other modelled generation technologies including biomass, municipal solid waste, landfill gas, sewage gas, anaerobic digestion, and diesel ................................................................................................................. 48
Table 11: Summary of the main feedback and key actions taken for the external roundtable sessions ........................ 62
Table 12: Assumptions and parameter definitions for ECCo model. .............................................................................. 63
UK Power Networks Distribution Future Energy Scenarios
72
Version: 1.0 Date: 24/01/2019
Authors Nicolas Jennison, Senior Consultant, Element Energy
Richard Deuchler, Senior Consultant, Element Energy
Madhushan Perera, Consultant, Element Energy
Jake Howe, Principal Consultant, Element Energy, [email protected]
Senior Editor For comments or queries please contact: Colin Nicholl, Head of Business Planning, [email protected]
Reviewers UK Power Networks
Suleman Alli, Director of Safety, Strategy & Support Services
Barry Hatton, Director of Asset Management
Sotiris Georgiopoulos, Head of Smart Grid Development
Nick Carter, Lead Power Quality & Losses Engineer
Jack Lewis Wilkinson, Smart Grid Development Engineer
Element Energy
Ian Walker, Director
Acknowledgements Element Energy and UK Power Networks would like to thank all roundtable attendees for their input on this scenario development work.