
Distribution-Matching Embedding for Visual Domain Adaptation

Abstract Vasconcellea species, often referred to as highland papayas, consist of agroup of fruit species that are closely related to the common papaya (Caricapapaya). The genus deserves special attention as a number of species show potentialas raw material in the tropical fruit industry, fresh or in processed products, or asgenetic resources in papaya breeding programs. Some species show a very restricted
X. Scheldeman (&) Æ L. Willemen Æ G. Coppens d’Eeckenbrugge Æ M. T. Restrepo ÆD. Jimenez Æ J. A. OcampoInternational Plant Genetic Resources Institute (IPGRI), Regional Office for the Americas,Apartado Aereo 6713, Cali, Colombiae-mail: [email protected]
E. Romeijn-Peeters Æ P. GoetgebeurDepartment of Biology, Faculty of Sciences, Ghent University, K.L. Ledeganckstraat 35,B-9000 Ghent, Belgium
J. Romero MotocheNaturaleza & Cultura Internacional, Pıo Jaramillo y Venezuela, Loja, Ecuador
M. Lobo Æ C. I. MedinaCORPOICA, Centro de Investigacion ‘‘La Selva’’, A.A. 470, Rionegro, Antioquia, Colombia
C. ReyesUniversidad Nacional de Colombia, Sede Medellın, Medellın, Colombia
D. RodrıguezCentro Nacional de Conservacion de los Recursos Geneticos, Oficina Nacional de DiversidadBiologica, Ministerio del Ambiente, El Limon, Apartado Postal 4661, Maracay, Venezuela
P. Van DammeLaboratory of Subtropical and Tropical Agriculture and Ethnobotany, Department Plantprotection, Faculty of Agricultural and Applied Biological Sciences, Ghent University,Coupure links 653, B-9000 Ghent, Belgium
G. Coppens d’Eeckenbrugge Æ M. T. Restrepo Æ J. A. OcampoCIRAD/FLHOR, UPR ‘Gestion des ressources genetiques et dynamiques sociales’, CampusCNRS/Cefe, 1919 route de Mende, 34 293 Montpellier, France
123
Biodivers Conserv (2007) 16:1867–1884DOI 10.1007/s10531-006-9086-x
ORI GI N A L P A PE R
Distribution, diversity and environmental adaptationof highland papayas (Vasconcellea spp.) in tropicaland subtropical America
X. Scheldeman Æ L. Willemen Æ G. Coppens d’EeckenbruggeE. Romeijn-Peeters Æ M. T. Restrepo Æ J. Romero MotocheD. Jimenez Æ M. Lobo Æ C. I. Medina Æ C. ReyesD. Rodrıguez Æ J. A. Ocampo Æ P. Van Damme ÆP. Goetgebeur
Received: 24 October 2005 / Accepted: 5 July 2006 / Published online: 27 October 2006� Springer Science+Business Media B.V. 2006
brought to you by COREView metadata, citation and similar papers at core.ac.uk
provided by Wageningen University & Research Publications

distribution and are included in the IUCN Red List. This study on Vasconcelleadistribution and diversity compiled collection data from five Vasconcellea projectsand retrieved data from 62 herbaria, resulting in a total of 1,553 georeferencedcollection sites, in 16 countries, including all 21 currently known Vasconcellea spe-cies. Spatial analysis of species richness clearly shows that Ecuador, Colombia andPeru are areas of high Vasconcellea diversity. Combination of species occurrencedata with climatic data delimitates the potential distribution of each species andallows the modeling of potential richness at continent level. Based on these modeledrichness maps, Ecuador appears to be the country with the highest potential Vas-concellea diversity. Despite differences in sampling densities, its neighboring coun-tries, Peru and Colombia, possess high modeled species richness as well. Acombination of observed richness maps and modeled potential richness maps makesit possible to identify important collection gaps. A Principal Component Analysis(PCA) of climate data at the collection sites allows us to define climatic preferencesand adaptability of the different Vasconcellea species and to compare them withthose of the common papaya.
Keywords Americas Æ Biodiversity mapping Æ Caricaceae Æ Climatic modeling ÆGIS Æ Plant genetic resources Æ Richness Æ Tropical fruits
Introduction
Nowadays, less than 5% of all edible fruit species native to tropical areas are cul-tivated and marketed on a commercial basis (Wijeratnam 2000). Five species alone,banana, mango, pineapple, avocado and papaya, account for over 90% of fruitexports. As their demand is even expected to increase by 8% in the period2000–2010 (FAO 2003) and as in recent years there has been a growing trend toidentify and develop new crops for export and domestic markets (Padulosi et al.1999), it is clear that a rise in demand for new tropical fruit species can be antici-pated. A common constraint in answering this potential demand is a lack ofknowledge on the nature and potential of many of these fruit species. The latterproblem can be addressed by assessing existing diversity of new species and ana-lyzing their climatic requirements. One of the promising tropical fruit families arethe Caricaceae.
Caricaceae is a small family of six genera and 35 species, most of which originatedin the Americas. The only non-American genus is Cylicomorpha, with two WestAfrican tree species. Horovitzia is a monotypic genus of hairy herbaceous plants thatoccur around Oaxaca, Mexico. The genus Jarilla has three herbaceous species insouthern Mexico and Guatemala. Jacaratia has seven tree species that are widelyspread in tropical climates. Carica is monotypic and includes the economically mostimportant representative of the family, the common papaya (Carica papaya L.)(Badillo 1971, 1993, 2000, 2001). This species, which gives a large, bland, juicy fruit,is extensively cultivated throughout the tropics. Indeed, with a total annual worldproduction of more than 6.5 Mt, covering nearly 400,000 ha (FAOSTAT 2005)the common papaya is considered the fourth most important tropical fruit crop.Vasconcellea was established as a genus by Saint Hilaire in 1837 and later treated asa section within the genus Carica. Recently it has been restored as a genus by Badillo(2000), and the genusVasconcellea is now the largest within the family, holding 21
123
1868 Biodivers Conserv (2007) 16:1867–1884

species. The present study focuses on this relatively unknown genus, Vasconcellea,using papaya as a reference for climate studies.
Vasconcellea species are often collectively called ‘highland papayas’ or ‘mountainpapayas’ (National Research Council 1989) because many of them occur at higheraltitudes. Compared to their better-known lowland cousin, Carica papaya, highlandpapaya fruits are generally smaller and have distinct texture, taste and aroma. In theAndes, they are consumed fresh, roasted, processed in juices, marmalades, preservesor dairy products or even prepared in sauces, pie fillings and pickles (National -Research Council 1989; CAF 1992; Van den Eynden et al. 1999, 2003). Most Vas-concellea fruits and processed products are consumed at household level or, lessfrequently, sold on local markets. Only the largest mountain papaya, the babaco(V. · heilbornii), has been commercially developed, albeit on a small scale, outside ofits region of origin. It was introduced as a crop in New Zealand in 1973 (Endt 1981;Harman 1983) from where it spread during the eighties to Australia (Cossio 1988),Italy (Cossio and Bassi 1987; Ferrara et al. 1993), Spain (Merino Merino 1989),France (CTIFL 1992), South Africa (Wiid 1994) and even Switzerland (Evequoz1990, 1994), Canada (Kempler and Kabaluk 1996) and the Netherlands (Heij 1989)where greenhouse trials have been done. Vasconcellea cundinamarcensis is marketedlocally in Ecuador, Colombia and Peru and has been successfully introduced innorthern Chile (National Research Council 1989) where it has gained some localimportance and from where some preserves are exported to Europe and the US.Other Vasconcellea species such as V. candicans, V. crassipetala, V. goudotiana,V. microcarpa, V. monoica, V. palandensis, V. parviflora, V. quercifolia, V. sphaero-carpa and V. stipulata are consumed locally (Badillo 1993, Van den Eynden et al.1999; Scheldeman 2002). In addition to their existing use, highland papayas showpotential (1) as a source of papain (Baeza et al. 1990; Dhuique Mayer et al. 2001;Scheldeman et al. 2002), a proteolytic enzyme complex used in pharmaceutical andfood industries; and (2) as genetic resources for improvement of the common papaya.Vasconcellea carry resistance genes, particularly for the most severe and widespreaddisease, the papaya ringspot virus (Manshardt and Wenslaff 1989a, b; Magdalita et al.1997; Drew et al. 1998), cold tolerance and organoleptic characteristics (Manshardtand Wenslaff 1989b). Improvement breeding is, however, hampered because inter-specific gene flow between Carica papaya and Vasconcellea species faces considerablepostzygotic barriers (Mekako and Nakasone 1975; Drew et al. 1998).
Five of the 21 described Vasconcellea species (V. horovitziana, V. omnilingua,V. palandensis, V. pulchra, V. sprucei) are included in the IUCN Red List ofThreatened Species (IUCN 2004a) and require special monitoring attention for theirconservation. A better knowledge of these threatened species could therefore con-tribute to their conservation. For example, V. palandensis, was, despite its localimportance (Van den Eynden et al. 1999), only described as new to science in 2000by Badillo et al. (2000). Agricultural extension and intensification causes geneticerosion in all Vasconcellea species, including the cultivated and tolerated forms.Their distribution has been declining with a concomitant loss of traditional knowl-edge (Scheldeman 2002). A detailed study on their distribution, diversity andenvironmental adaptability will undoubtedly generate valuable information forfuture conservation actions.
Indeed, in spite of its importance, Vasconcellea crop ecology and distribution havebeen little studied. The present study is looking for general answers to these ques-tions based on spatial information. Spatial analyses based on georeferenced
123
Biodivers Conserv (2007) 16:1867–1884 1869

herbarium or collecting data, often in combination with environmental spatialinformation, have previously generated valuable information in diversity studies(Skov 2000; Guarino et al. 2002; Vargas et al. 2004; Rodrıguez et al. 2005). Suchstudies allow a clearer understanding of distribution of specific taxa and definition ofareas of high diversity (Hijmans and Spooner 2001), on evolutionary origin (Jarviset al. 2002), on defining sampling strategies and collection gaps (Jones et al. 1997;Greene et al. 1999a, b), on sampling biases (Reddy and Davalos 2003), on climaticadaptation (Berger et al. 2003), and on prioritization and definition of conservationareas (Kress et al. 1998; Funk et al. 1999; Bystriakova et al., 2003; Jarvis et al. 2003).
The main objectives of the presented study were: (1) to summarize the distribu-tion of all 21 Vasconcellea species using collection data as well as herbarium spec-imen data; (2) to identify areas of high diversity and (3) collection gaps; and (4) todescribe climatic and altitude preferences for Vasconcellea species.
Materials and methods
Data collection
Biogeographic data were obtained from collecting trips organized in the frameworkof five research projects (see Acknowledgements), complemented by herbariumrecords extracted from label data provided by the following herbaria: A, AAU,AMD, ASU, AWH, B, BIGU, BM, BR, BRIT, CAY, CAUP, CHAPA, CLEMS,COL, CONC, CPUN, CR, CSAT, CTES, CUVC, DAV, DS, F, FAUC, GB, GENT,HUA, HNMN, HULE, HUMO, HUT, JAUM, JEPS, JVR, K, LP, LZ, M, MAD,MEDEL, MFA, MPU, MO, MU, MY, NY, P, PSO, QCA, QPLS, S, SEL, SSUC,TEFH, U, ULM, ULS, UPS, USCG, USJ, VALLE, VT (acronyms based on IndexHerbariorum, Holmgren et al. 1990). Species collected were identified using thetaxonomic keys developed by Badillo (1993) applying the nomenclature as revisedby the same author (Badillo 2000, 2001).
All data points were entered into the Geographic Information System DIVA-GIS4.1 (Hijmans et al. 2001, 2003), chosen to carry out spatial analysis. Georeferenceddata were checked for inconsistencies. Data points without coordinates were as-signed coordinates where possible while duplicate or doubtful data were removed.To define the altitude for each collection point, elevation data provided withcollection site information were used where possible. In other cases, altitude wasextracted from the 2.5 · 2.5¢ (approximately 4.5 · 4.5 km at the equator) Worldclimdata available at the DIVA-GIS website (http://www.diva-gis.org/).
Diversity and distribution
The measurement of diversity and distribution of Vasconcellea species was ad-dressed in several ways. Firstly, the number of observations was tabulated perspecies and per country. Secondly, the area of occupancy (AOO), defined by IUCN(IUCN 2001, 2004b) as the total area occupied by a specific taxon, was selected as anindicator of abundance or rarity of a particular species. IUCN recommends the useof a 2 · 2 km (4 km2) grid to define this parameter (IUCN 2004b). Thus, AOO wascalculated by superposing a 2 · 2 km grid (based on a Lambert Equal Area
123
1870 Biodivers Conserv (2007) 16:1867–1884
Azimuthal projection with central meridian 0 and reference latitude – 80) over thestudy area, followed by determining the number of grid cells occupied by eachspecies (using the DIVA-GIS histogram tool) and by converting these to an effectivearea by multiplying the number of occupied cells by 4 km2. Thirdly, the extent of thedistribution area for each species was also estimated by determining the averagedistance between all possible pairs of collection points of each species. Finally,observed species richness was mapped using the point-to-grid richness analysis toolin DIVA-GIS, using a 1 · 1� grid (corresponding to 111 · 111 km at the equator).The circular neighborhood option, with a 2� diameter (Hijmans and Spooner 2001),was applied to eliminate border effects due to the assignation of the grid origin.
Modeled richness and collecting gaps
Potential area of distribution of each species was modeled based on climatic pref-erences using the Bioclim model (Nix 1986; Busby 1991) in DIVA-GIS, using a10 · 10¢ Worldclim climate data set. In the Bioclim model, a site is consideredsuitable for a particular species if its climate data fall within the range prevalent atthe sites where the species occurs (Hijmans et al. 2003). In this study, all 19 availableclimatic parameters were used (see Table 3). For each climatic parameter, the lowerand upper 2.5 percentile of the total range were excluded from the suitability rangeto avoid the influence of extreme values. In order to prevent modeling outside thenatural distribution area, a buffer zone with a radius of 3� (Jarvis et al. 2003) aroundall collection sites of each species was applied to limit the modeled richness. Thisclimatic modeling resulted in 21 modeled distribution maps, one per Vasconcelleaspecies. The sum of these 21 maps resulted in a map that indicates modeled potentialspecies richness at a 10 · 10¢ grid. Subtracting modeled species richness with theobserved richness allowed detection of possible collection gaps.
Climatic requirements and adaptability
For each collection site, values for the 19 climatic parameters were extracted fromthe 2.5 · 2.5¢ Worldclim data set and species collection points within the same gridcell were removed. Principal component analysis (PCA) was carried out on all 19climatic parameters, applying a varimax normalized rotation, with the Statistica�package. To promote visibility, the centroid, i.e., the arithmetic average of the factorscores for each species, was used to represent each species’ general climatic pref-erences. Standard deviation of factor scores was used to represent variation aroundthe centroid to give an indication of the adaptability of each species for each climaticprincipal component. The well-known Carica papaya served as a reference in theVasconcellea climate study.
Results and discussion
Diversity and distribution
The total dataset included 1,702 records representing all 21 Vasconcellea species(1,553) and Carica papaya (149). Table 1 presents a synthesis for the differentspecies and countries of collection. Vasconcellea cauliflora, V. cundinamarcensis,
123
Biodivers Conserv (2007) 16:1867–1884 1871

Tab
le1
Lis
to
fa
llk
no
wn
Va
sco
nce
llea
an
dC
ari
casp
ecie
san
dth
eco
un
trie
sw
here
they
were
coll
ect
ed
Sp
eci
es
(Re
dli
stC
at.
**
)C
ou
ntr
y*(w
ith
resp
ect
ive
nu
mb
er
of
coll
ect
ion
s)T
ota
ln
um
be
ro
fco
lle
ctio
ns
AO
O(k
m2)
Av
era
ge
Dis
tan
ce(k
m)
V.
cun
din
am
arc
ensi
sC
ol(
16
3),
Ecu
(75
),V
en(1
4),
Pe
r(5
),B
ol(
4),
Pa
n(3
),C
hl(
1),
Cri
(1)
26
68
56
70
5
V.
mic
roca
rpa
Ecu
(11
0),
Pe
r(4
6),
Co
l(3
5),
Ve
n(1
4),
Bra
(12)
,B
ol(
3),
Cri
(1),
Pa
n(1
),2
22
79
28
72
V.
stip
ula
taE
cu(1
80
)1
80
42
45
0V
.·
hei
lbo
rnii
Ecu
(16
4),
Pe
r(4
)1
68
42
01
16
C.
pa
pa
ya
Co
l(49),
Nic
(37)
,E
cu(1
8),
Bo
l(8),
Blz
(6),
Cri
(6),
Pe
r(4
),V
en
(4),
Pa
n(3
),D
ma
(2),
Gu
f(2
),M
ex
(2),
Pry
(2),
Slv
(2),
Bra
(1),
Do
m(1
),H
nd
(1),
Pri
(1)
14
96
00
1,5
84
V.
qu
erci
foli
aA
rg(7
8),
Bo
l(1
9),
Bra
(17
),P
ry(1
1),
Pe
r(1
)1
26
46
48
42
V.
cau
lifl
ora
Co
l(5
4),
Cri
(25
),V
en(1
1),
Nic
(8),
Pa
n(7
),G
tm(5
),M
ex
(5),
Hn
d(4
),S
lv(4
)1
23
45
69
85
V.
go
ud
oti
an
aC
ol(
10
8),
Ecu
(7)
Ve
n(1
)1
16
37
23
18
V.
pa
rvifl
ora
Ecu
(63
),P
er(
18
)8
12
88
24
1V
.ch
ilen
sis
Ch
l(6
2)
62
24
41
47
V.
gla
nd
ulo
saB
ol(
17
),A
rg(1
7),
Pe
r(1
2),
Bra
(1)
47
16
81
,03
9V
.m
on
oic
aE
cu(1
7),
Bo
l(6
),P
er(
3),
Co
l(2
)2
81
00
86
3V
.cr
ass
ipet
ala
Co
l(2
1),
Ecu
(3)
24
68
28
6V
.ca
nd
ica
ns
Ecu
(13
),P
er(
9)
22
72
61
8V
.p
ulc
hra
(Nt)
Ecu
(18
),C
ol(
1)
19
68
82
V.
sph
aer
oca
rpa
Co
l(1
8)
18
68
31
8V
.lo
ng
iflo
raE
cu(8
),C
ol(
4)
12
44
23
1V
.w
eber
ba
uer
iE
cu(1
1),
Pe
r(1
)1
23
61
02
V.
ho
rov
itz
ian
a(E
n)
Ecu
(8)
83
22
22
V.
spru
cei
(Nt)
Ecu
(8)
83
21
09
V.
pa
lan
den
sis
(Vu
)E
cu(6
)6
87
V.
om
nil
ing
ua
(En
)E
cu(5
)5
20
23
*C
ou
ntr
yC
od
es:
Arg
:A
rge
nti
na
;B
ra:
Bra
zil;
Blz
:B
eli
ze;
Bo
l:B
oli
via
;C
hl:
Ch
ile
;C
ol:
Co
lom
bia
;C
ri:
Co
sta
Ric
a;
Dm
a:
Do
min
ica
;D
om
:D
om
inic
an
Rep
ub
lic;
Ecu
:E
cua
do
r;G
tm:
Gu
ate
ma
la;
Gu
f:F
ren
chG
uya
na
;H
nd
:H
on
du
ras;
Me
x:
Me
xic
o;
Nic
:N
ica
rag
ua
;P
an
:P
an
am
a;P
er:
Pe
ru;
Pri
:P
ue
rto
Ric
o;
Pry
:P
ara
gu
ay
;S
lv:
El
Sa
lvad
or;
Ve
n:
Ve
nez
ue
la
**
Re
dL
ist
Ca
teg
ori
es:
En
:e
nd
an
ge
red
;V
u:
vu
lne
rab
le;
Nt:
Ne
ar
thre
ate
ned
123
1872 Biodivers Conserv (2007) 16:1867–1884
V. goudotiana, V. microcarpa, V. quercifolia,V. stipulata and V. · heilbornii, are thespecies that were most commonly collected as evidenced by number of specimens aswell as number of countries, while the Red List species V. horovitziana, V. omni-lingua, V. palandensis, V. pulchra and V. sprucei together with V. longiflora, mostlyfrom Ecuador, are the least collected and should therefore be regarded as rare. TheAOO confirms this sharp contrast in distribution extent between these two groups ofcommon and rare species. Vasconcellea cundinamarcensis is the species withthe widest distribution, covering mountainous zones from Costa Rica to Chile.Vasconcellea microcarpa has a similar AOO with an area ranging from Colombia toBrazil and Bolivia. Vasconcellea quercifolia is widespread in the south of the con-tinent whereas V. cauliflora has an ample distribution in the northern part, rangingfrom Mexico southwards to Colombia and Venezuela. All species mentioned in theIUCN Red List show both a limited AOO and short distances between collectionsites, confirming their status. The analyses presented indicate that both V. longifloraand V. weberbaueri are very rare species as well, and their possible inclusion in theRed List should be considered, after a more detailed analysis. Vasconcelleapalandensis, which has the lowest values for both AOO and average distance, shouldbe regarded as the rarest species in the genus.
Figure 1 gives a more detailed view of the geographic distribution of eachVasconcellea species. Ecuador, where 16 of the 21 Vasconcellea species havebeen recorded, is without any doubt the country with the highest richness forVasconcellea, with its neighbor countries Colombia and Peru coming in secondplace with nine species. In all other countries, five or less species have beencollected. The Andes of northwestern South America clearly constitute the centerof diversity of Vasconcellea (Fig. 2). Ecuador has the highest diversity, andsouthern Ecuador (provinces El Oro, Loja and Zamora-Chinchipe) aloneaccounts for 12 of the 21 species, whereas southern Colombia (Narino Depart-ment), where all nine Colombian species have been recorded, is another areawith high Vasconcellea diversity.
Despite the size of the dataset, the study faces some methodological difficulties toprecisely assess the extent of the distribution area and the rarity of a species,particularly when using a large, continent scale. The use of average distance betweencollection sites does not give a good indication of local abundance while the AOOdoes not constitute a direct indicator of abundance either. Considering that thedataset reflects the distribution at continent level, the combination of both indicatorsallows obtaining a better insight in the abundance of highland papayas in tropicalAmerica. Some species, e.g., V. stipulata and V. · heilbornii, show a rather wideAOO but a small average distance between collection points. They are very commonin their area of origin (Loja Province, Ecuador; Badillo, 1993), but are rarely foundoutside this restricted area. Opposed to this, V. monoica and V. candicans show asmall AOO but have a large distance between collection points, which indicates thatthey are never very abundant where they occur. The latter situation can howeveralso be caused by undercollection of a species, highlighting the importance of acomplete trustworthy dataset in this type of analysis. In fact, only cautious (anditerative) field verification of potential distribution maps, allows one to distinguishrarity from incomplete collecting. Despite these possible methodological short-comings, our spatial analyses provide useful indications on the rarity of Vasconcelleaspecies.
123
Biodivers Conserv (2007) 16:1867–1884 1873

Fig. 1 Collection sites of the 21 Vasconcellea species within tropical America
123
1874 Biodivers Conserv (2007) 16:1867–1884

Modeled richness and collection gaps
The sum of the modeled potential distribution maps of the 21 Vasconcellea speciesresulted in a map indicating the modeled species richness in tropical America(Fig. 3). This map, which is based on the species climatic preferences, gives a slightlydifferent view on Vasconcellea diversity. The Andean region of northern Ecuadorand southern Colombia are now identified as those areas that posses the mostfavorable climate for Vasconcellea diversity and that therefore have the highestpotential richness. Comparing, at country level, the observed richness with themodeled richness (Table 2), Ecuador, with a potential of 18 species, is confirmed asthe most important center of Vasconcellea diversity. Its neighboring countries, Peruand Colombia are obviously also countries where a relatively high number of speciesoccur, confirming the importance of the northern Andes for Vasconcellea diversity.
The sampled species richness map (Fig. 2), based on collection data, can becompared to the modeled potential species richness map (Fig. 3) to identify col-lection gaps. Figure 4 shows the areas where the discrepancy between observed andmodeled richness is highest for Vasconcellea. The most important collection gaps arelocated in Colombia, where the higher parts of the departments of Narino, Putu-mayo, Cauca, Valle de Cauca, Huila, Tolima, Caqueta and Meta should be given toppriority for future collecting. Less important, but still significant, gaps are located in
Fig. 2 Observed Vasconcellea species richness in Latin America on a 1 · 1� grid using 1,553Vasconcellea observations. The darker areas indicate the highest richness (maximum value: 12species per grid cell)
123
Biodivers Conserv (2007) 16:1867–1884 1875

eastern Venezuela (Zulia, Portuguesa, Trujillo, Barinas), in northeastern Colombia(Cundinamarca, Boyaca, Santander, Norte de Santander, Cesar and Bolivar), innorthern Ecuador (Imbabura, Pichincha and Esmeraldas), in Central Peru (Caja-marca, San Martin, Amazonas, Huanuco, Pasco, Junın, Ucayali) and in eastern
Fig. 3 Modeled Vasconcellea species richness in Latin America on a 1 · 1� grid using the sum of themodeled distribution maps of the 21 Vasconcellea species. The darker areas indicate the highestpotential richness (maximum value: 11 species)
Table 2 SampledVasconcellea species richnessversus modeled speciesrichness in key countries
Country Sampled speciesrichness
Modeled speciesrichness
Ecuador 16 18Colombia 9 12Peru 9 12Bolivia 5 5Venezuela 4 5Brazil 3 3Costa Rica 3 3Panama 3 5Argentina 2 2Chile 2 1Guatemala 1 1Mexico 1 1Paraguay 1 2Nicaragua 1 2Uruguay 0 2
123
1876 Biodivers Conserv (2007) 16:1867–1884

Bolivia (La Paz). These are all highly suitable zones where only a limited number ofVasconcellea species have been collected so far. Figure 4 also shows that Ecuador,the country with the highest diversity, generally appears well-sampled as fewundercollected areas could be identified.
Diversity studies often face the risk of a bias related to uneven collection inten-sity, particularly oversampling in areas of high species richness and in easily acces-sible areas (Hijmans et al. 2000; Reddy et al. 2003). This is illustrated clearly in acomparison between Ecuador and Colombia, both located in the center of highlandpapaya diversity. From the observed richness map (Fig. 2) Ecuador is identified asthe country with the highest species number. It is also a country where environ-mental and political conditions make it easy to sample, as proven by the numerousherbaria records. Colombia on the other hand, has less observed diversity, but themodeled richness (Fig. 3) shows that, especially in the southern part, species richnessis equal or higher than in Ecuador. These areas are often difficult to access due tosecurity problems. Extrapolation of species ranges using environmental data, asshown in Fig. 3, is generally acknowledged to counter the sampling bias (Jarvis et al.2003; Sommer et al. 2003). One could therefore wonder whether the fact thatEcuador is considered more diverse in highland papayas than Colombia could bepartly due to a different sampling intensity.
Fig. 4 Vasconcellea collection gaps in northwestern South America based on an overlay of thesampled richness map and the modeled richness map (on a 1 · 1� grid). The darker areas indicatethose zones were a high Vasconcellea richness is likely to occur, but where up to this moment no oronly a limited number of specimens have been collected
123
Biodivers Conserv (2007) 16:1867–1884 1877
Climatic requirements and adaptability
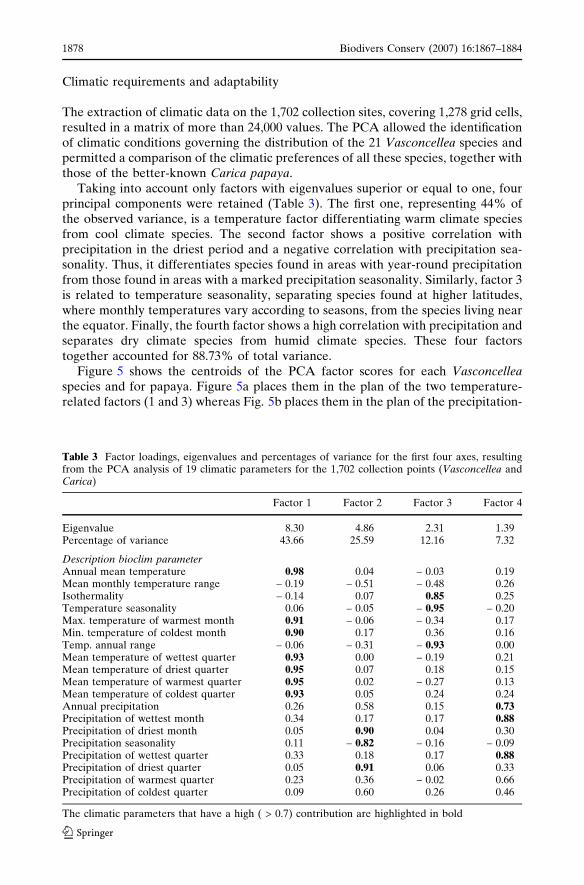
The extraction of climatic data on the 1,702 collection sites, covering 1,278 grid cells,resulted in a matrix of more than 24,000 values. The PCA allowed the identificationof climatic conditions governing the distribution of the 21 Vasconcellea species andpermitted a comparison of the climatic preferences of all these species, together withthose of the better-known Carica papaya.
Taking into account only factors with eigenvalues superior or equal to one, fourprincipal components were retained (Table 3). The first one, representing 44% ofthe observed variance, is a temperature factor differentiating warm climate speciesfrom cool climate species. The second factor shows a positive correlation withprecipitation in the driest period and a negative correlation with precipitation sea-sonality. Thus, it differentiates species found in areas with year-round precipitationfrom those found in areas with a marked precipitation seasonality. Similarly, factor 3is related to temperature seasonality, separating species found at higher latitudes,where monthly temperatures vary according to seasons, from the species living nearthe equator. Finally, the fourth factor shows a high correlation with precipitation andseparates dry climate species from humid climate species. These four factorstogether accounted for 88.73% of total variance.
Figure 5 shows the centroids of the PCA factor scores for each Vasconcelleaspecies and for papaya. Figure 5a places them in the plan of the two temperature-related factors (1 and 3) whereas Fig. 5b places them in the plan of the precipitation-
Table 3 Factor loadings, eigenvalues and percentages of variance for the first four axes, resultingfrom the PCA analysis of 19 climatic parameters for the 1,702 collection points (Vasconcellea andCarica)
Factor 1 Factor 2 Factor 3 Factor 4
Eigenvalue 8.30 4.86 2.31 1.39Percentage of variance 43.66 25.59 12.16 7.32
Description bioclim parameterAnnual mean temperature 0.98 0.04 – 0.03 0.19Mean monthly temperature range – 0.19 – 0.51 – 0.48 0.26Isothermality – 0.14 0.07 0.85 0.25Temperature seasonality 0.06 – 0.05 – 0.95 – 0.20Max. temperature of warmest month 0.91 – 0.06 – 0.34 0.17Min. temperature of coldest month 0.90 0.17 0.36 0.16Temp. annual range – 0.06 – 0.31 – 0.93 0.00Mean temperature of wettest quarter 0.93 0.00 – 0.19 0.21Mean temperature of driest quarter 0.95 0.07 0.18 0.15Mean temperature of warmest quarter 0.95 0.02 – 0.27 0.13Mean temperature of coldest quarter 0.93 0.05 0.24 0.24Annual precipitation 0.26 0.58 0.15 0.73Precipitation of wettest month 0.34 0.17 0.17 0.88Precipitation of driest month 0.05 0.90 0.04 0.30Precipitation seasonality 0.11 – 0.82 – 0.16 – 0.09Precipitation of wettest quarter 0.33 0.18 0.17 0.88Precipitation of driest quarter 0.05 0.91 0.06 0.33Precipitation of warmest quarter 0.23 0.36 – 0.02 0.66Precipitation of coldest quarter 0.09 0.60 0.26 0.46
The climatic parameters that have a high ( > 0.7) contribution are highlighted in bold
123
1878 Biodivers Conserv (2007) 16:1867–1884

related factors (2 and 4). As expected, factor 1 allows a clear distinction betweentypical lowland species, C. papaya, V. parviflora, V. cauliflora and V. microcarpa, andhighland species as V. cundinamarcensis, V. · heilbornii and V. weberbaueri,whereas factor 3 allows to distinguish the three species found at higher latitudes,
Fig. 5 Distribution of the species centroids for the first four PCA axes, for 1,702 Vasconcellea andCarica collection sites in Latin America and 19 climatic parameters. a: temperature-related axes(1 and 3). b: precipitation-related axes (2 and 4)
123
Biodivers Conserv (2007) 16:1867–1884 1879

i.e., V. quercifolia, V. glandulosa and V. chilensis, from the majority of species mostcommonly found around the equator. In Fig. 5b, factor 4 clearly separates V. chil-ensis, a species with adaptation to a marked dry season whereas factor 2 ranksspecies according to their general humidity requirements. Thus, species such asV. candicans, V. parviflora and V. stipulata, from drier regions like southern Ecuadorand northern Peru, are logically placed on the left side of the plan, while speciesadapted to the humid Amazon region, such as V. monoica V. microcarpa, andV. sprucei appear grouped on the right side, together with species of thehumid forests of the Colombian Andes, such as V. crassipetala, V. goudotiana andV. sphaerocarpa.
Table 4 gives the standard deviation around the centroids for each species, andfor each of the four main axes. Very low deviations for V. chilensis reflect its narrowgeographic distribution, probably in relation with very strict climatic adaptations,whereas large values for V. microcarpa reveal a very wide adaptability, especially forprecipitation. Comparing the deviations for the four factor scores across species, thestandard deviation of Factor 3 generally shows the lowest value, reflecting theessentially tropical distribution of Vasconcellea. Indeed, only the three species dis-tributed well beyond the equator up to subtropical latitudes, show a high (V. glan-dulosa and V. quercifolia) or relatively high (V. chilensis) adaptability fortemperature seasonality.
Of all the species studied, Carica papaya is the one that is found in the warmestzones, with a mean annual temperature of 24.2�C, with little seasonal temperaturevariations. From a precipitation perspective it nearly falls in the center of the pre-cipitation plan (Fig. 5b) indicating that is occurs at average precipitations (annual
Table 4 Climatic adaptability indicated by the standard deviation of the mean factor scores for eachspecies
Species Factor 1 Factor 2 Factor 3 Factor 4
V. candicans 1.01 0.54 0.59 1.22V. cauliflora 0.67 0.86 0.55 1.41V. chilensis 0.28 0.10 0.39 0.39V. crassipetala 1.00 0.80 0.16 0.46V. cundinamarcensis 0.73 0.56 0.37 0.76V. glandulosa 0.94 0.58 1.11 0.58V. goudotiana 0.86 0.50 0.21 0.70V. horovitziana 1.24 0.98 0.21 1.82V. longiflora 0.68 0.97 0.22 0.68V. microcarpa 0.90 1.28 0.41 1.05V. monoica 0.82 1.32 0.54 0.41V. omnilingua 0.64 0.28 0.11 0.22V. palandensis 0.53 0.16 0.10 0.08V. parviflora 0.73 0.39 0.42 0.87V. pulchra 0.96 0.41 0.21 0.93V. quercifolia 0.82 1.08 0.79 0.58V. sphaerocarpa 1.07 0.50 0.24 0.64V. sprucei 0.97 0.84 0.21 0.74V. stipulata 0.45 0.56 0.21 0.58V. weberbaueri 0.75 0.33 0.49 0.55V. · heilbornii 0.48 0.66 0.27 0.62C. papaya 0.71 0.86 0.68 0.81
123
1880 Biodivers Conserv (2007) 16:1867–1884

precipitation 1,830 mm) in areas without extreme precipitation seasonality. Thesevalues correspond very well with values given in literature, i.e., 24.5�C and 1,920 mmfor mean annual temperature and annual precipitation respectively (Duke 1983).Compared to Vasconcellea species, Carica papaya shows a more constant standarddeviation among the four factors (Table 4), which is in general very close to theoverall average (0.64) of the four axes for all species, indicating a similar and averageadaptability for both temperature and precipitation. Most Vasconcellea species showa low standard variation for one of the four factors, which indicates a more limitedadaptability for a specific climatic environment.
Altitude
Figure 6 presents an analysis of the relation between elevation and species richness.An average of 14 species can be found at altitudes up to 2,500 m. Above this ele-vation, species richness gradually decreases, as shown by the second order regression.
The Vasconcellea richness map (Fig. 2) illustrates a clear relation betweenVasconcellea diversity and the Andes. Even lowland species are mostly confined tothe Andean foothills. Vasconcellea cauliflora, also found in Central America,V. quercifolia, also present in southern Brazil, southern Paraguay and northernArgentina and V. microcarpa, also collected in the Brazilian Amazon, are onlypartial exceptions to this link between Vasconcellea species and the Andes. Thus,even though several Vasconcellea species can be found at sea level, the use ofthe term ‘‘highland papayas’’ or ‘‘mountain papayas’’ as a collective term forVasconcellea species appears justified.
Fig. 6 Relation between altitude and number of observed Vasconcellea species using 1,553Vasconcellea observations in Latin America. The solid line represents a second order regression
123
Biodivers Conserv (2007) 16:1867–1884 1881

Conclusions
This study, based on the most complete Vasconcellea collection data set compiled sofar, provides an overview of distribution, diversity and climatic preferences of 21Vasconcellea species. It is therefore an important addition to the monographs onCaricaceae by Badillo (Badillo 1971, 1993). Despite their wide distribution intropical America, ranging from Mexico down to Argentina and Chile, the majorityof the Vasconcellea species are confined to the northern Andean region (Colombia,Ecuador and Peru). This is also reflected in their temperature preferences, generallycooler climates with limited seasonality, as prevalent in the equatorial Andes.
Although some highland papaya species are commonly grown in backyard gar-dens to be consumed and/or marketed locally, other species such as V. horovitziana,V. omnilingua, V. palandensis, V. pulchra and V. sprucei are only found in the wildwithin a very limited distribution range, and are included in the IUCN Red List.Results of the analysis of the distribution results suggest that two more Vasconcelleaspecies, V. longiflora and V. weberbaueri, should be considered for inclusion in theRed List as well.
This study shows that by combining georeferenced species collection data to-gether with available detailed climate data, the use of GIS can add significant valueand knowledge to the existing information sources. This study is also a clear illus-tration of the importance of trustworthy collection data and its sharing, which mightallow a better understanding of many other potential neglected and underutilizedspecies to enhance their conservation and use.
Acknowledgements The authors wish to thank the herbaria that provided specimens or collectiondata. Besides herbarium data, new collection contributed significantly to this study. In Ecuador, theproject ‘Conocimientos y Practicas Culturales sobre los Recursos Fitogeneticos Nativos en el AustroEcuatoriano’ (1996–2000) was funded by the Belgian Development Cooperation (DGDC) throughthe Flemish Interuniversitary Council (VlIR) while the project ‘Taxonomy of wild and semido-mesticated Vasconcellea species (Caricaceae) in Ecuador’ (2000–2003) was made possible throughfunds from the Flemish Fund for Scientific Research (FWO). The project ‘‘Conservacion ex situ yobtencion de parametros para el manejo agrotecnico y micropropagacion de los generos Carica yRubus en la region sur del Ecuador’’ (2001–2003) included also germplasm collecting and was fundedby the Ecuadorean Programa de Modernizacion de los Servicios Agropecuarios (PROMSA).Included collection sites in Ecuador, Colombia and Venezuela were obtained from the project‘Aprovechamiento de los Recursos Geneticos de las Papayas para su Mejoramiento y Promocion’(1999–2003), funded by the Regional Fund for Agricultural technology (FONTAGRO) while theColombian Ministry for Environment and the Research Center of the Colombian Coffee GrowerFederation provided additional funds for collecting in Colombia through the project ‘Estudio de laDiversidad de las Passifloraceae y Caricaceae en la Zona Cafetera’ (2003–2004). The authors expresstheir gratitude to the donors of these projects.
References
Badillo VM (1971) Monografıa de la familia Caricaceae. Universidad Central de Venezuela,Maracay
Badillo VM (1993) Caricaceae. Segundo esquema. Revista de la Facultad de Agronomıa de laUniversidad Central de Venezuela, Alcance 43, Maracay
Badillo VM (2000) Carica L. vs. Vasconcella St.-Hil. (Caricaceae) con la rehabilitacion de esteultimo. Ernstia 10(2):74–79
Badillo VM (2001) Nota correctiva Vasconcellea St. Hill. y no Vasconcella (Caricaceae). Ernstia11(1):75–76
Badillo VM, Van den Eynden V, Van Damme P (2000) Carica palandesis (Caricaceae), a newspecies from Ecuador. Novon 10:4–6
123
1882 Biodivers Conserv (2007) 16:1867–1884

Baeza G, Correa D, Salas C (1990) Proteolytic enzymes in Carica candamarcensis. J Sci Food Agric51:1–9
Berger J, Abbo J, Turner NC (2003) Ecogeography of annual wild Cicer species: the poor state of theworld collection. Crop Sci 43:1076–1090
Busby JR (1991) BIOCLIM: a bioclimate analysis and prediction system. Plant Prot Quart 6:8–9Bystriakova N, Kapos V, Lysenko I, Stapleton CMA (2003) Distribution and conservation status of
forest in the Asia-Pacific Region. Biod Conserv 12(9):1833–1841CAF (1992) Manual tecnico del cultivo de chamburo. Centro Agrıcola de Quito, Corporacion
Andino de Fomento, QuitoCossio F, Bassi G (1987) Babaco, dopo il boom tiriamo le somme. Terra e Vita (Cagliari) 7:88- 93Cossio F (1988) Il Babaco. Edizioni Calderini Edagricole, BolognaCTIFL (1992) Nuevas especies frutales. Ediciones Mundi-Prensa, MadridDhuique Mayer C, Caro Y, Pina M, Ruales J, Dornier M, Graille J (2001). Biocatalytic properties of
lipase in crude latex from babaco fruit (Carica pentagona). Biotechnol Lett 23(13):1021–1024Drew RA, O’Brien CM, Magdalita PM (1998) Development of Carica interspecific hybrids. Acta
Hortic 461:285–291Duke JA (1983) Carica papaya L. In: Handbook of energy crops. Unpublished. Available via Center
for New Crops and Plants Products, Purdue University. Department of Horticulture andLandscape Architecture, West Lafayette. http://www.hort.purdue.edu/newcrop/duke_energy/Carica_papaya.html. Cited 30 Aug 2005
Endt DW (1981) The babaco: a new fruit in New Zealand to reach commercial production.Orchardist New Zeal 54(2):58–59
Evequoz N (1990) Premiers resultats d’un essai de culture de babaco. Revue Suisse de Viticulture,d’Arboriculture et d’Horticulture 22(2):137–141
Evequoz N (1994) Culture en serre de babaco (Carica pentagona), Resultats d’un essai de 4 ans(2e partie). Revue Suisse de Viticulture, d’Arboriculture et d’Horticulture 26(5):323–325
FAO (2003) Medium-term prospects for Agricultural Commodities. Projections to the Year 2010.FAO Commodities and Trade Technical Paper 1. Food and Agriculture Organization of theUnited Nations, Rome
FAOSTAT (2005) Statistical databases of the Food and Agriculture Organization of the UnitedNations. http://www.apps.fao.org. Cited 30 Aug 2005
Ferrara E, Barone F, Calabrese F, D’Ascanio R, De Michele A, Giorgio V, Martelli S, Monastra F,Nieddu G (1993) Babaco (Carica pentagona Heilb.). L’Informatore Agrario (Verona)XLIX(1):41–46
Funk VA, Zermoglio MF and Nasir N (1999) Testing the use of specimen collection data and GIS inbiodiversity exploration and conservation decision making in Guyana. Biod Conserv 8:727–751
Guarino L, Jarvis A, Hijmans RJ, Maxted N (2002) Geographic Information Systems (GIS) and theconservation and use of plant genetic resources. In: Engels JMM, Ramantha Rao V, BrownAHD, Jackson MT (eds) Managing plant genetic diversity. CABI publishing, Wallingford,pp 387–404
Greene SL, Hart TC and Afonin A (1999a) Using geographic information to acquire wild cropgermplasm for ex situ collections: I. Map development and field use. Crop Sci 39:836–842
Greene SL, Hart TC Afonin A (1999b) Using geographic information to acquire wild crop germ-plasm for ex situ collections: II. Post collection analysis. Crop Sci 39:843–849
Harman JE (1983) Preliminary studies on the postharvest physiology and storage of babaco fruit(C. · heilbornii Badillo nm. pentagona (Heilborn) Badillo). New Zeal J Agric Res 26:237–243
Heij G (1989) Exotic glasshouse vegetable crops: Dutch experiences. Acta Hortic 242:269–276Hijmans RJ, Garrett KA, Huaman Z, Zhang DP, Schreuder M, Bonierbale M (2000) Assessing the
geographic representativeness of genebank collections: the case of Bolivian wild potatoes.Conserv Biol 14(6):1755–1765
Hijmans RJ, Guarino L, Cruz M, Rojas E (2001) Computer tools for spatial analysis of plant geneticresources data: 1. DIVA-GIS. Plant Genet Res Newslett 127:15–19
Hijmans RJ, Guarino L, Bussink C, Mathur P, Cruz M, Barrentes I, Rojas E (2003) DIVA-GIS. Ageographic information system for the analysis of species distribution data. Manual, version 4.0.http://www.diva-gis.org. Cited 30 Aug 2005
Hijmans RJ, Spooner DM (2001) Geography of wild potato species. Am J Bot 88:2101–2112Holmgren PK, Holmgren NH, Barnett LC (1990) Index herbariorum. Part I: the herbaria of the
world, 8th edn. New York Botanical Garden, New YorkIUCN (2001) IUCN Red List categories and criteria: version 3.1. IUCN Species Survival Commis-
sion, IUCN, Gland and Cambridge
123
Biodivers Conserv (2007) 16:1867–1884 1883
IUCN (2004a) 2004 IUCN Red List of threatened species. http://www.redlist.org. Cited 30 Aug 2005IUCN (2004b) Guidelines for using the IUCN Red List categories and criteria. Standards and
petitions Subcommittee of the IUCN SSC Red List Programme Committee. IUCN, GlandandCambridge
Jarvis A, Ferguson ME, Williams DE, Guarino L, Jones PG, Stalker HT, Valls JFM, Pittman RN,Simpson CE, Bramel P (2003) Biogeography of wild Arachis: assessing conservation status andsetting future priorities. Crop Sci 43(3):1100–1108
Jarvis A, Guarino L, Williams DE, Williams K, Vargas I, Hyman G (2002). Spatial analysis of wildpeanut distributions and the implications for plant genetic resources conservation. Plant GenetRes Newslett 131: 29–35
Jones PG, Beebe SE, Tohme J, Galwey NW (1997) The use of geographical information systems inbiodiversity exploration and conservation. Biod Conserv 6:947–958
Kempler C, Kabaluk T (1996) Babaco (Carica pentagona Heilb.): a possible crop for the greenhouse.Hortscience 31(5):785–788
Kress WJ, Heyer P, Acevedo P, Coddington J, Cole D, Erwin TL, Meggers BJ, Pogue M, ThoringtonRW, Vari RP, Weitzman MJ, Weitzman SH (1998) Amazonian biodiversity: assessing conser-vation priorities with taxonomic data. Biod Conserv 7:1577–1587
Magdalita PM, Drew RA, Adkins SW, Godwin ID (1997) Morphological, molecular and cytologicalanalysis of Carica papaya · C. cauliflora interspecific hybrids. Theor Appl Genet 95:224–229
Manshardt RM, Wenslaff TF (1989a) Zygotic polyembryony in interspecific hybrids of Caricapapaya and C. cauliflora. J Am Soc Hortic Sci 114(4):684–689
Manshardt RM, Wenslaff TF (1989b) Interspecific hybridisation of papaya with other Carica species.J Am Soc Hortic Sci 114(4):689–694
Mekako HU, Nakasone HY (1975) Interspecific hybridisation among 6 Carica species. J Am SocHortic Sci 100(3):237–242
Merino Merino D (1989) El cultivo del babaco. Ediciones Mundi-Prensa, MadridNational Research Council (1989) Lost crops of the Incas: little-known plants of the Andes with
promise for worldwide cultivation. National Academy Press, WashingtonNix HA (1986) A biogeographic analysis of Australian elapid snakes. In: Longmore R (ed) Atlas of
Elapid Snakes of Australia, Australian Flora and Fauna Series No. 7, Australian GovernmentPublishing Service, Canberra, Australia, pp 4–15
Padulosi S, Eyzaquirre P, Hodgkin T (1999) Challenges and strategies in promoting conservation anduse of neglected and underutilized crop species. In: Janick J (ed), Perspectives on new crops andnew uses, ASHS Press, Alexandria, USA, pp 140–145
Reddy S, Davalos LM (2003) Geographical sampling bias and its implications for conservationpriorities in Africa. J Biogeogr 30(11):1719–1727
Rodrıguez D, Marın C, Quecan H, Ortiz R (2005) Areas potenciales para colectas del generoVasconcellea Badillo en Venezuela. Bioagro 17(1):3–10
Scheldeman X (2002) Distribution and potential of cherimoya (Annona cherimola Mill.) and high-land papayas (Vasconcellea spp.) in Ecuador. PhD Dissertation, Ghent University
Scheldeman X, Van Damme P, Romero Motoche J (2002) Highland papayas in southern Ecuador:need for conservation actions. Acta Hortic 575(1):199–205
Sommer JH, Nowicki C, Rios L, Barthlott W, Ibisch PL (2003) Extrapolating species ranges andbiodiversity in data-poor countries: The computerized model BIOM. Revista de la SociedadBoliviana de Botanica 4(1):171–190
Skov F (2000) Potential plant distribution mapping based on climatic similarity. Taxon 49:503–515Van den Eynden V, Cueva E and Cabrera O (1999) Plantas silvestres comestibles del sur del
Ecuador—Wild edible plants of southern Ecuador. Ediciones Abya-Yala, QuitoVan den Eynden V, Cueva E, Cabrera O (2003) Wild foods from Ecuador. Econ Bot 57(4):576–603Vargas JH, Consiglio T, Jørgensen PM, Croat TB (2004) Modelling distribution patterns in a species-
rich plant genus, Anthurium (Araceae), in Ecuador. Divers Distrib 10(3):211–216Wiid M (1994) Aanpasbaarheid van babako in subtropiese gebiede. Instituut vir Tropiese en Sub-
tropiese Gewasse Inligtingbulletin 15(12):17–19Wijeratnam RSW (2000) Identification of problems in processing of underutilized fruits of the
tropics and their solutions. Acta Hortic 518:237–240
123
1884 Biodivers Conserv (2007) 16:1867–1884


